Carbon Cycle Game
Carbon Cycle Game
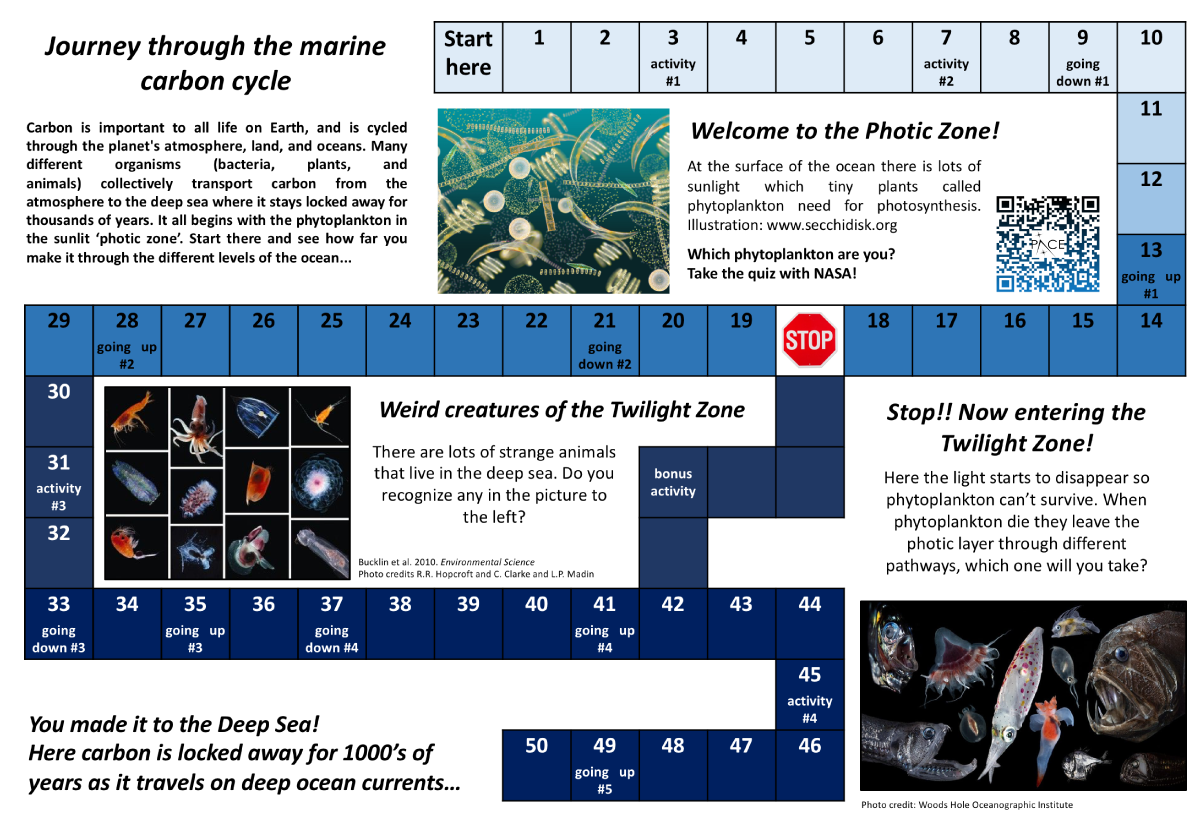
This game allows players to travel along the marine carbon cycle and learn about the ocean. All you need to play are dice, the printed board (with the rules!) and something to use as a counter for each player. It is best played with 2-6 people and is suitable for all ages 5+.
Some of the activities are discussion-based as this was designed to be done in person with the creator (email James Fox at Oregon State University with any questions). However, there are many resources available online that will provide you with all the information you need to learn about the important processes, plants and animals included in the game.
Which Phytoplankton Are You?
Answer four questions to discover which of these diverse organisms is most like you!
20 Years of Global Biosphere
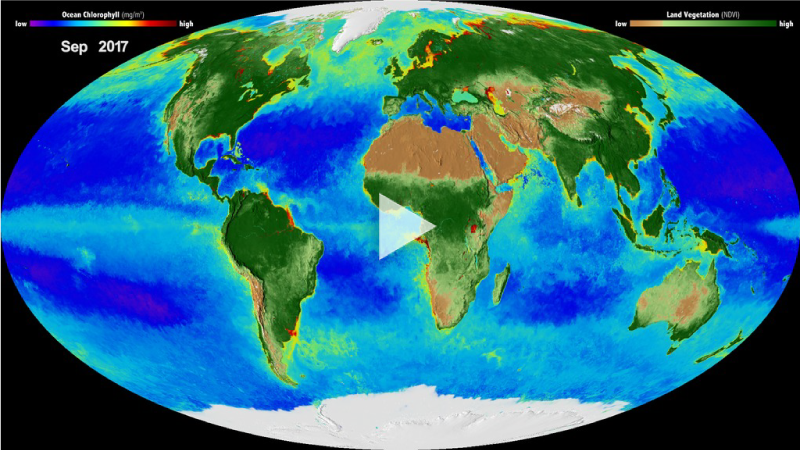
By monitoring the color of reflected light via satellite, scientists can determine how successfully plant life is photosynthesizing. A measurement of photosynthesis is essentially a measurement of successful growth, and growth means successful use of ambient carbon.
The data visualization in Figure 1 shows twenty years' worth of data taken primarily by SeaStar/SeaWiFS, Aqua/MODIS, and Suomi NPP/VIIRS satellite sensors, showing the abundance of life both on land and in the sea. In the ocean, dark blue to violet represents warmer areas where there is little life due to lack of nutrients, and greens and reds represent cooler nutrient-rich areas. The nutrient-rich areas include coastal regions where cold water rises from the sea floor bringing nutrients along and areas at the mouths of rivers where the rivers have brought nutrients into the ocean from the land. On land, green represents areas of abundant plant life, such as forests and grasslands, while tan and white represent areas where plant life is sparse or non-existent, such as the deserts in Africa and the Middle East and snow-cover and ice at the poles.
View the same data on a rotating globe at NASA SVS.