Slideshow Gallery
Slideshows (12)
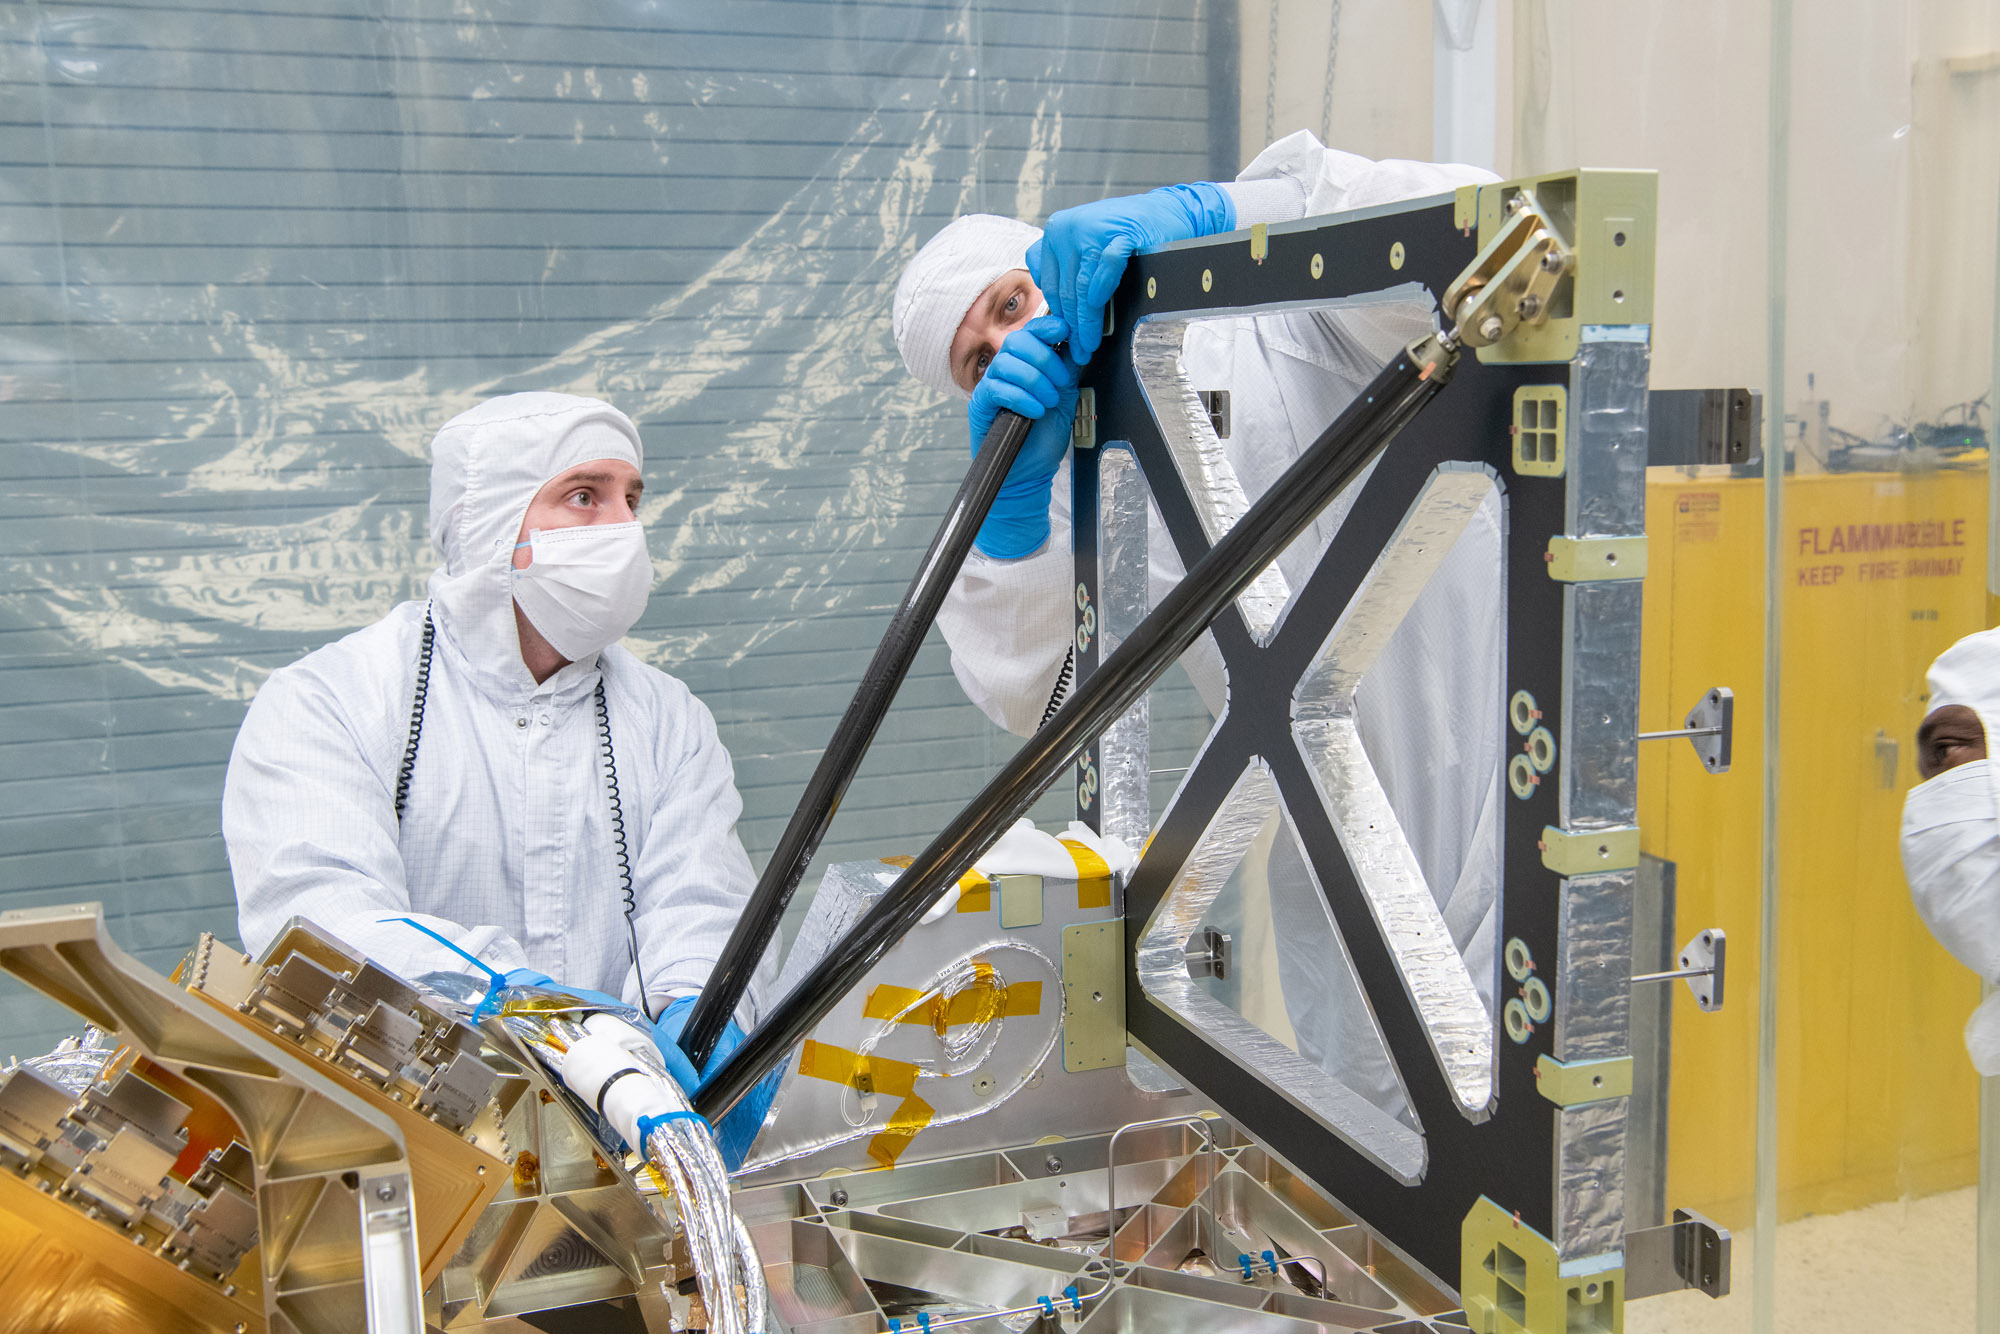
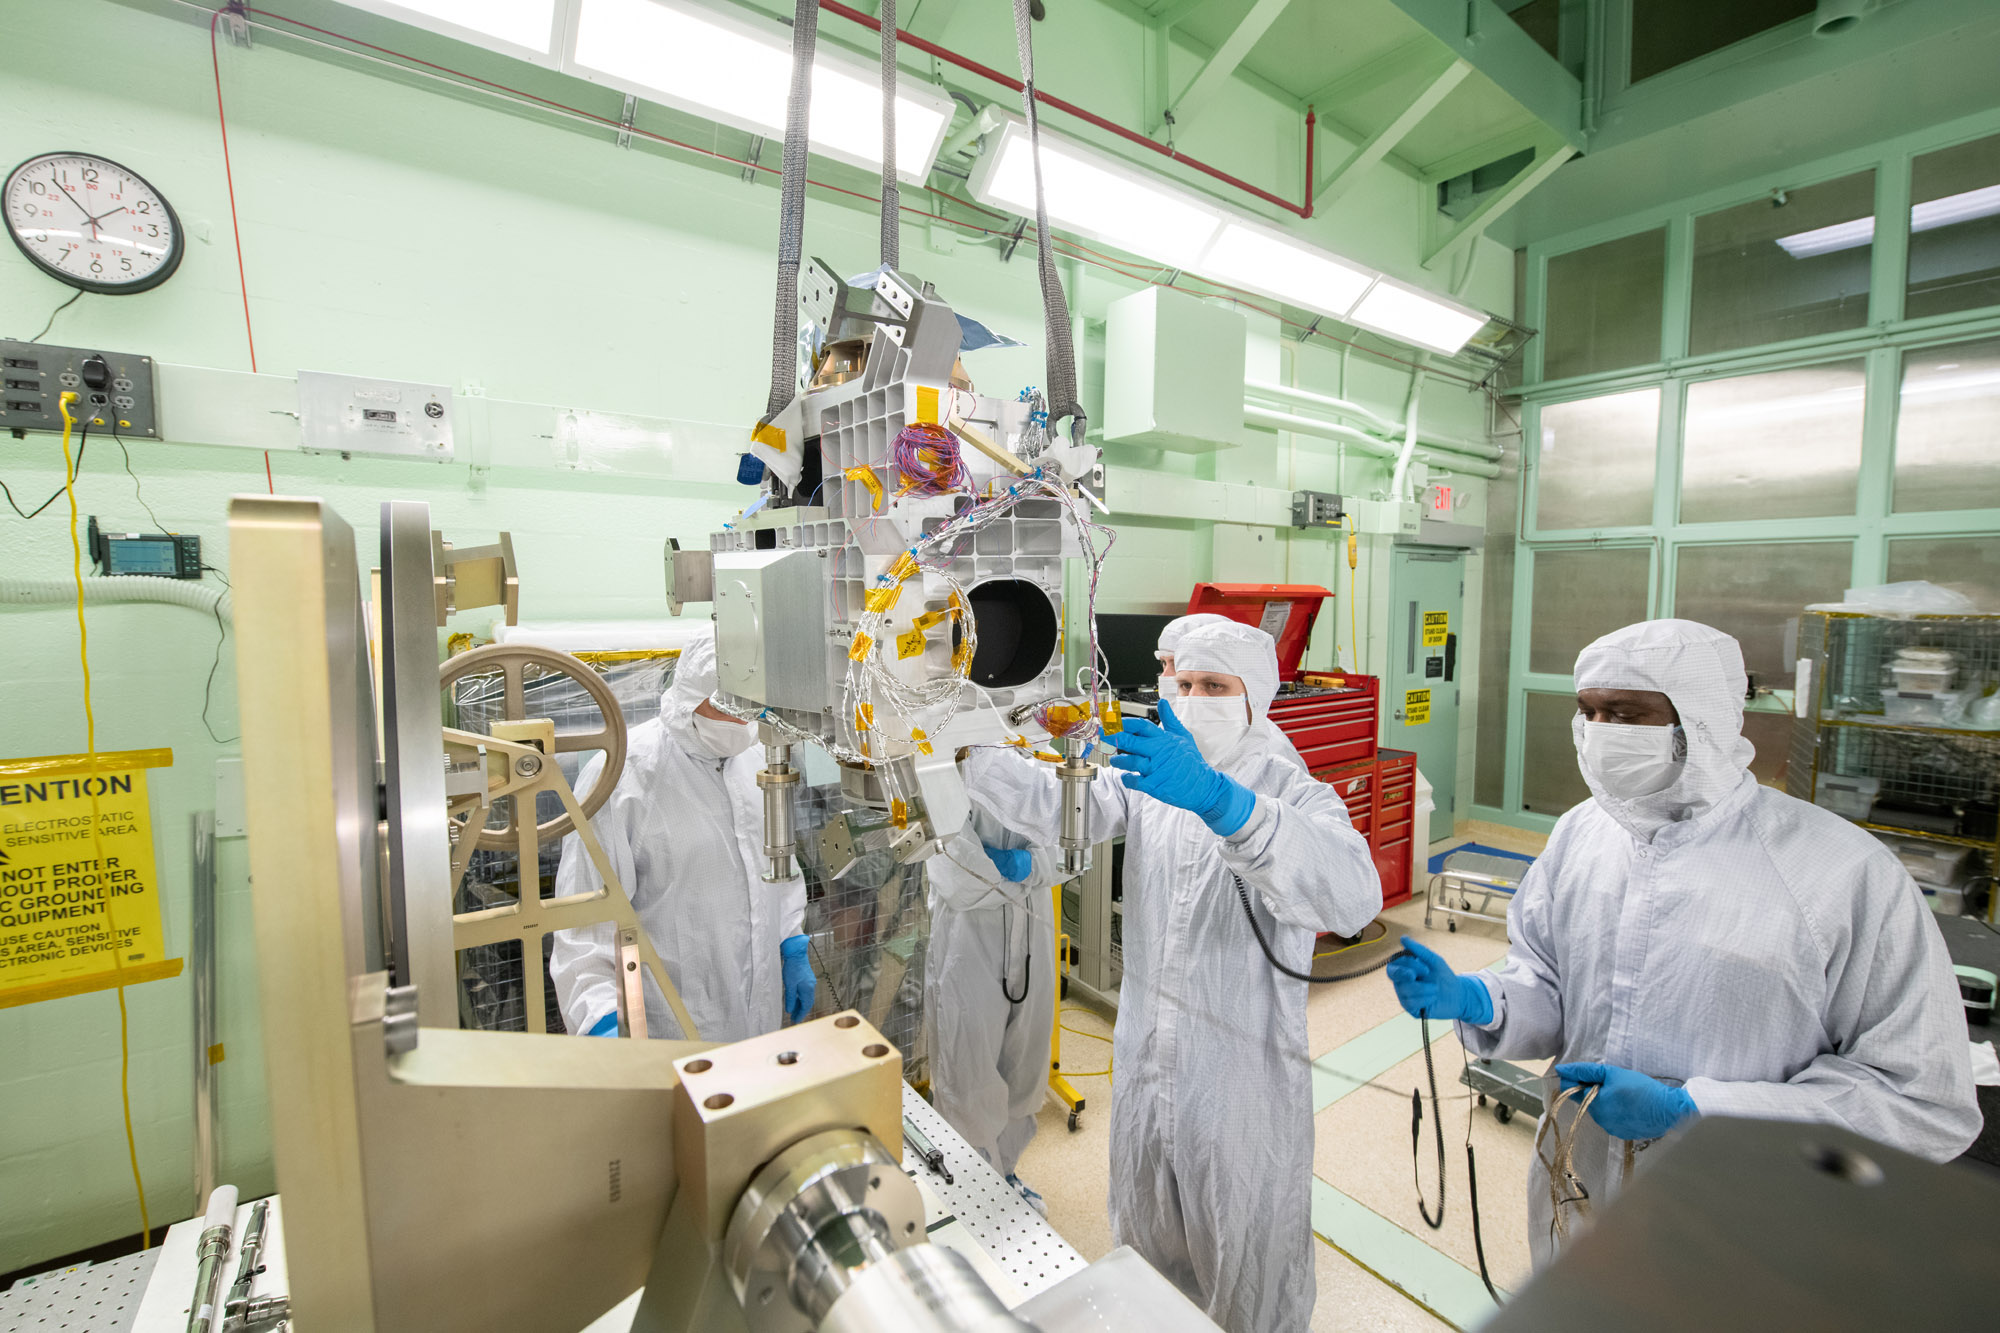
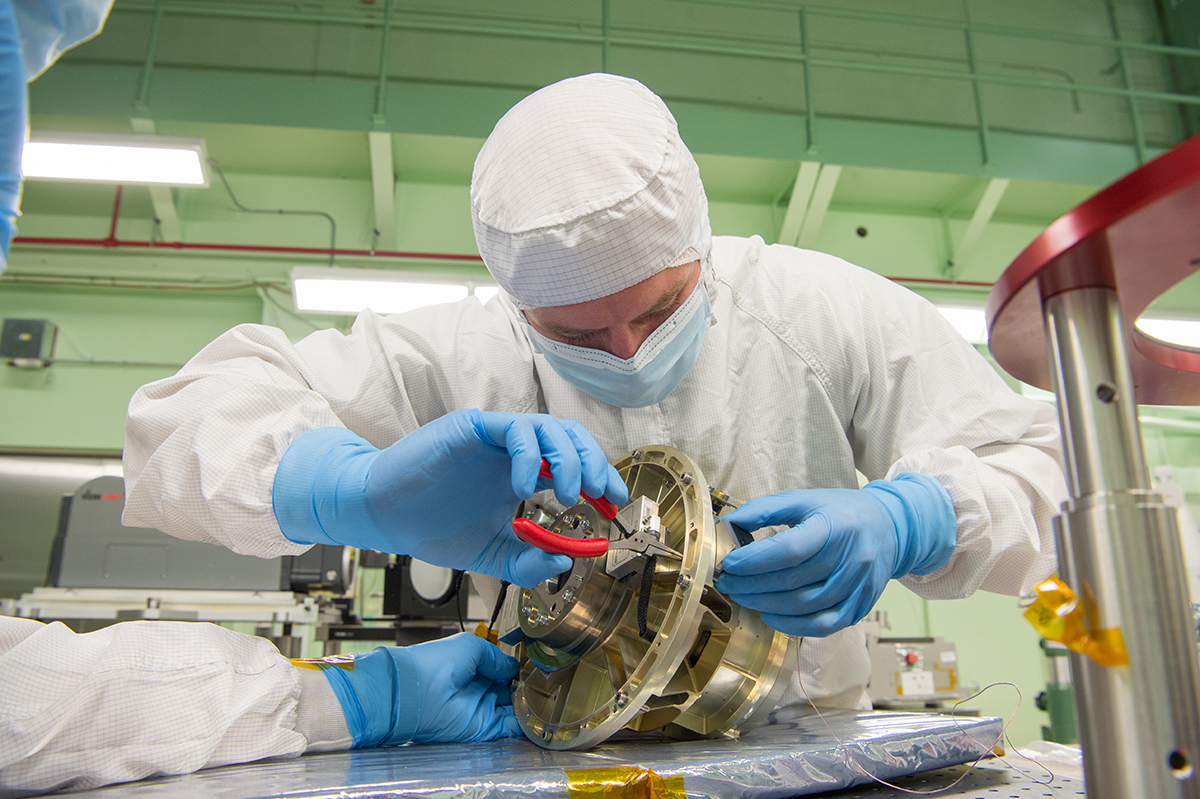
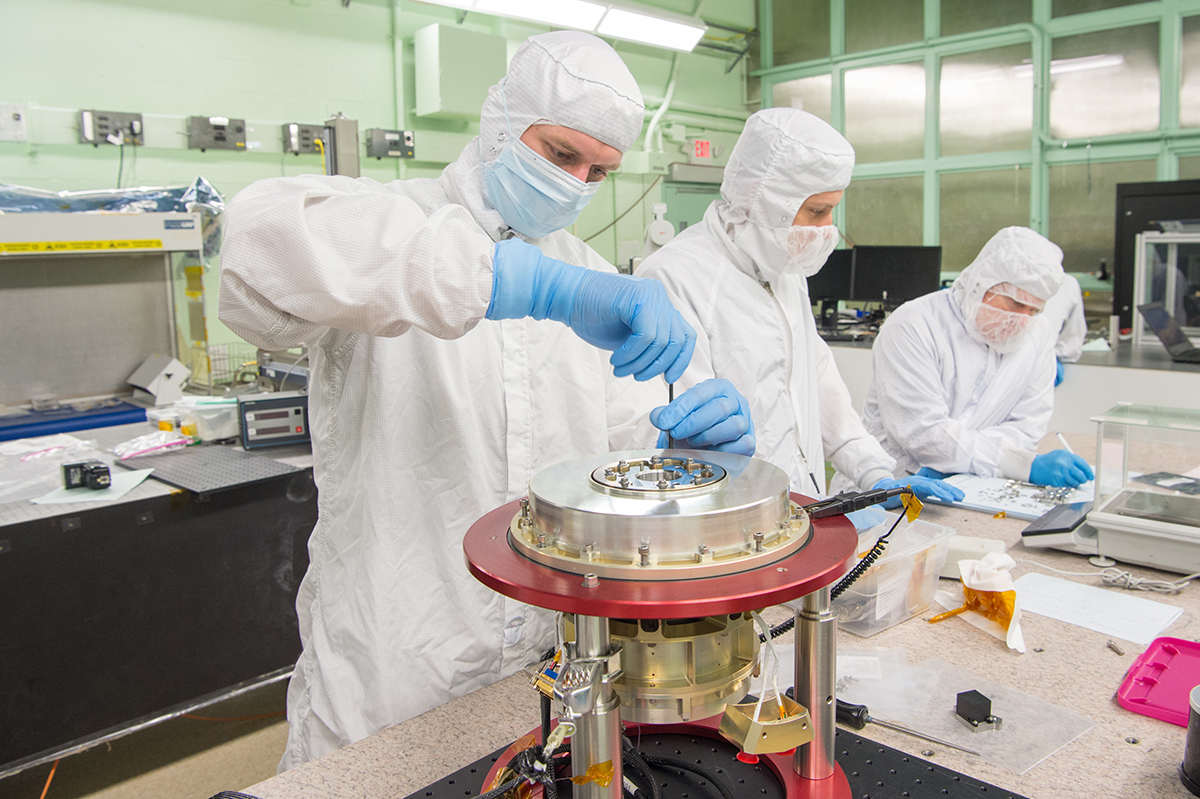
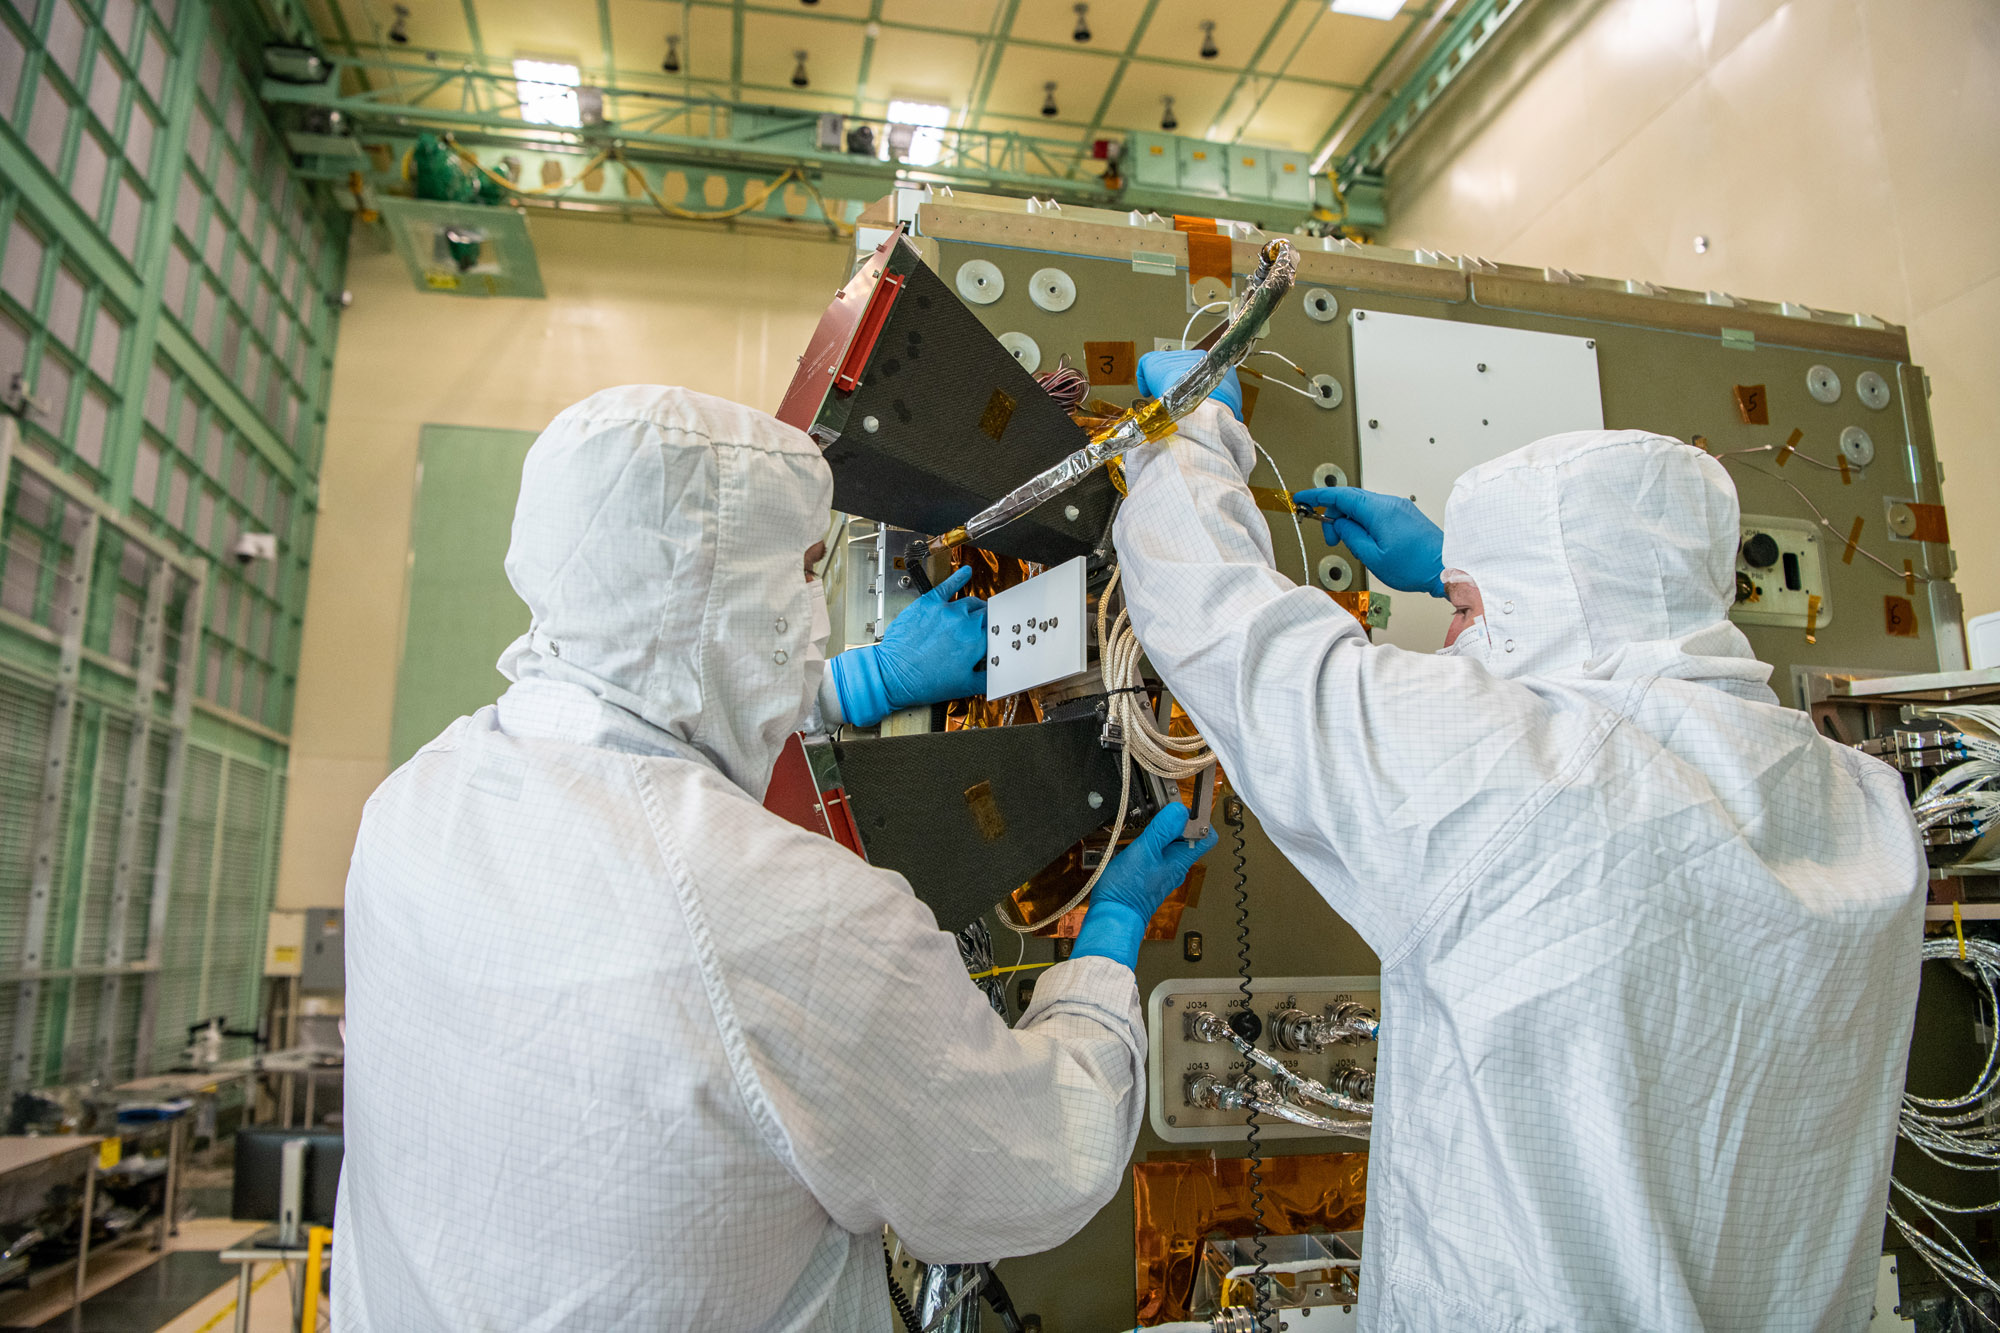
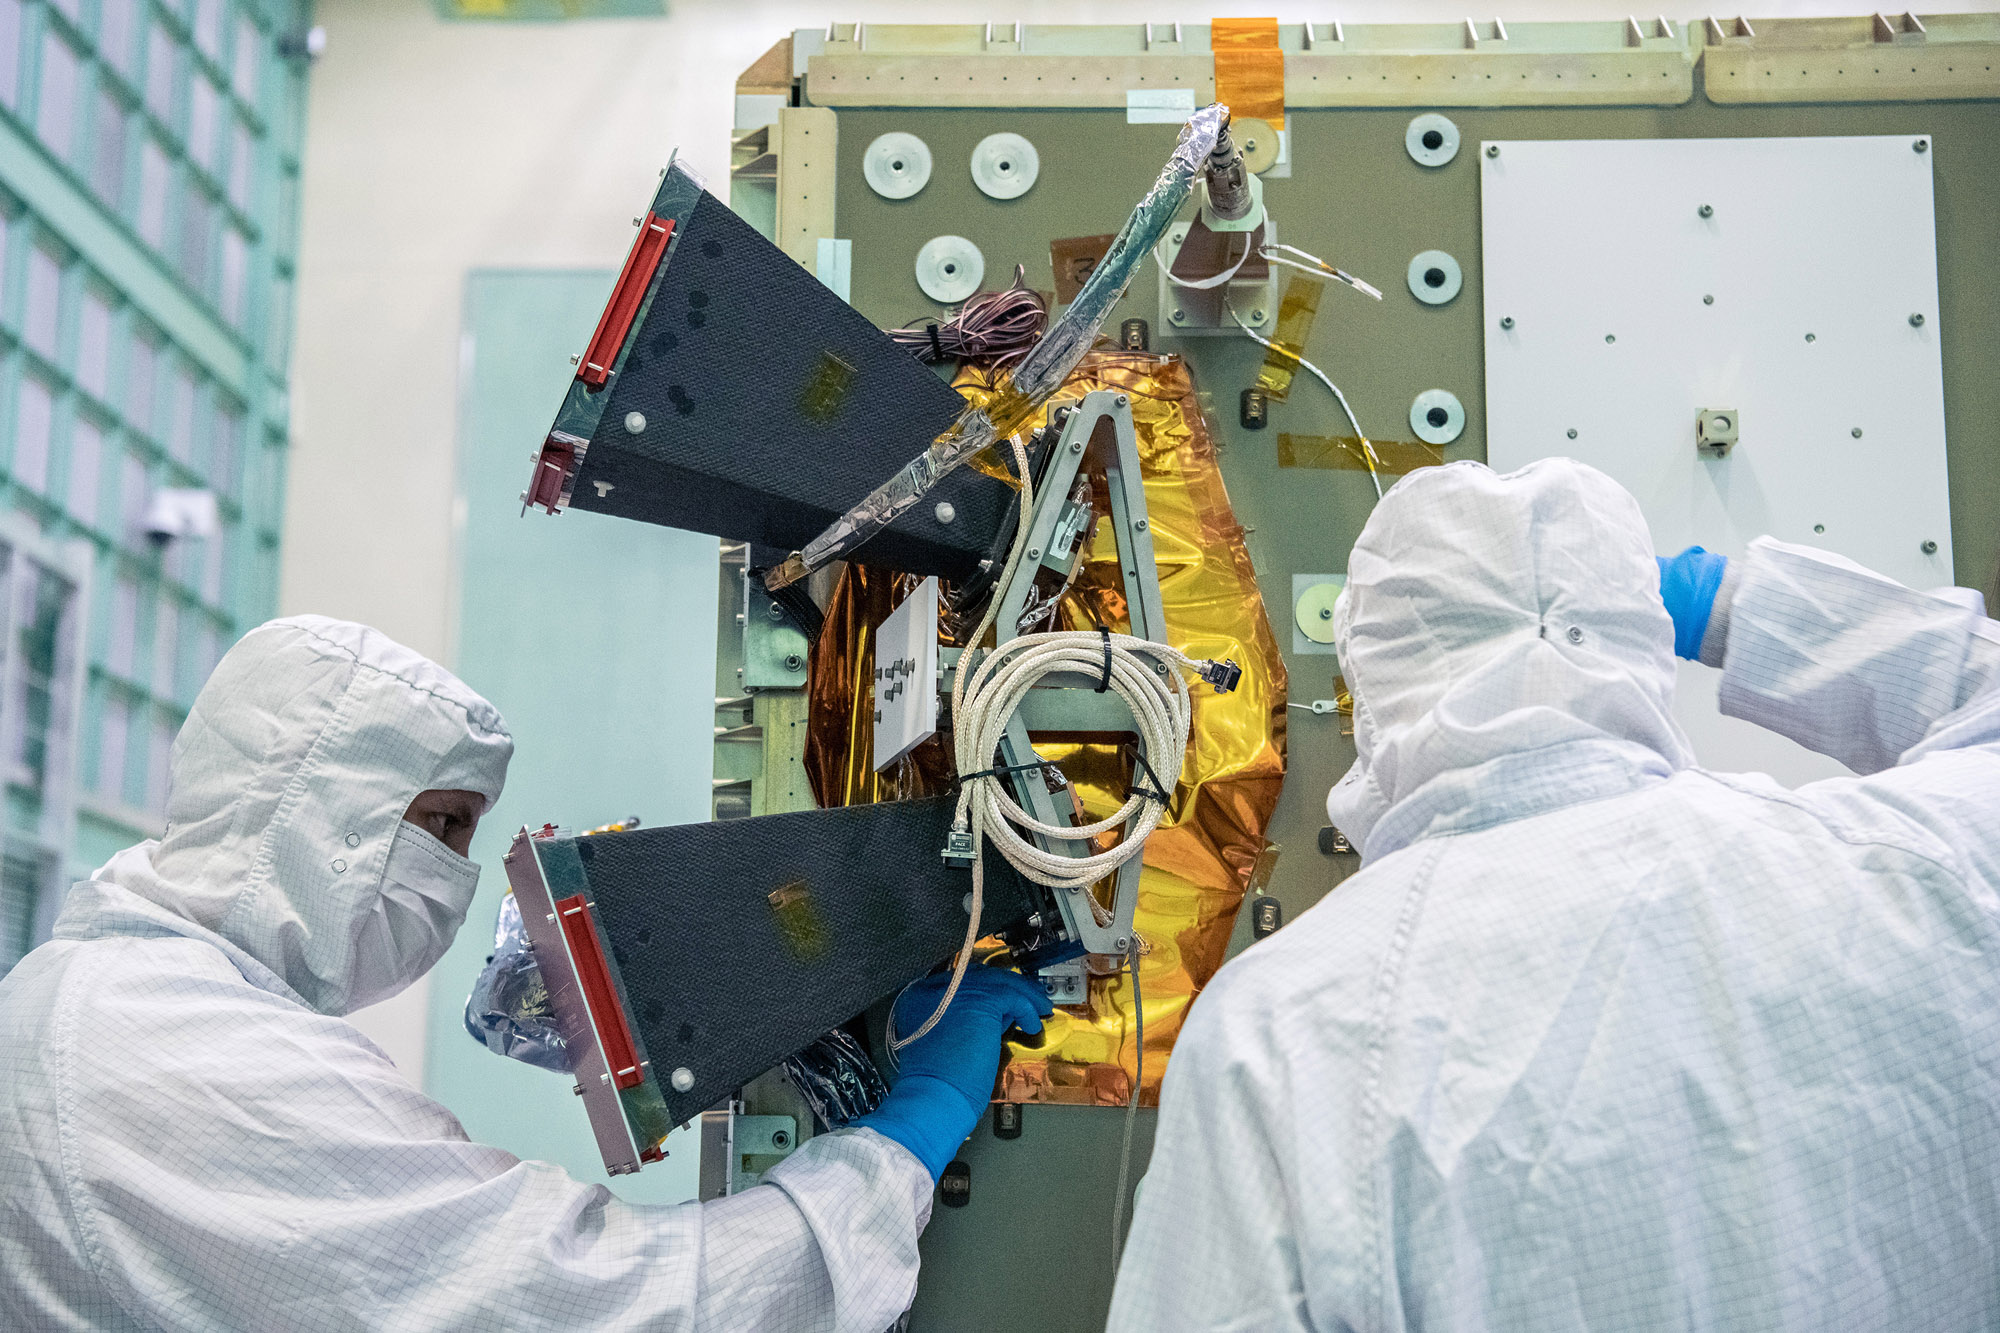
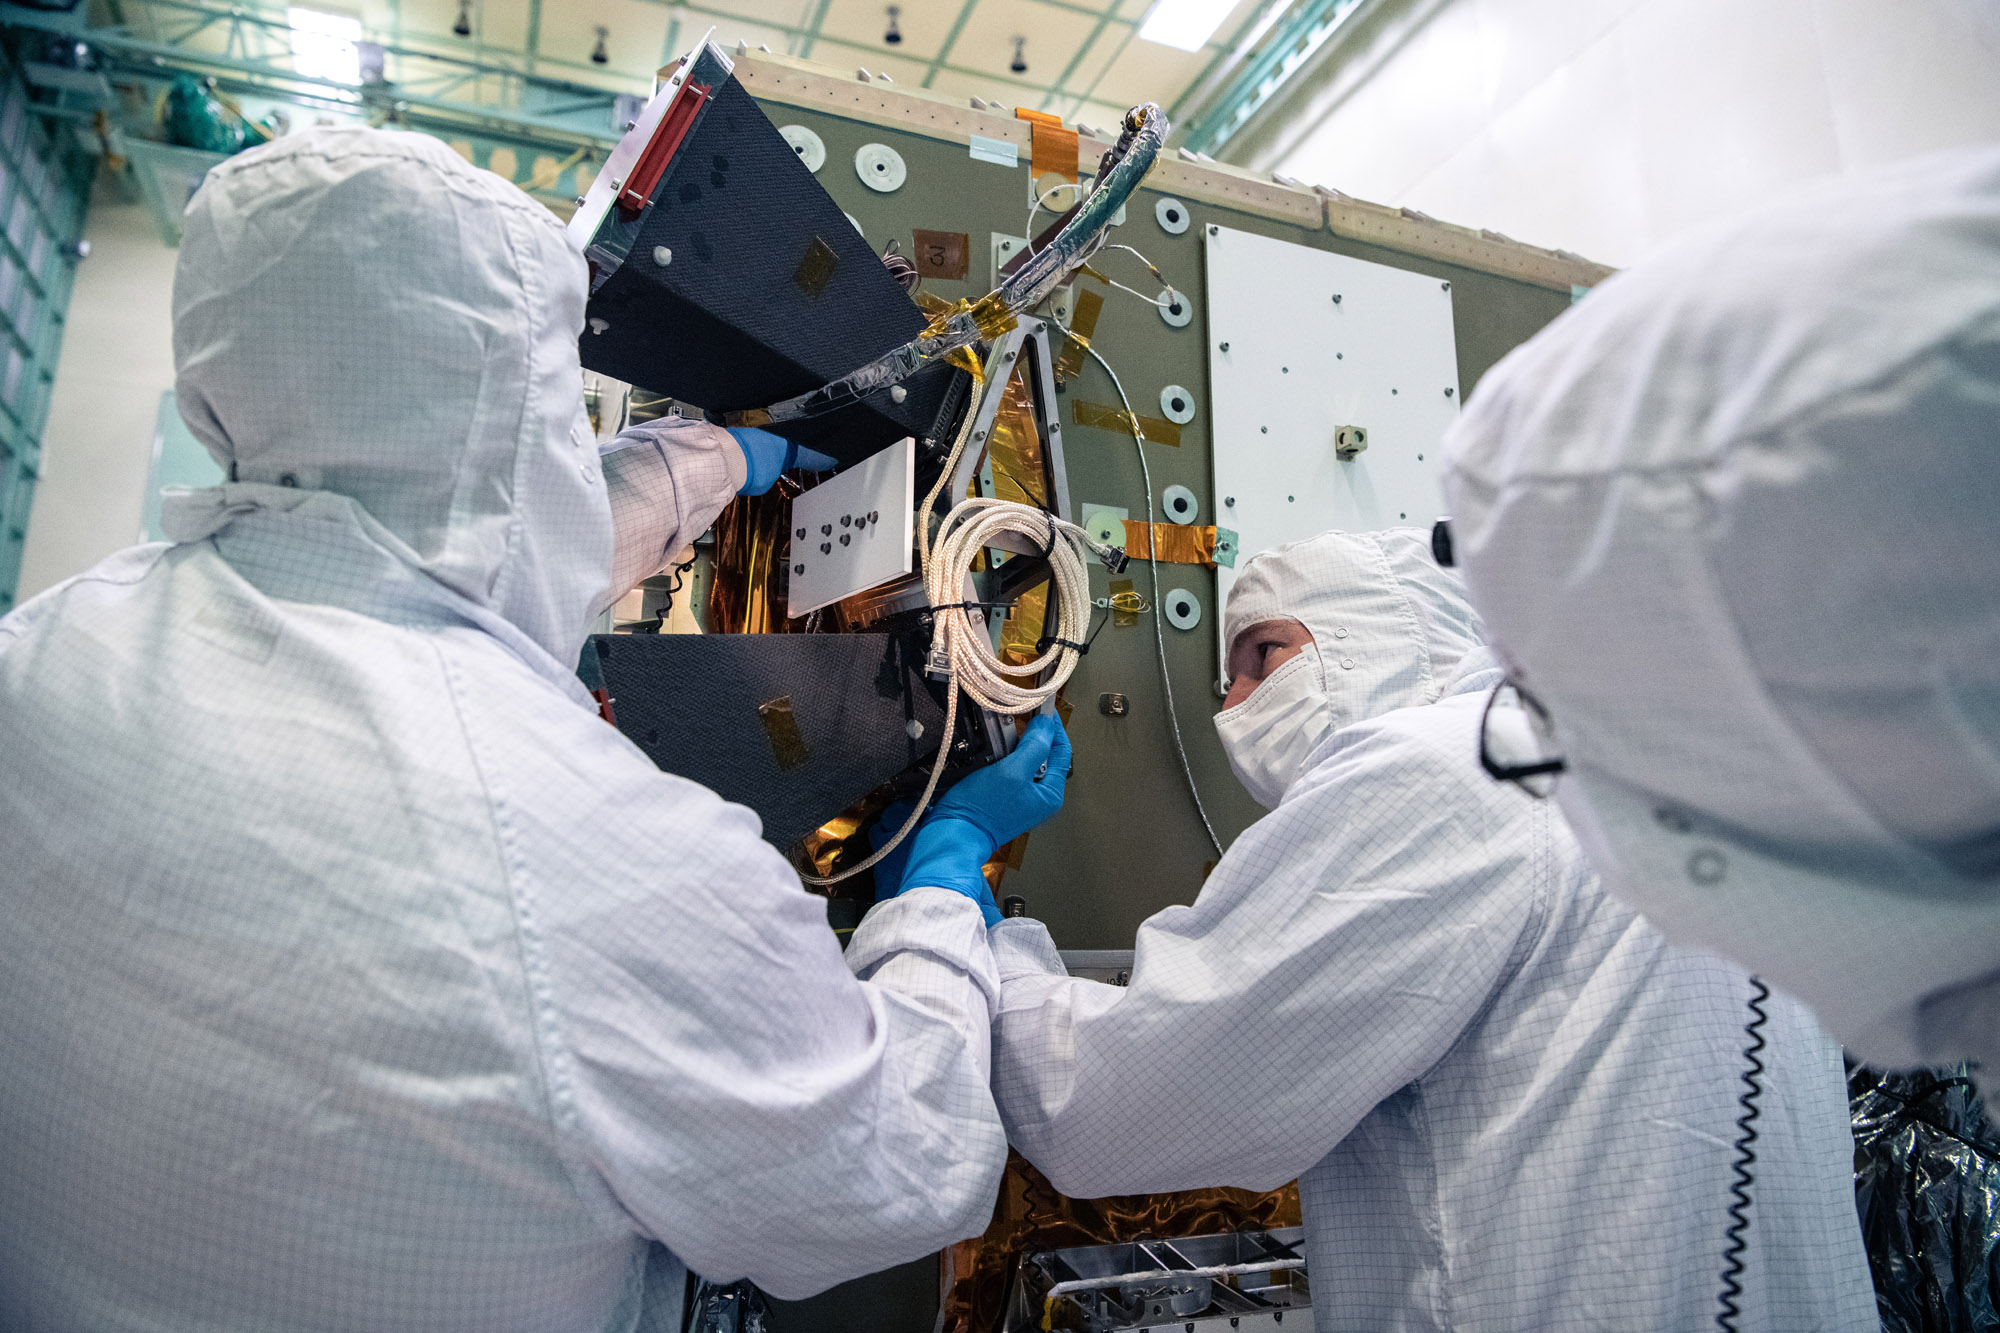
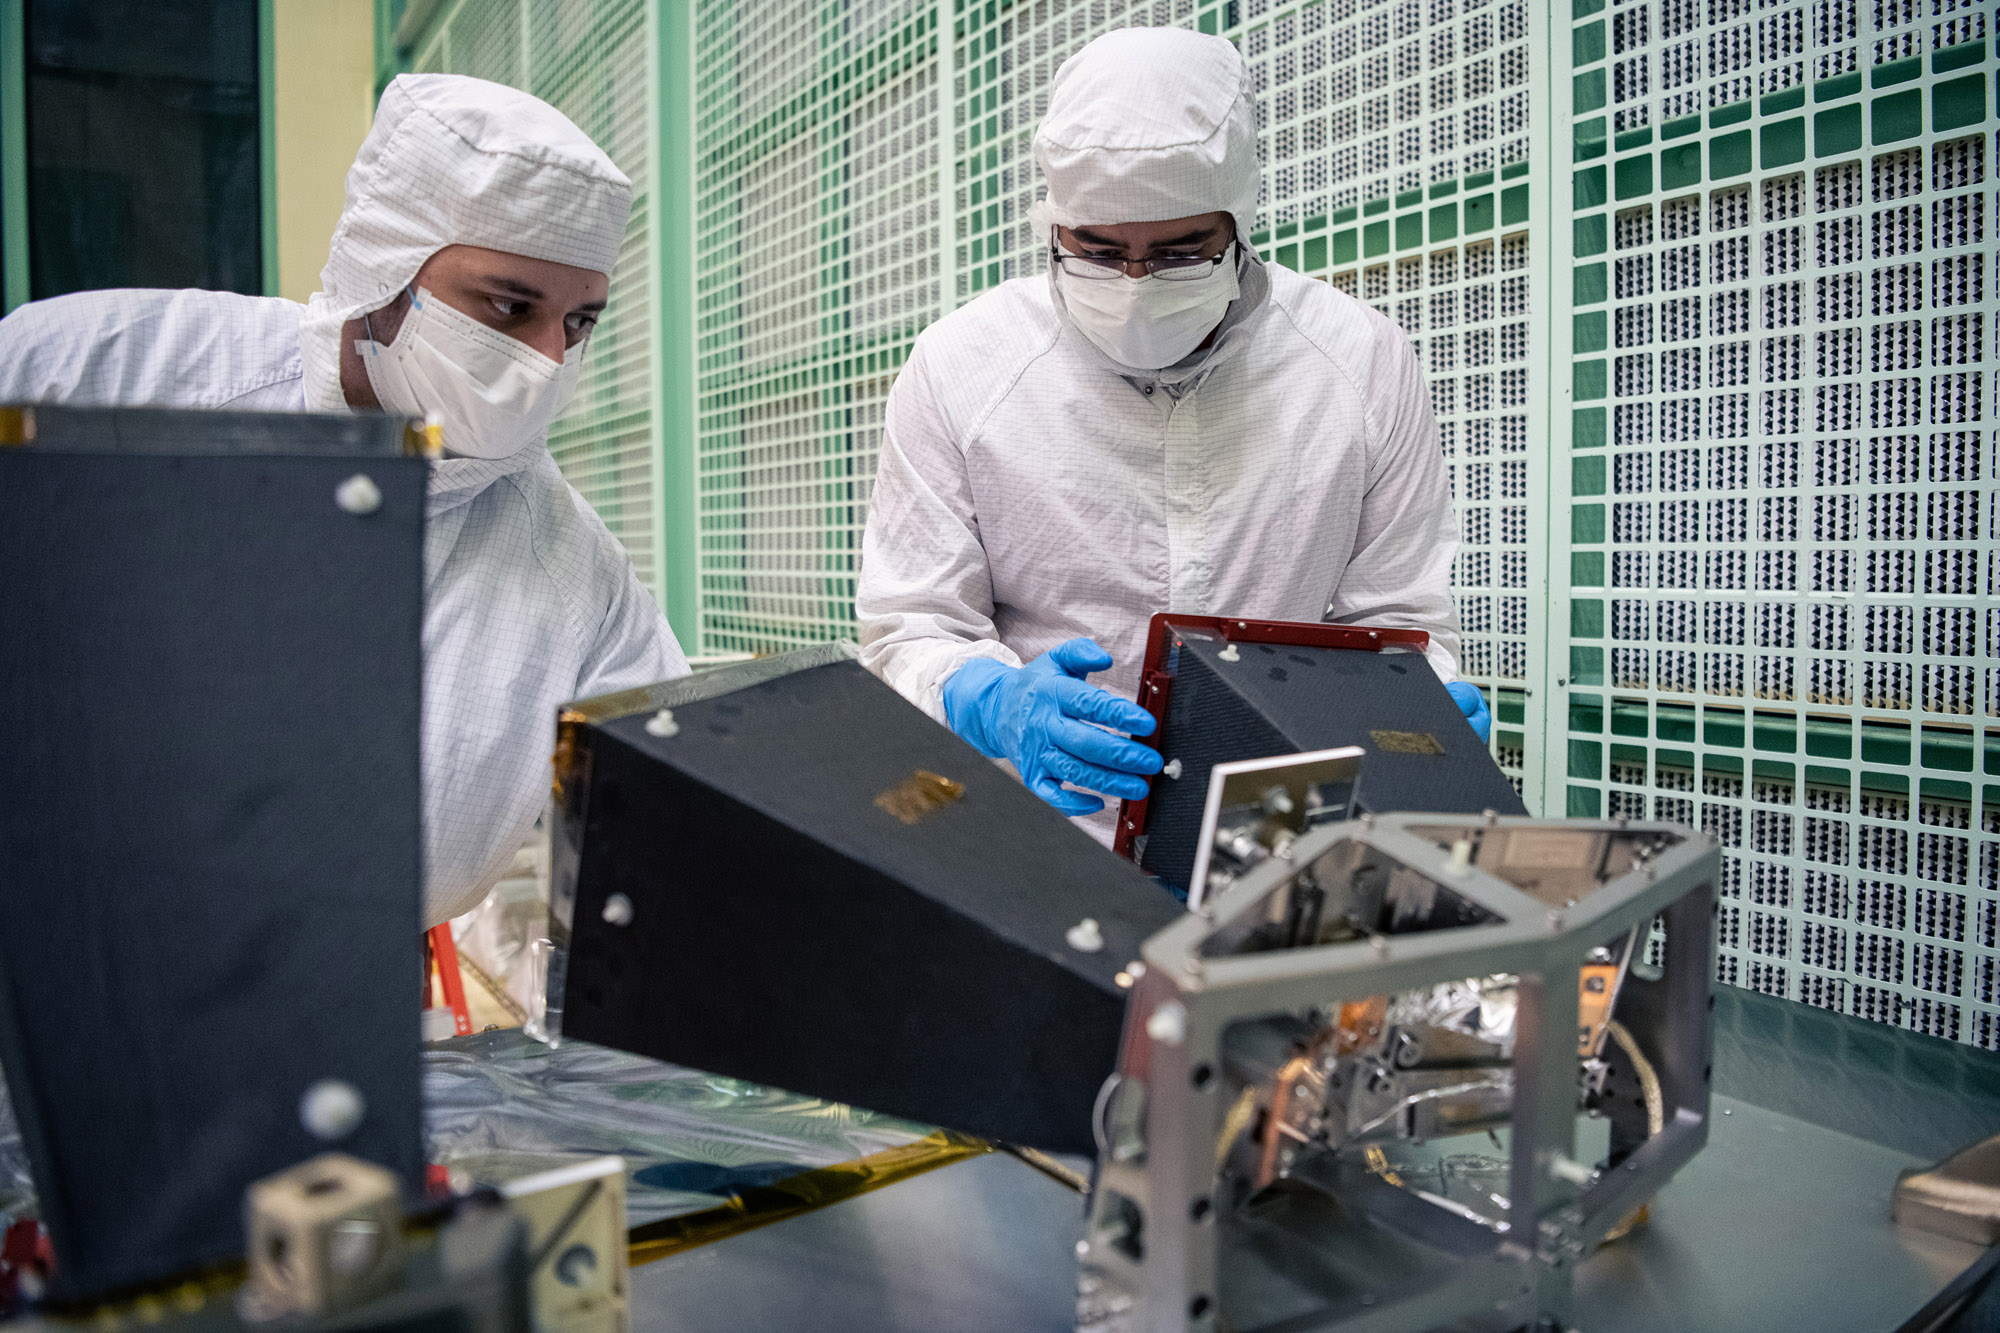
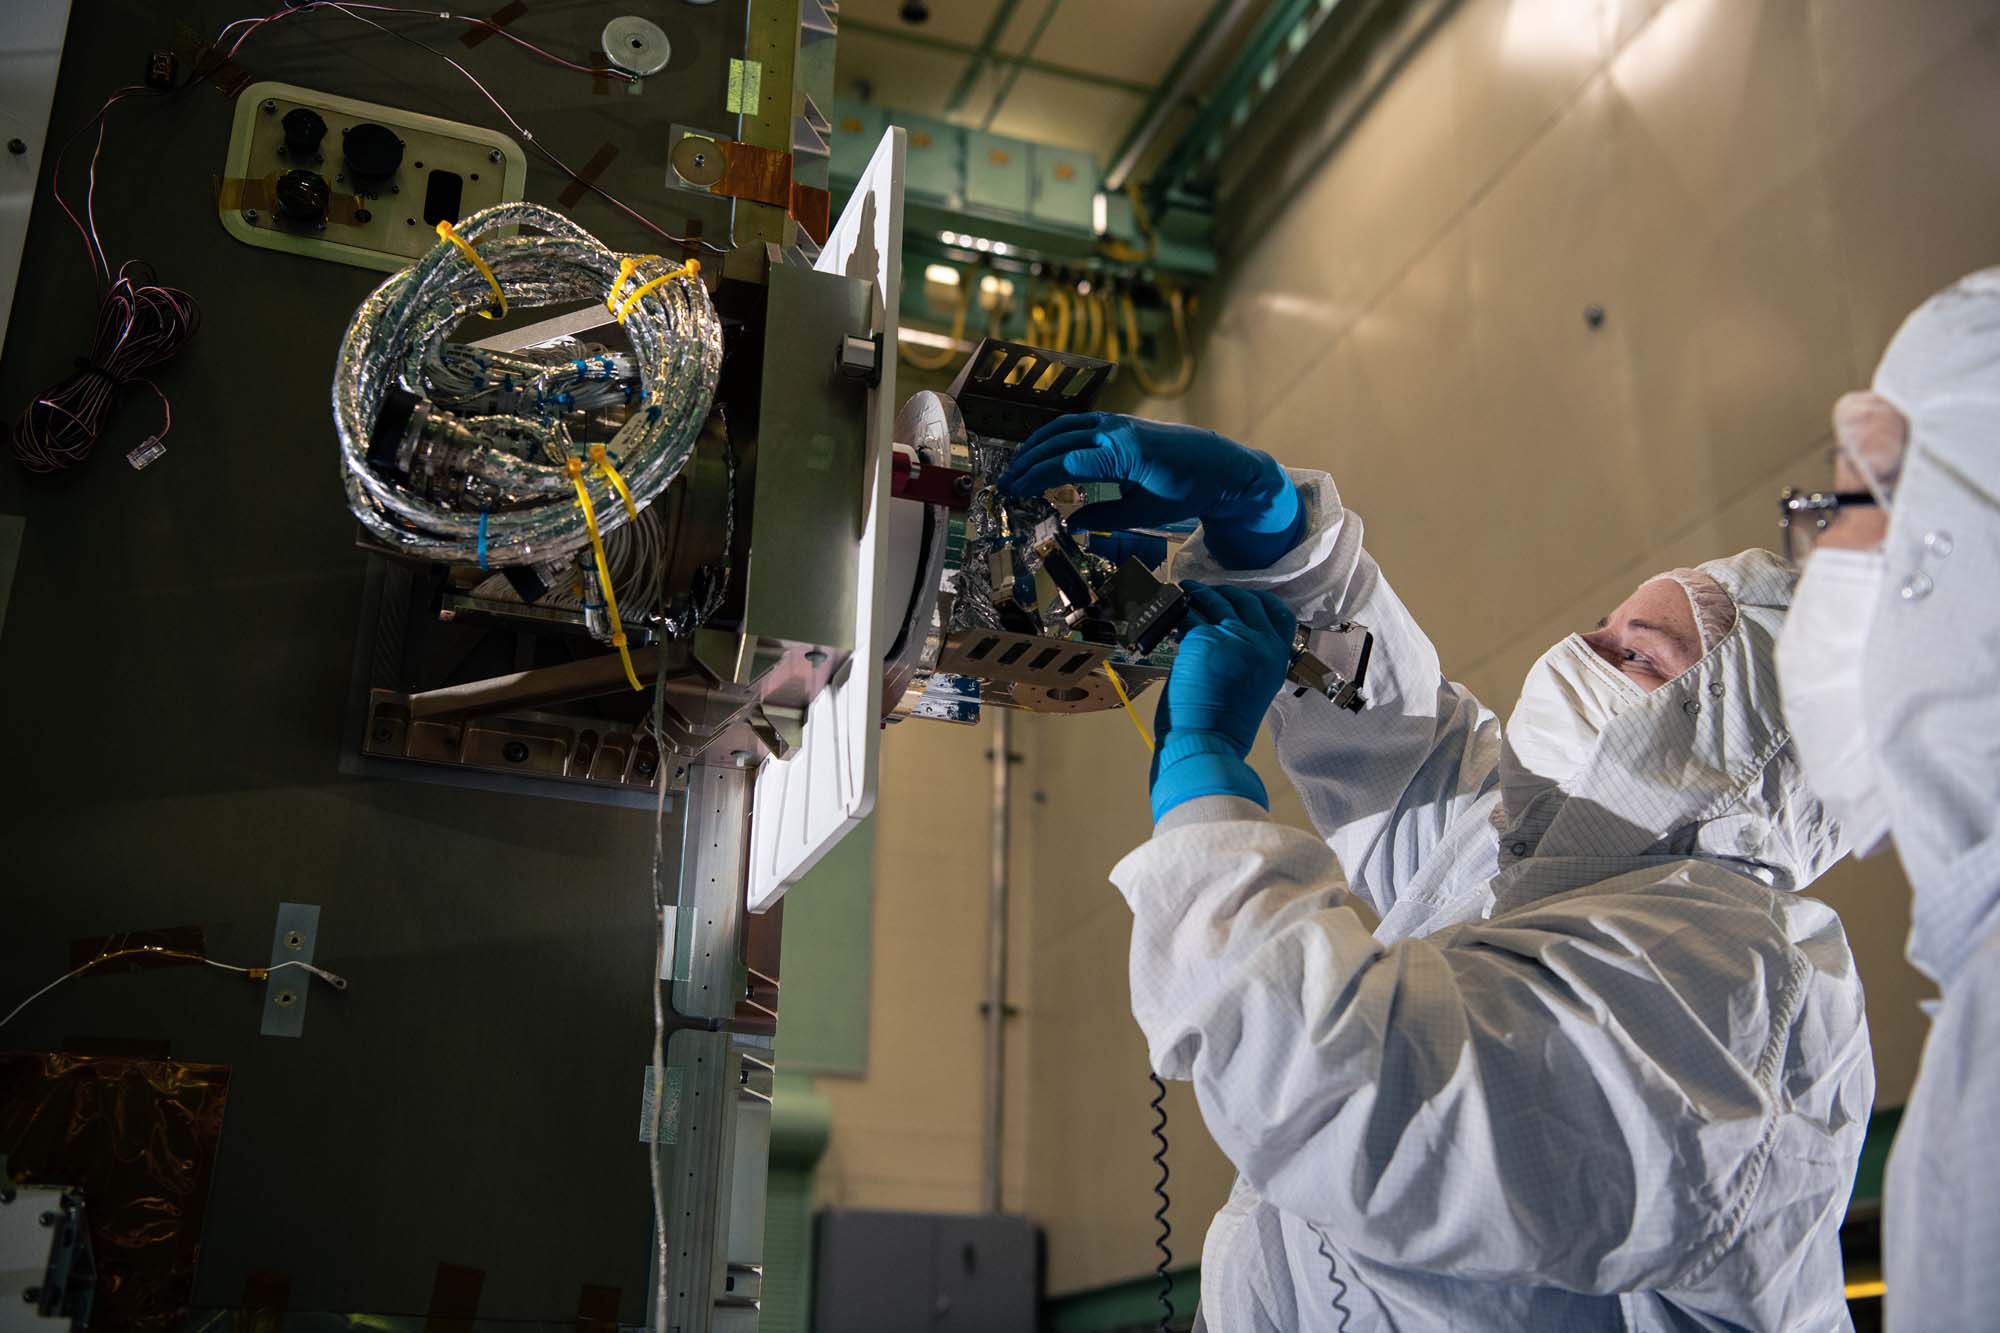
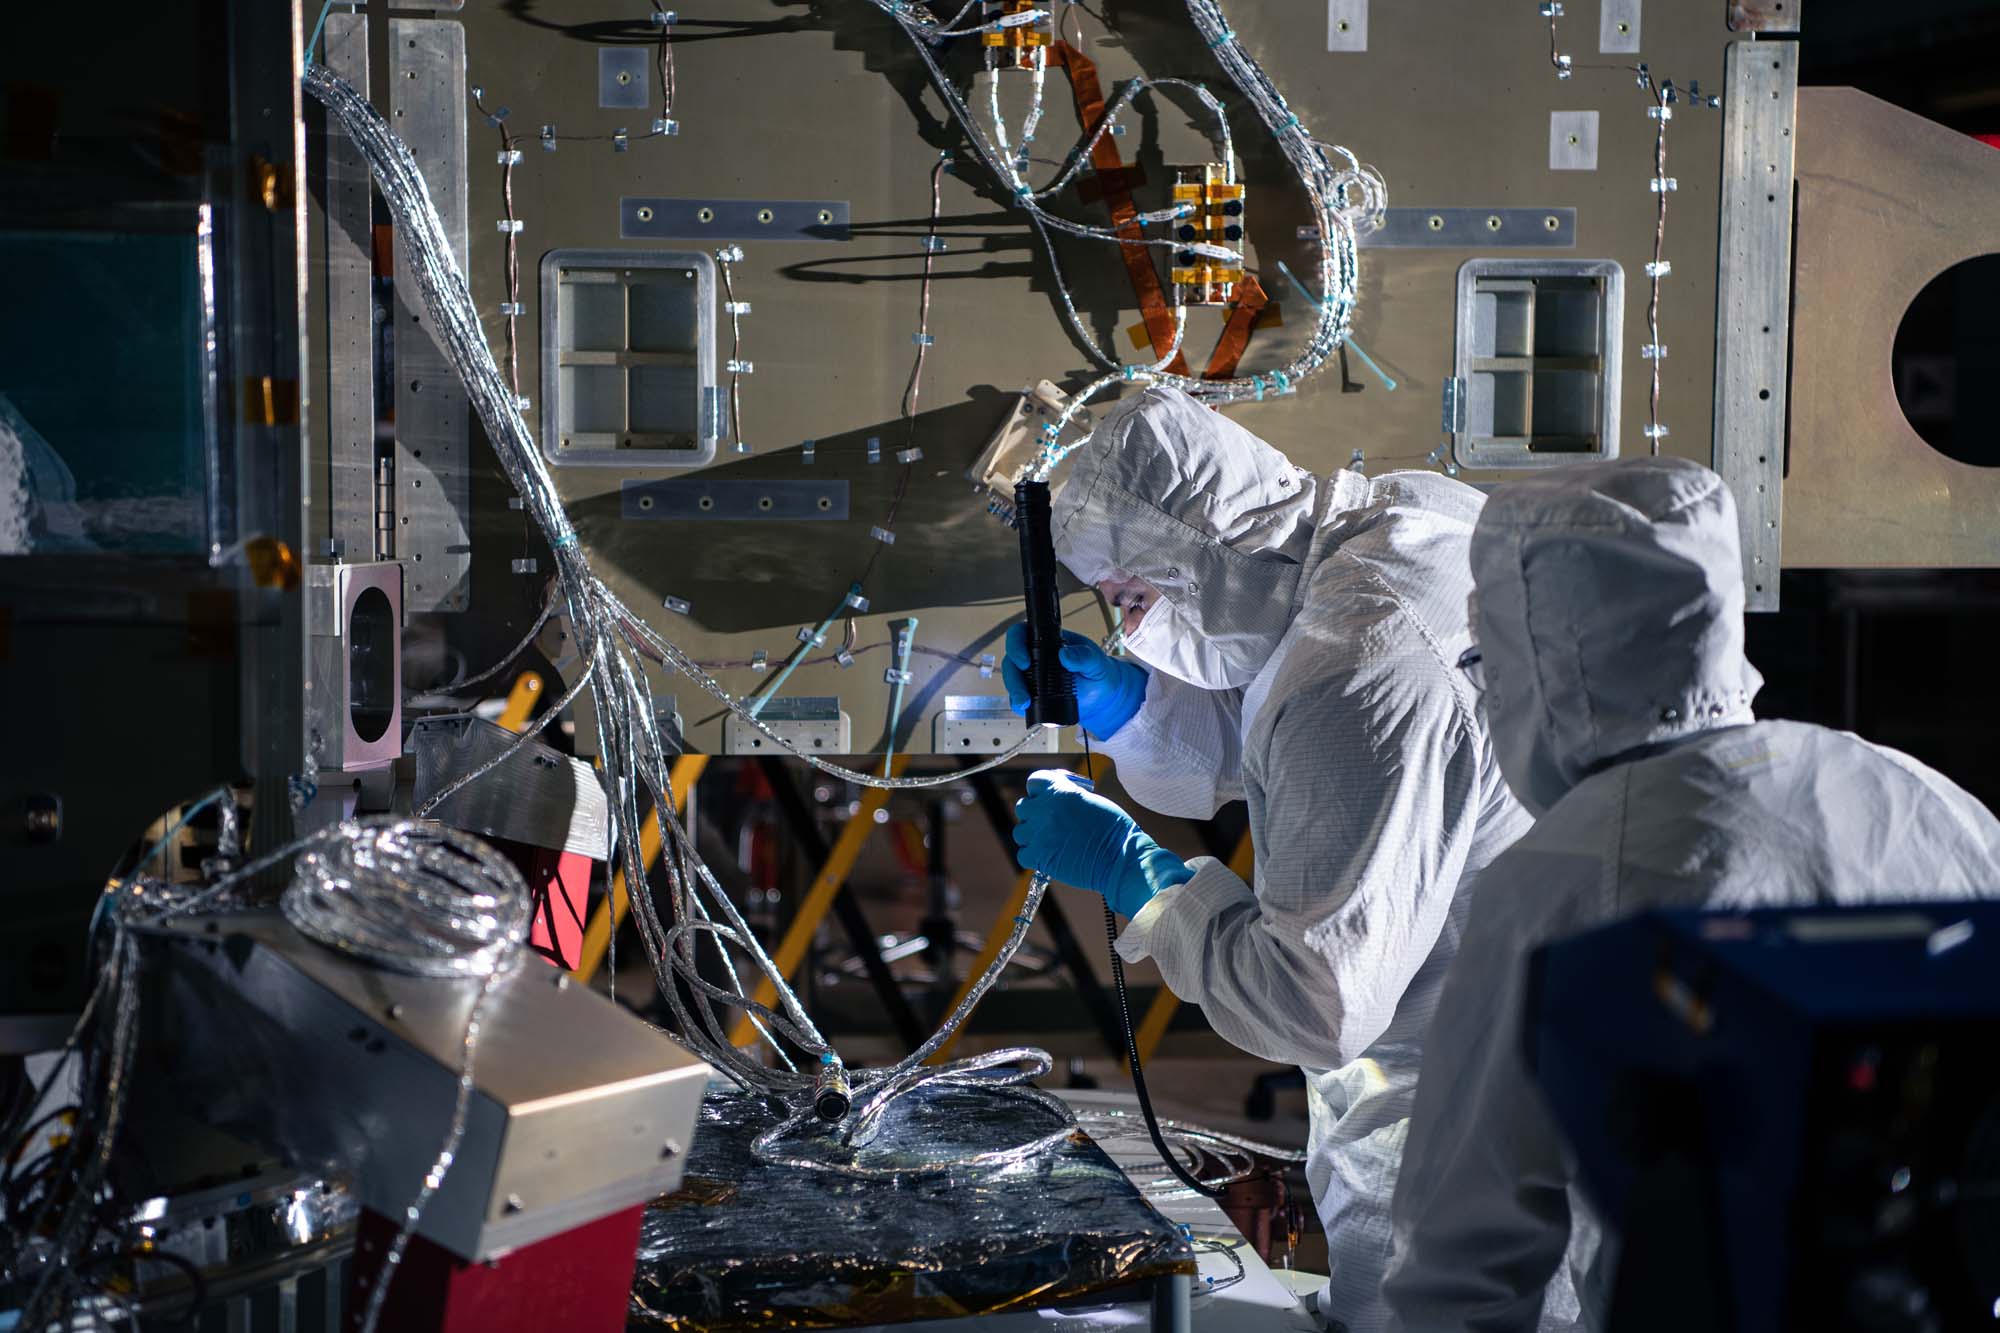
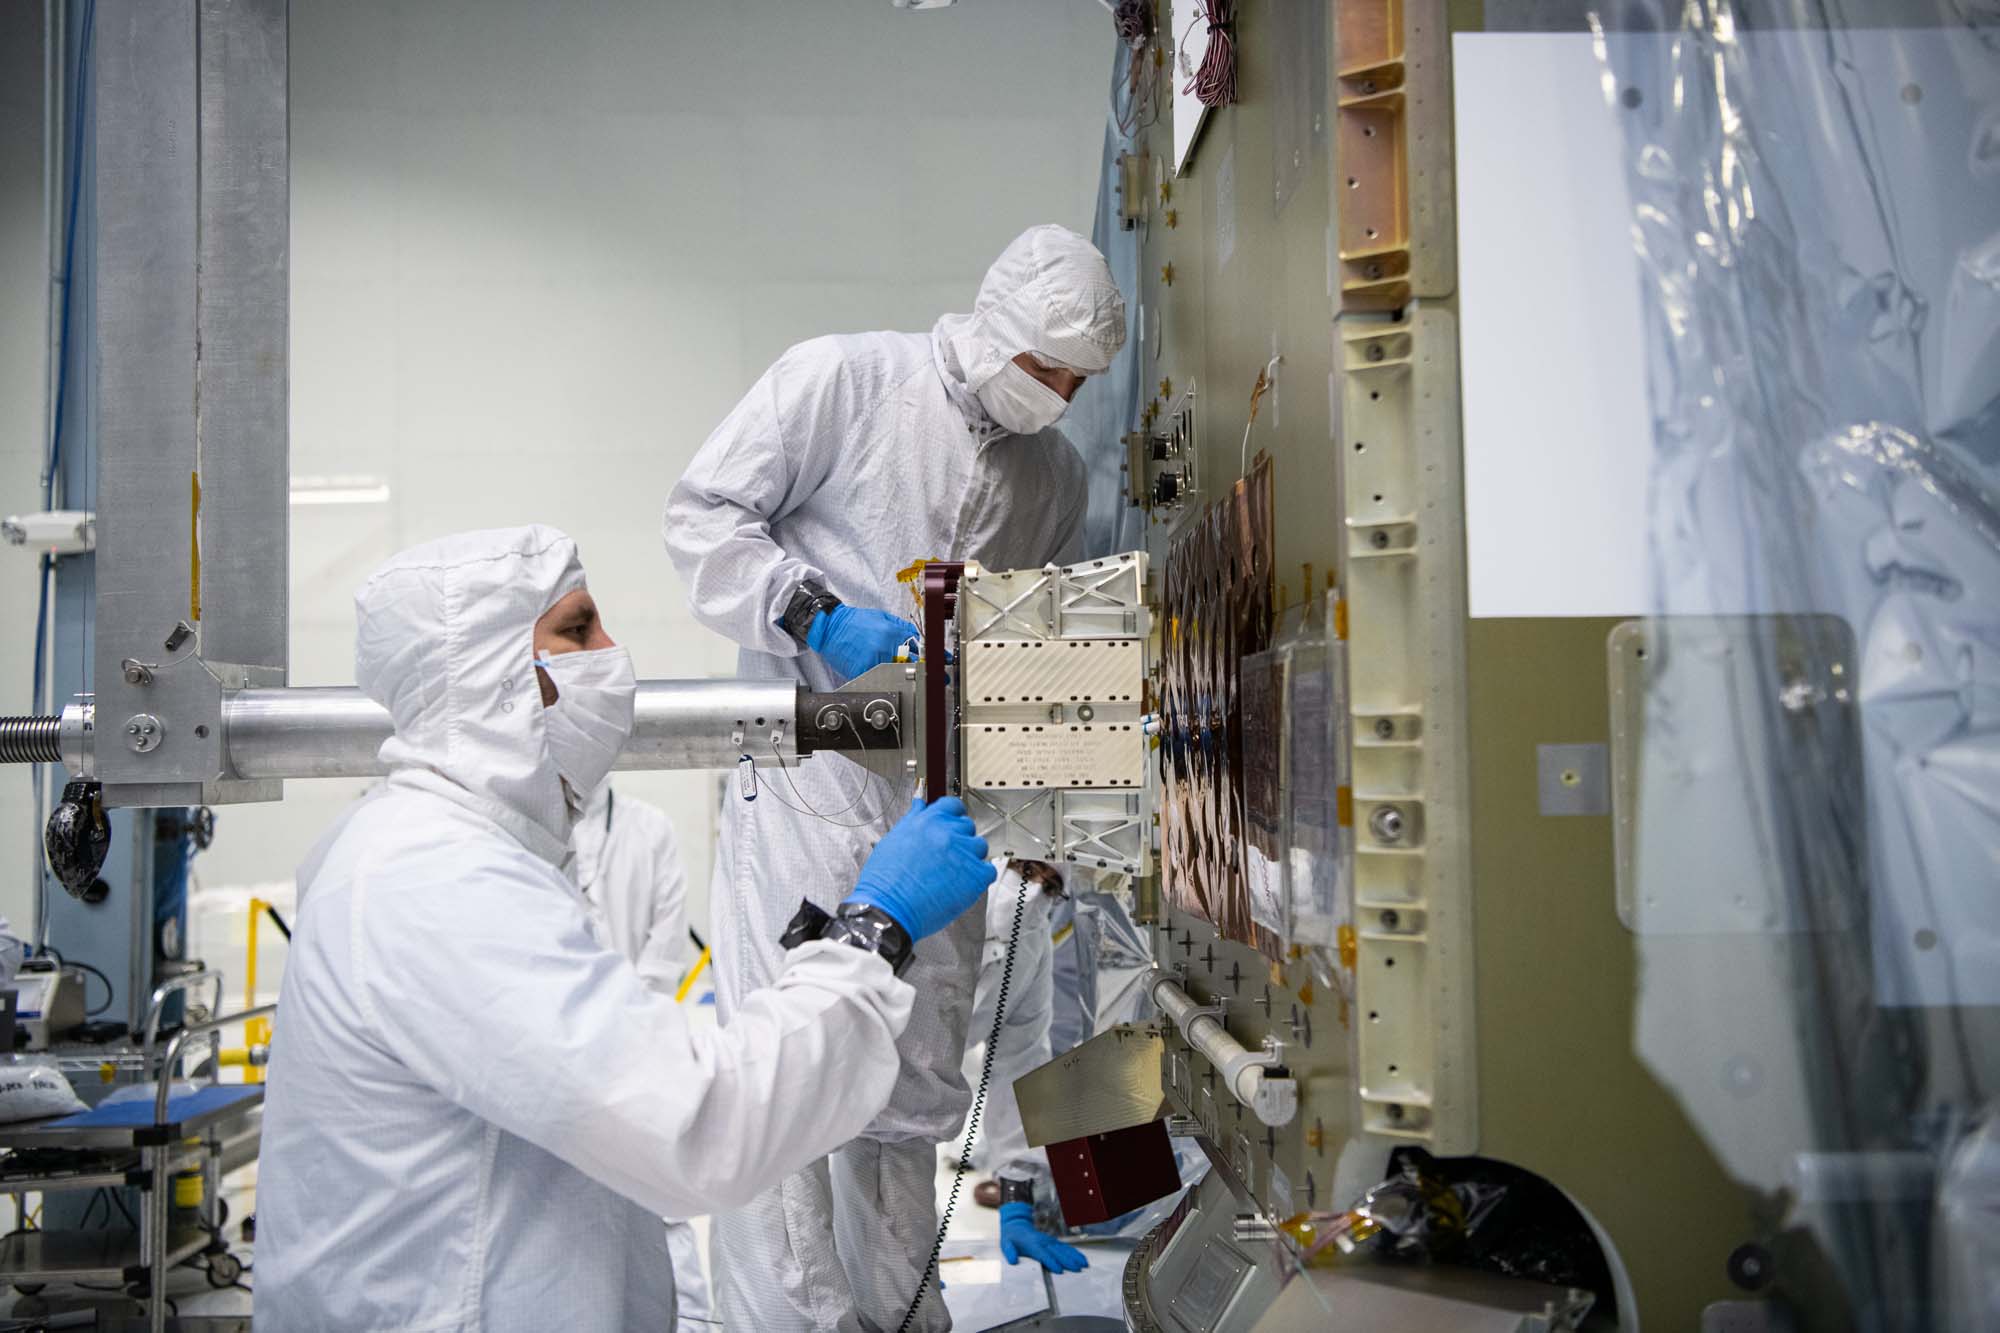
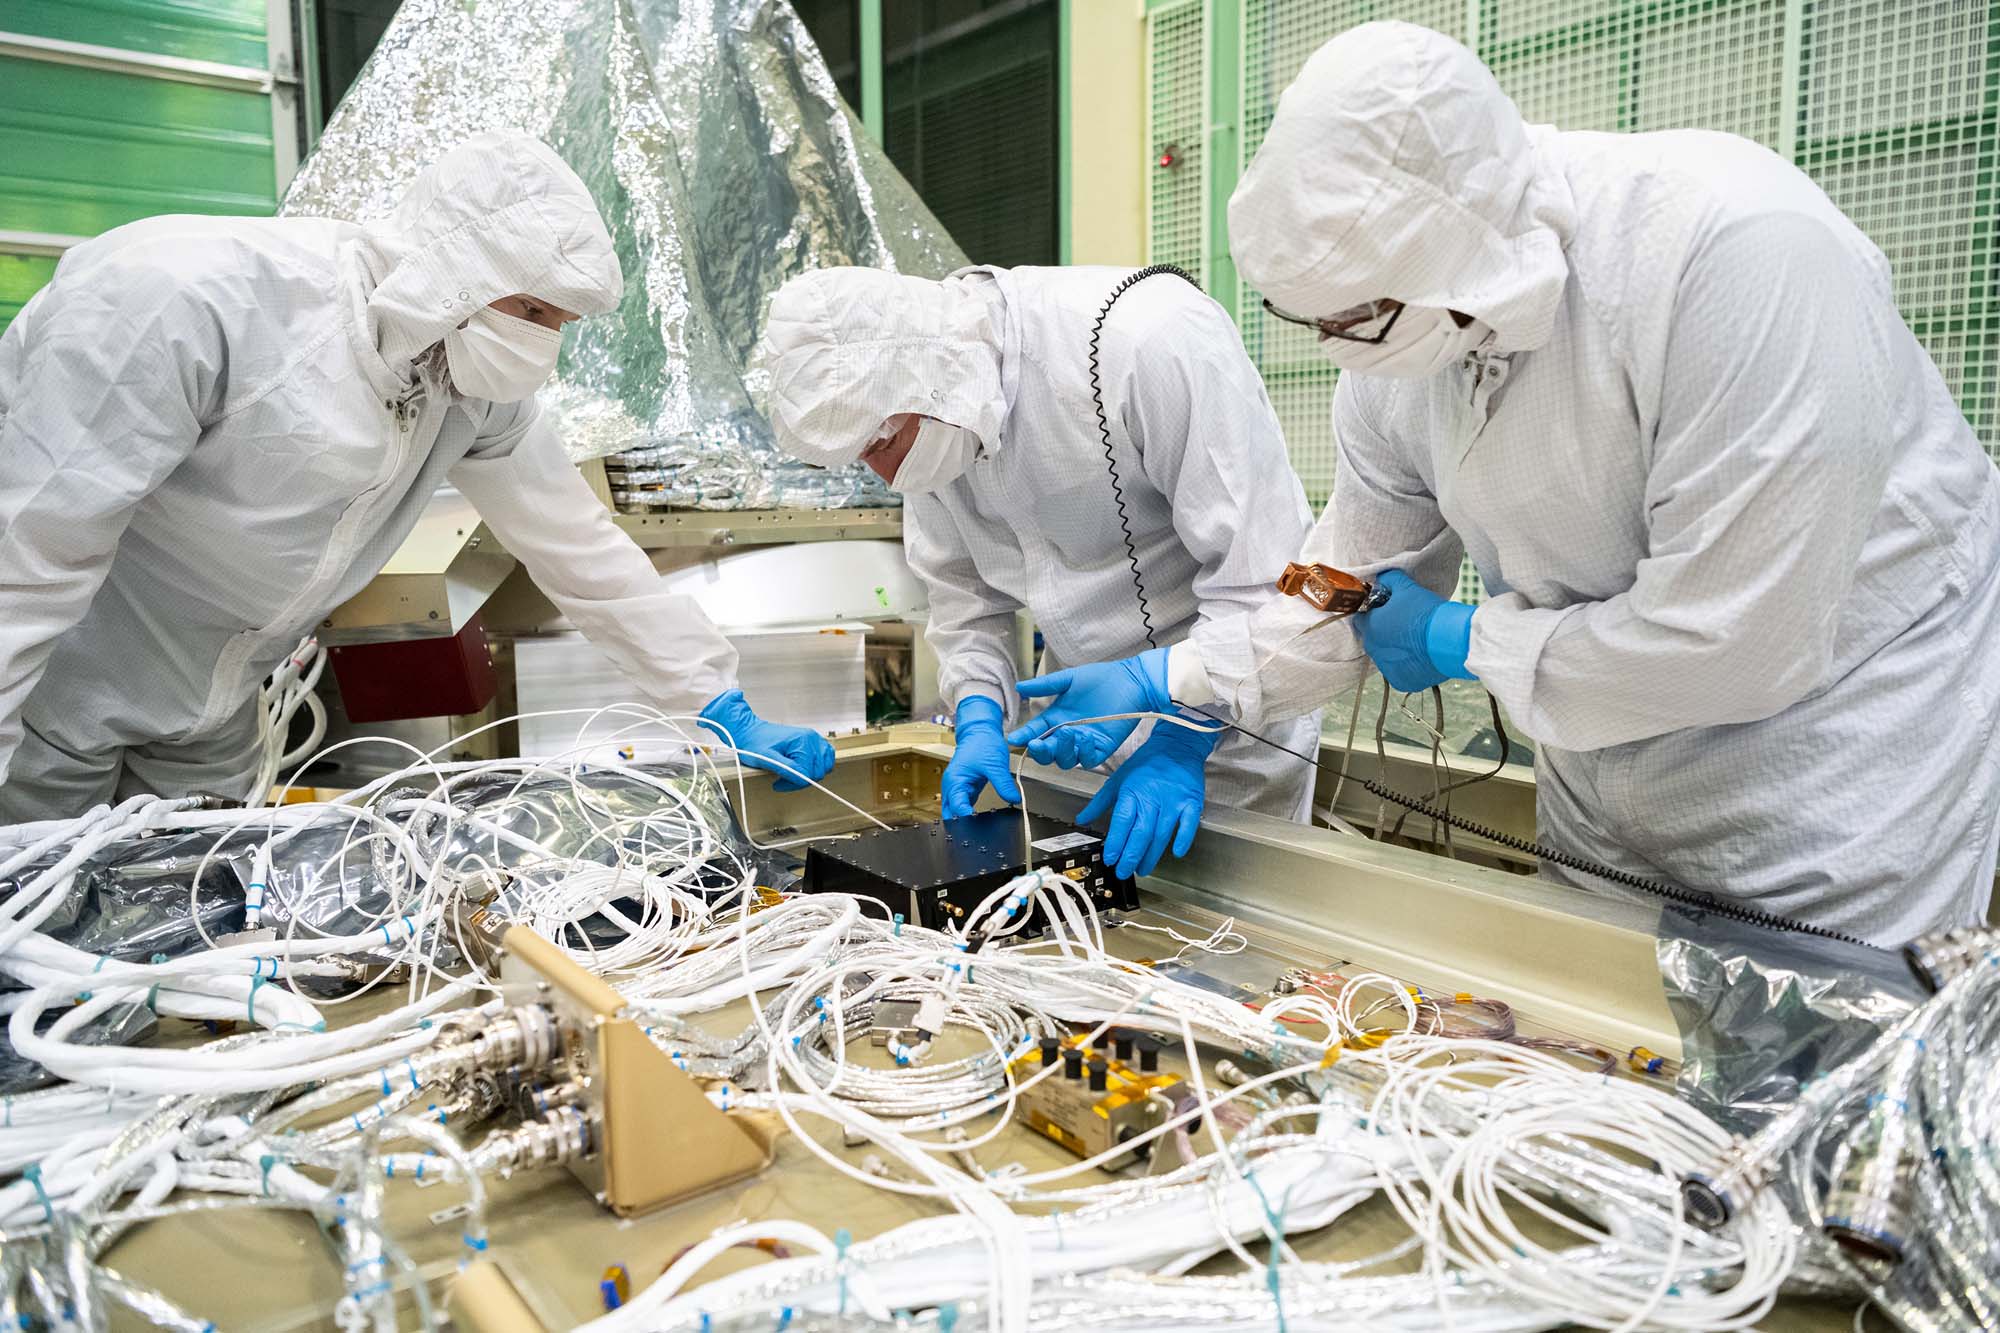
HARP2 Team conducts integration and test: Flight HARP2 Electrical Integration to SpaceCraft Procedure. Credit: NASA
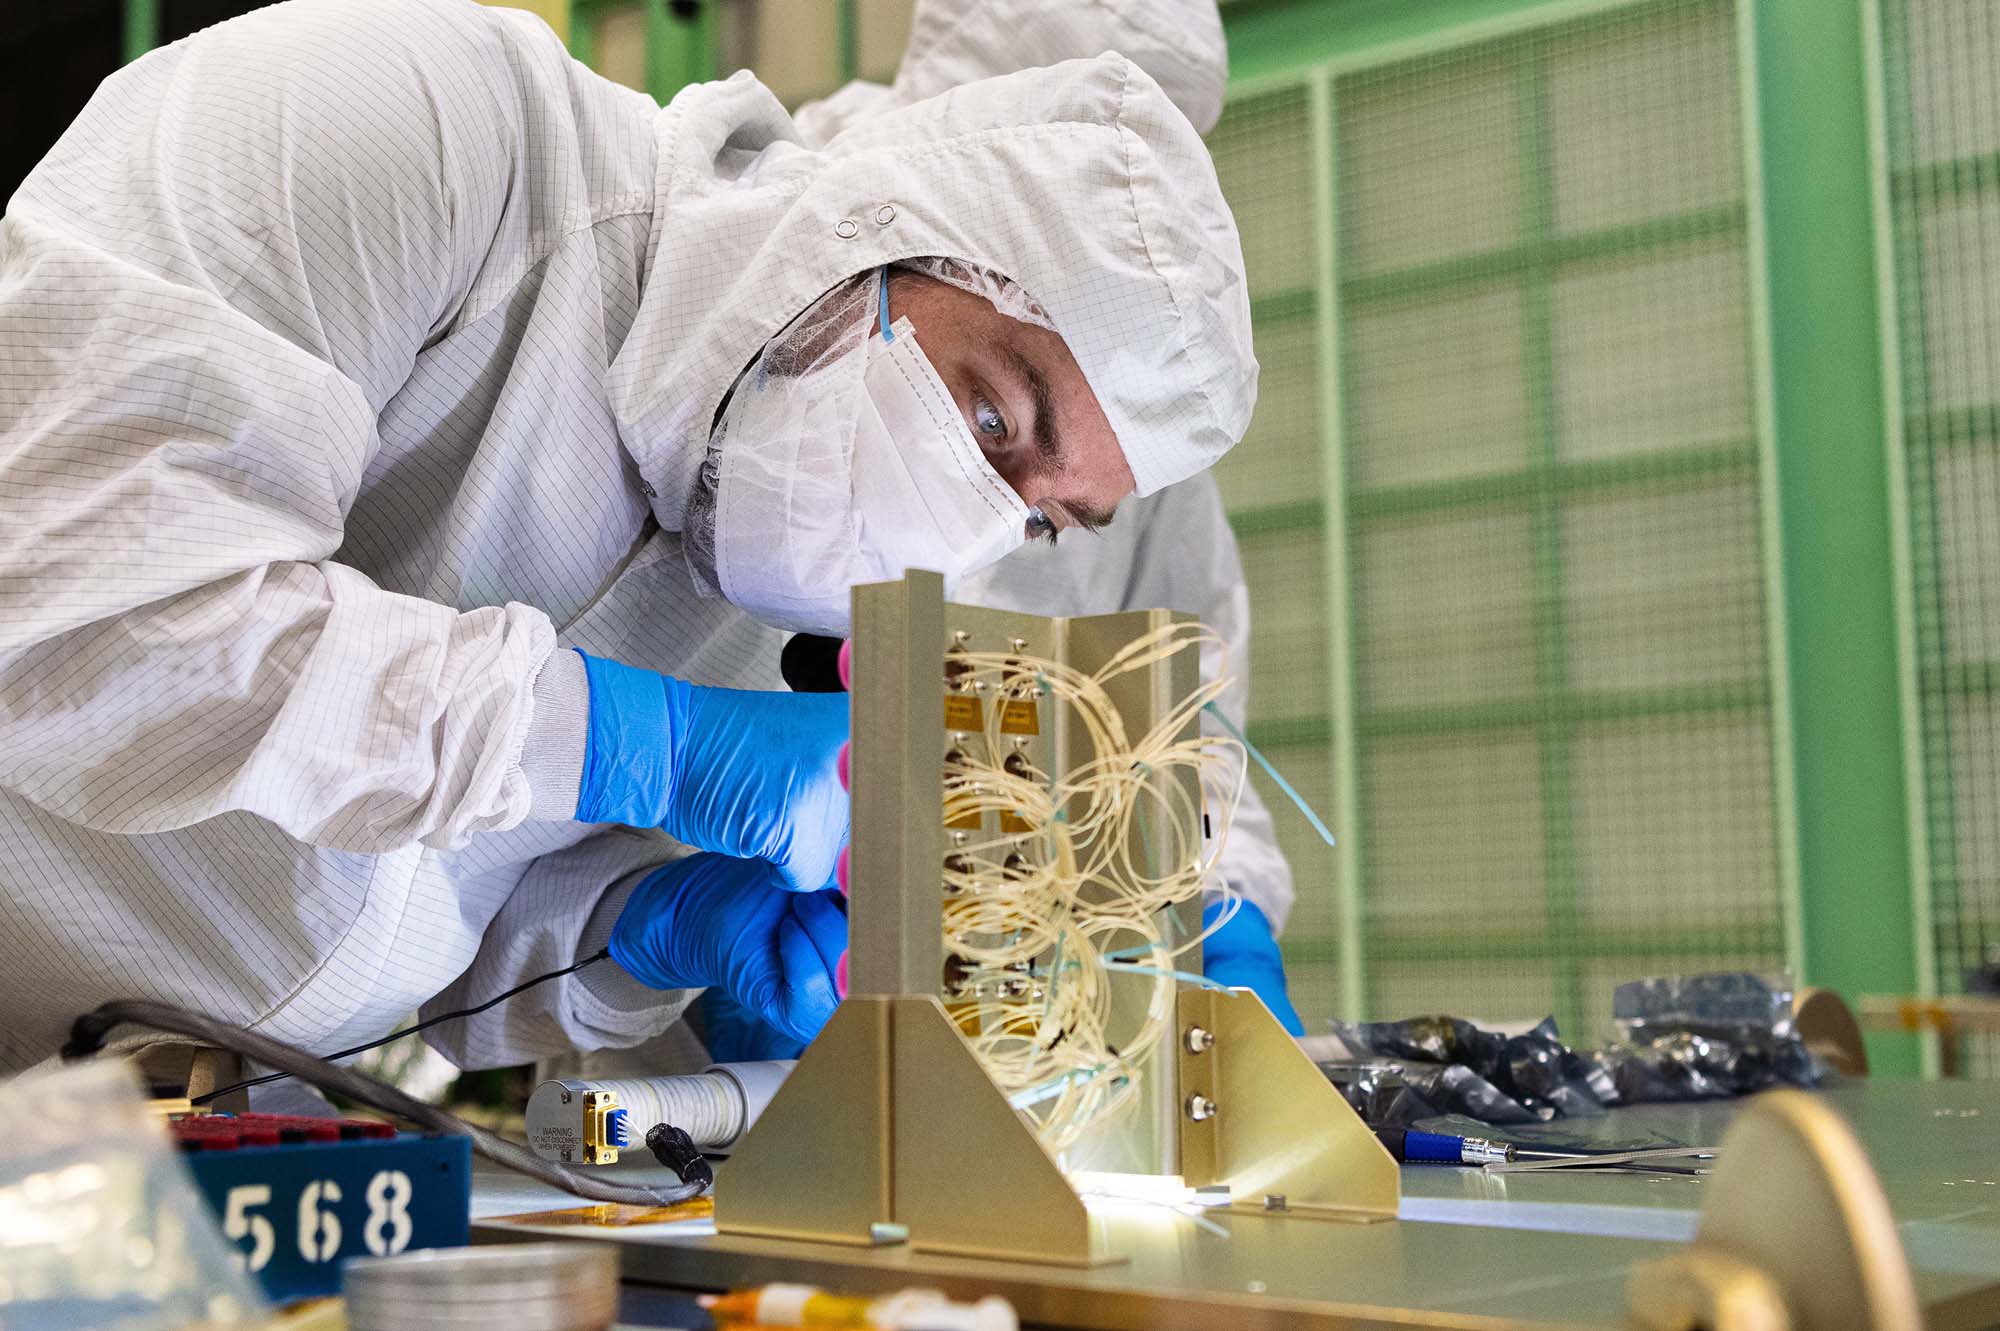
Install Flight HARP2 to PACE Spacecraft +Y Panel; Quick photos of HARP2 Mechanical Integration onto PACE Spacecraft. Credit: NASA
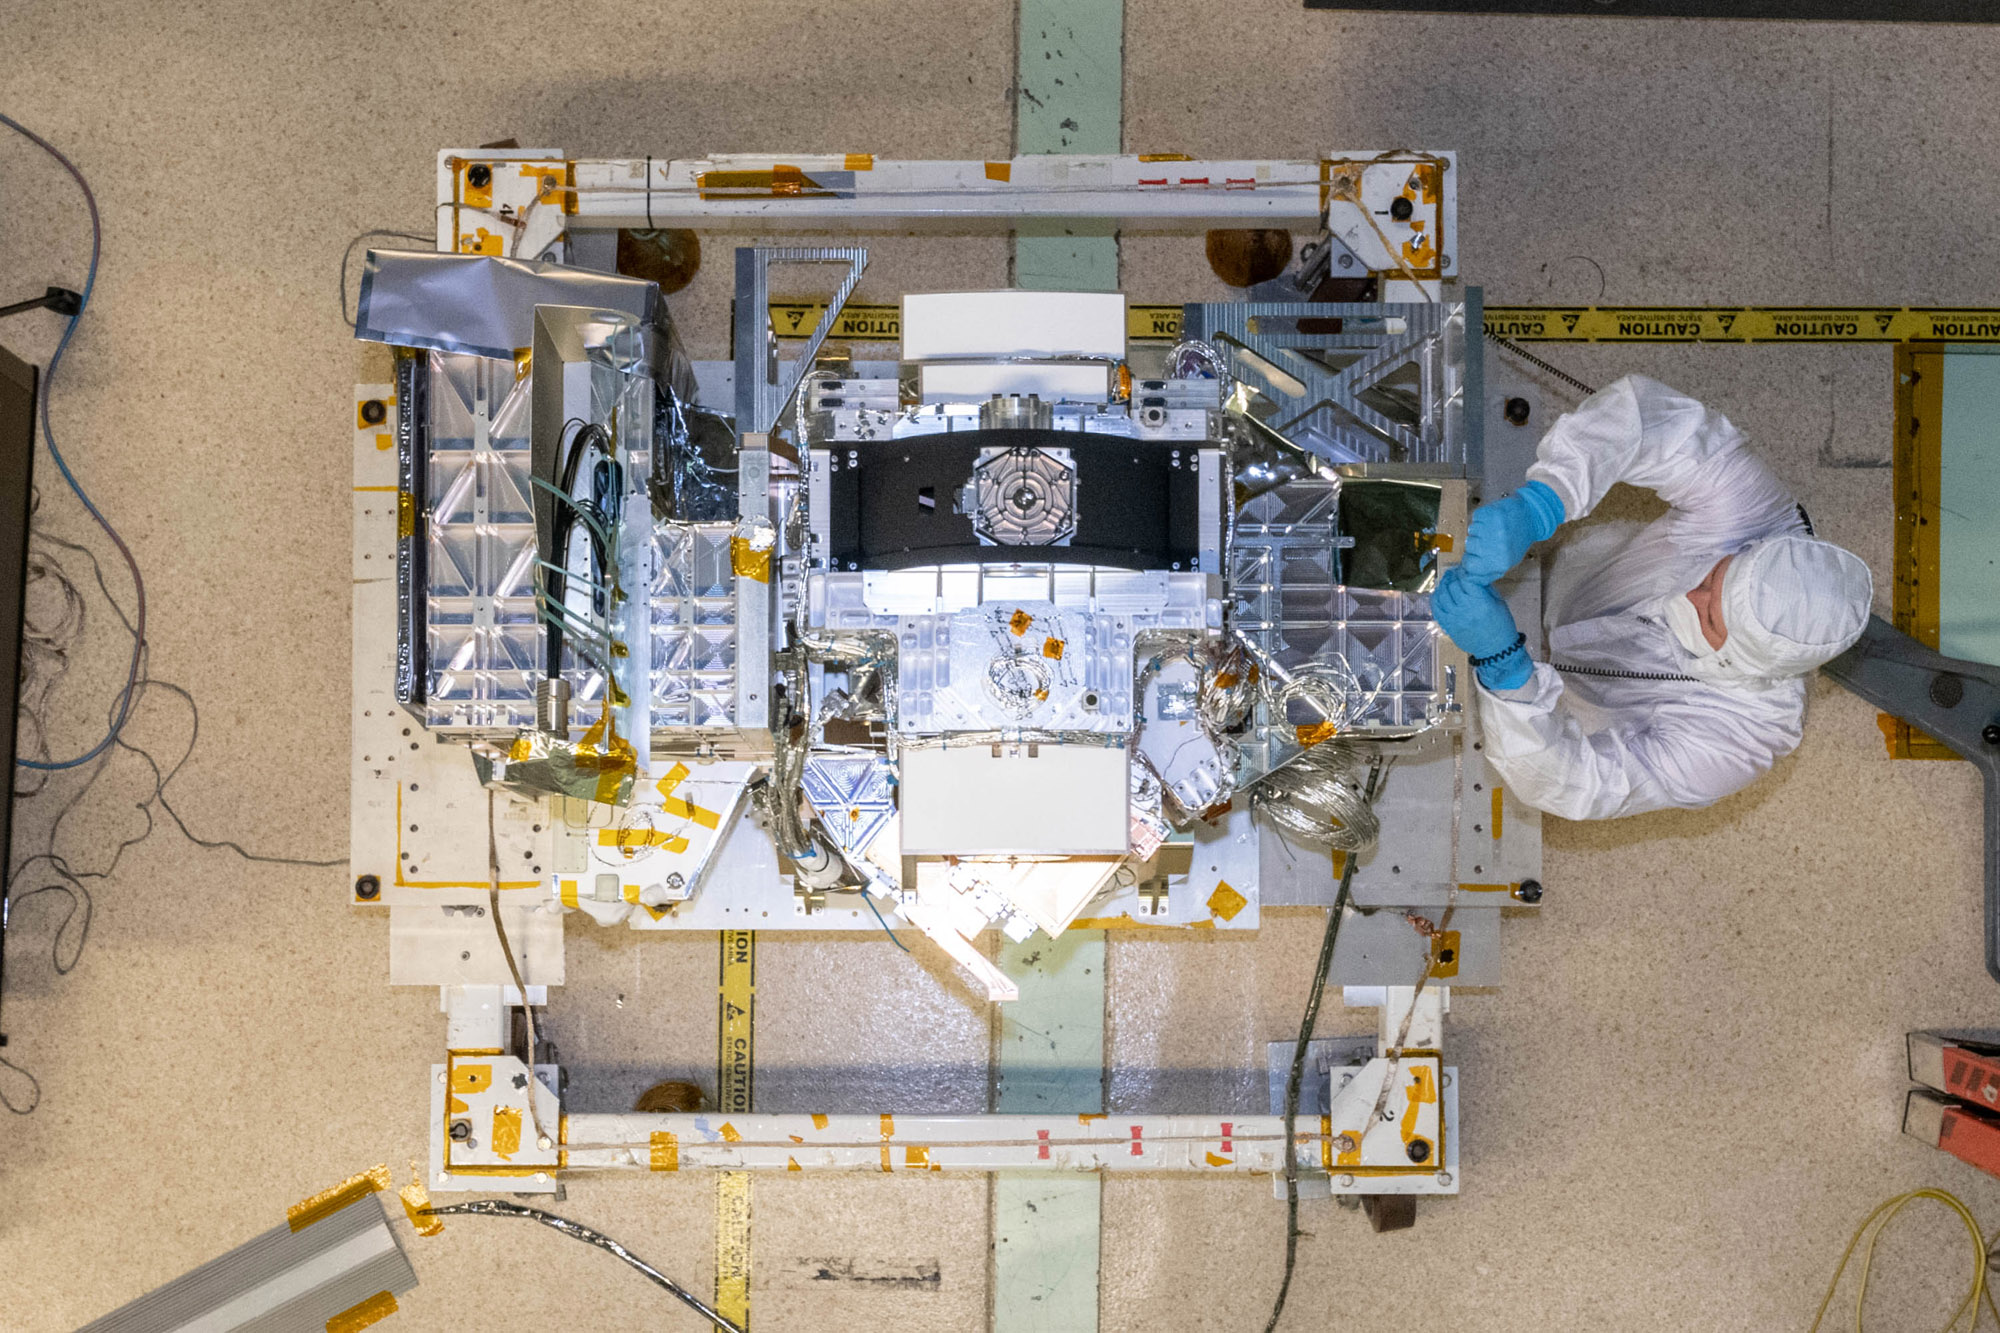
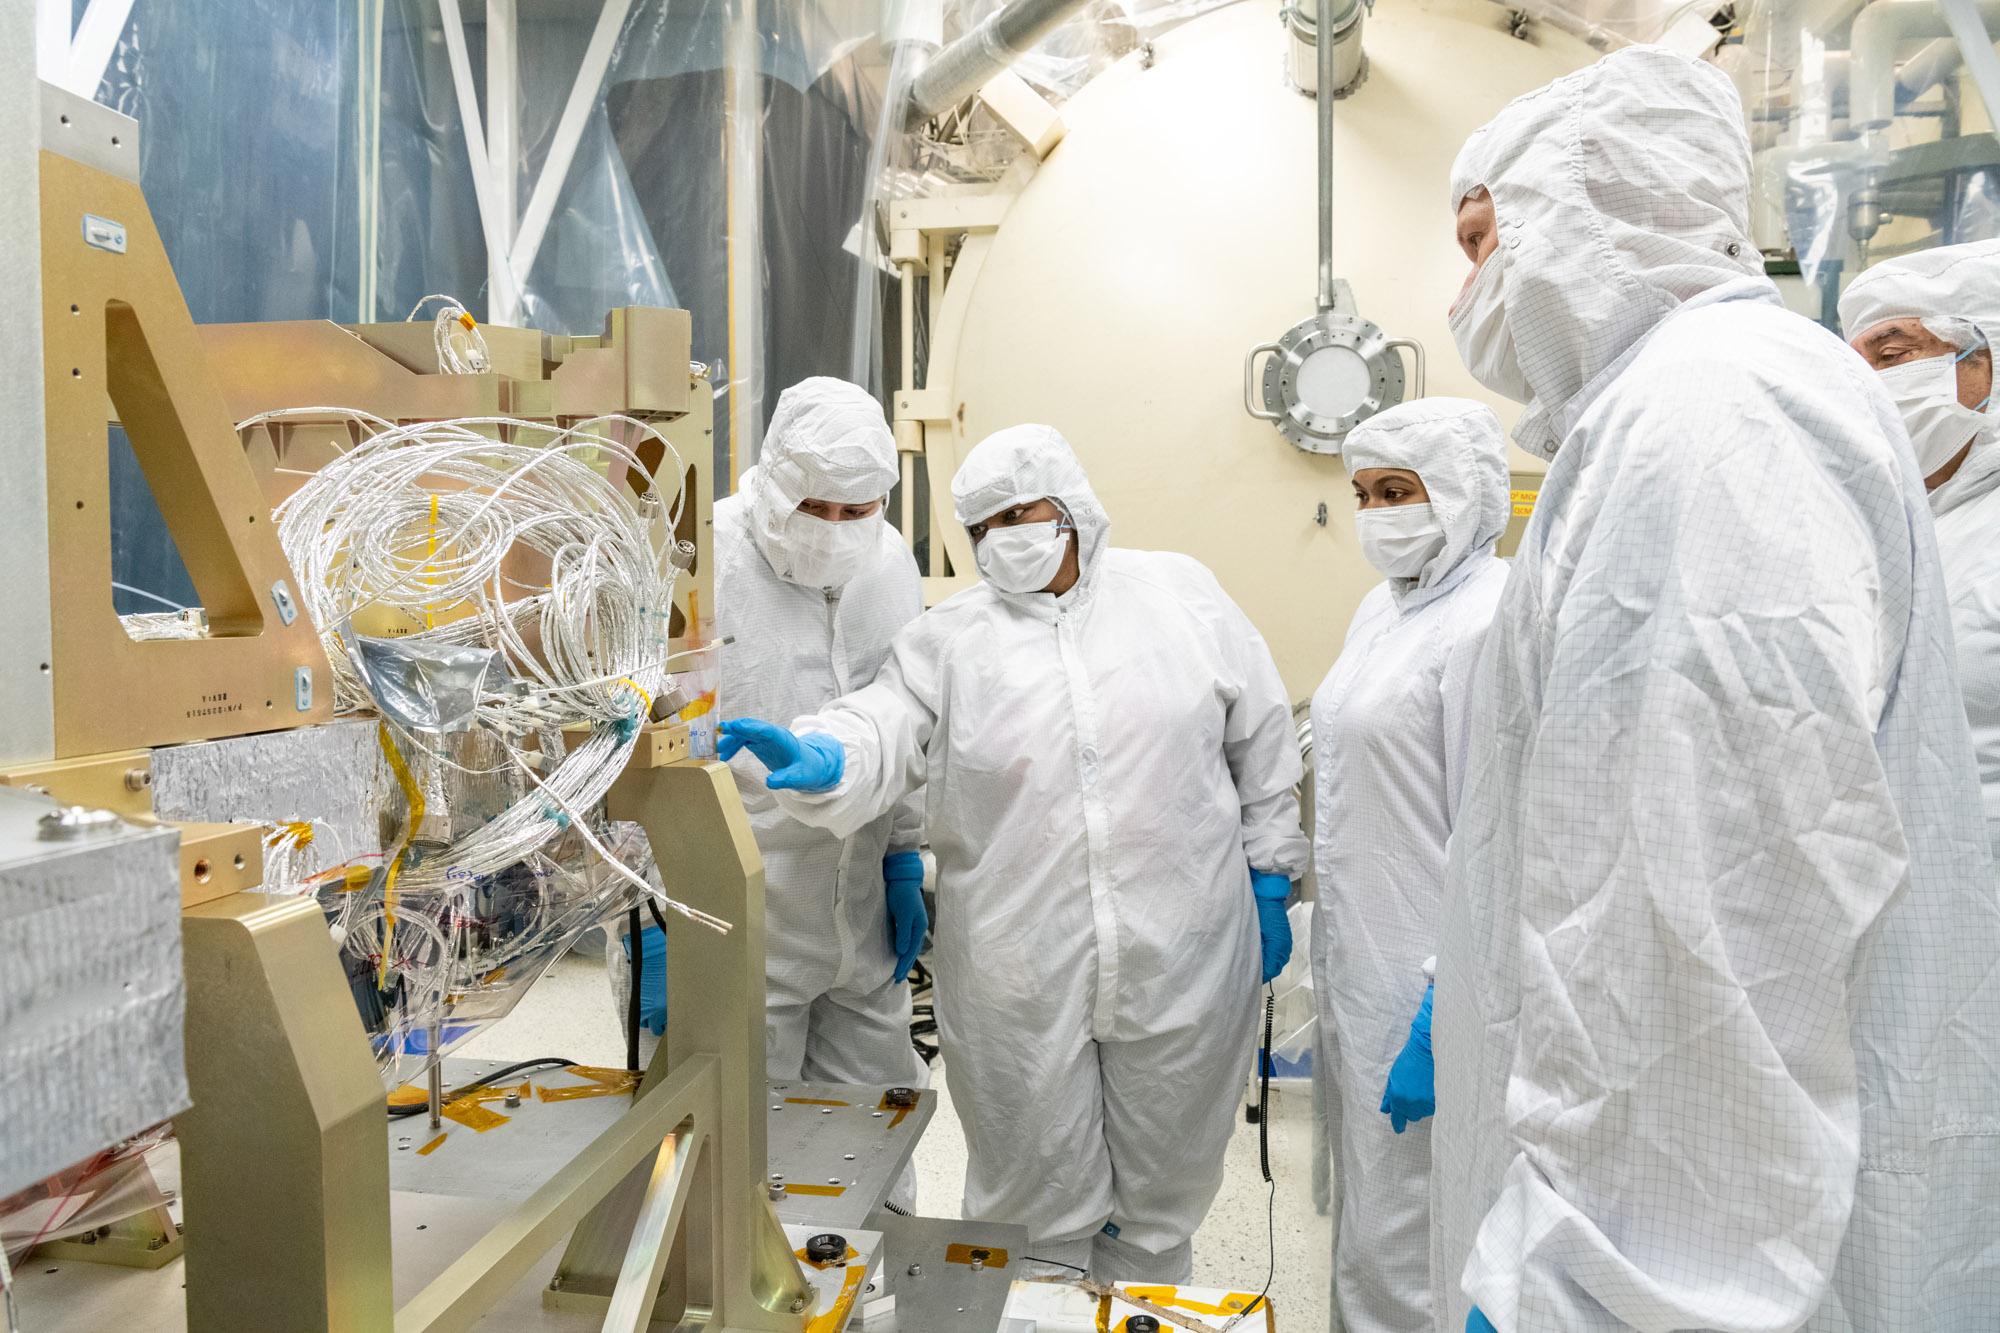
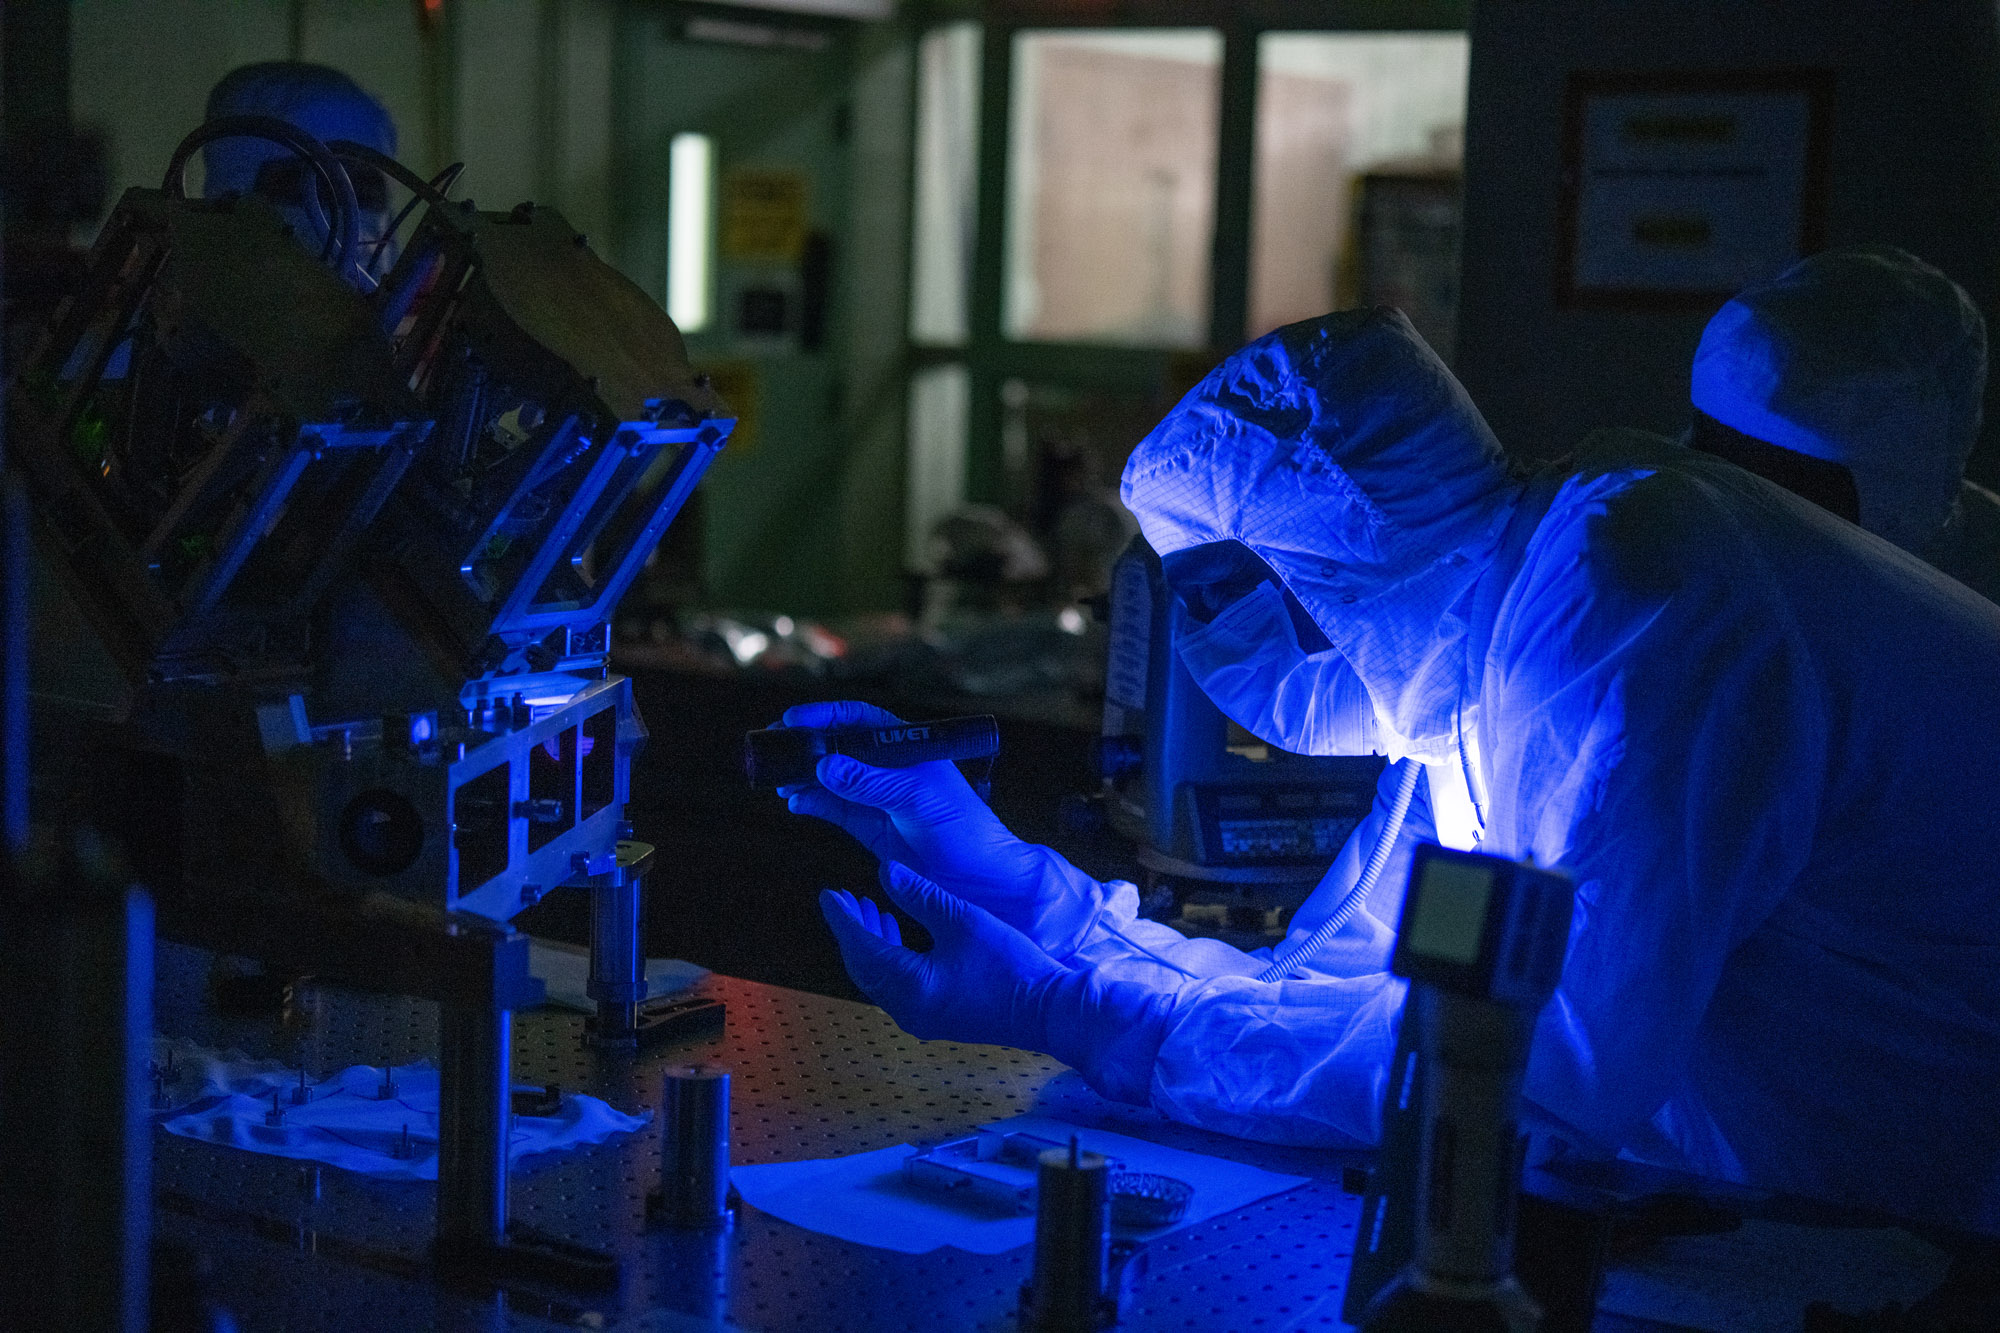
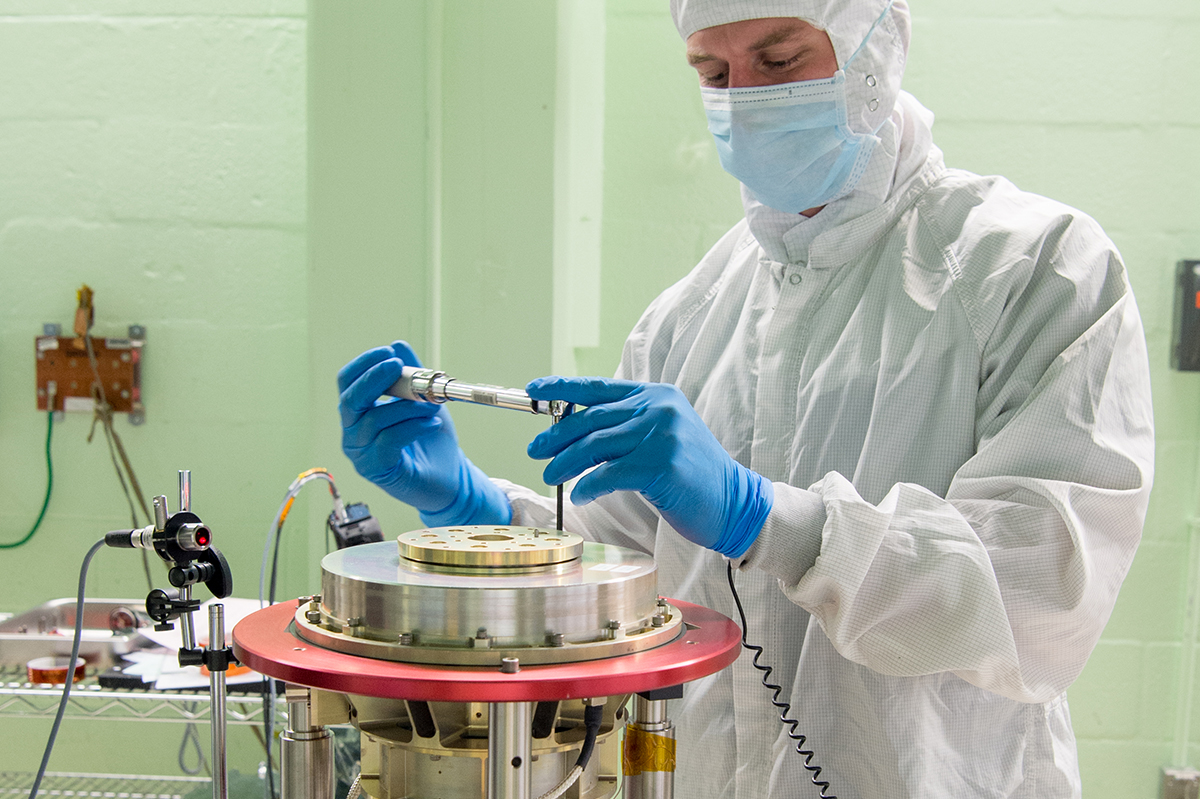
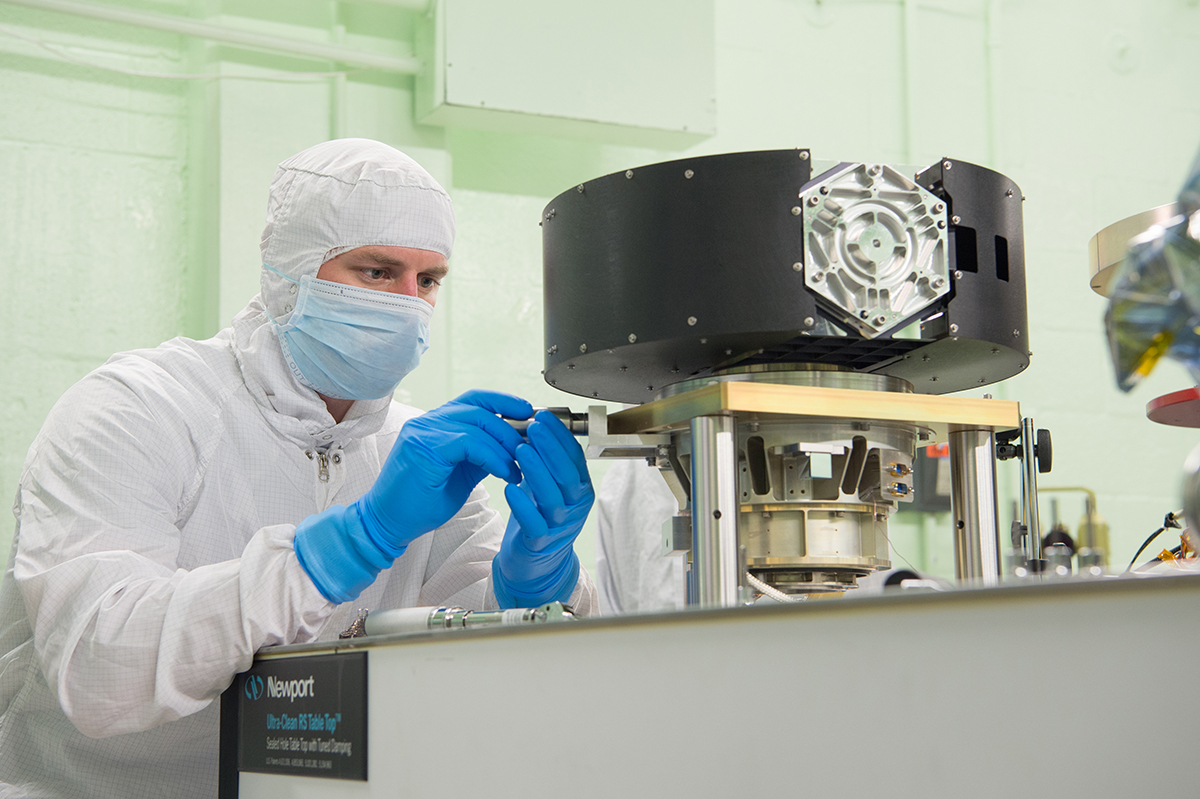
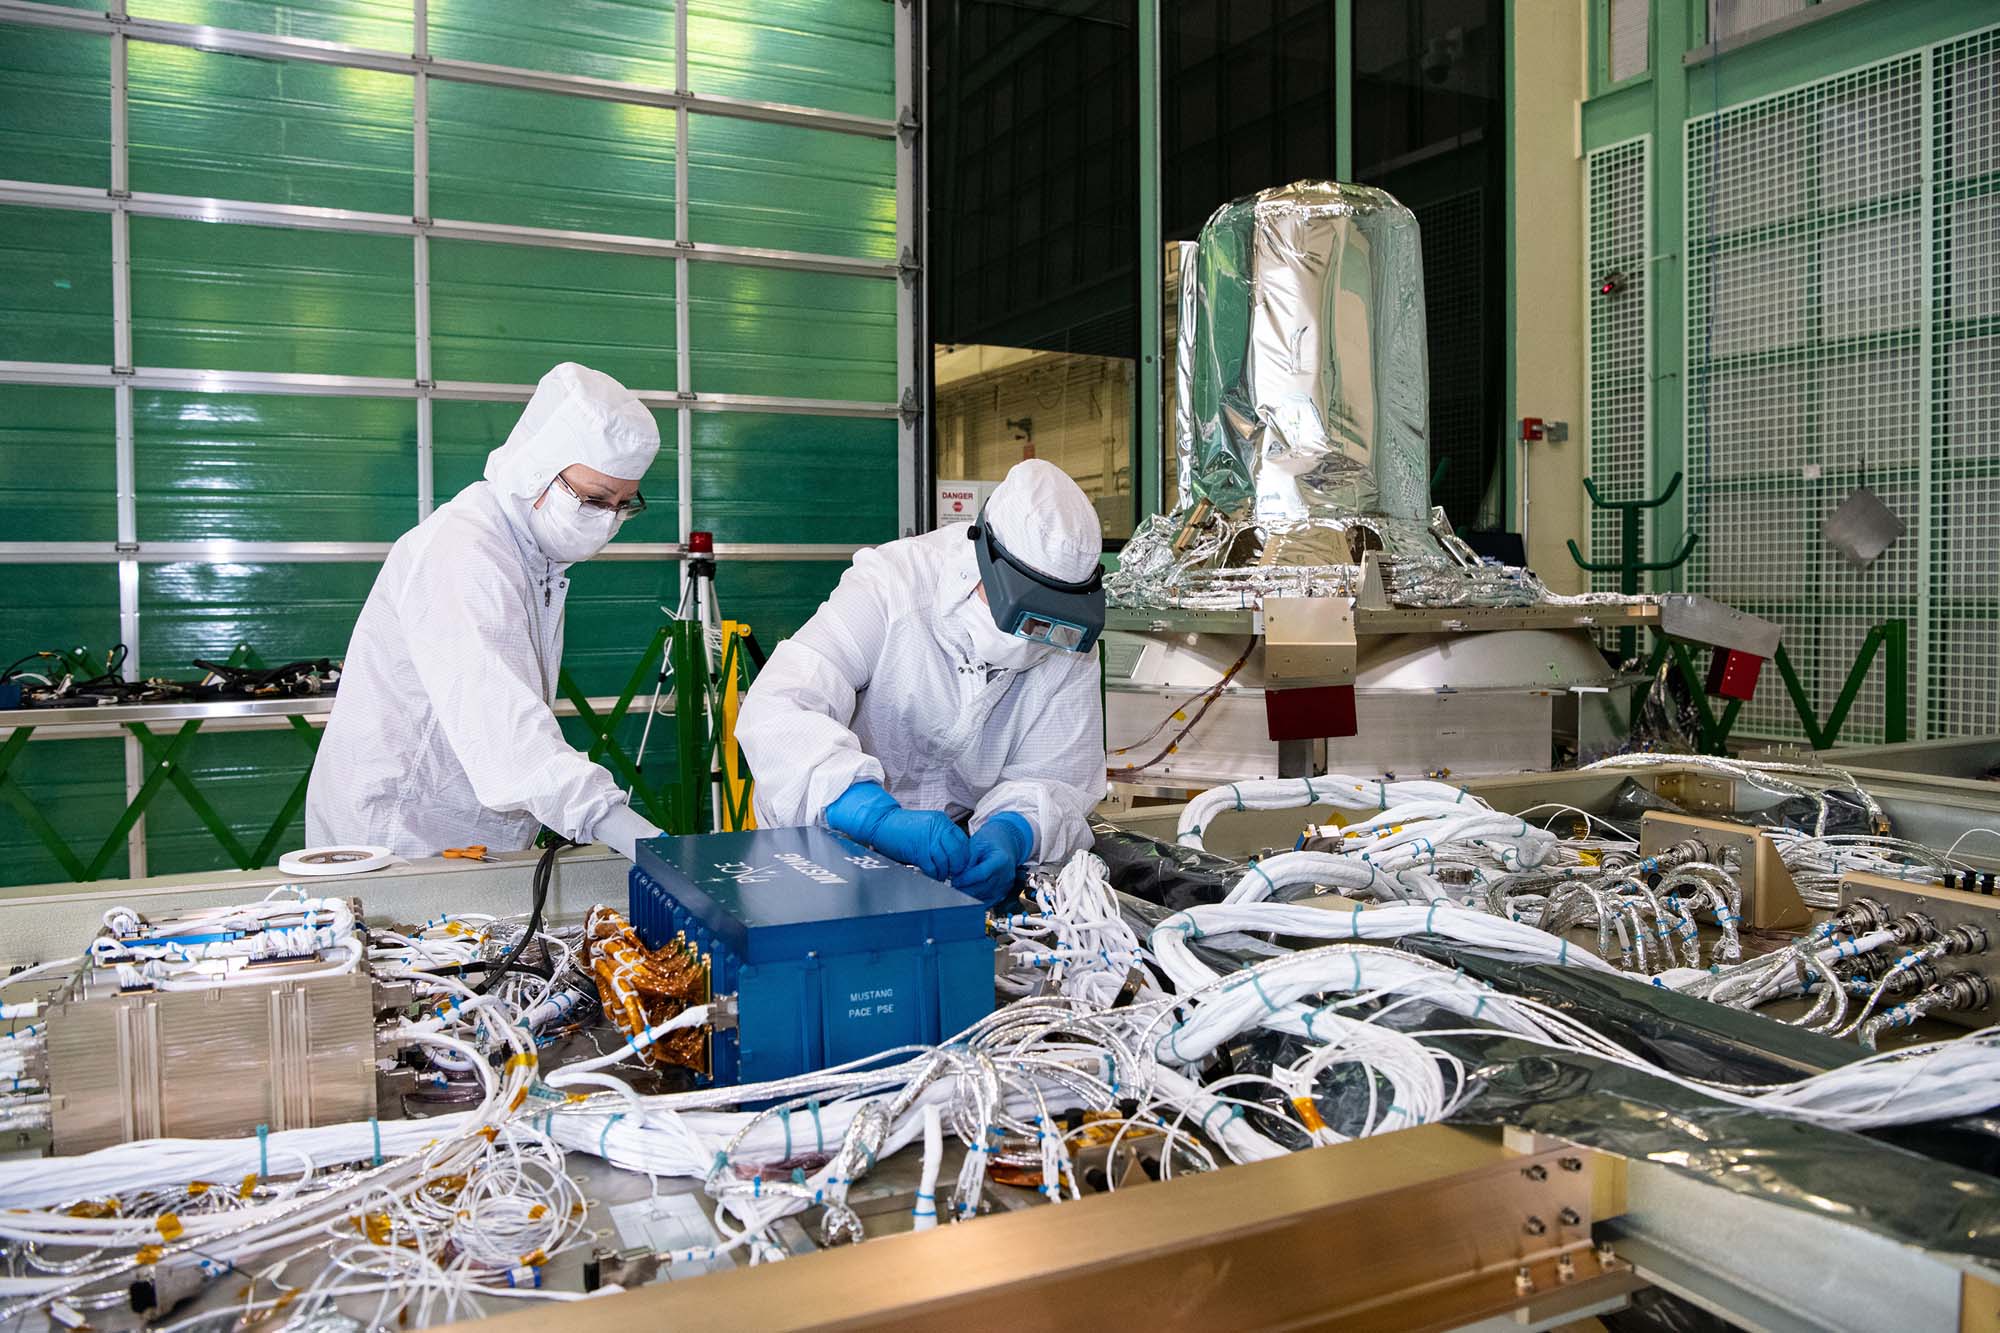
TV/TB Test of HARP2 Instrument; HARP2 calibration testing Setup with red light stills and video. Credit: NASA
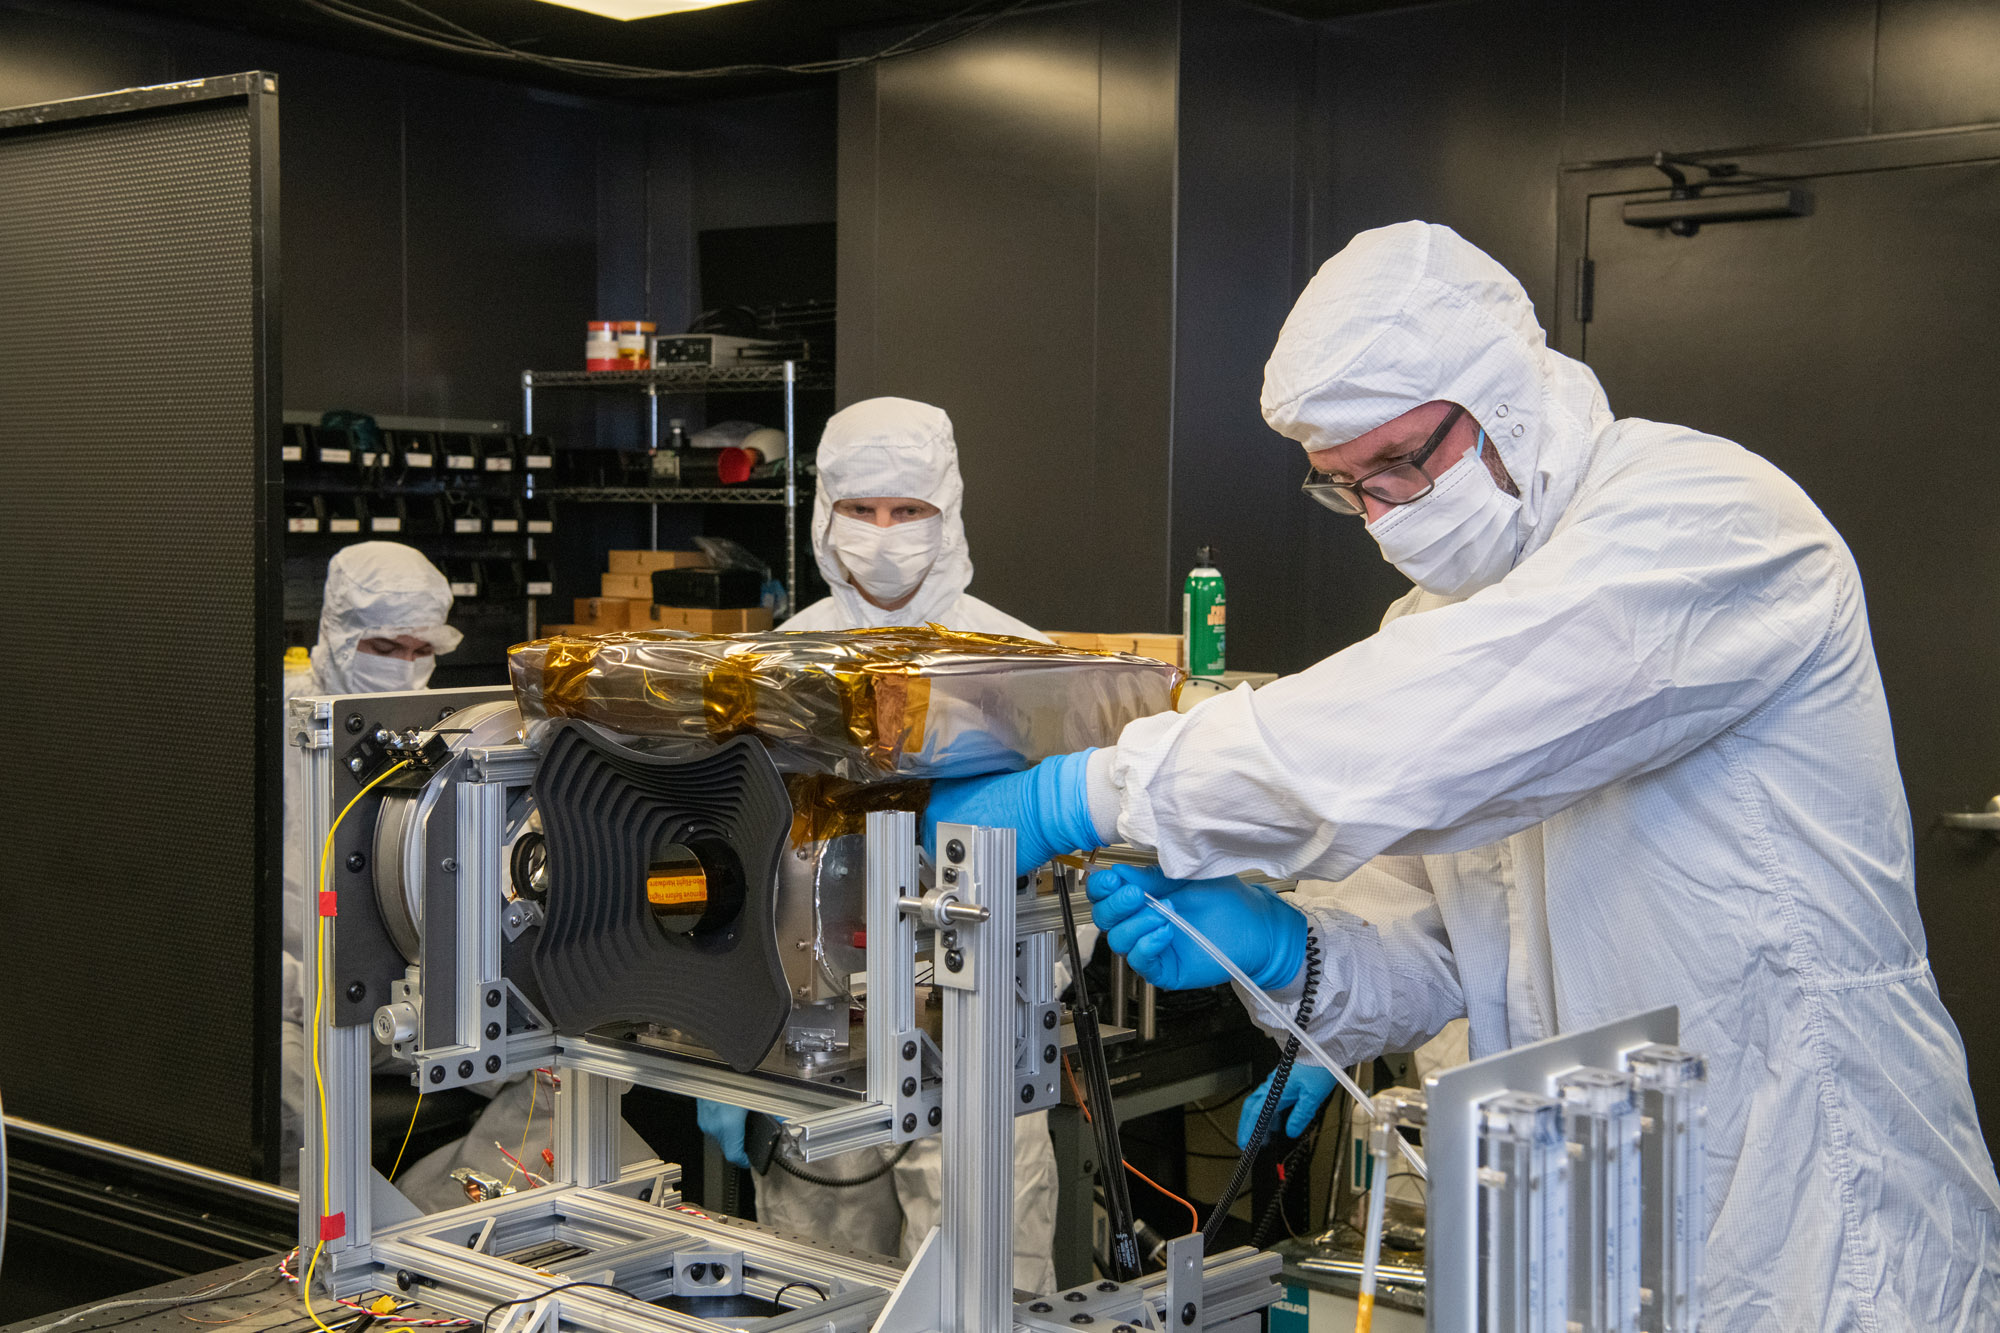
HARP2 calibration testing setup inGSFC Bldg 33; TV/TB Test of HARP2 Instrument. Credit: NASA
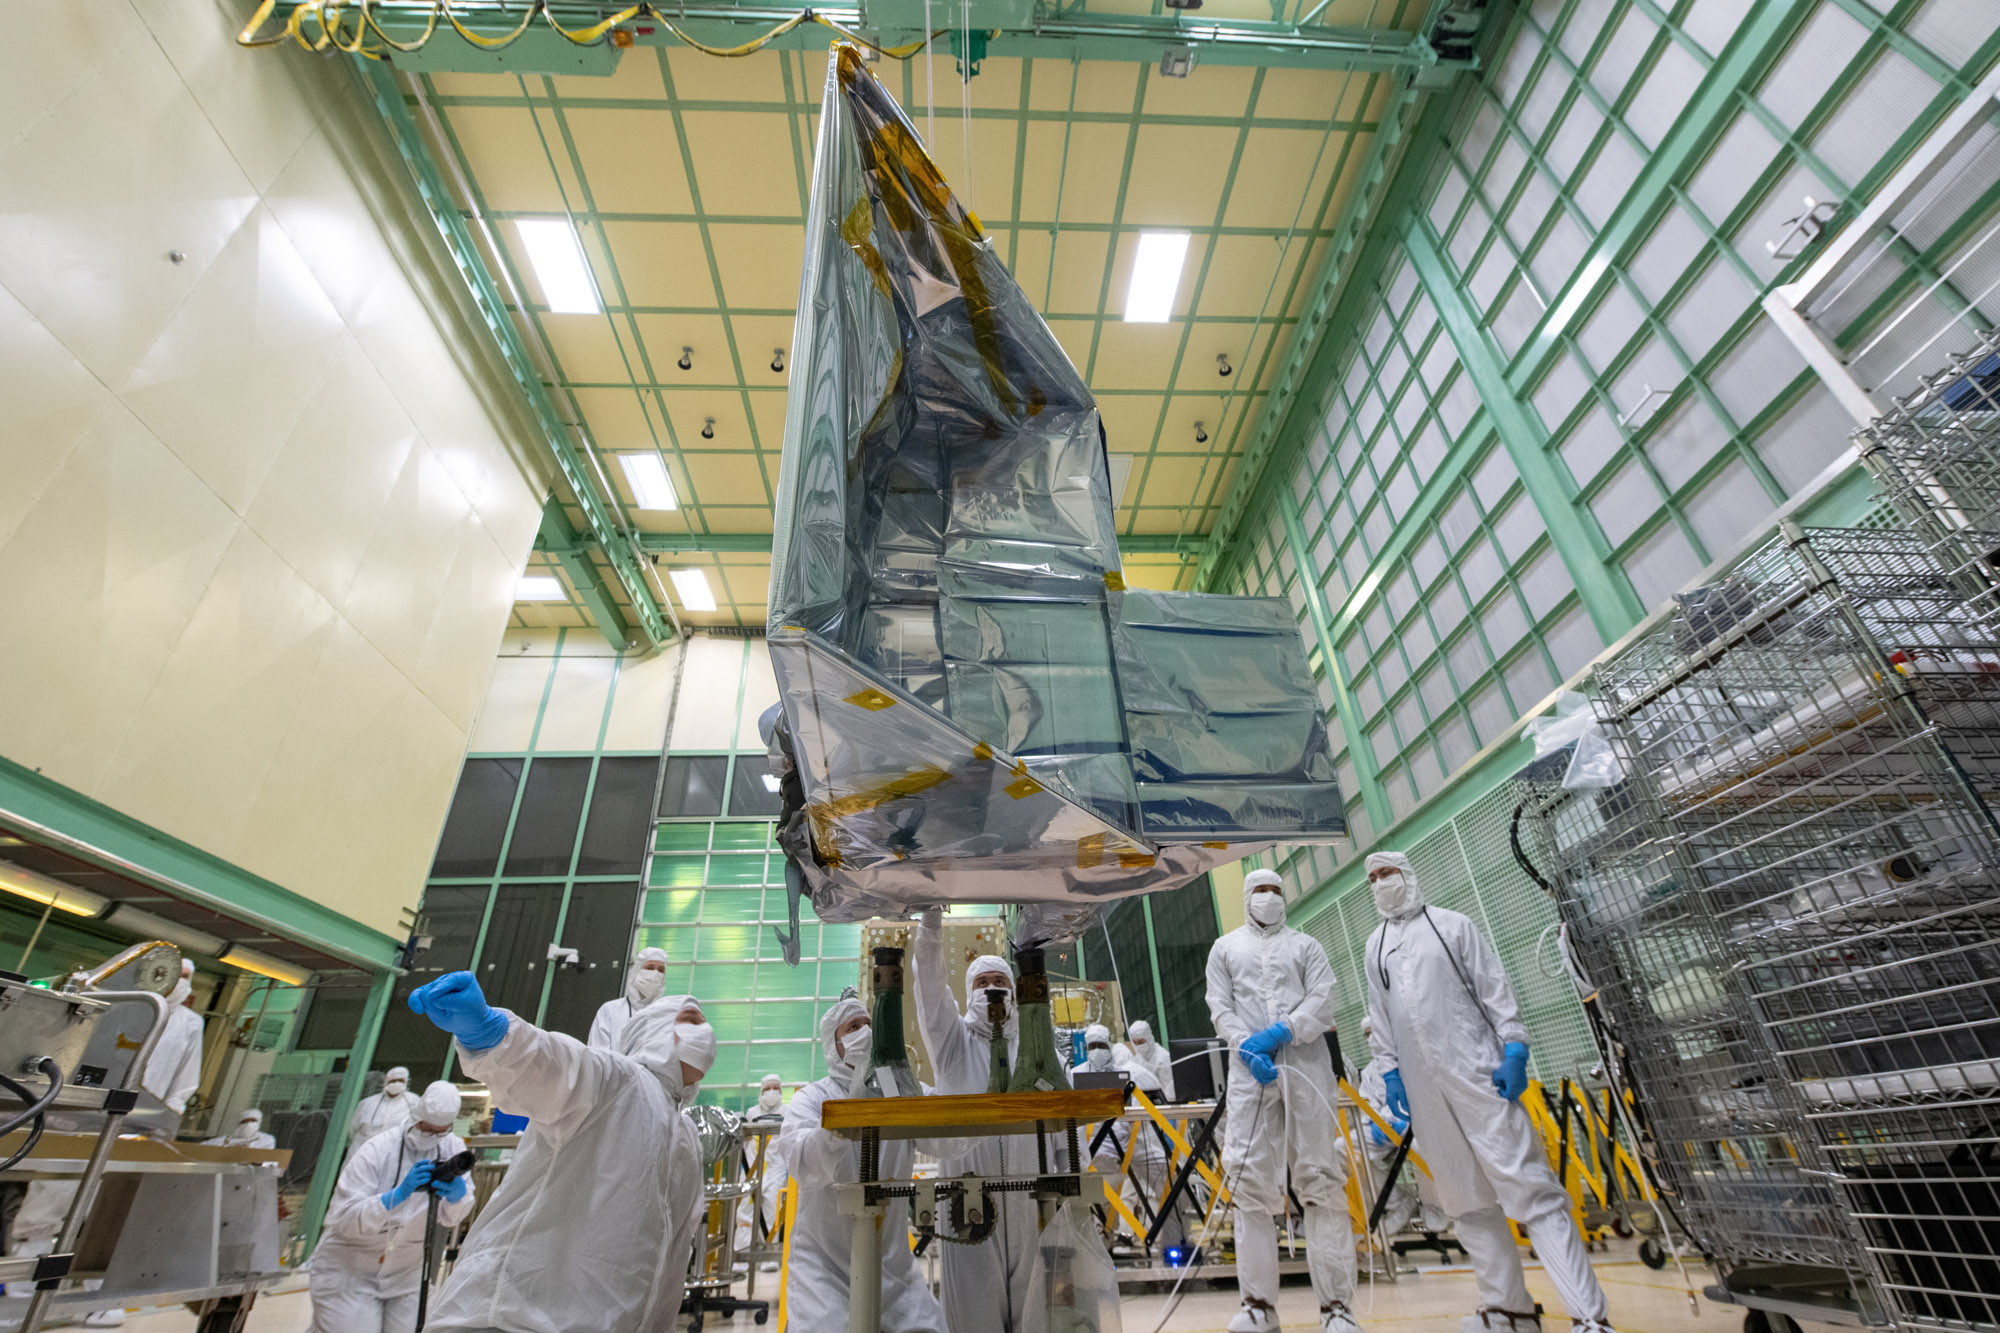
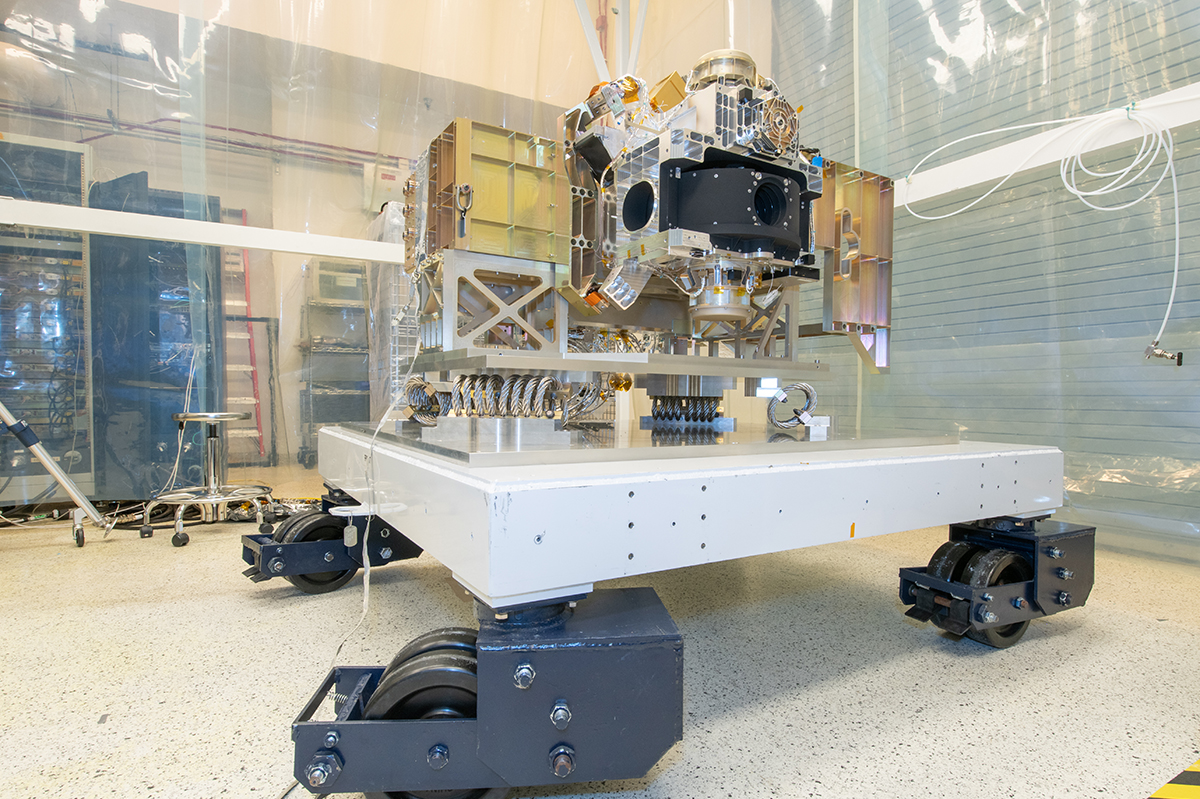
Transporting HARP2 polarimter to thermal vacuum chamber. Credit: Mellos, Katherine
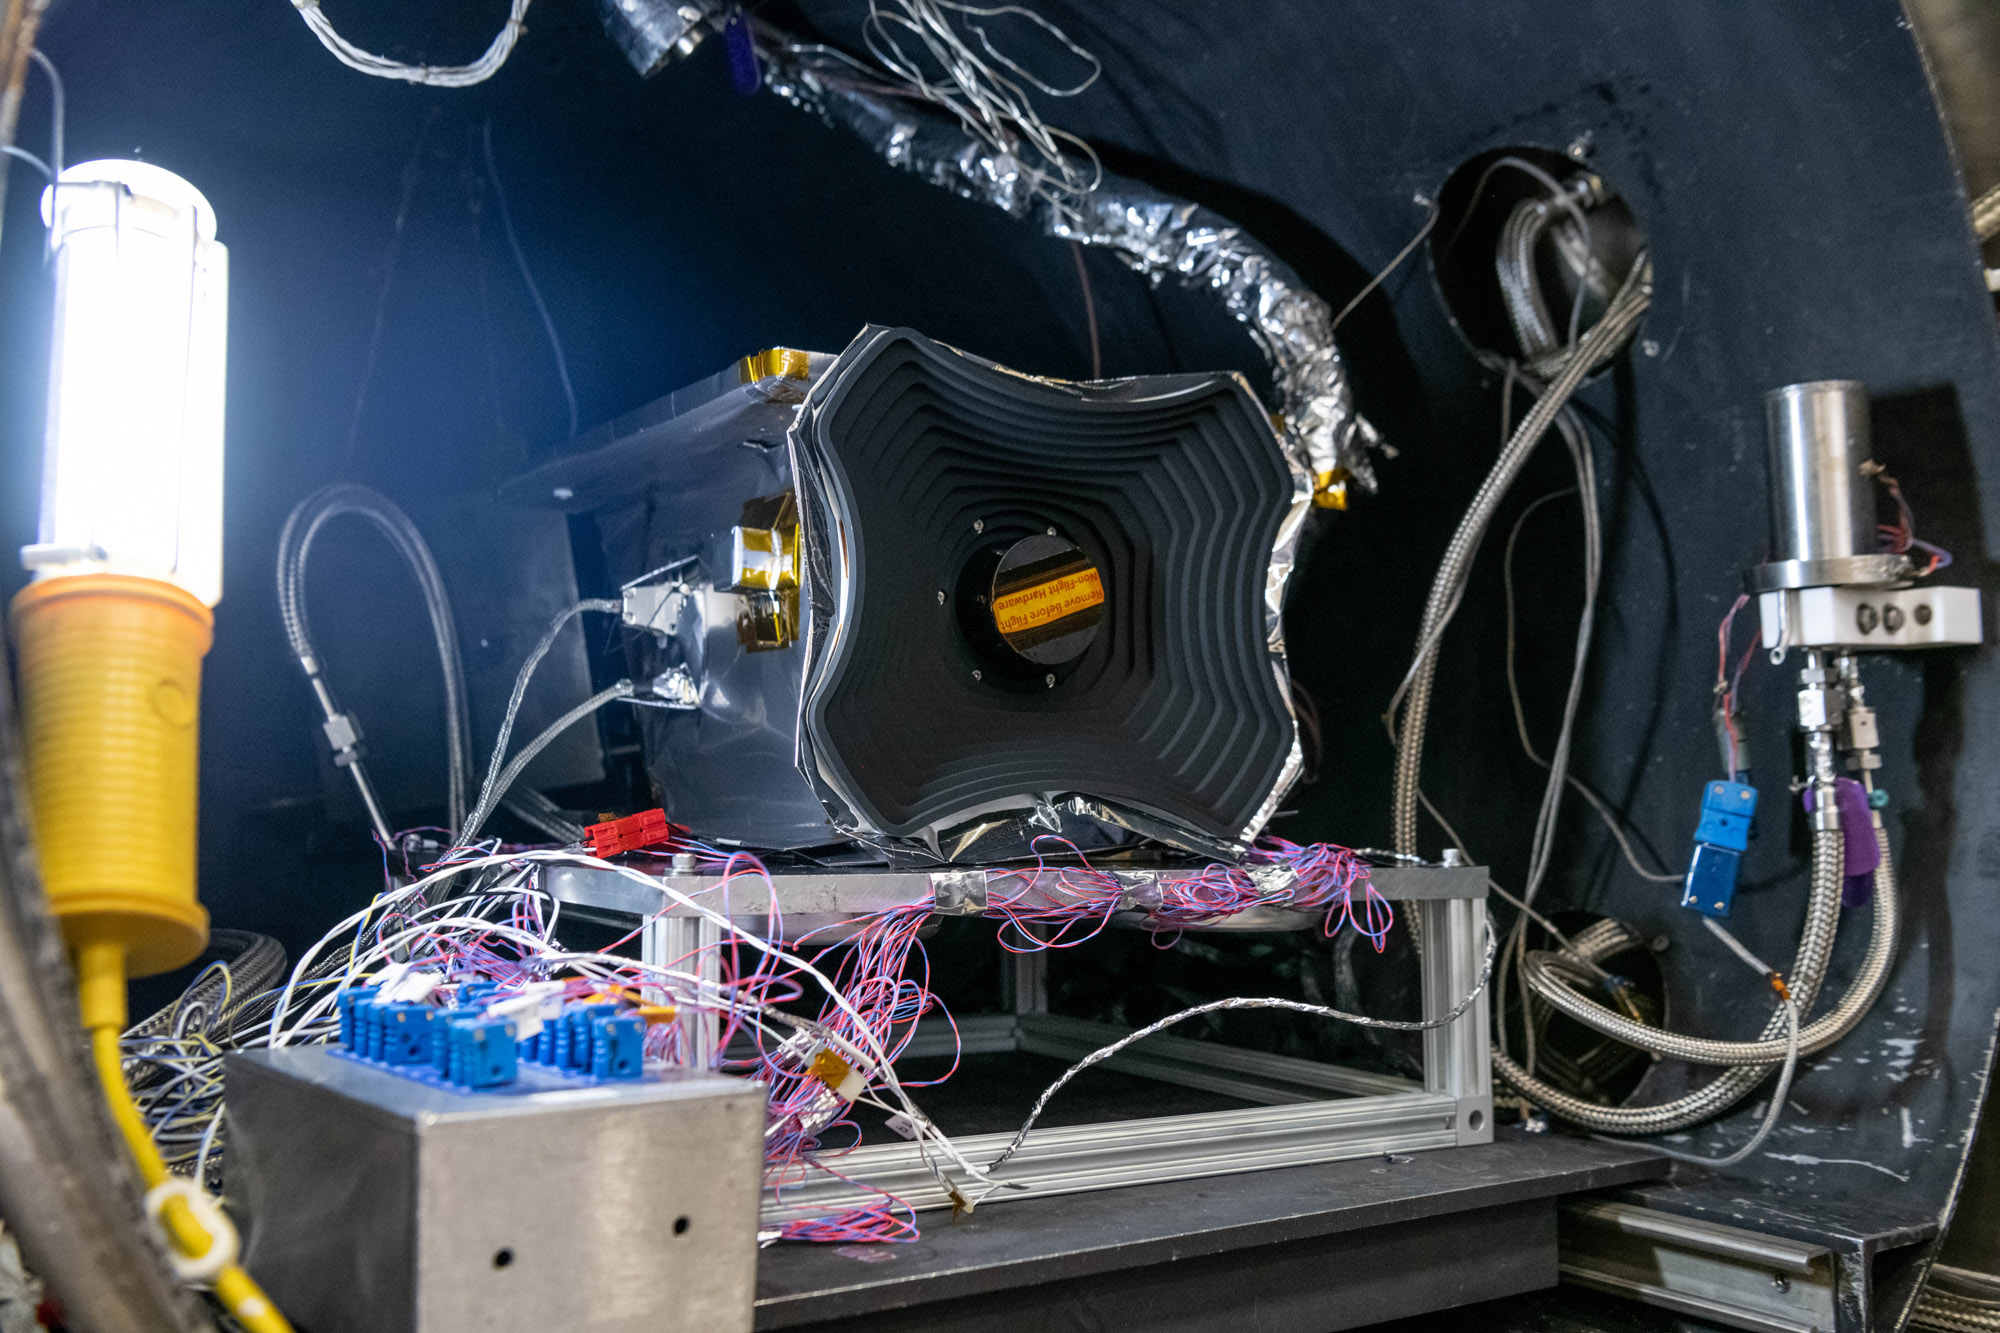
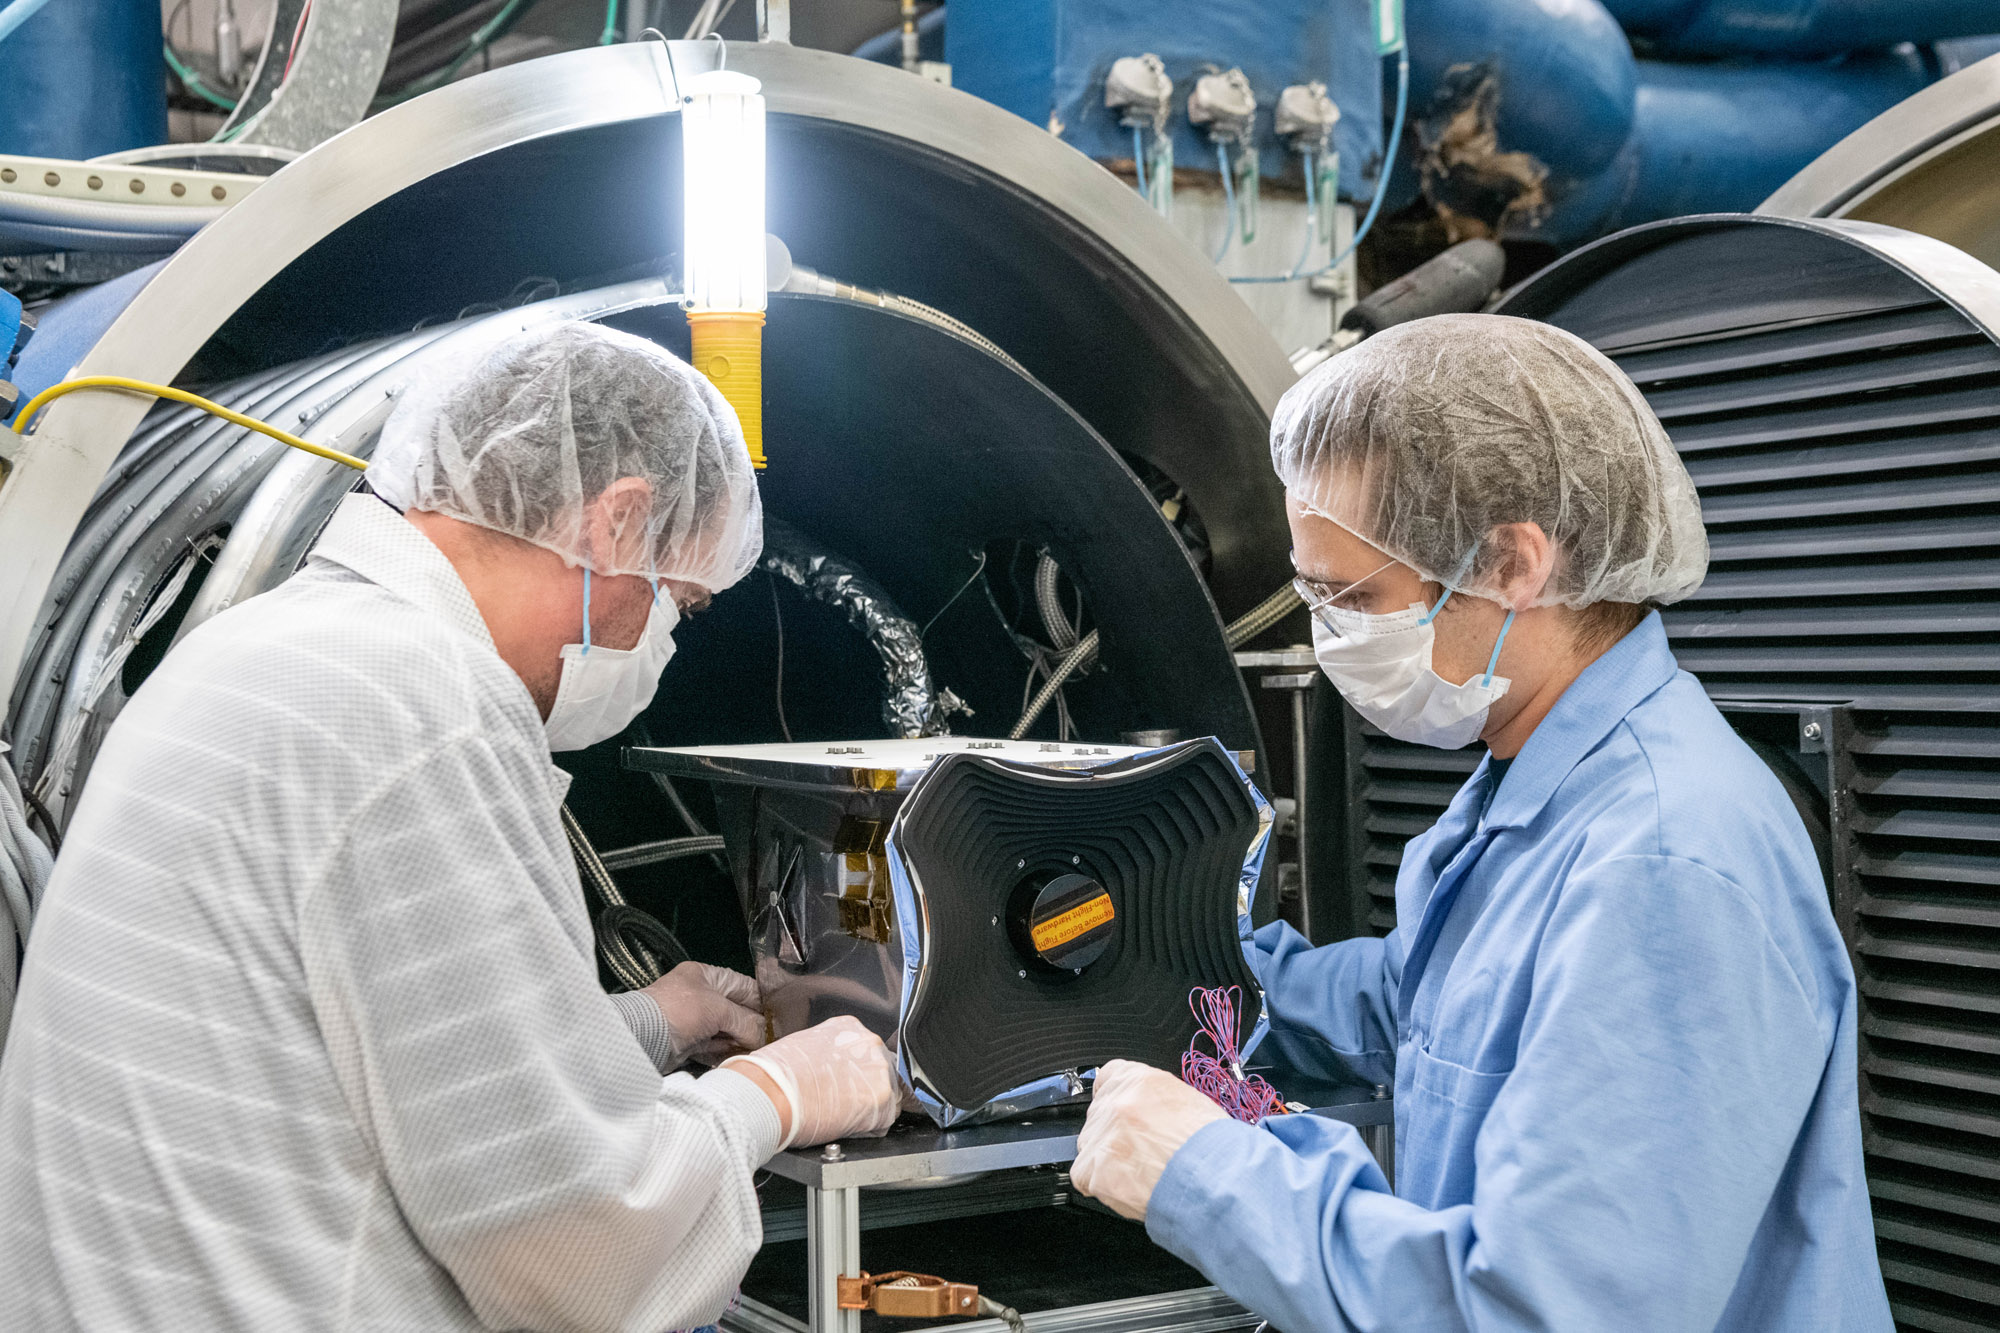
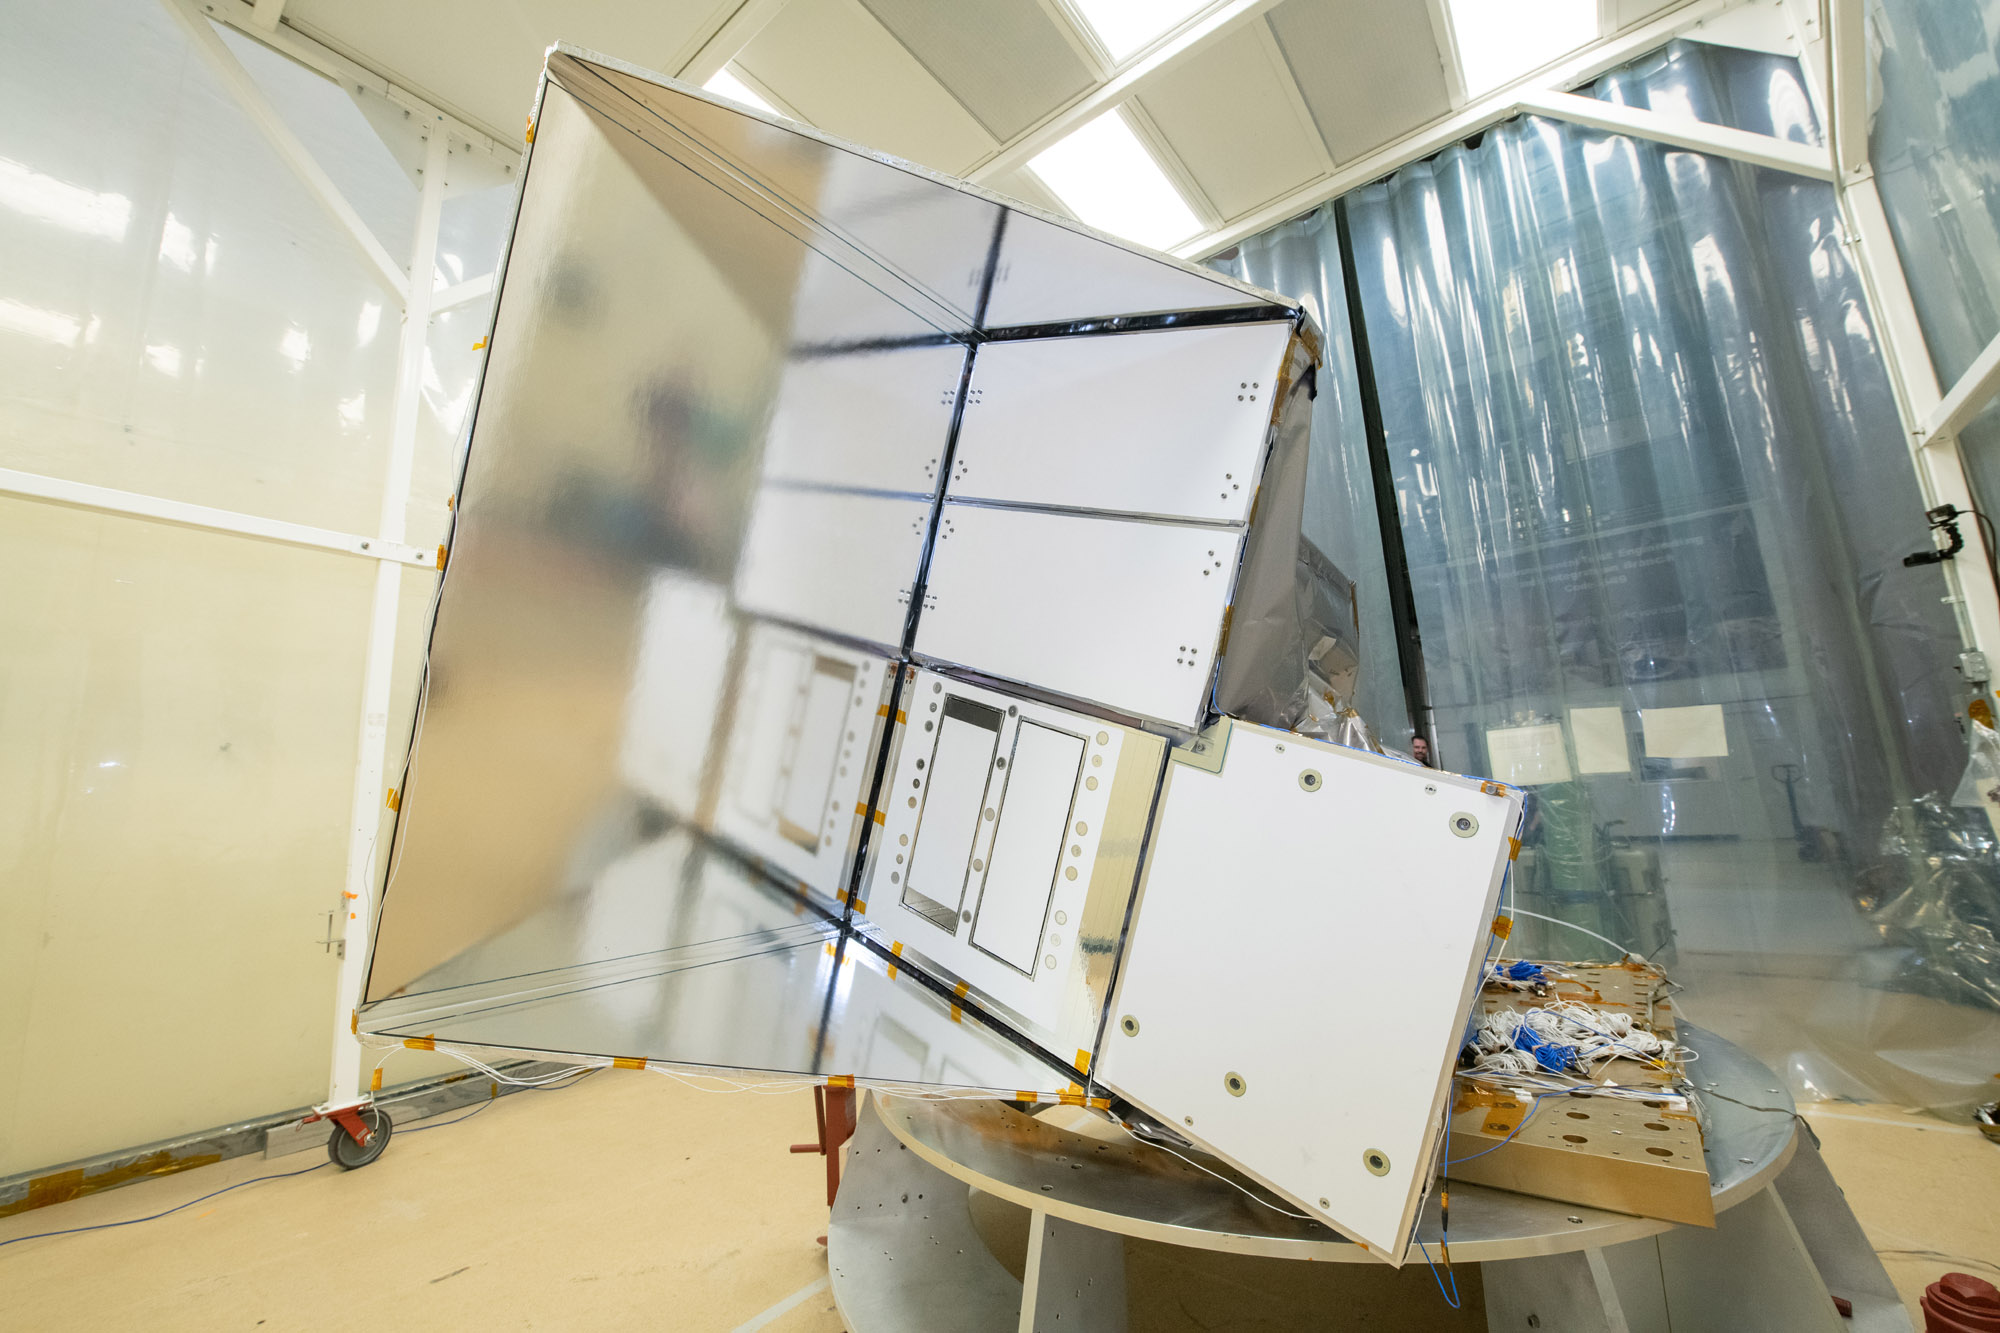
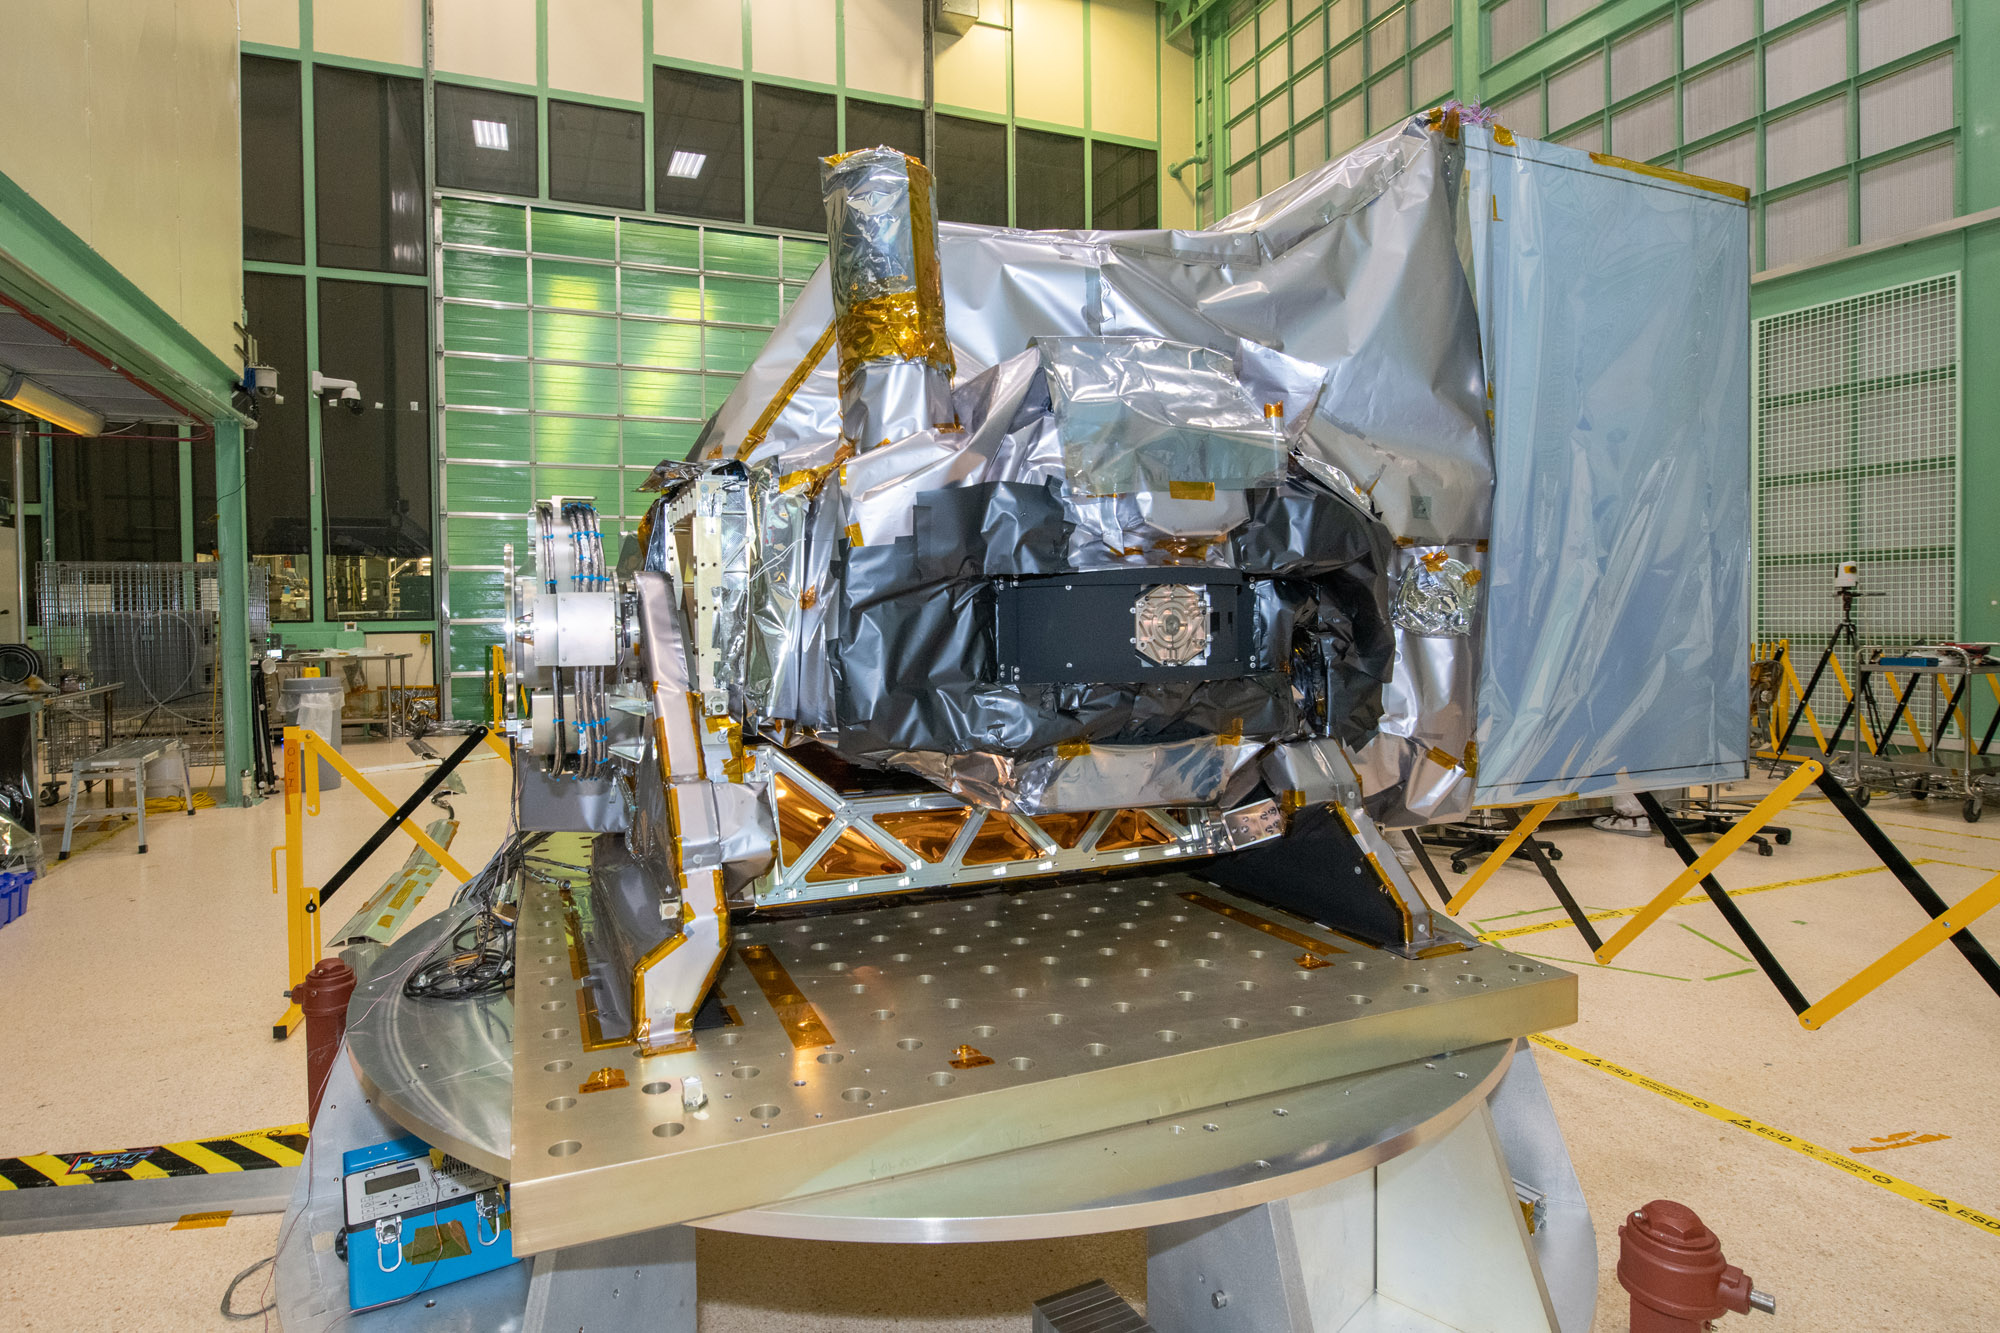
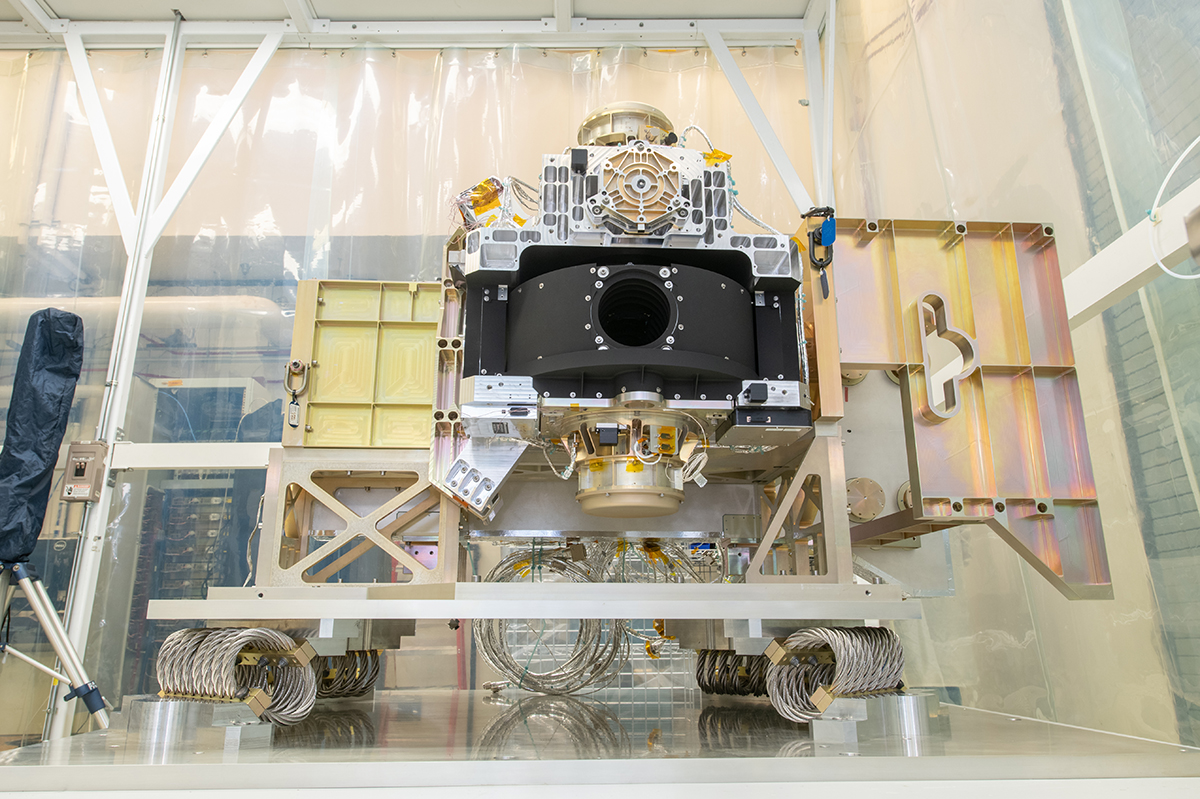
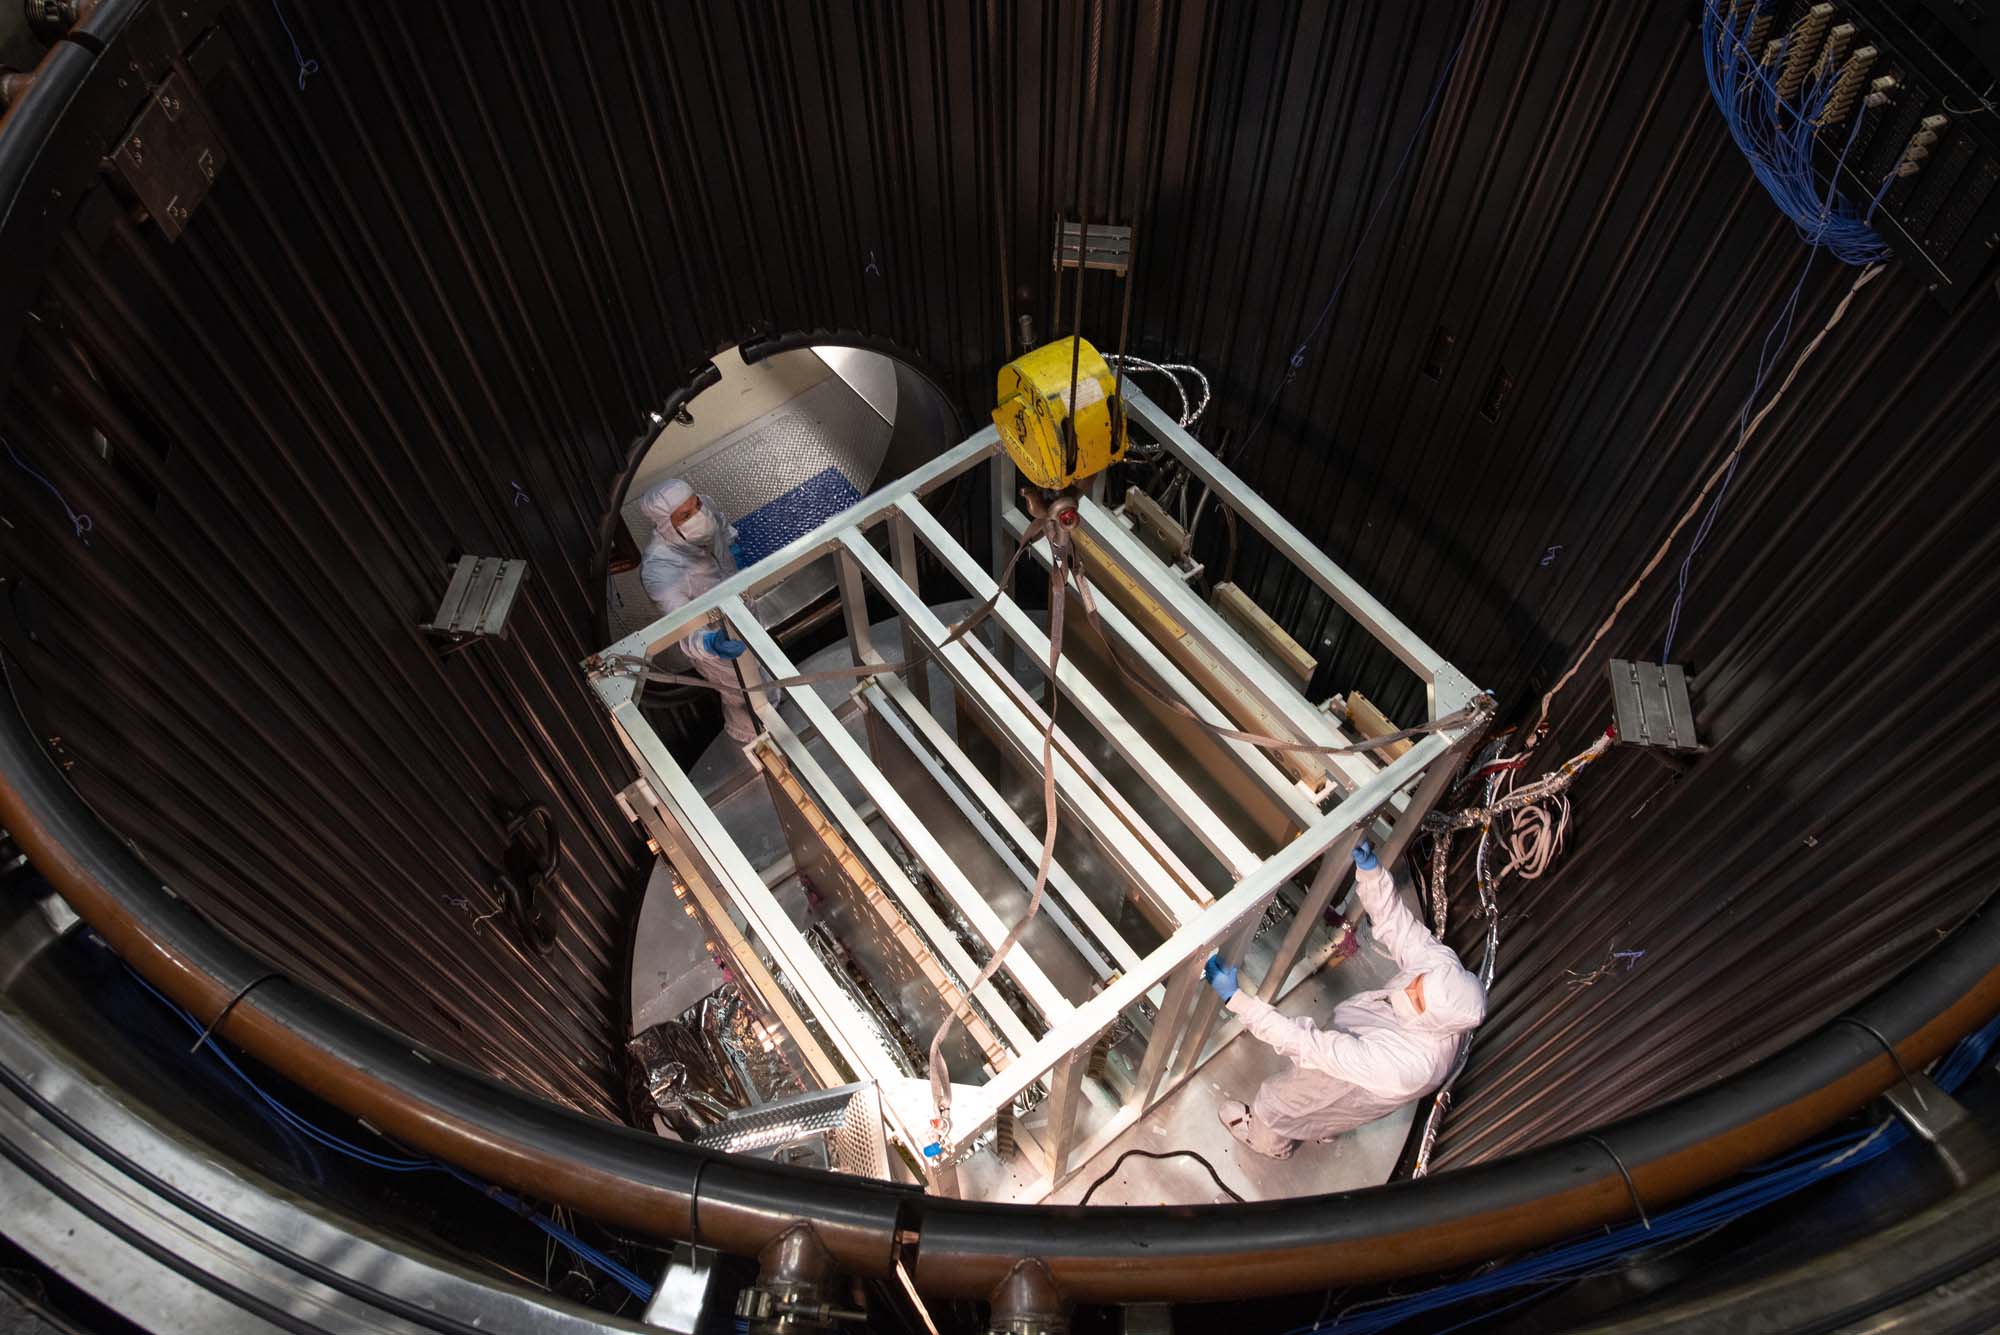
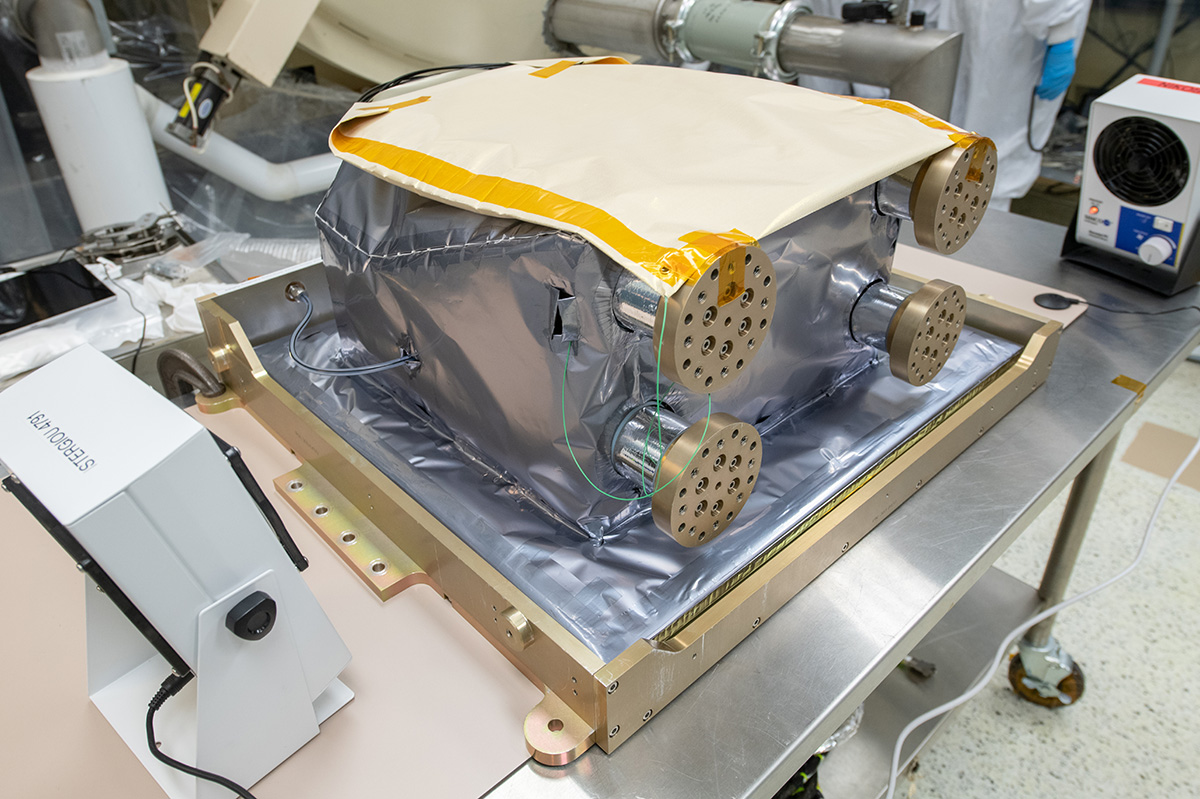
HARP2 polarimeter installed in chamber for pre-thermal testing. Credit: Mellos, Katherine
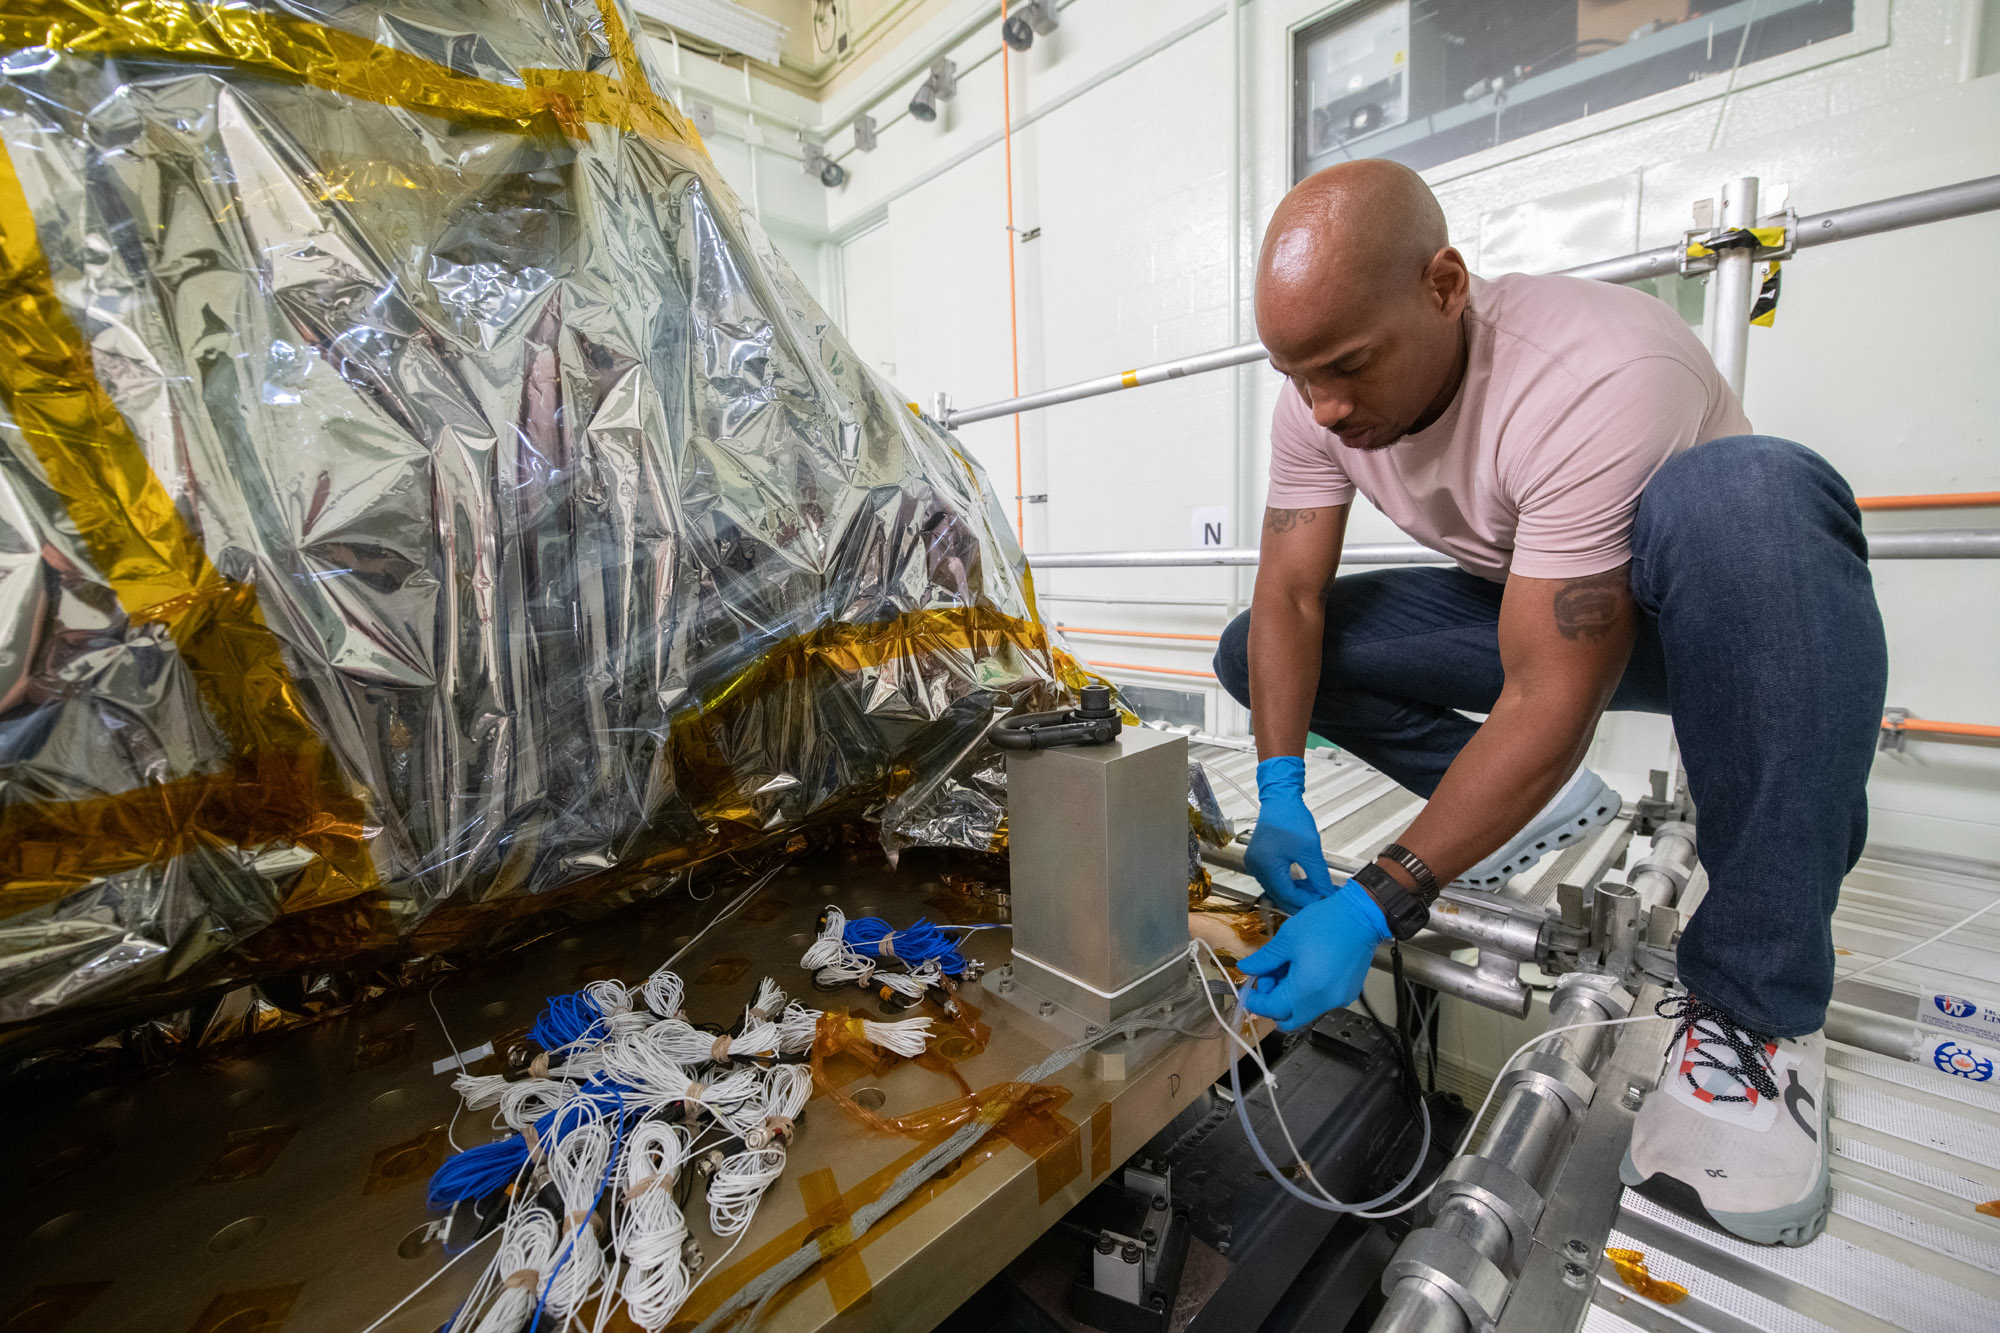
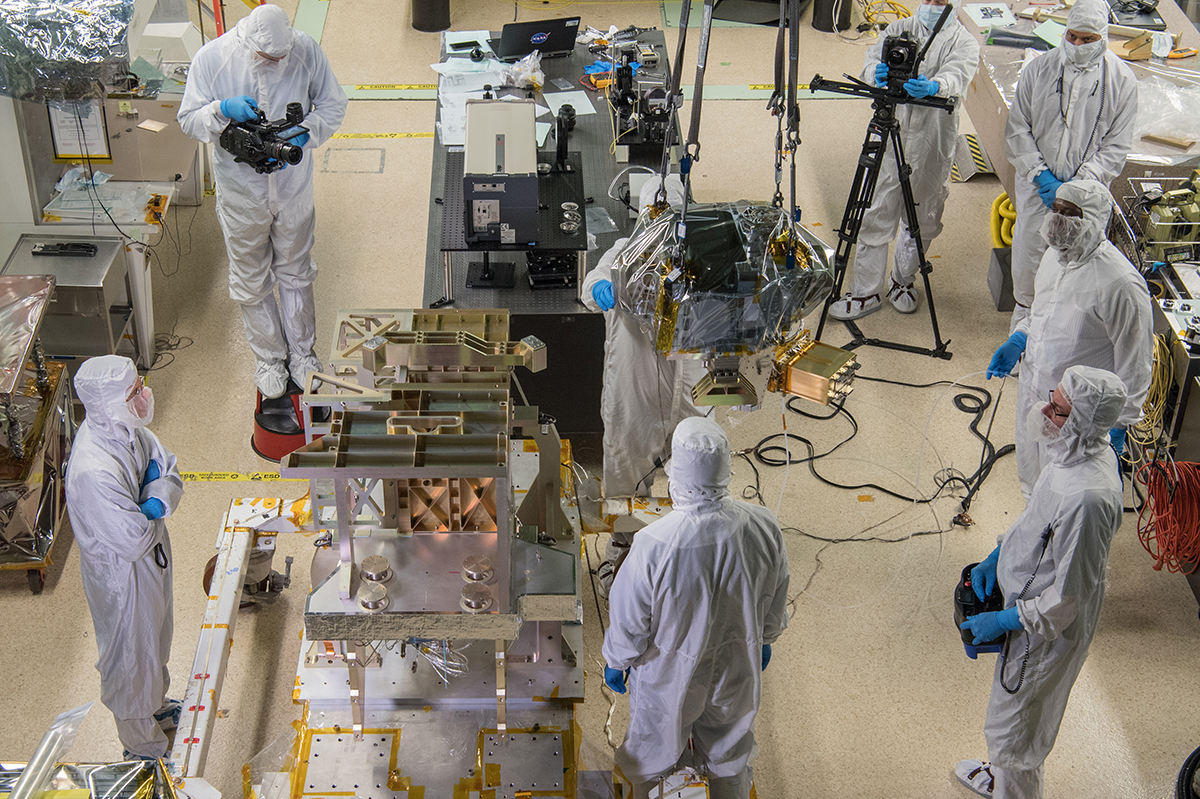
Preparing HARP2 polarimeter for thermal vaccum testing. Credit: Mellos, Katherine
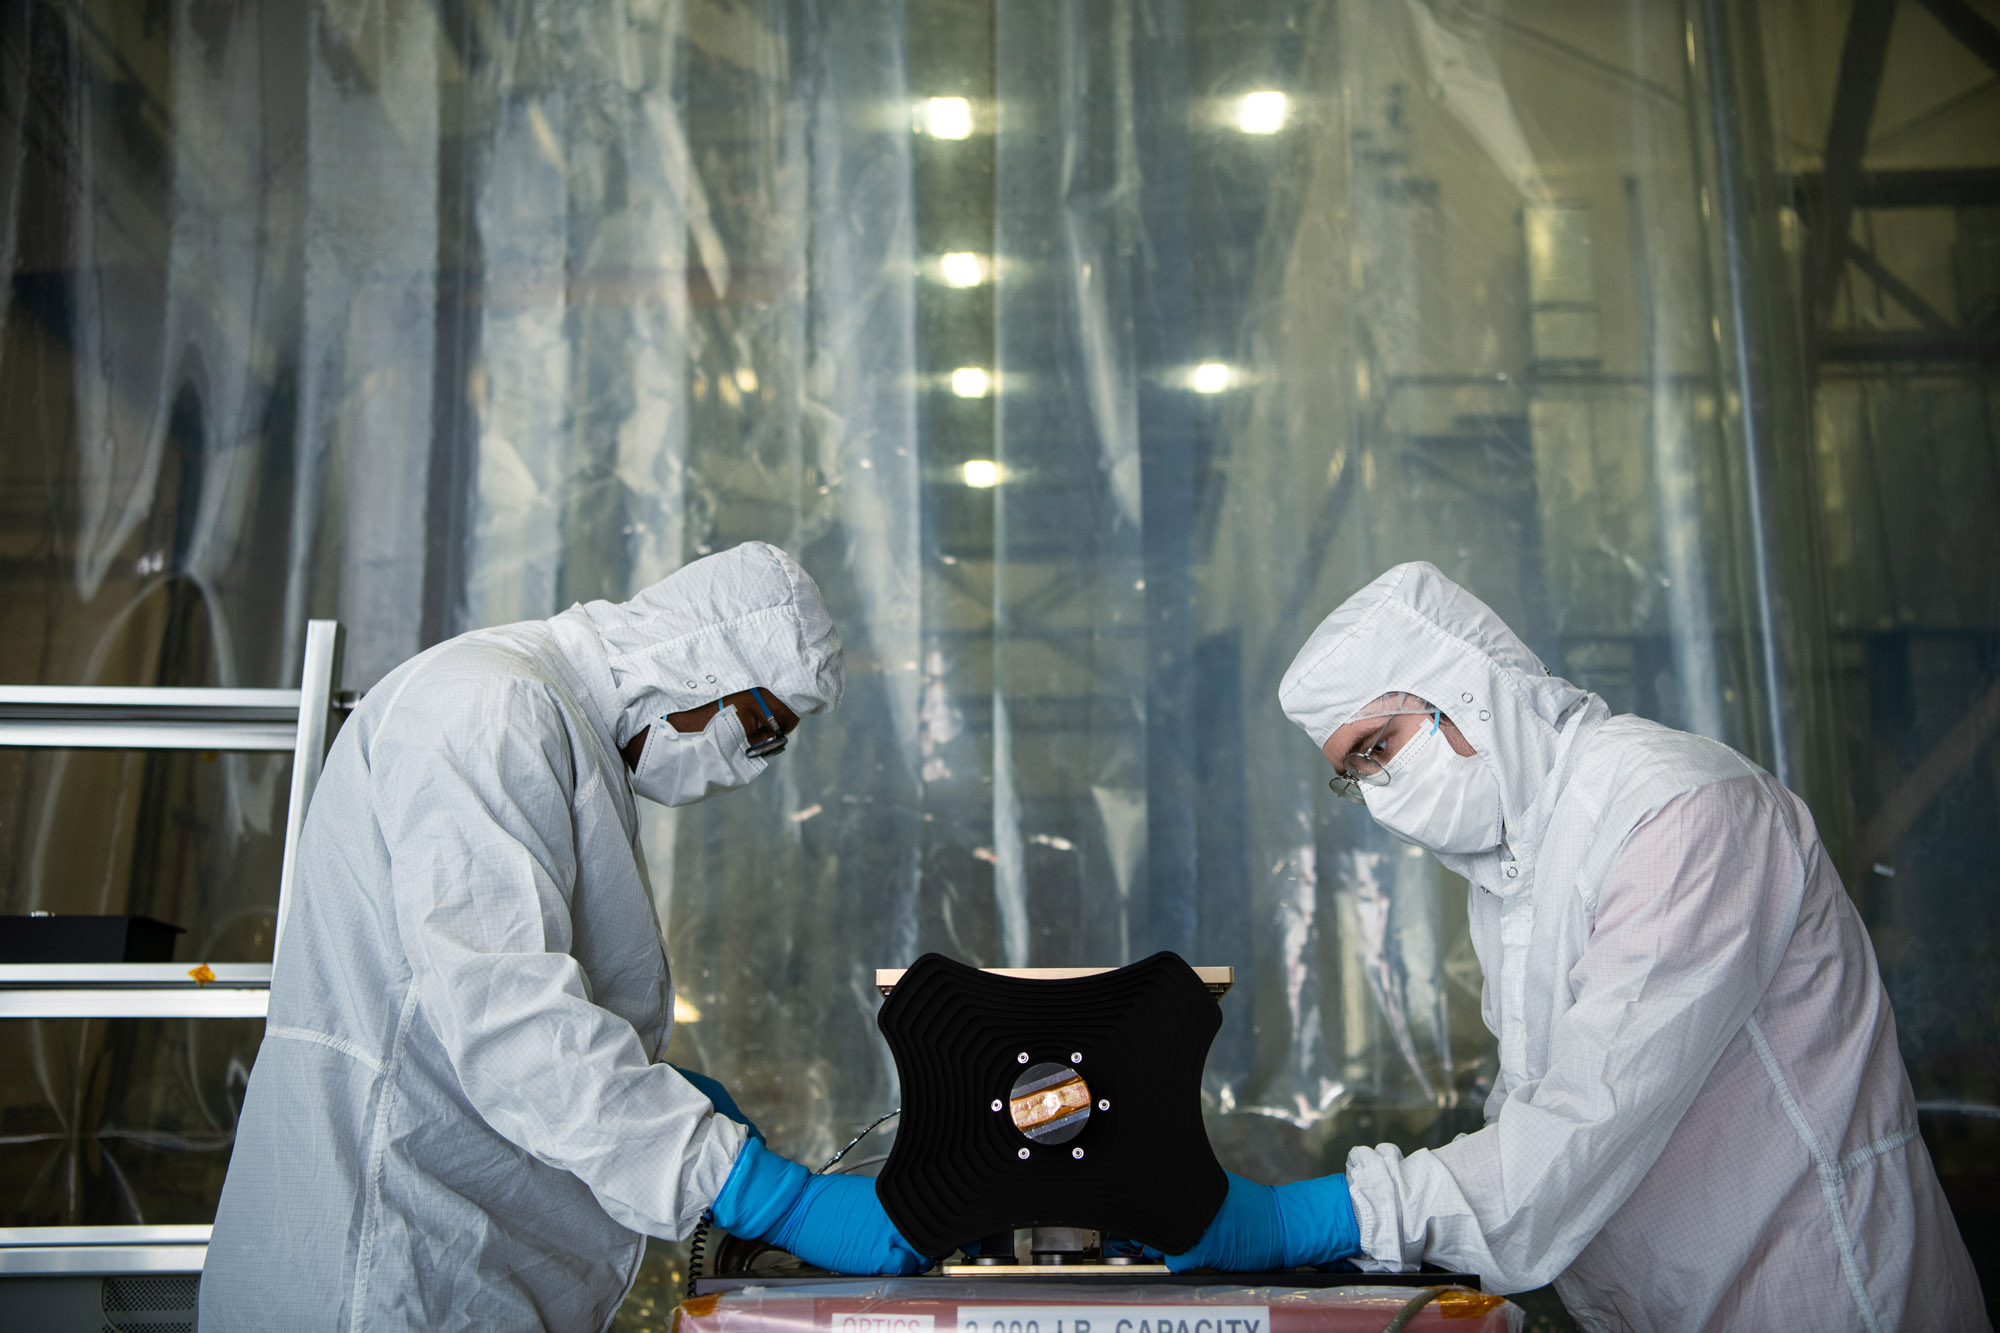
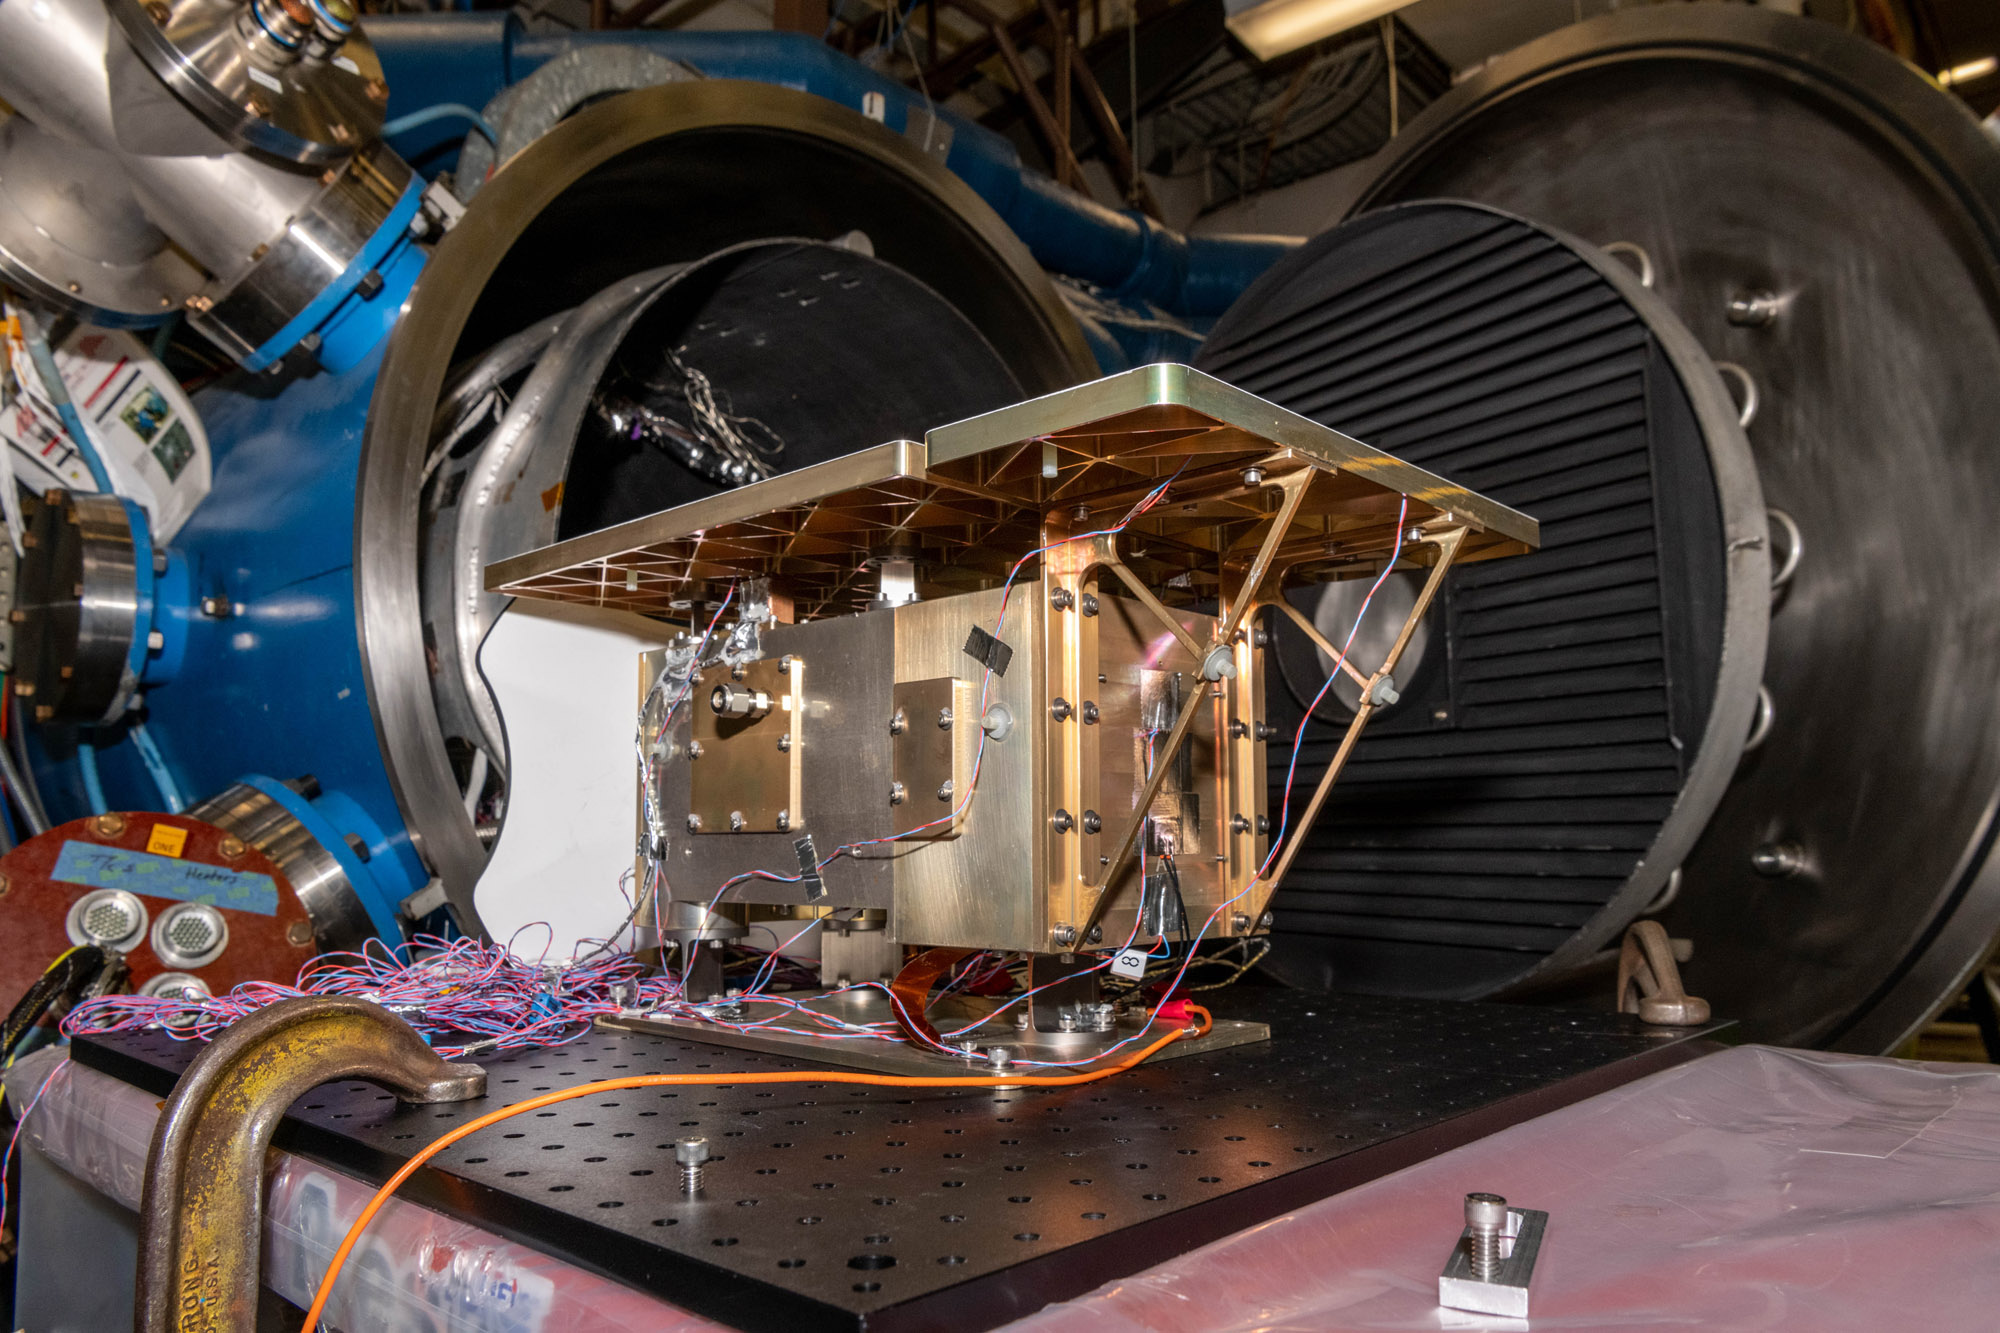
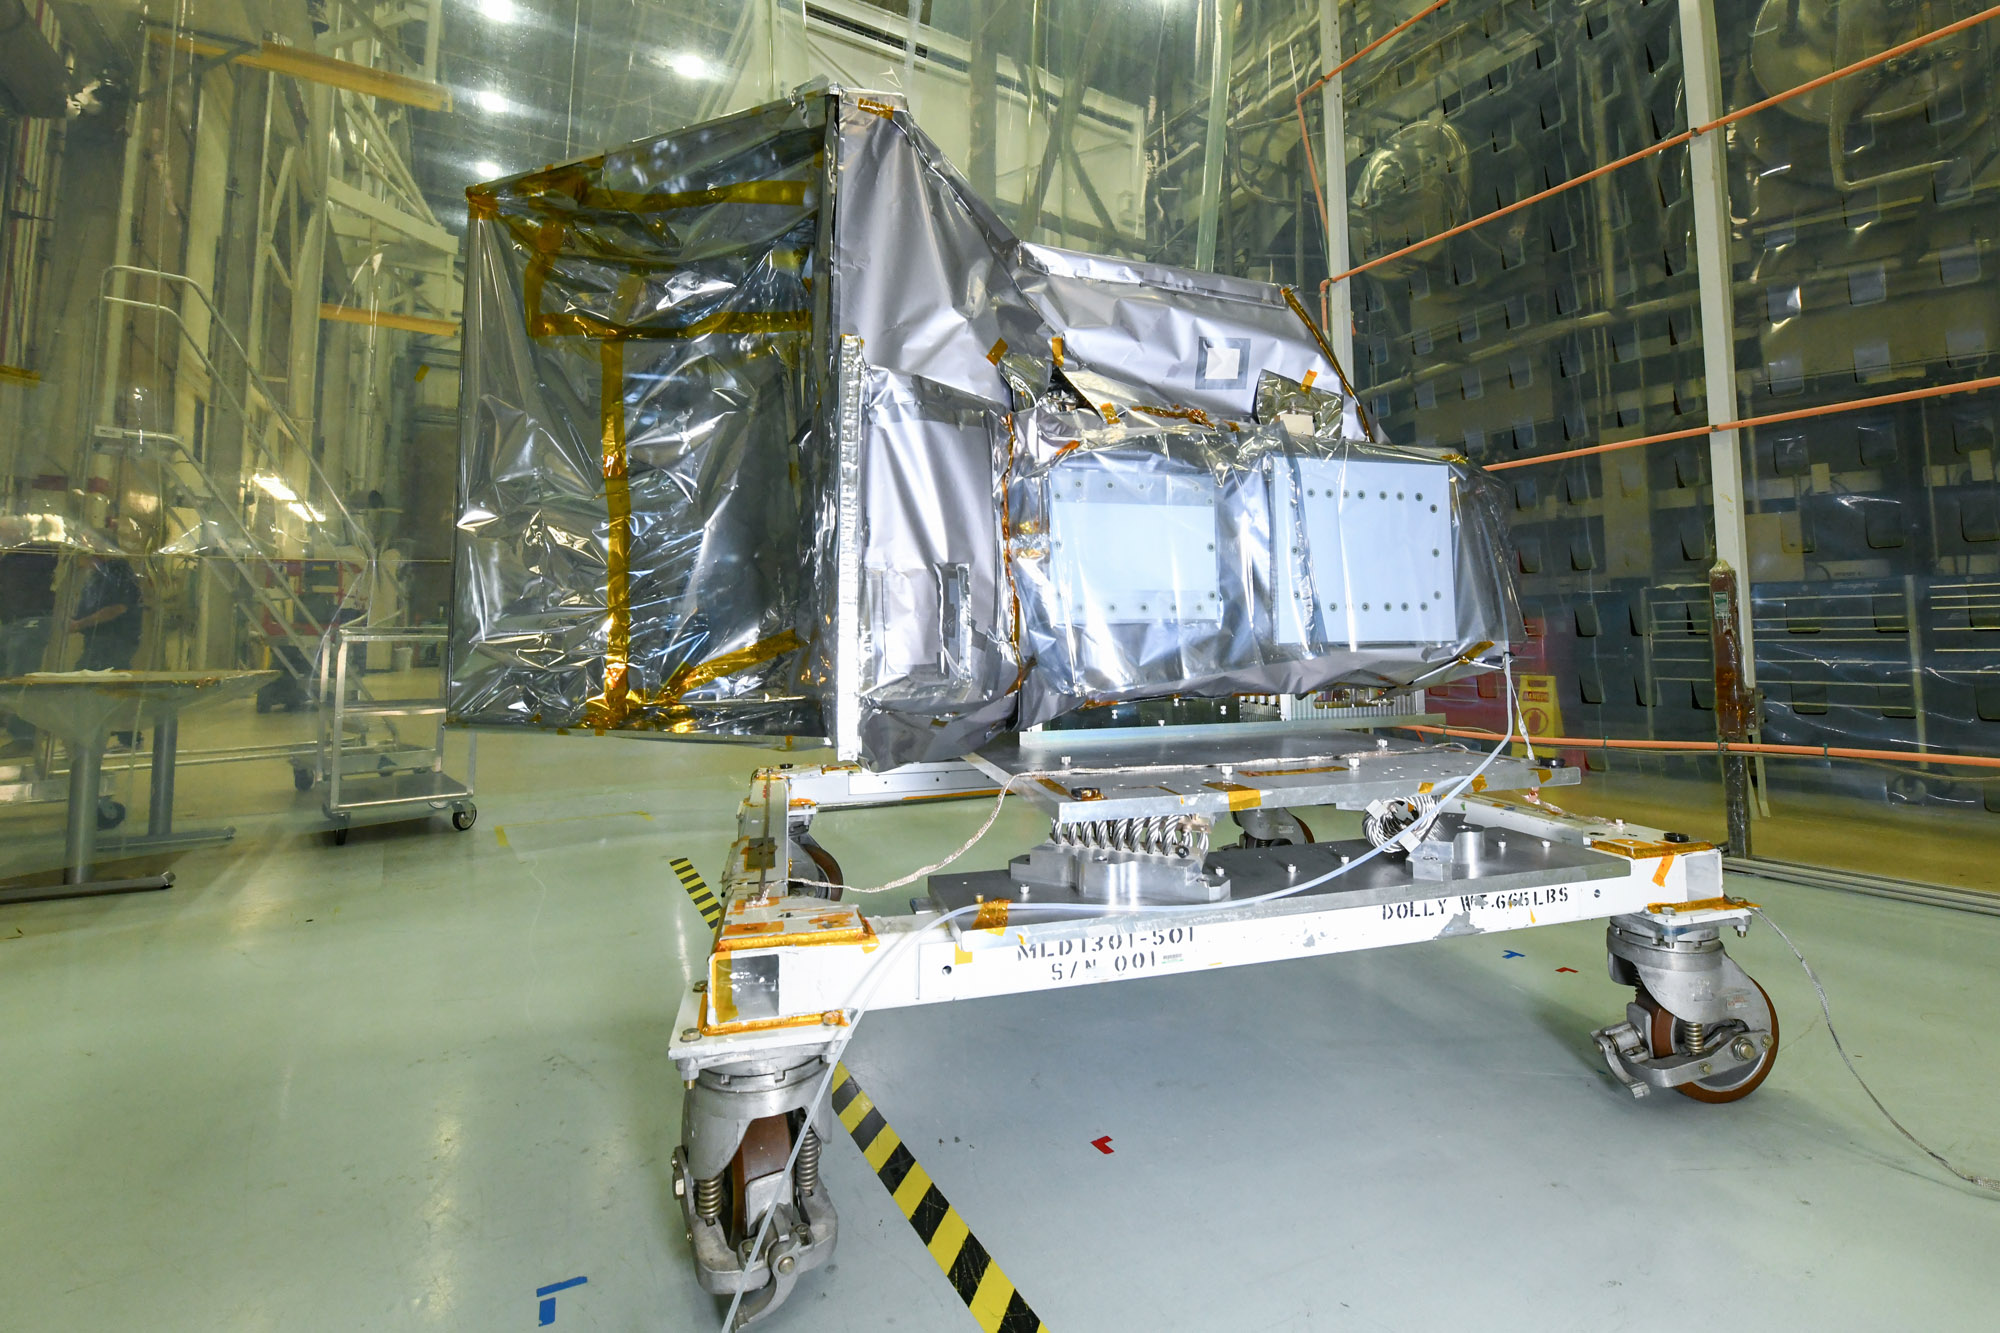
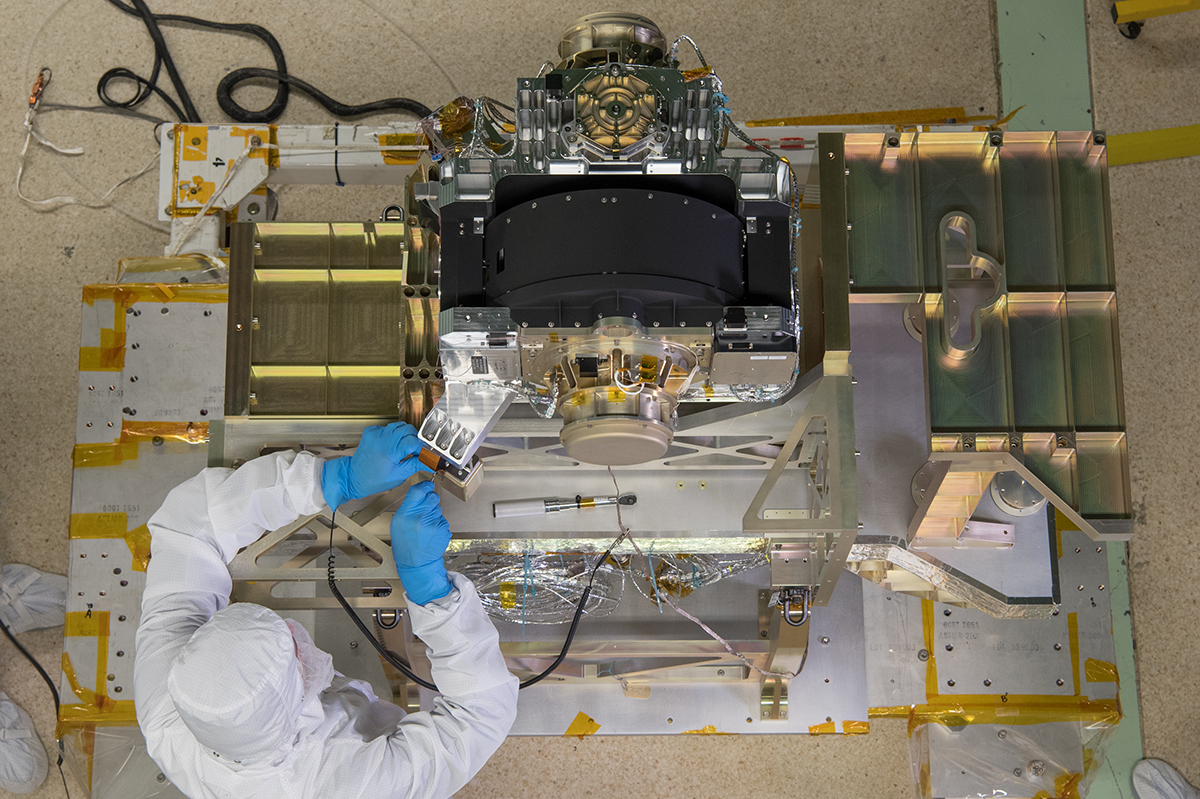
Installating HARP2 polarimeter on thermal vacuum plate. Credit: Henry, Dennis (Denny)
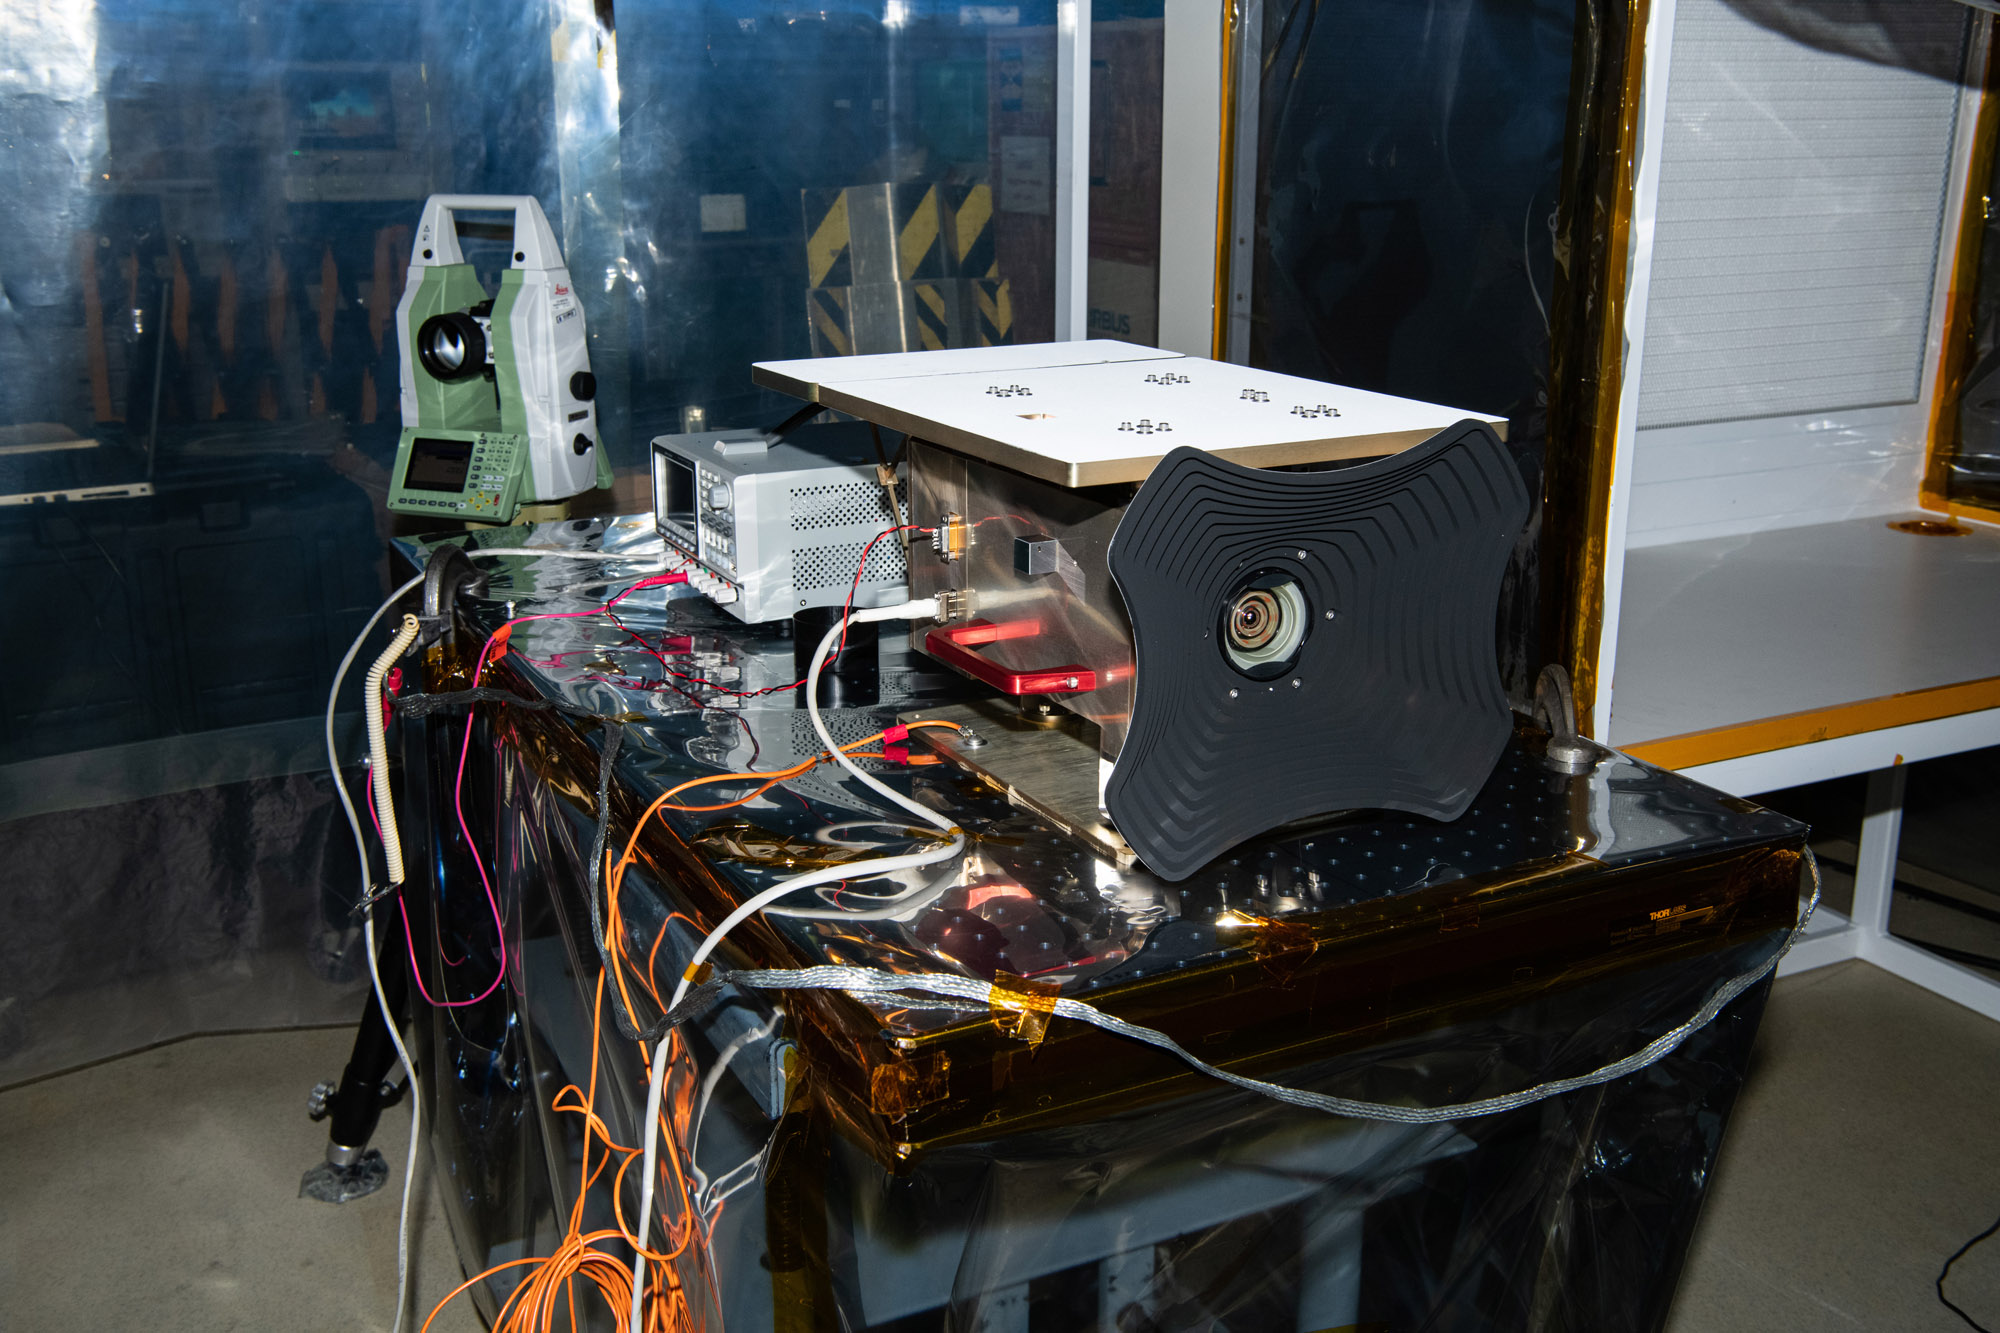
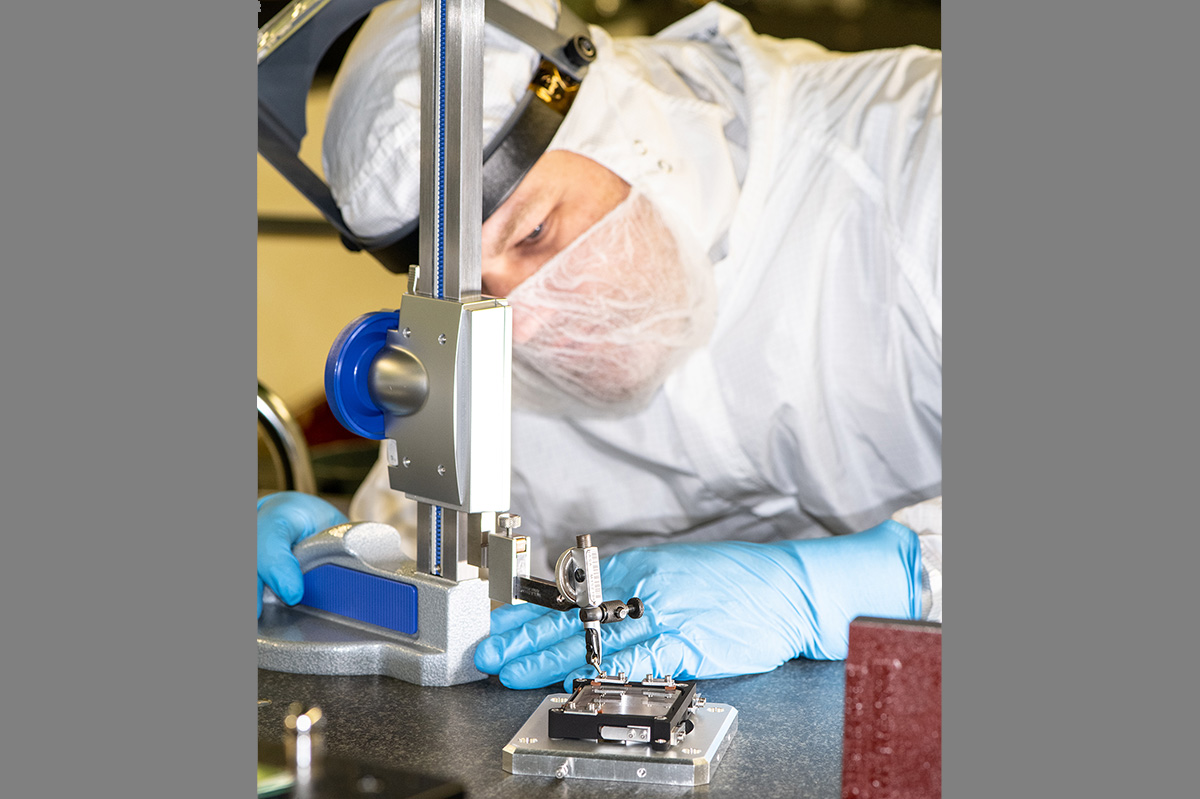
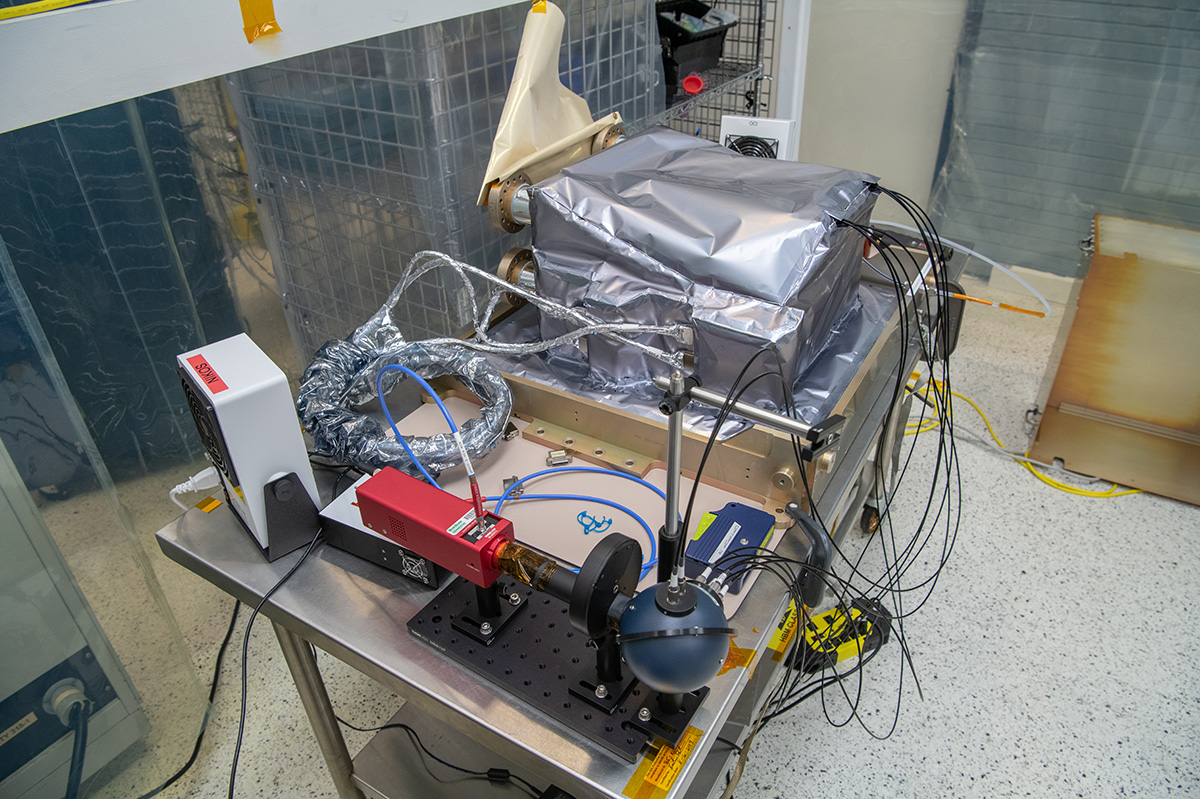
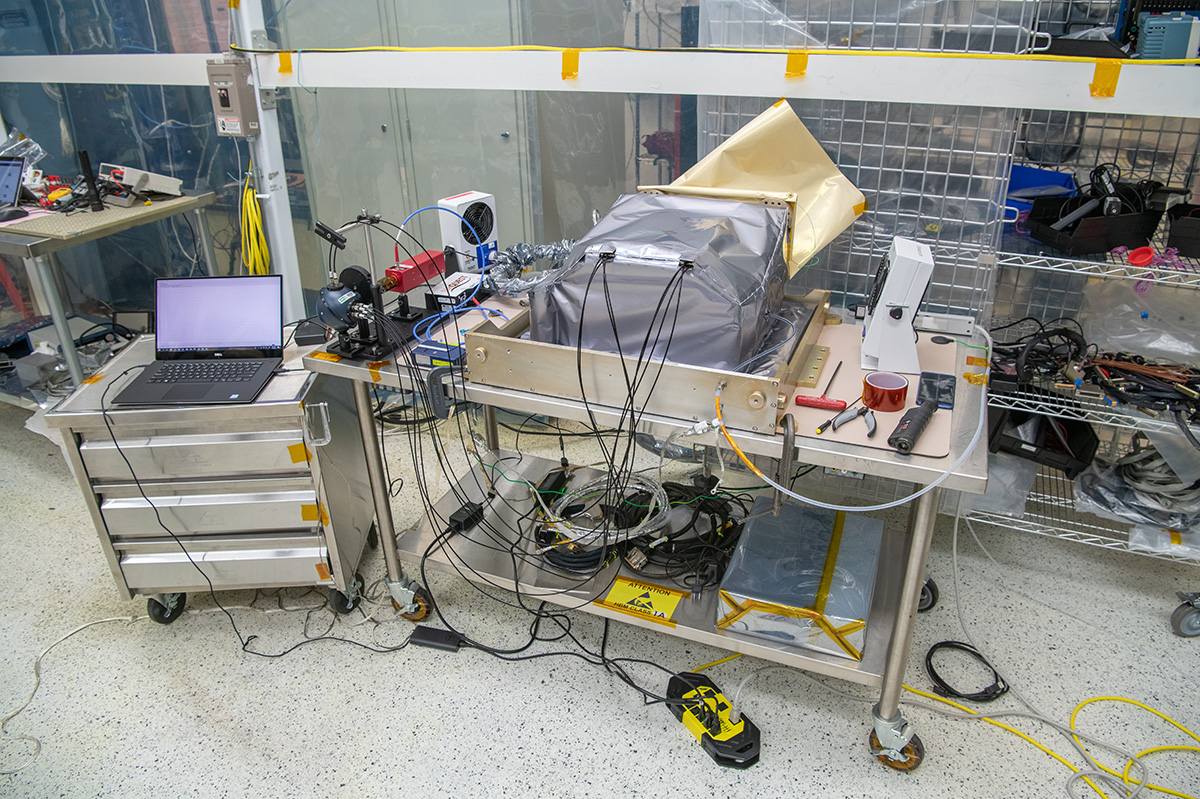
Ground system equipment setup for boresight alignment of HARP2 polarimeter. Credit: Henry, Dennis (Denny)
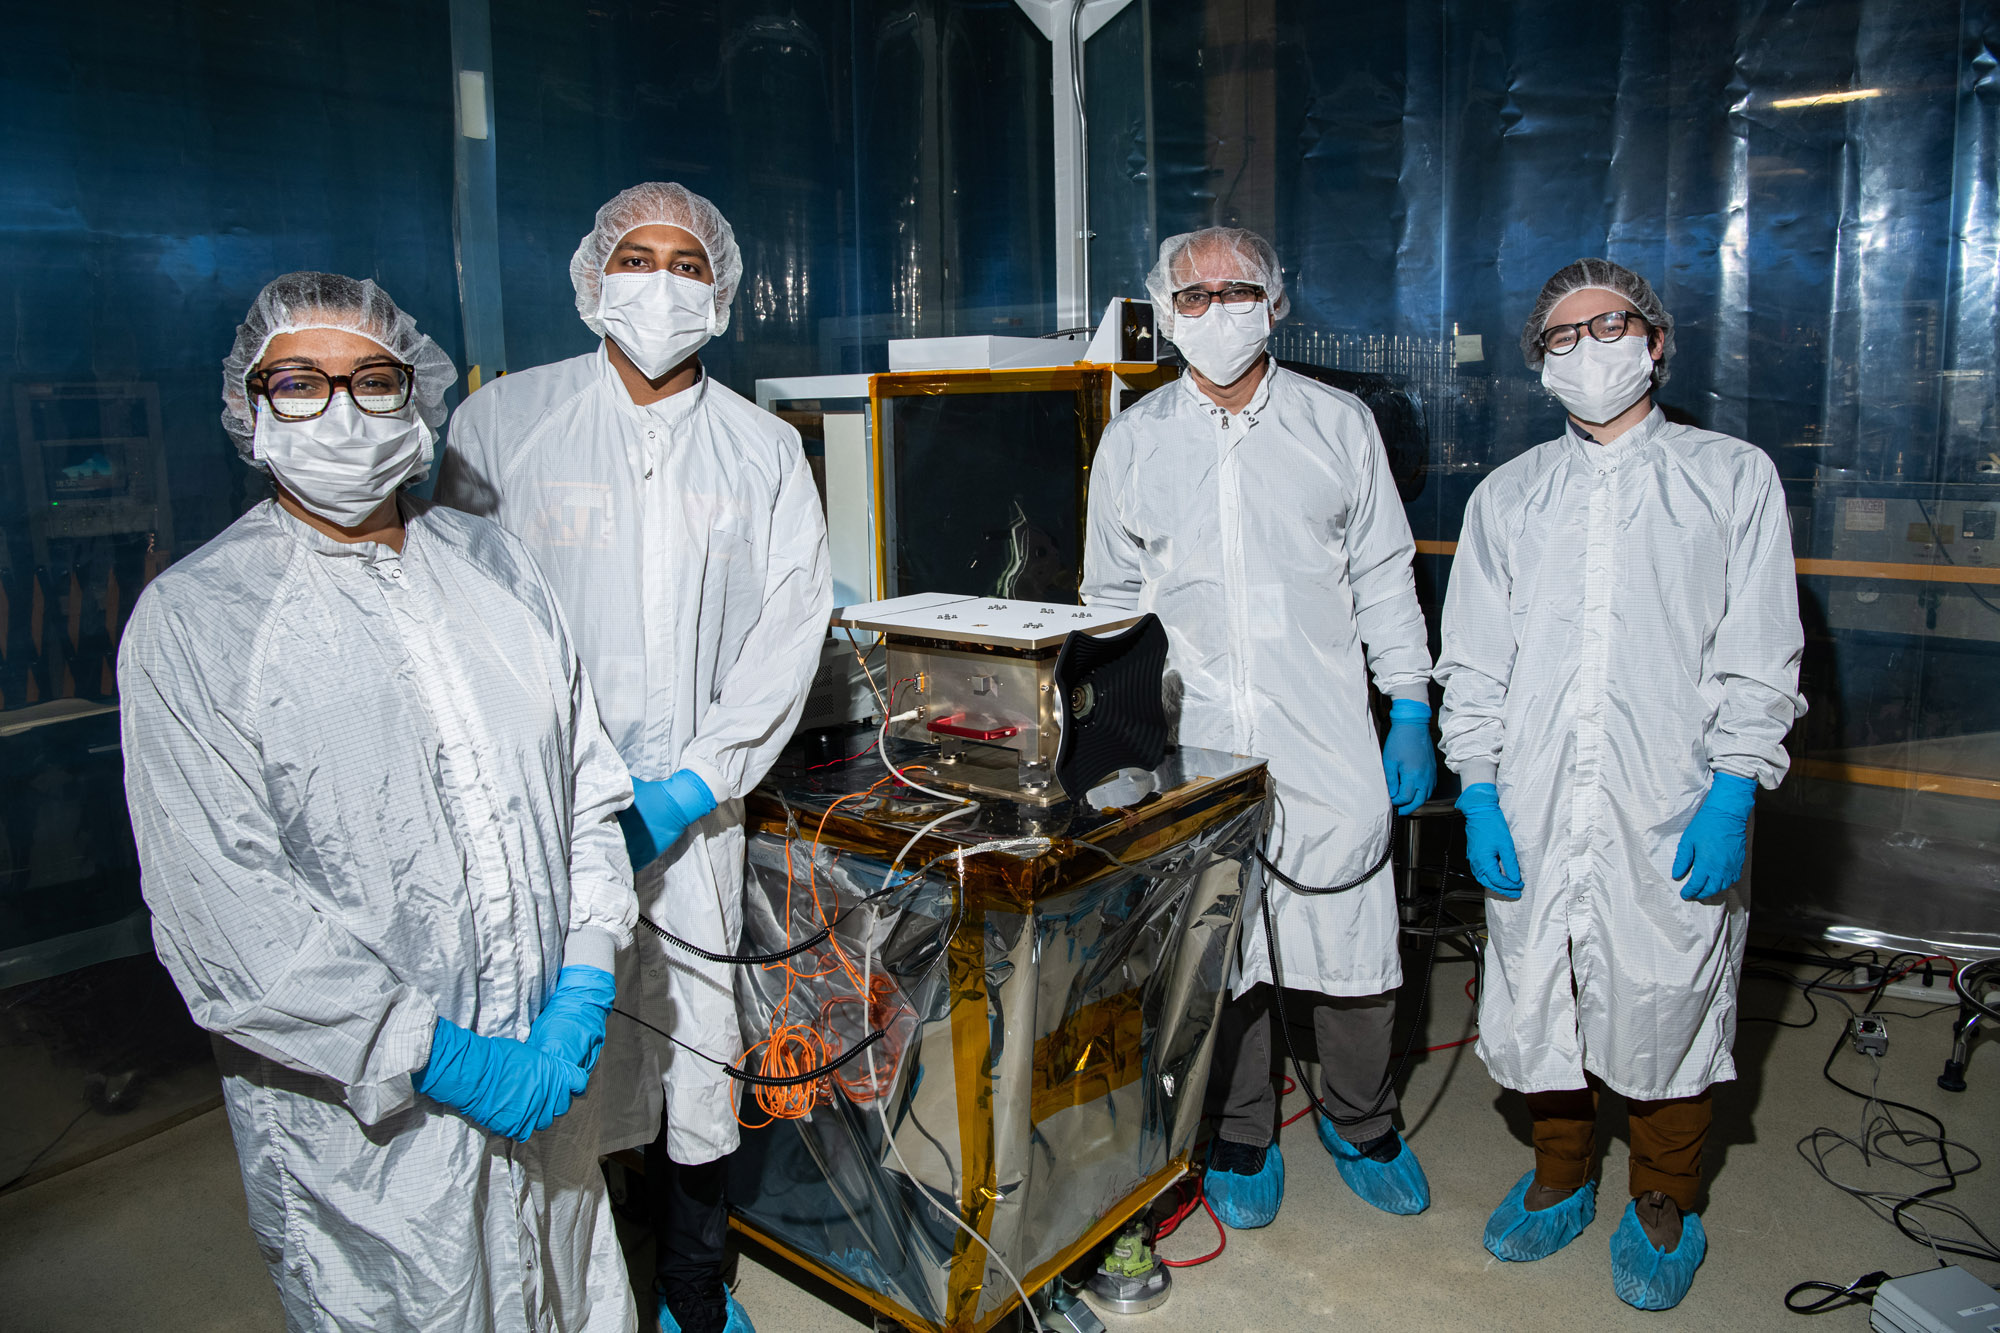
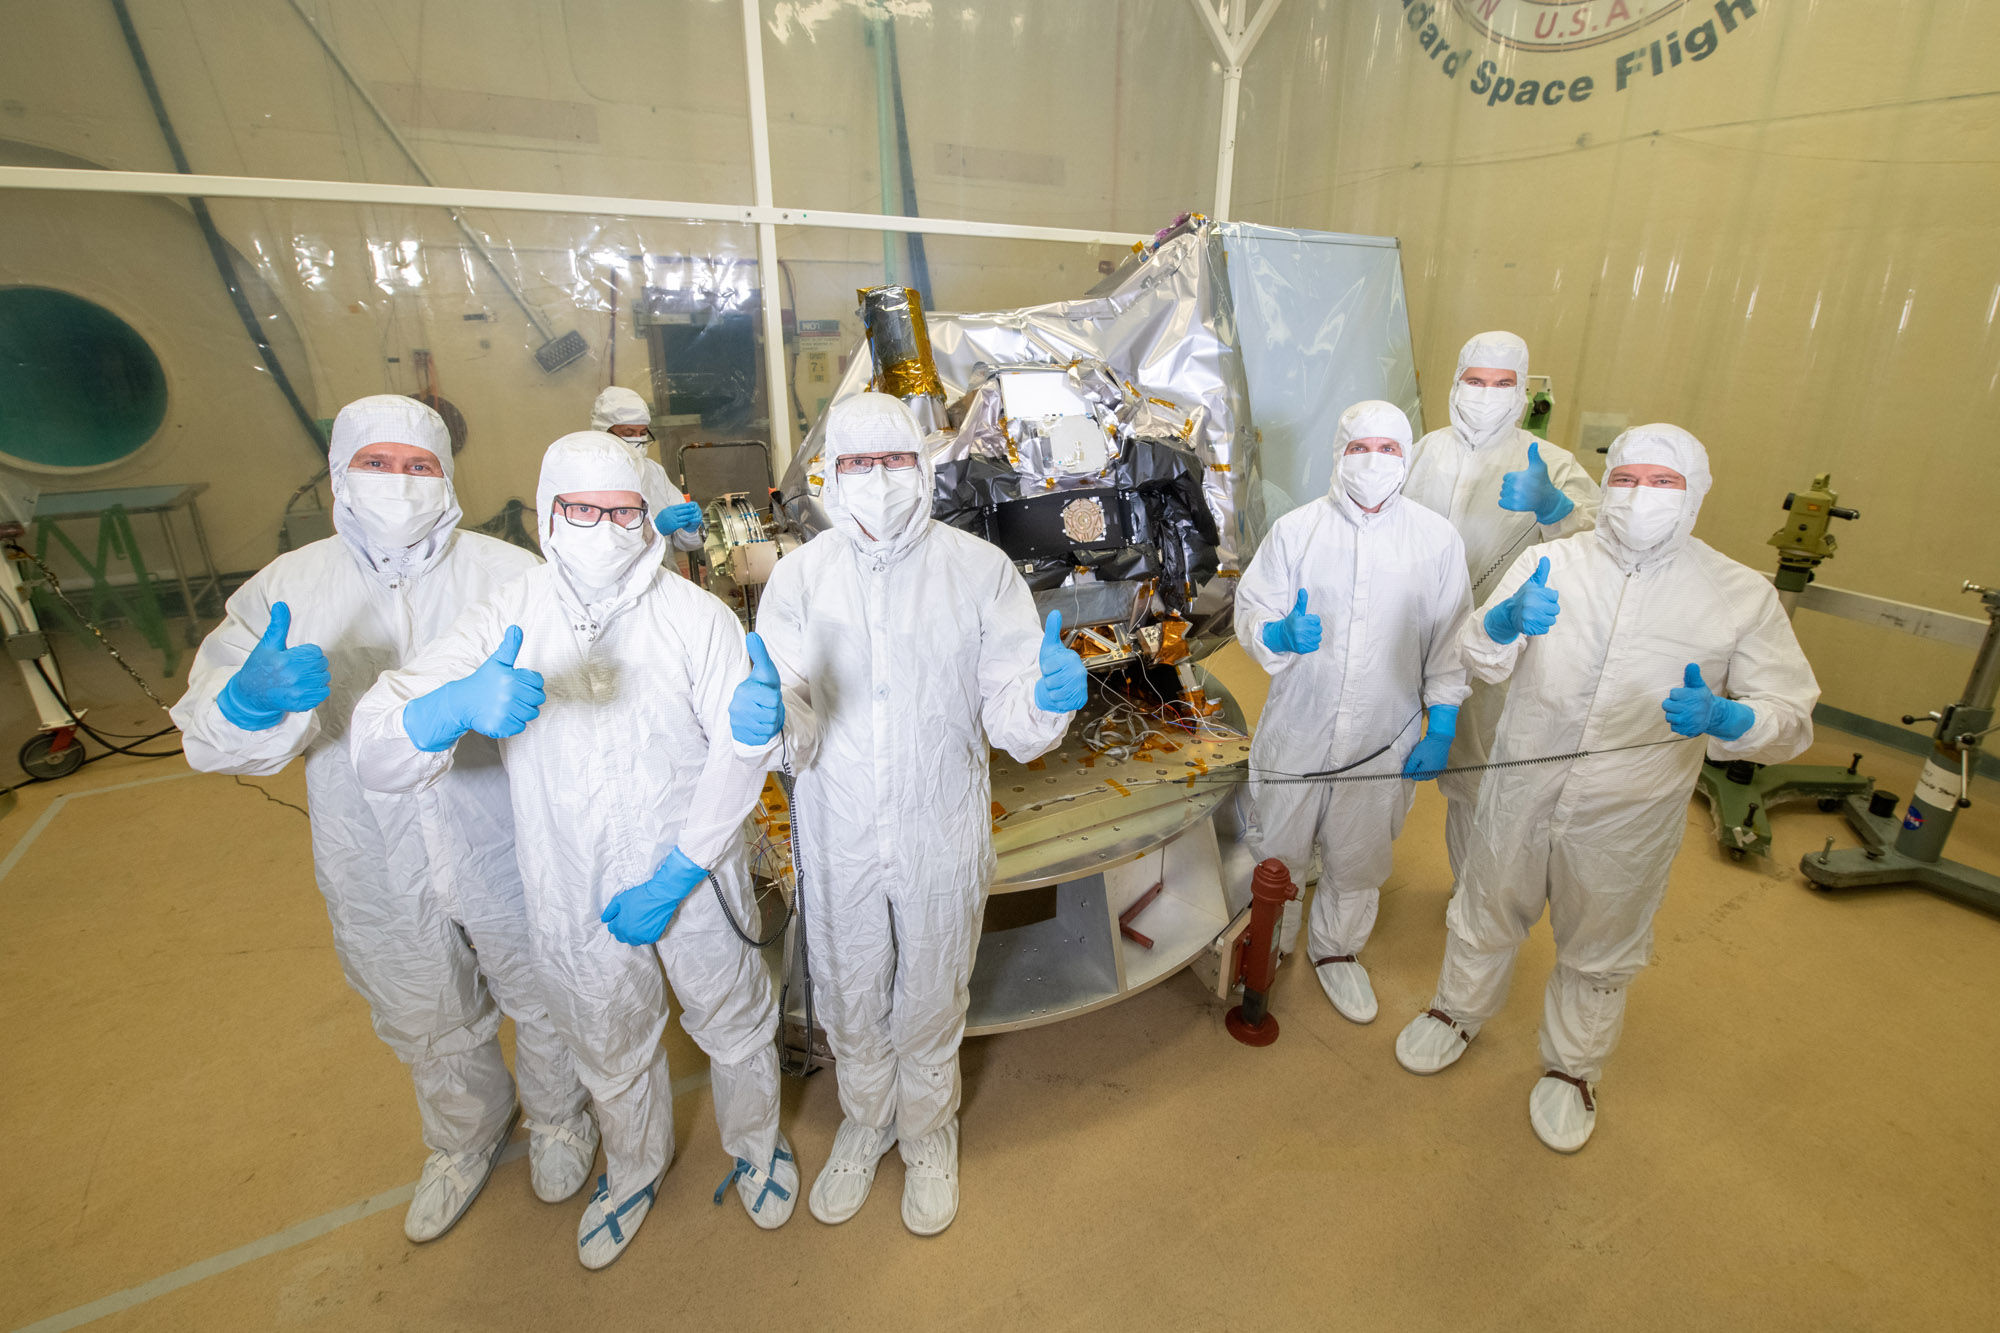
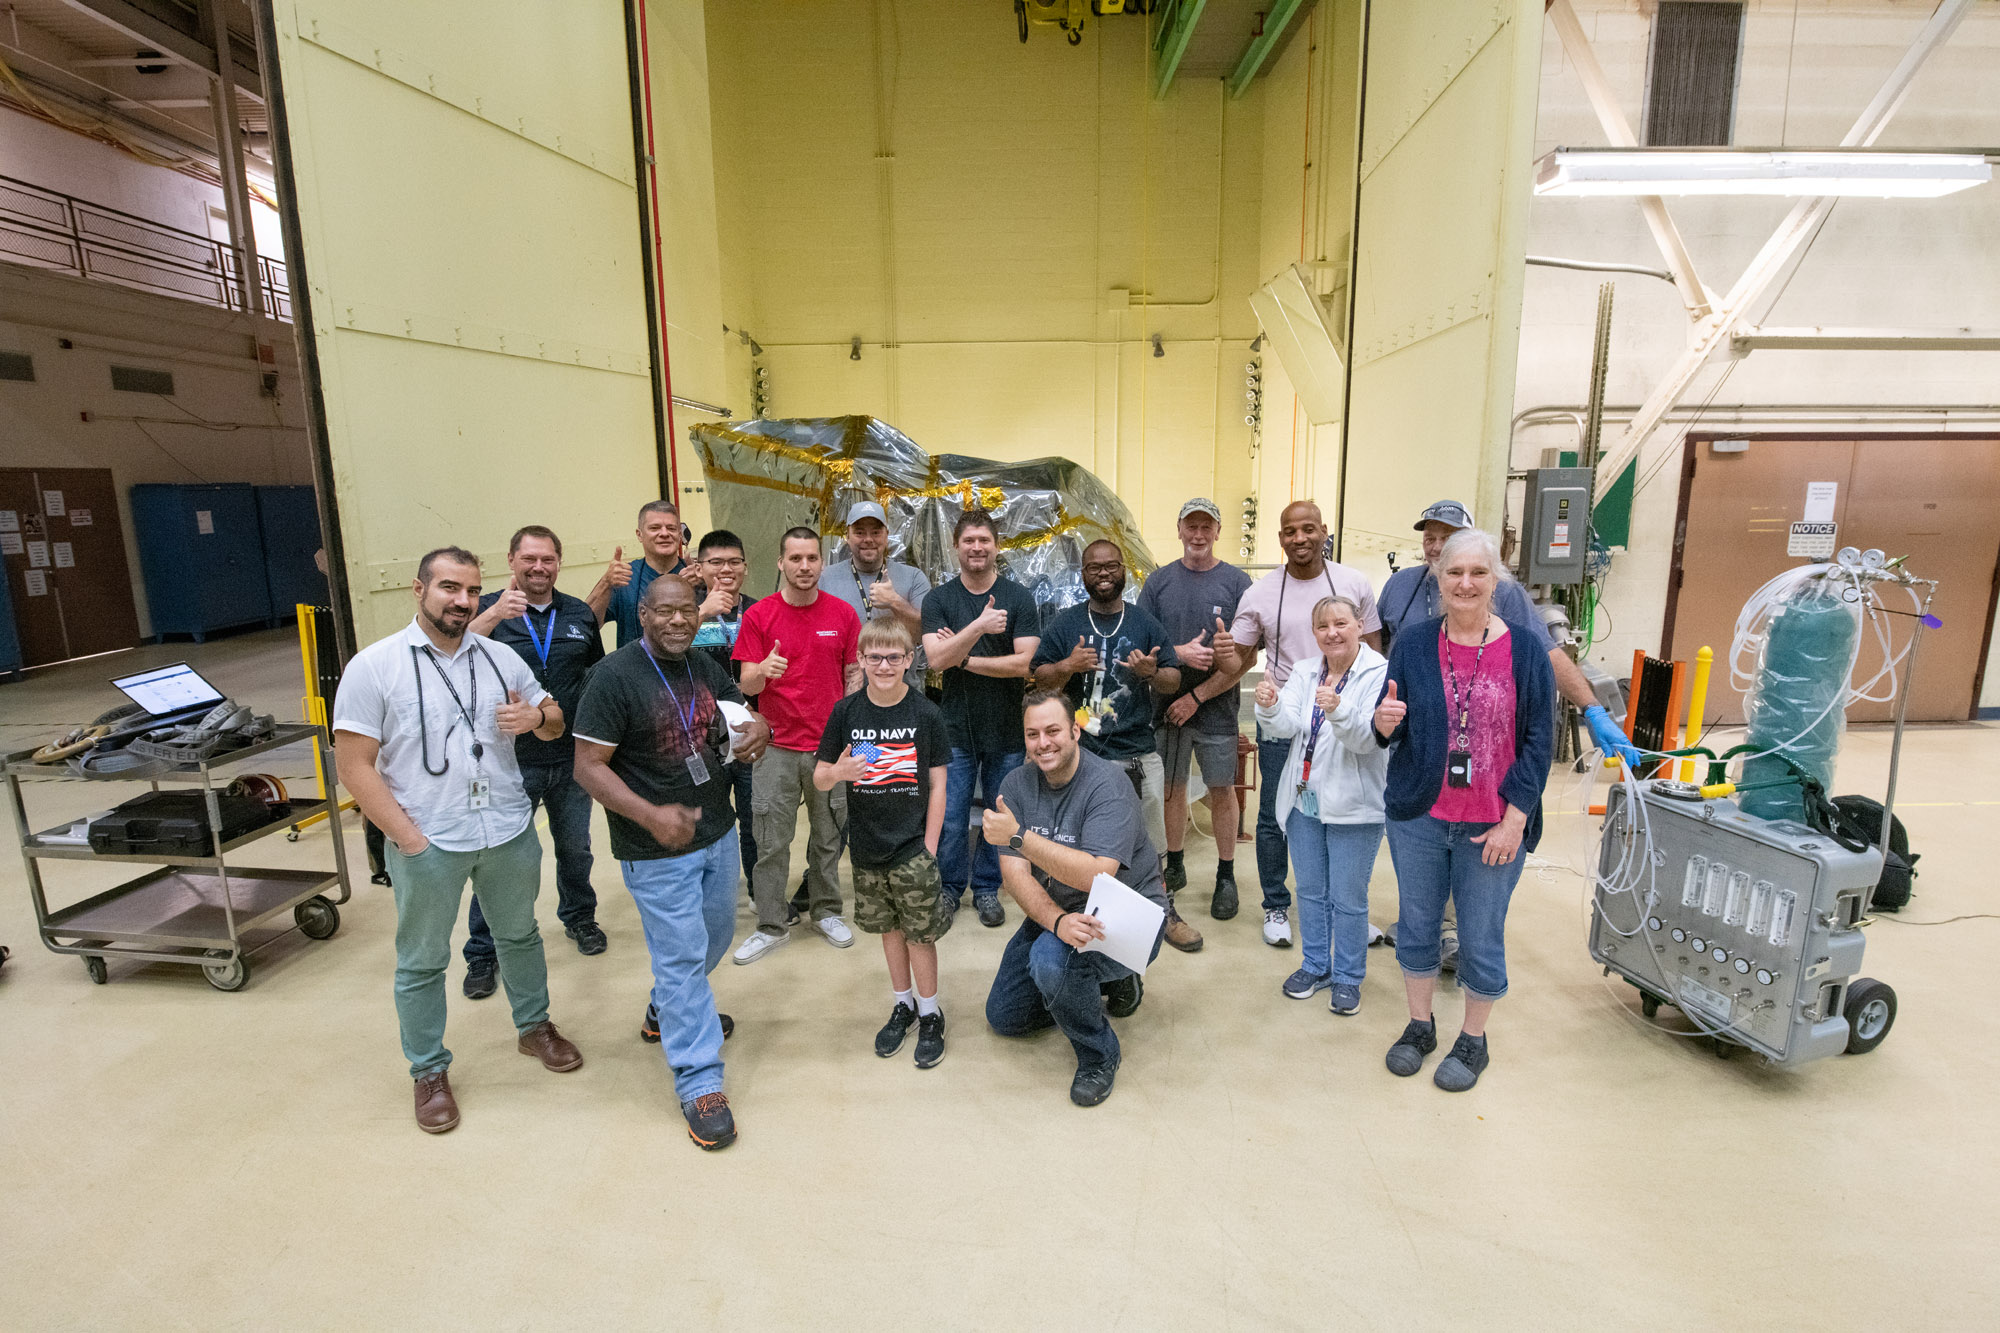
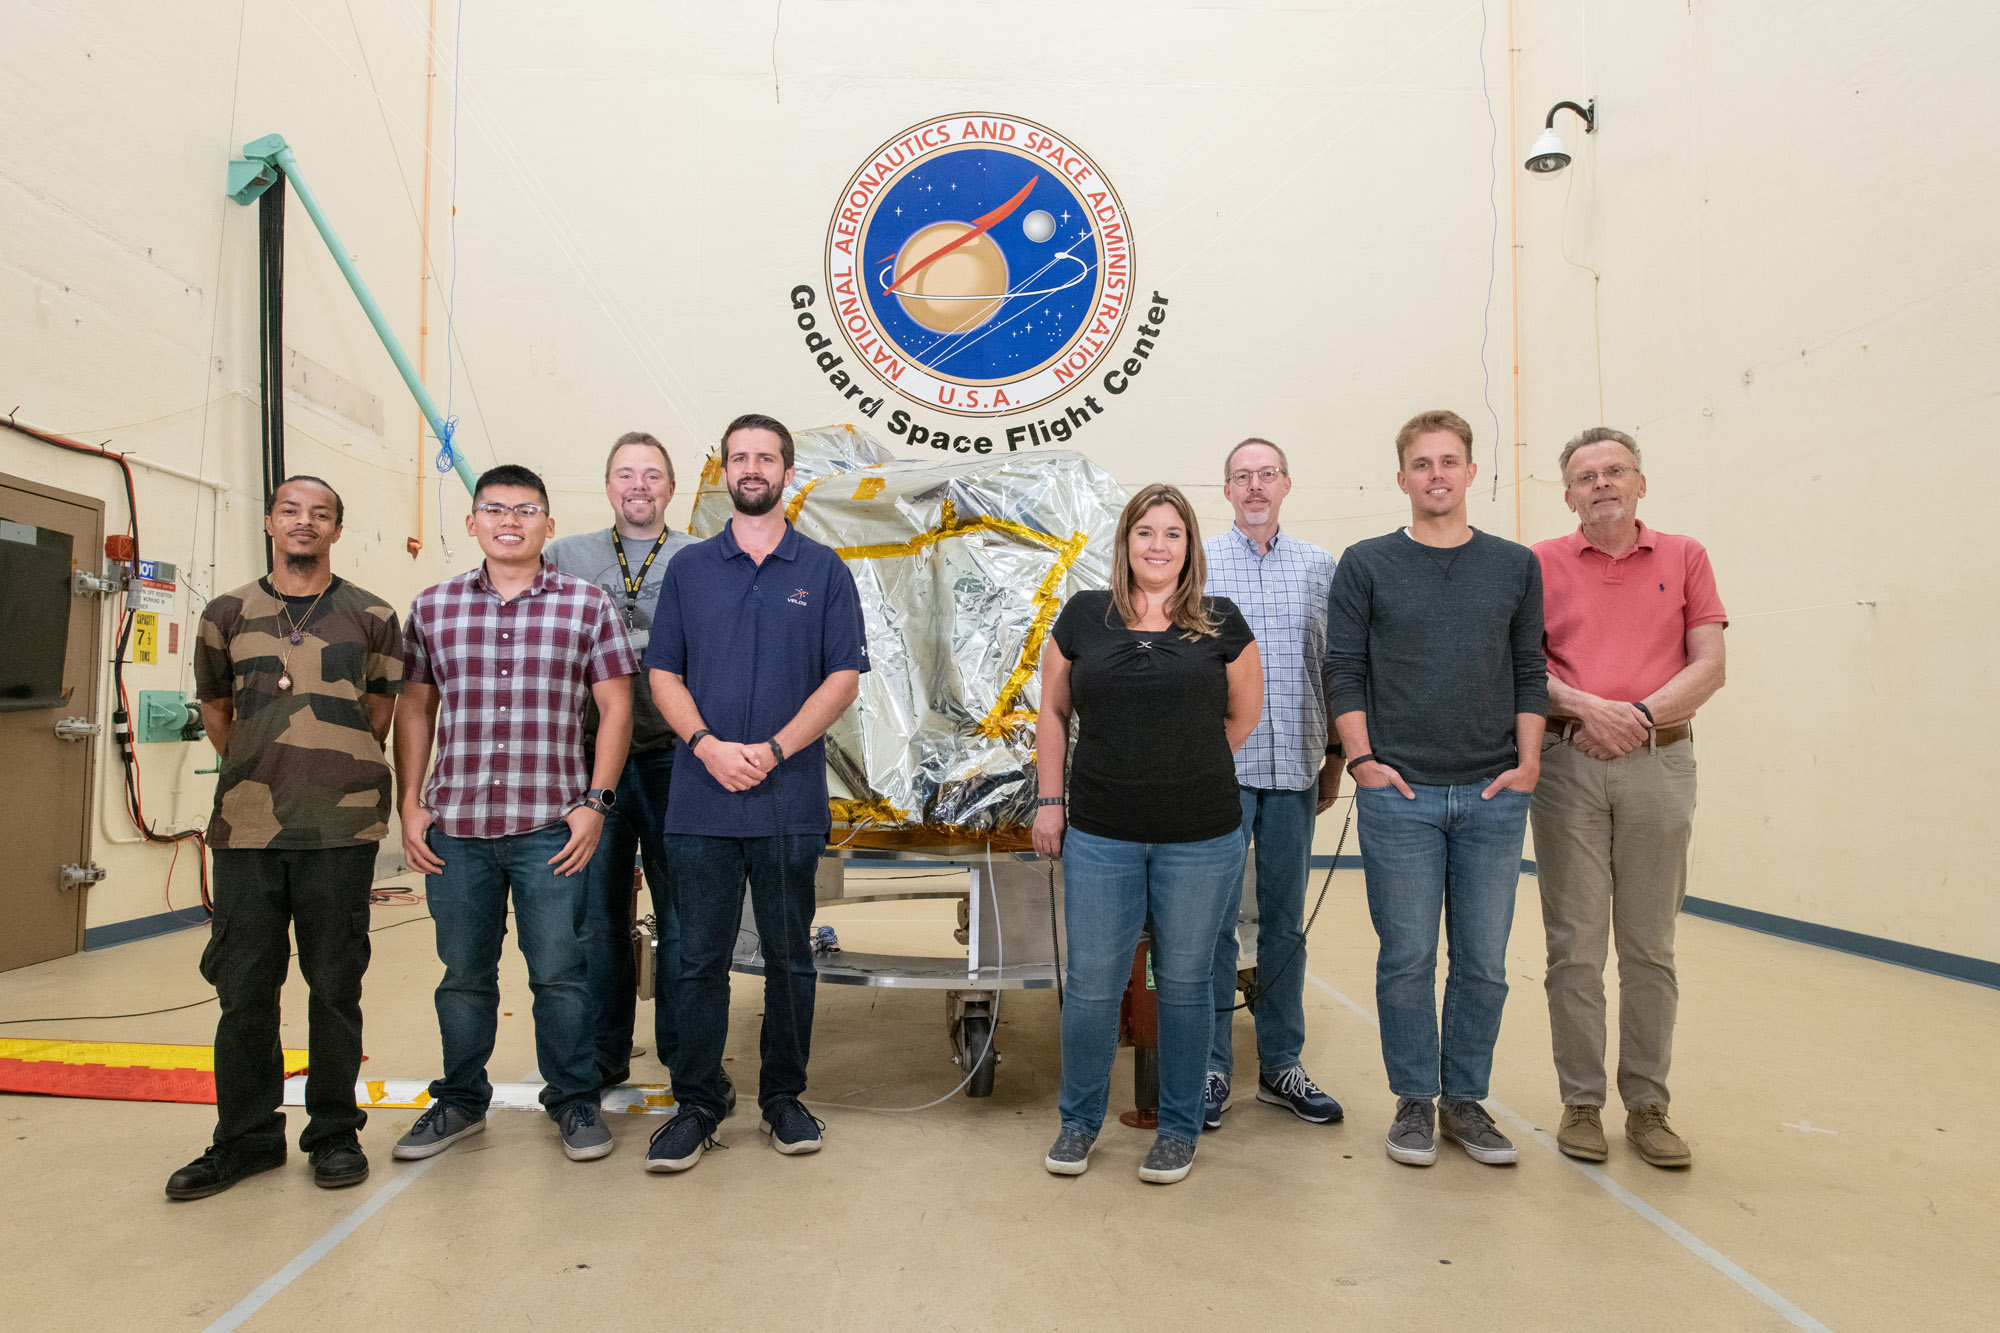
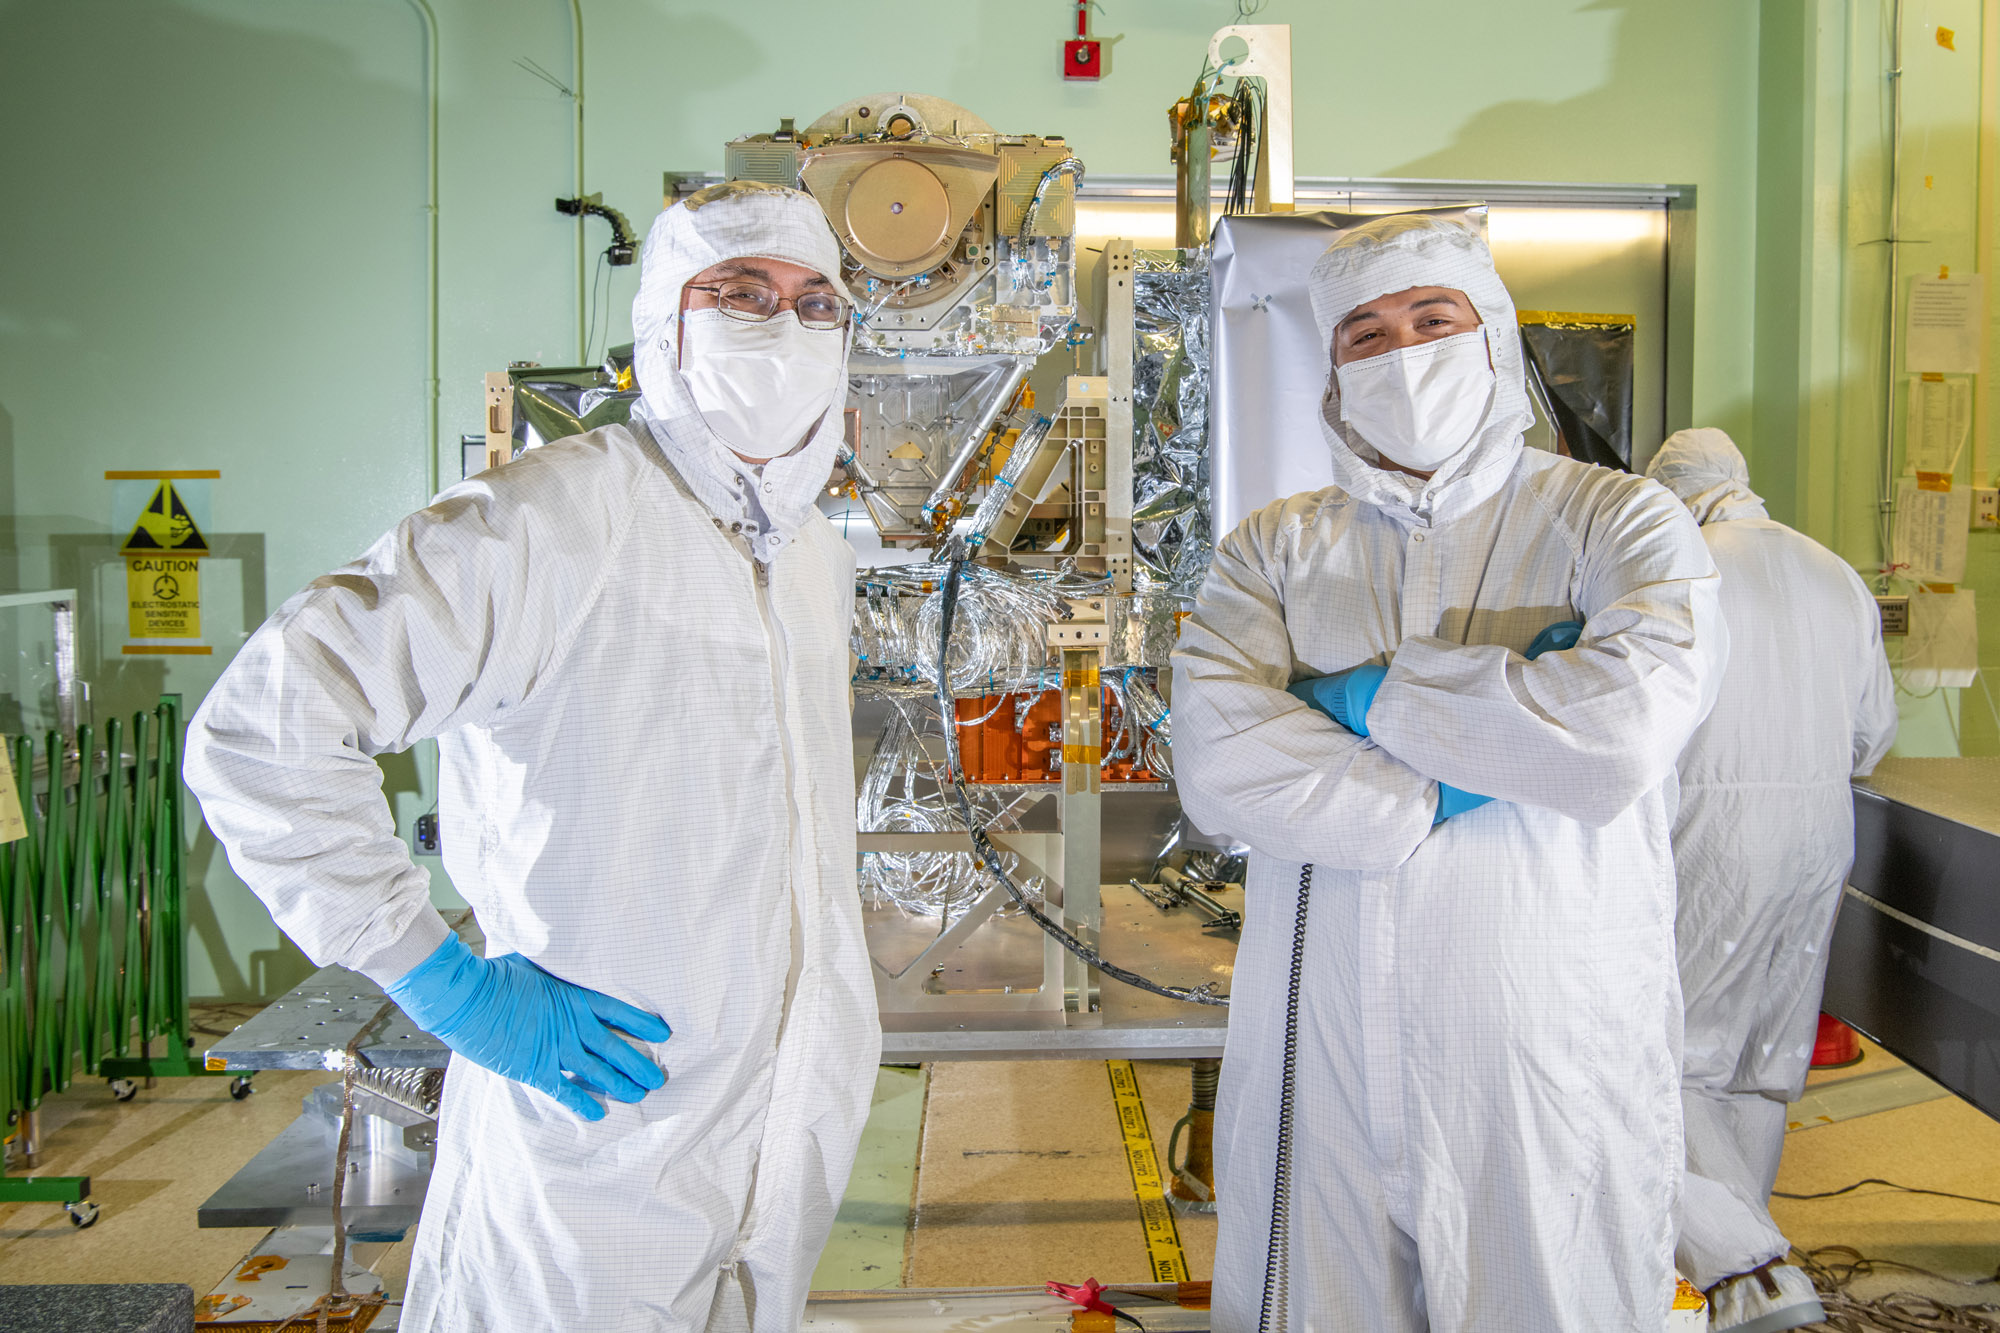
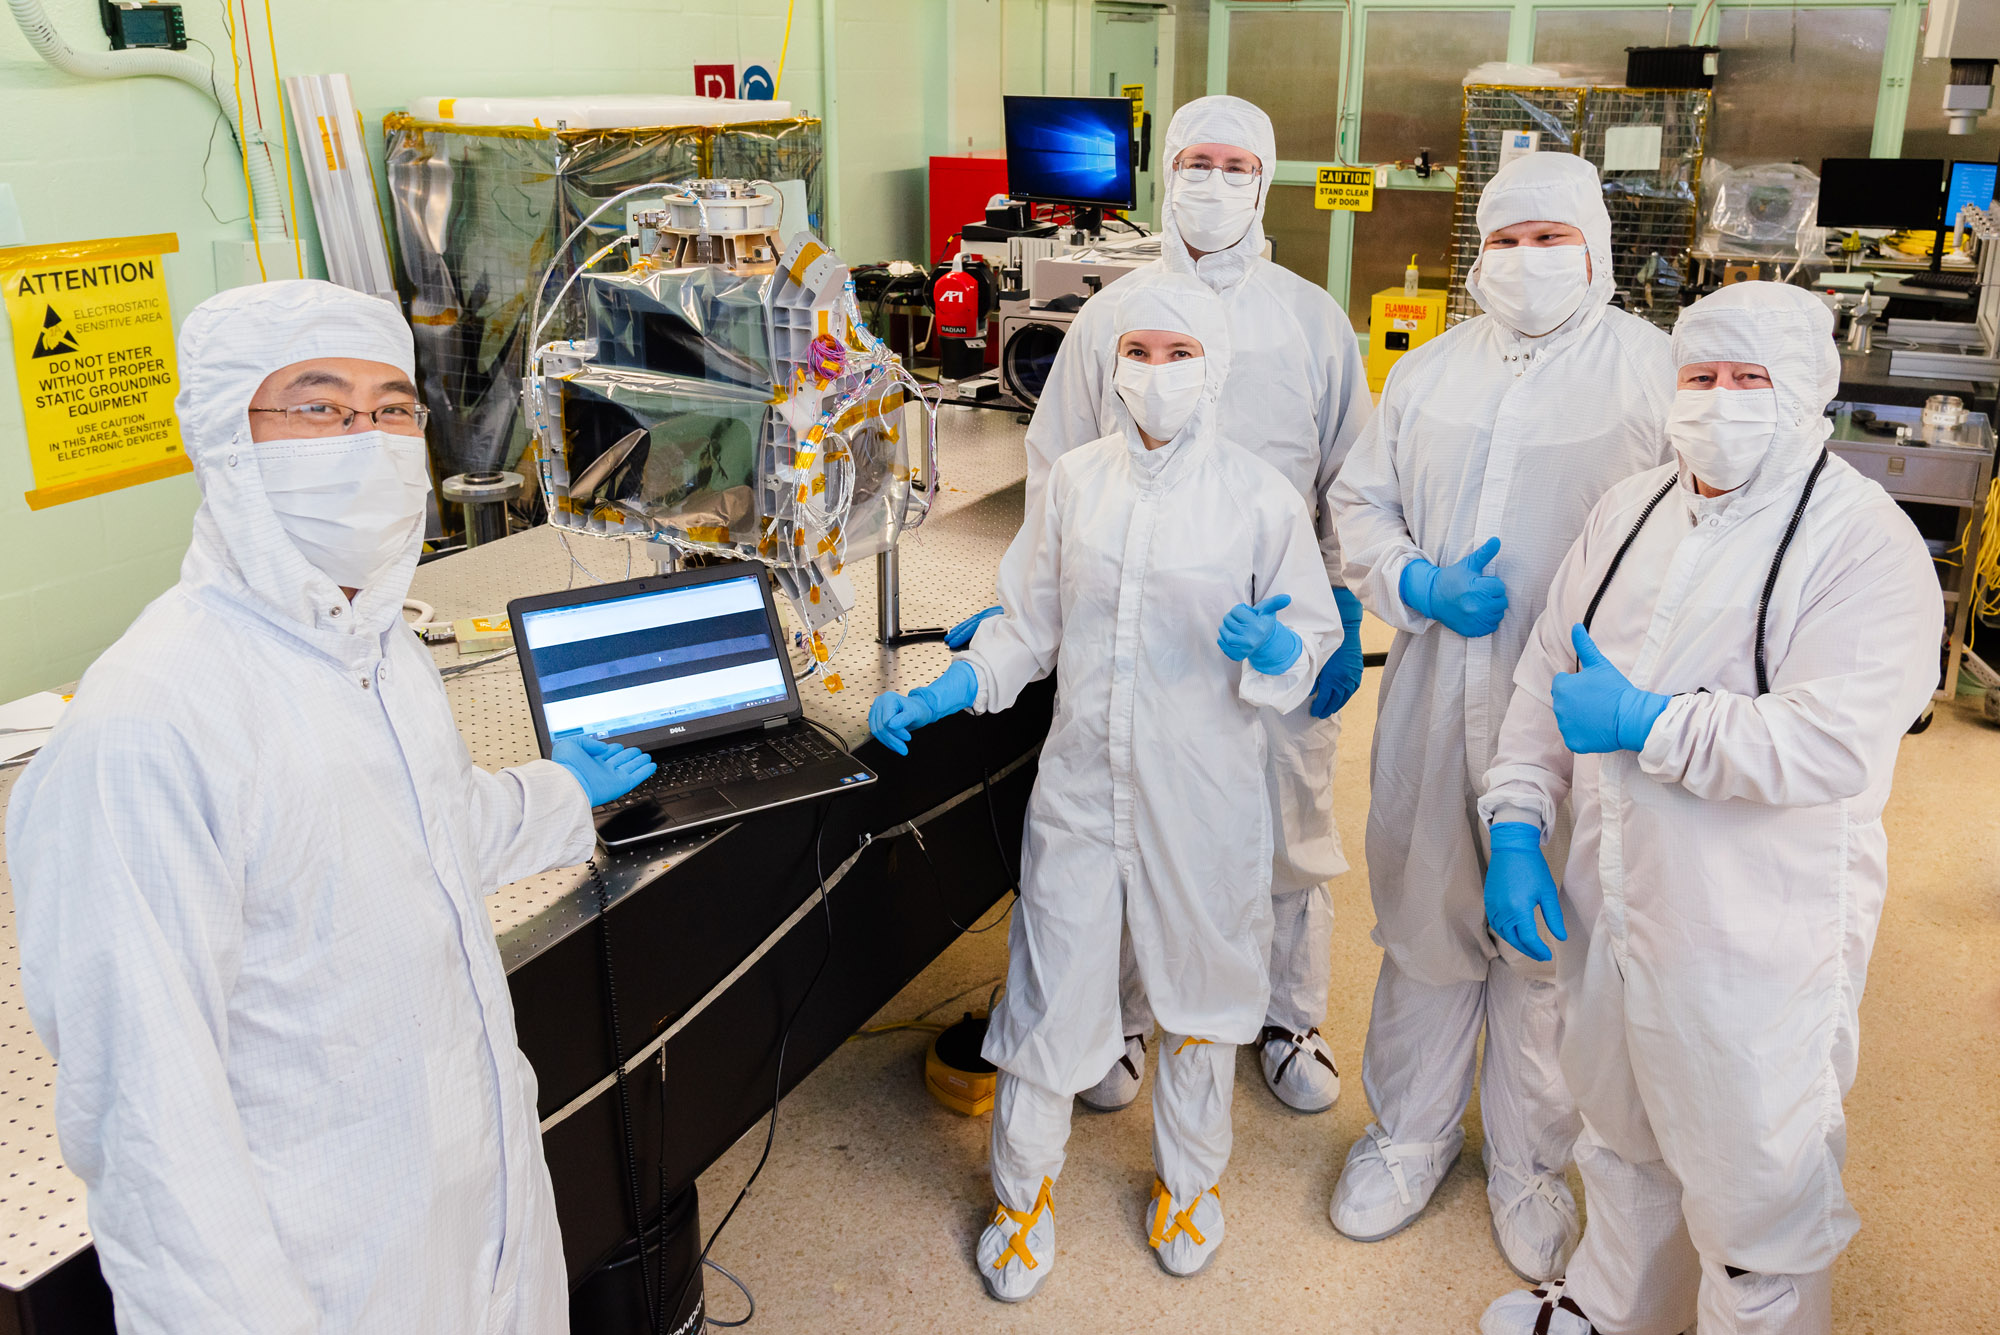
Group photo with HARP2 polarimeter. Credit: Henry, Dennis (Denny)
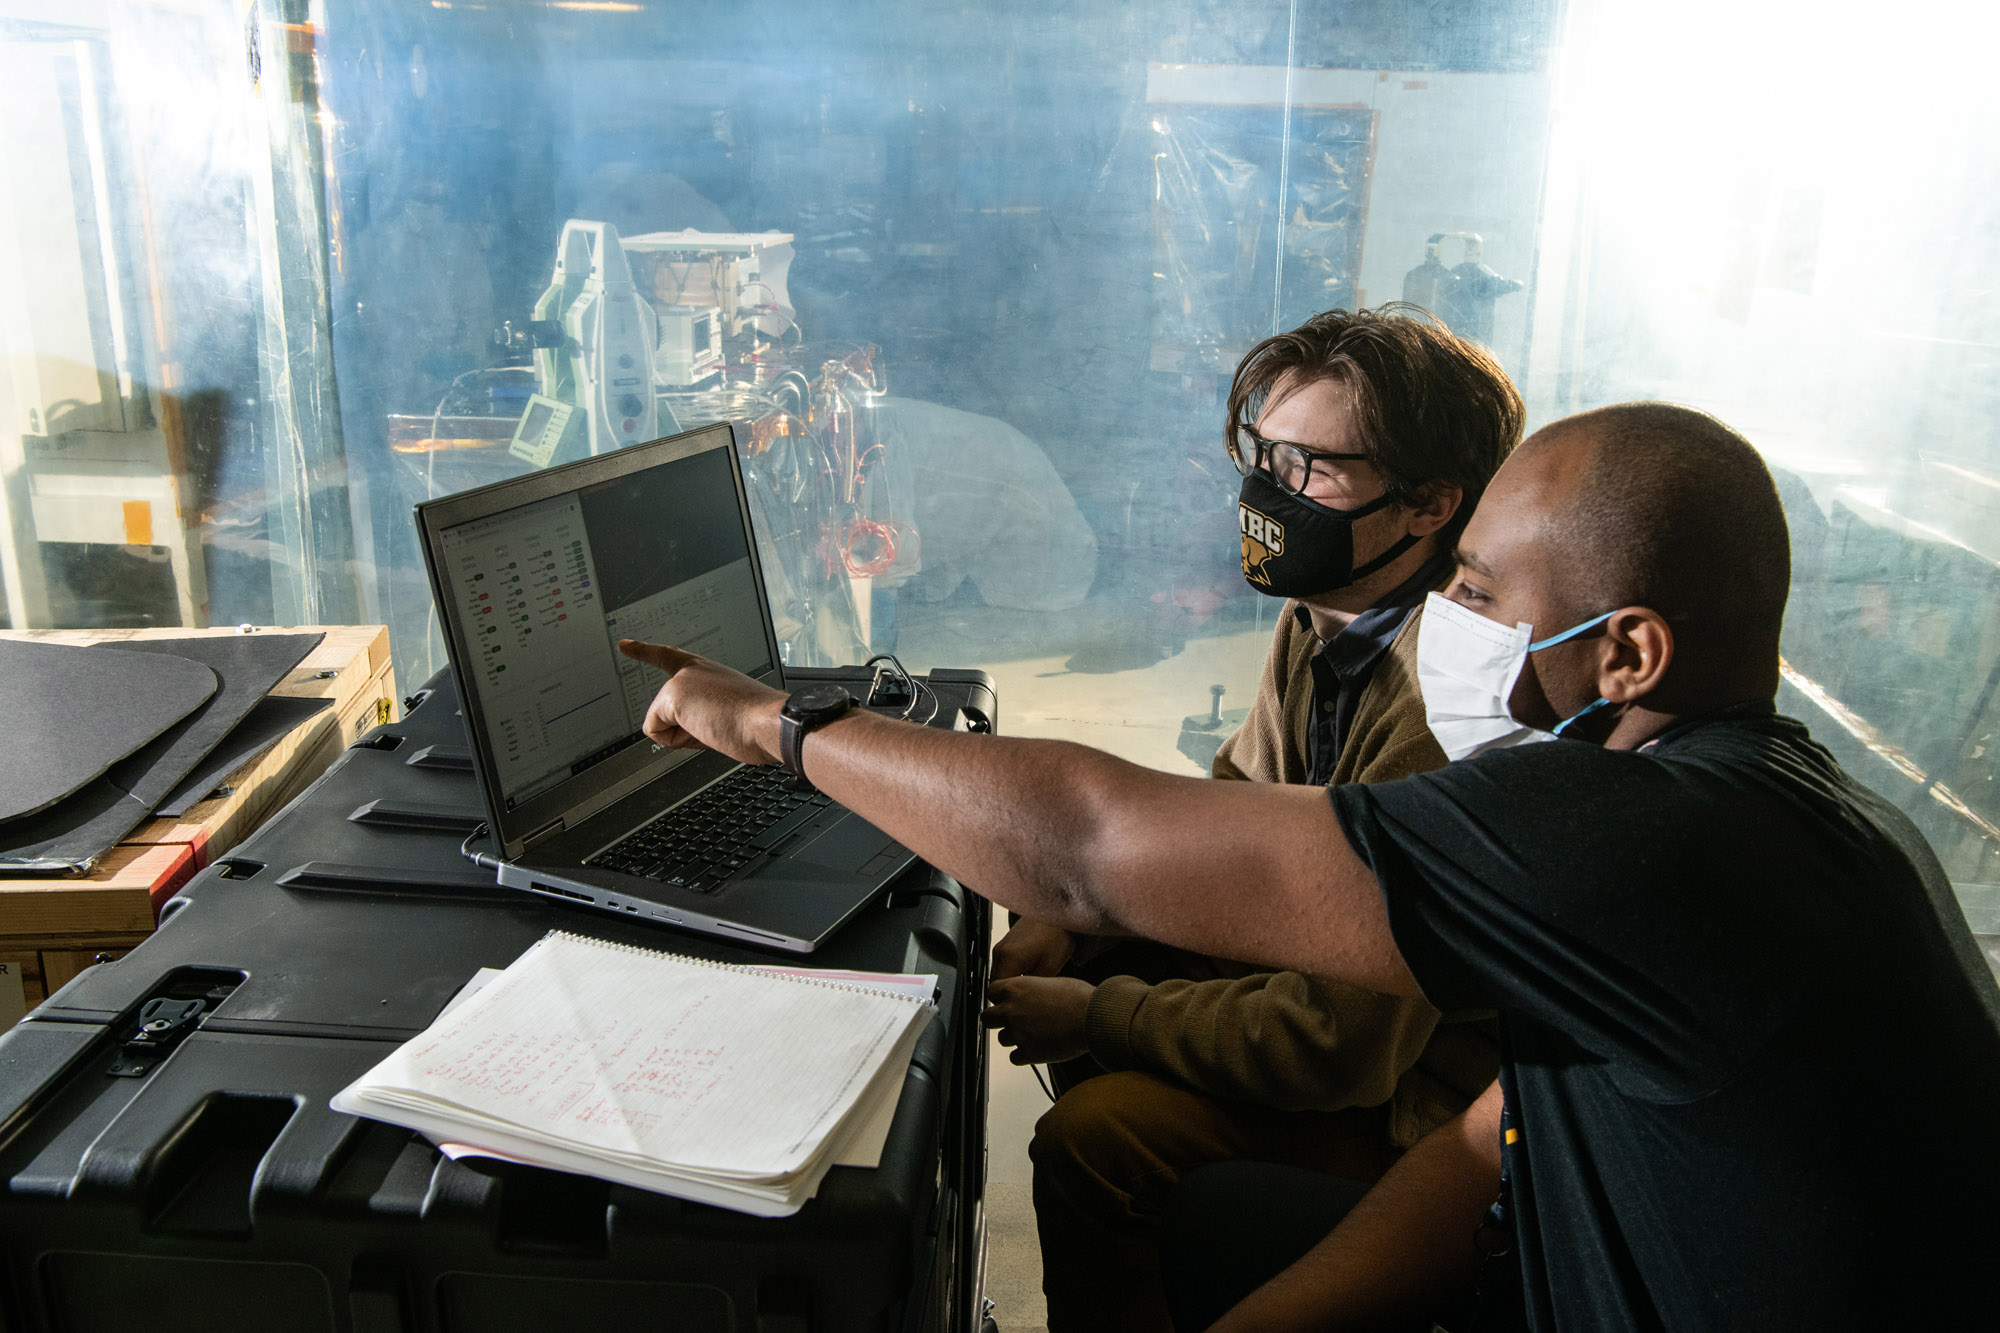
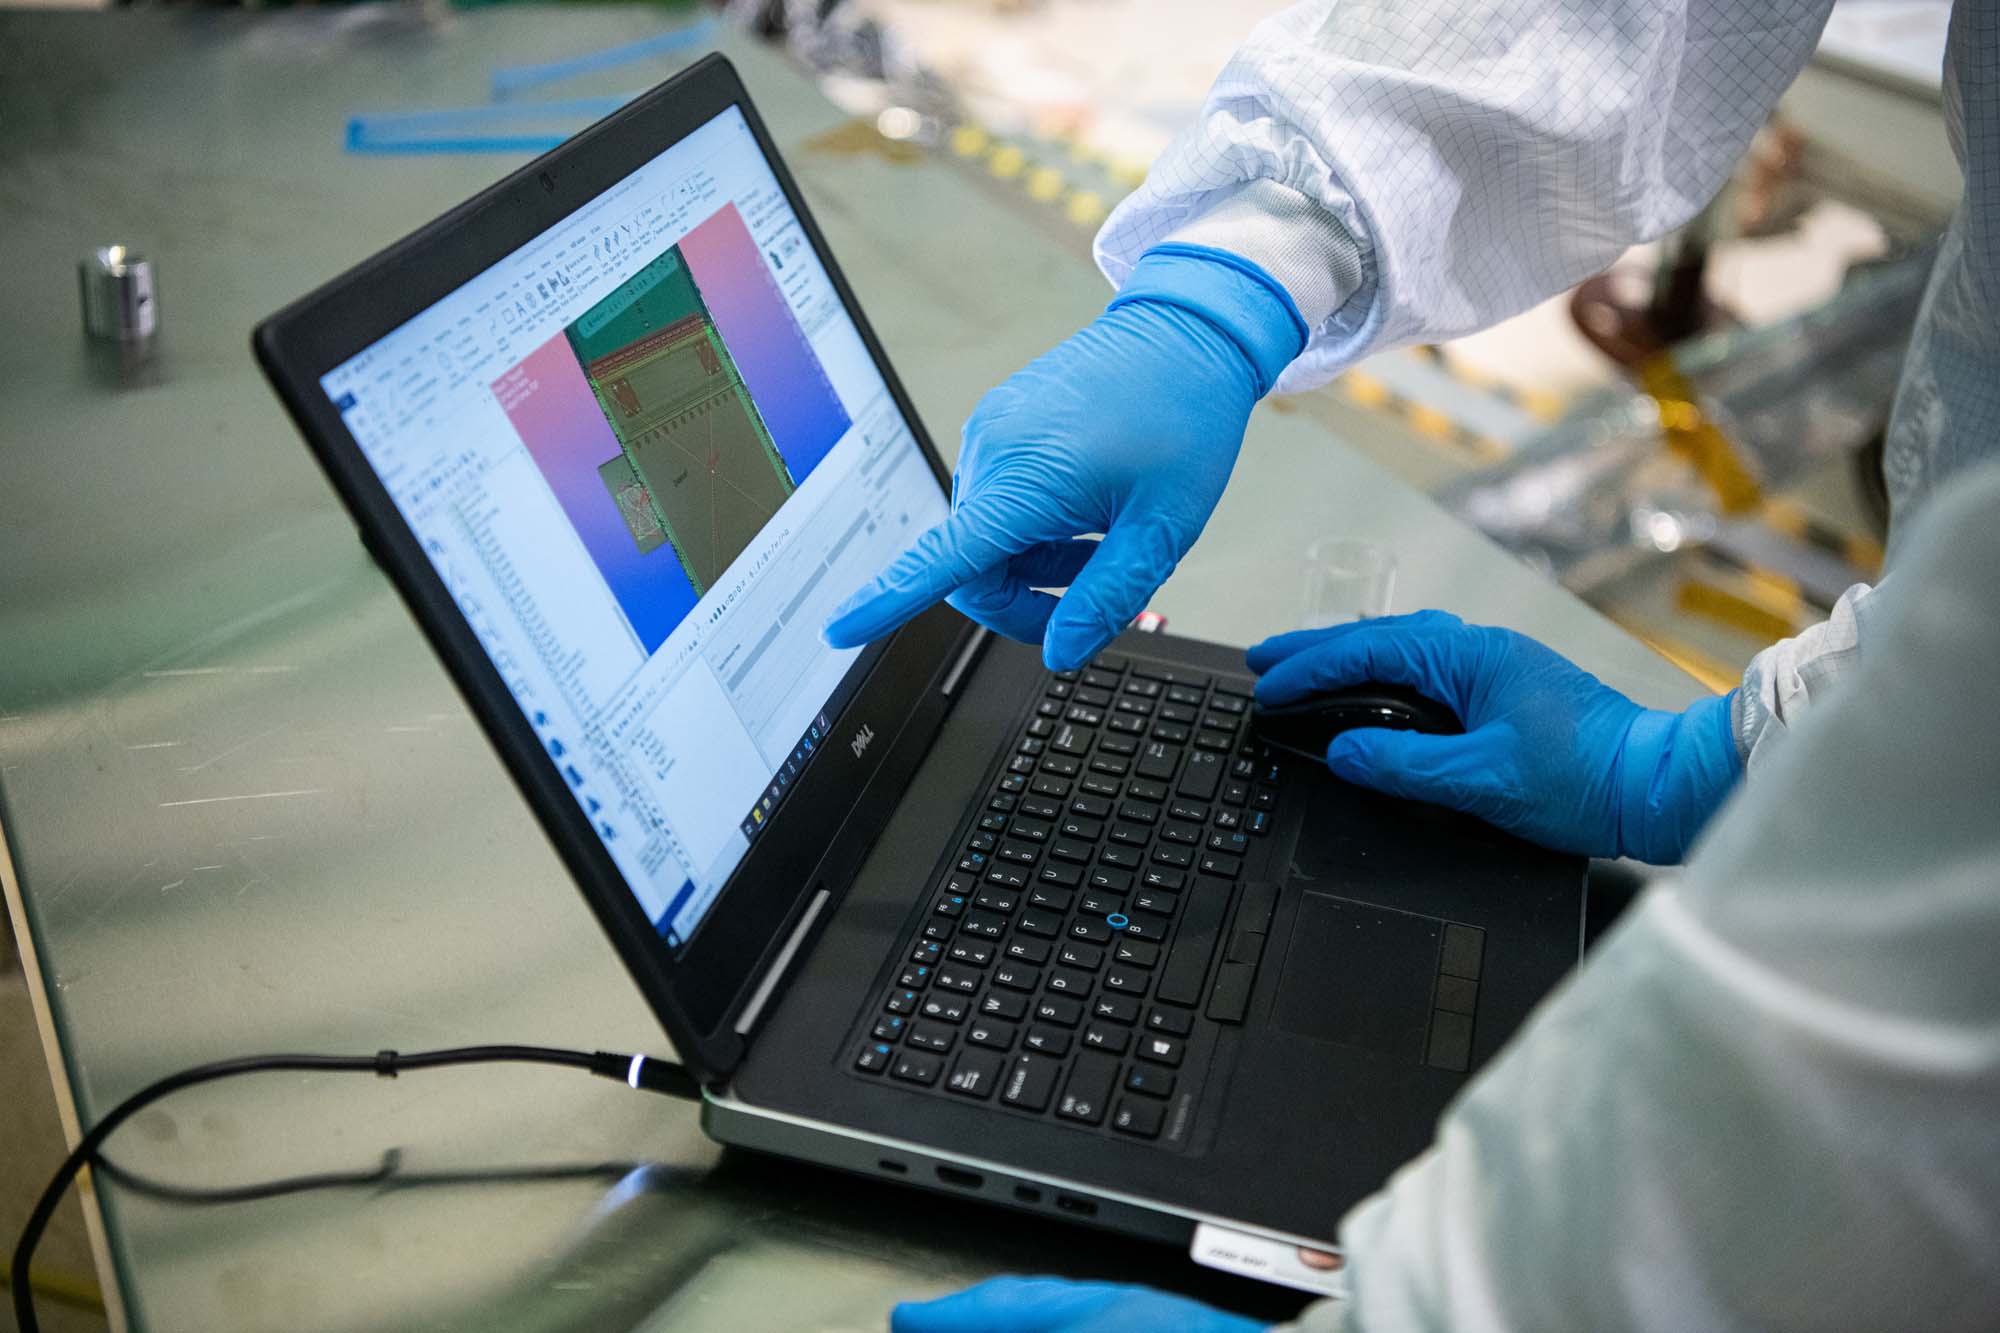
Reviewing data from the boresight alignment of HARP2 polarimeter. Credit: Henry, Dennis (Denny)
Ground system equipment setup for boresight alignment of HARP2 polarimeter. Credit: Henry, Dennis (Denny)
HARP2 VIEW ALL »
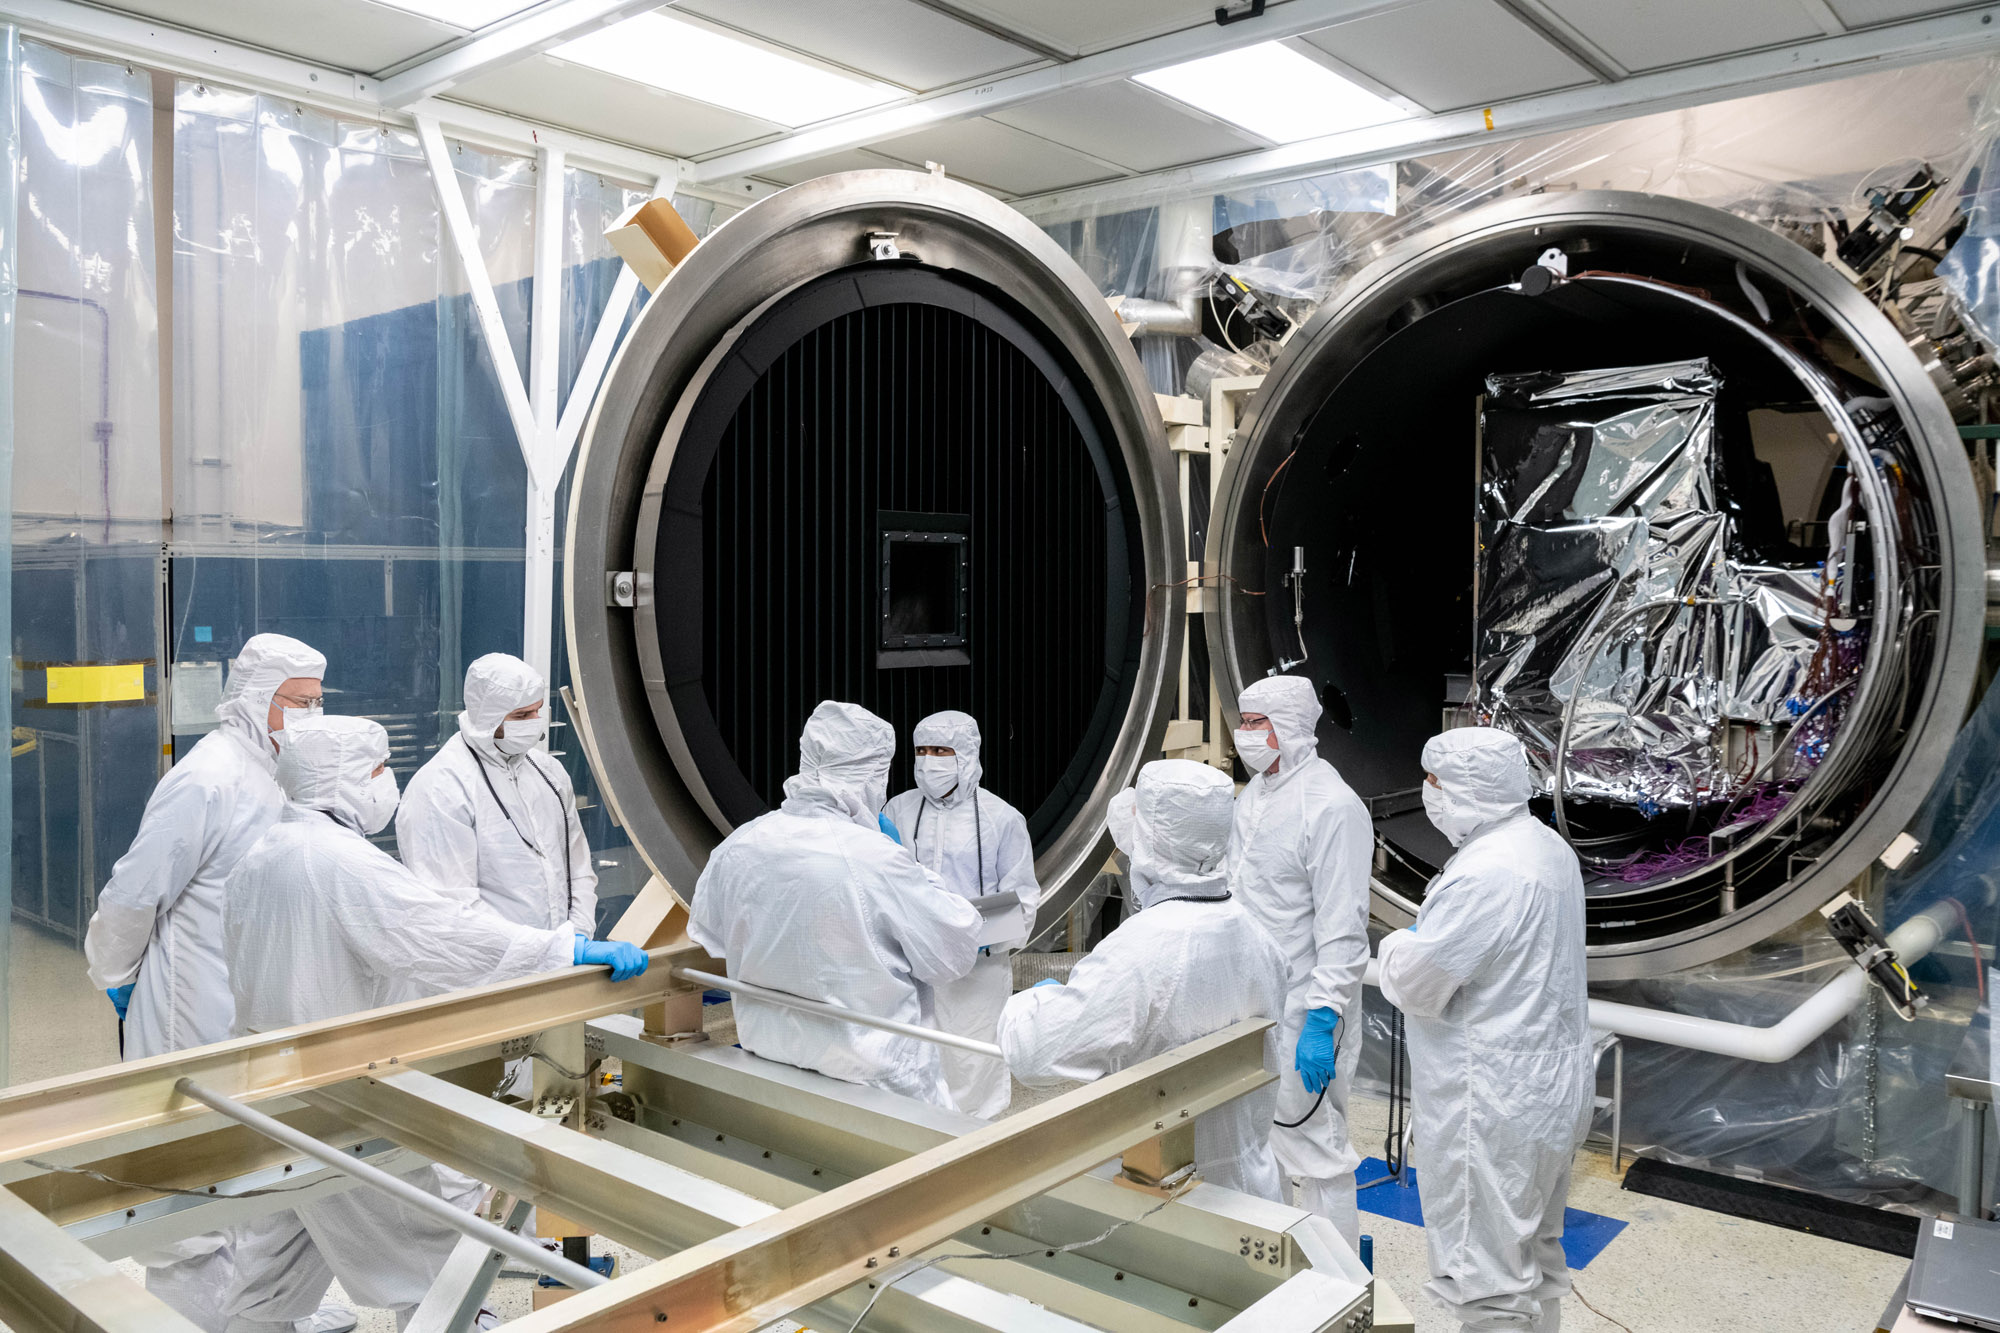
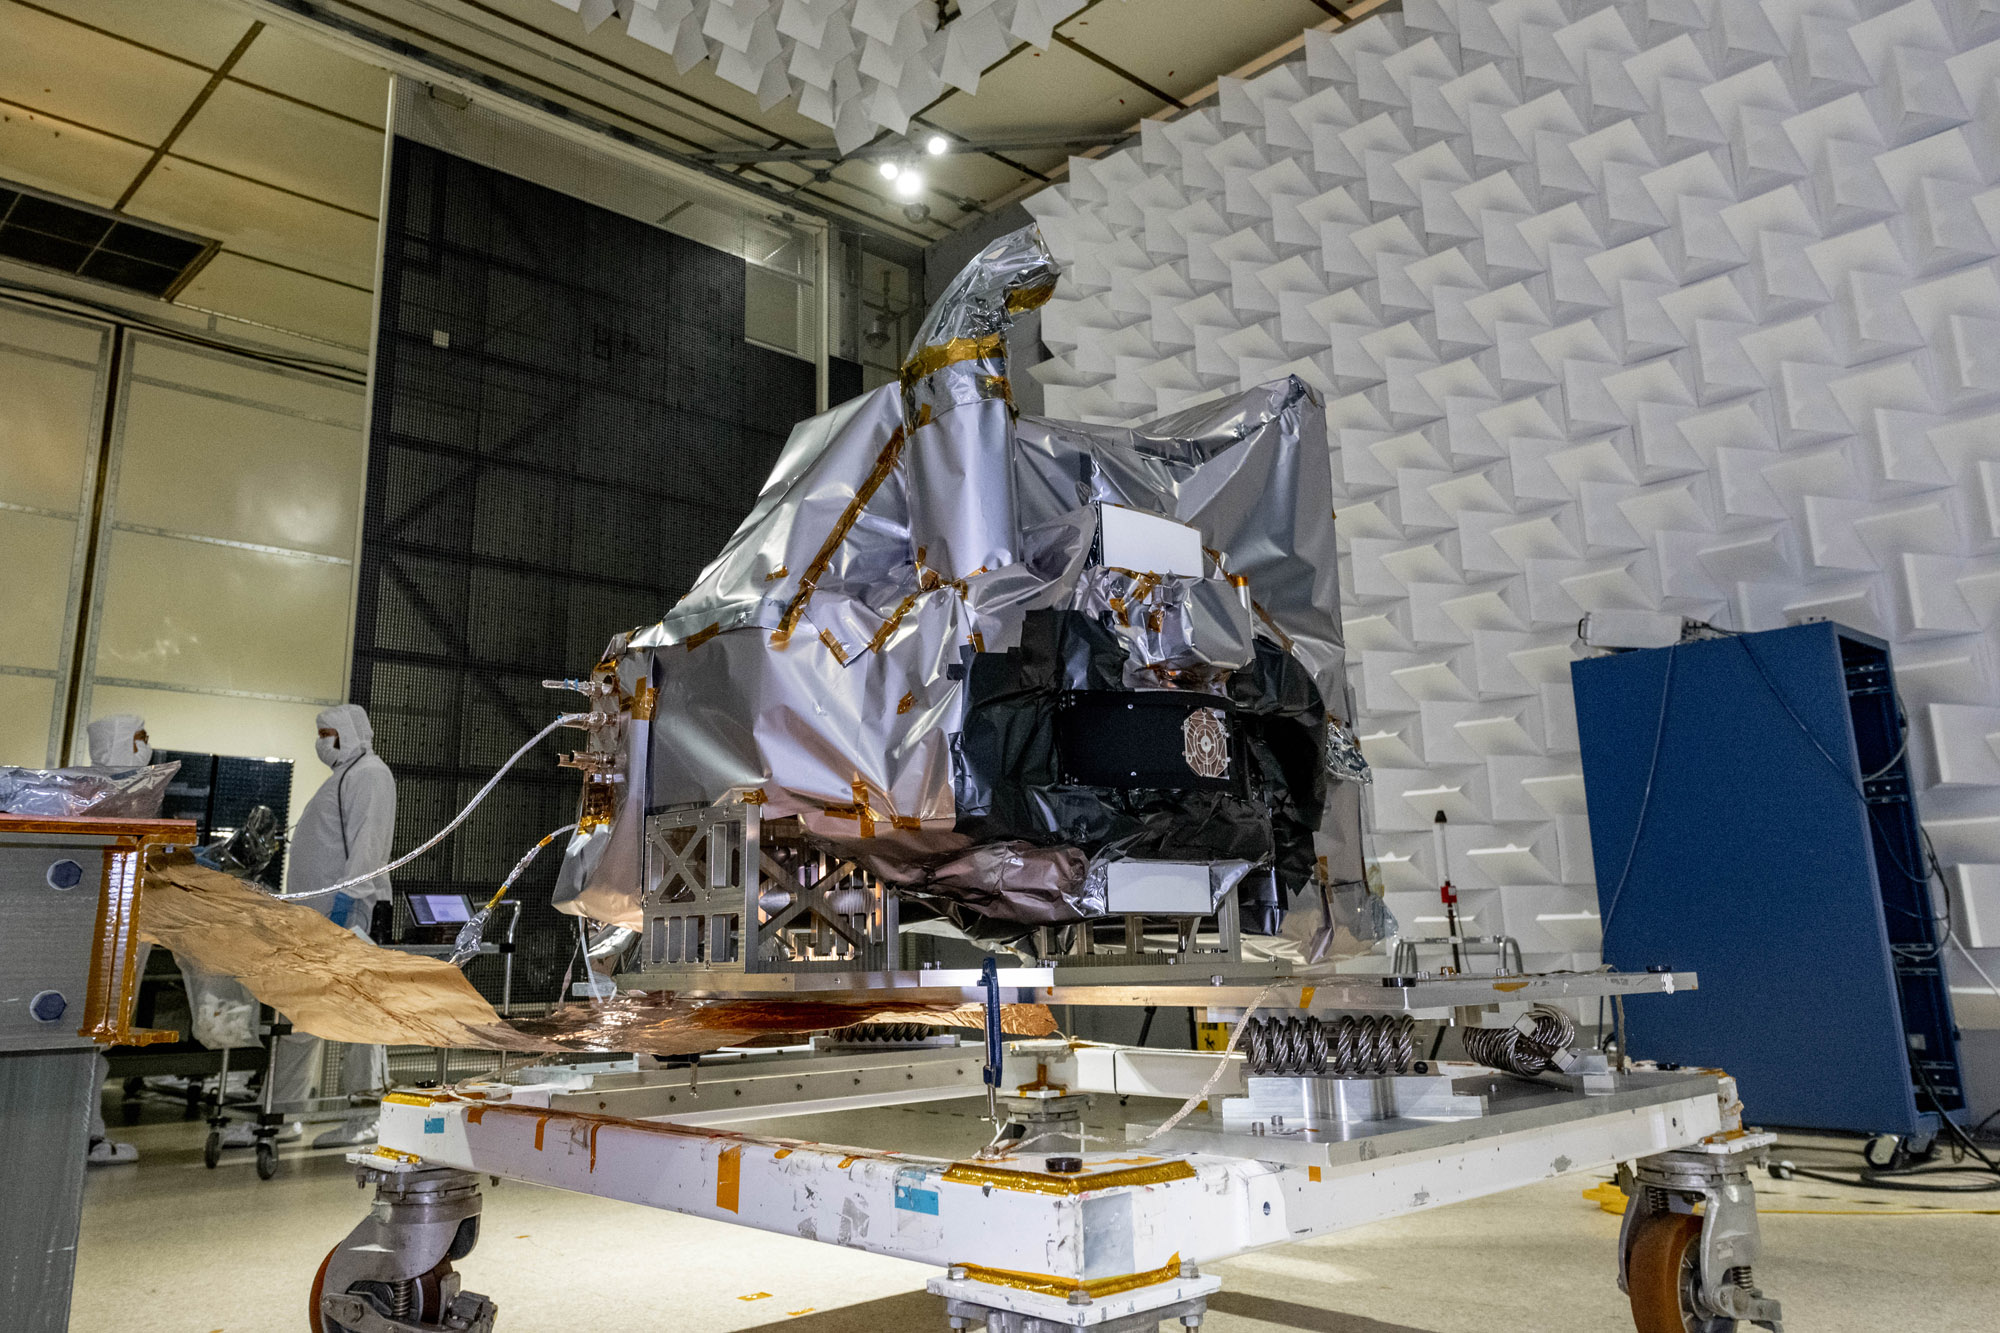
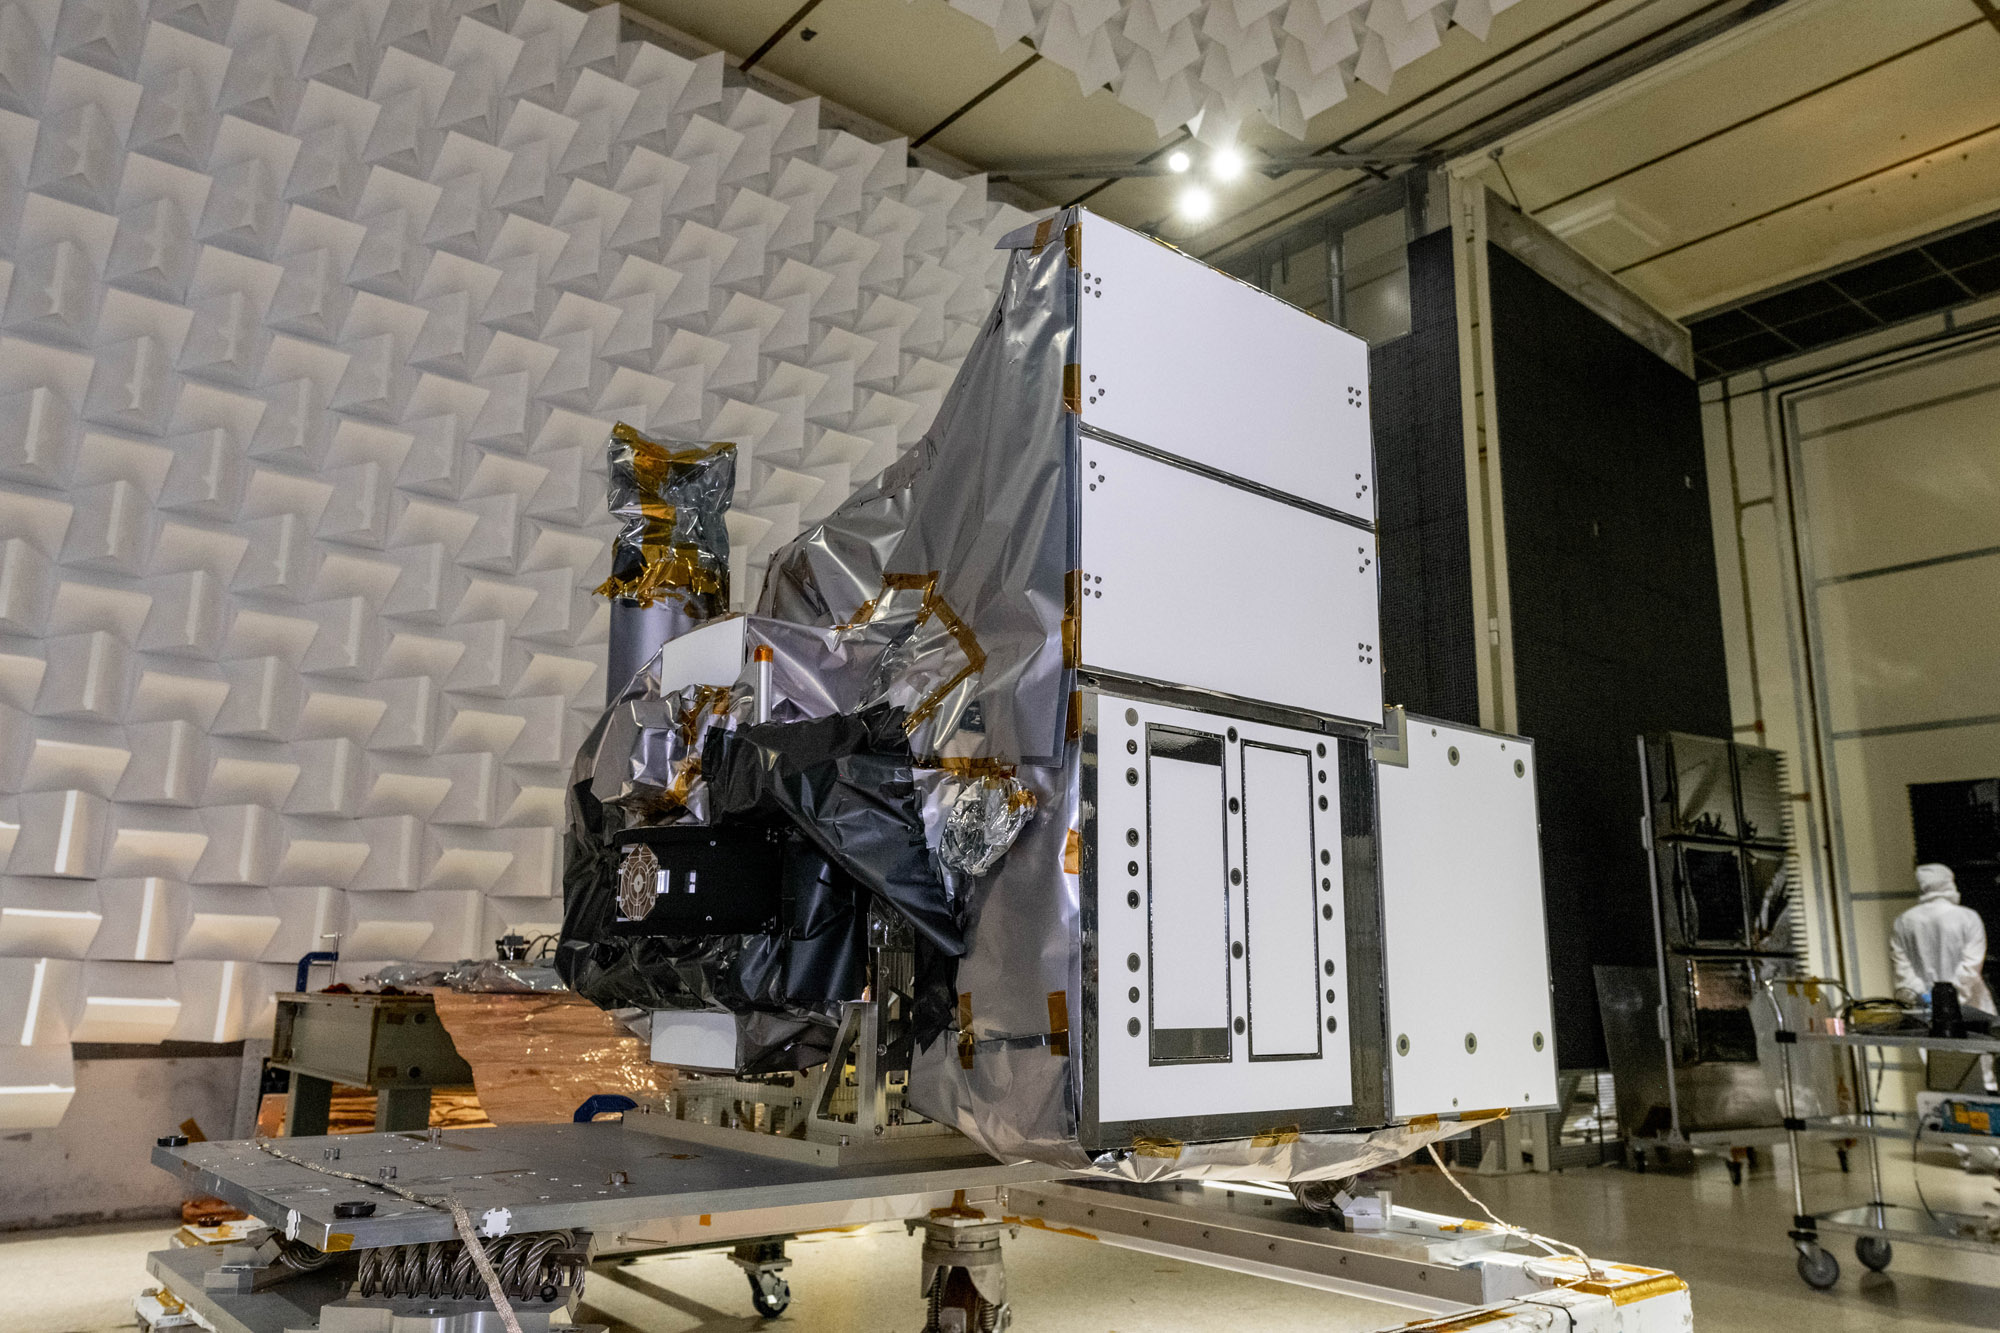
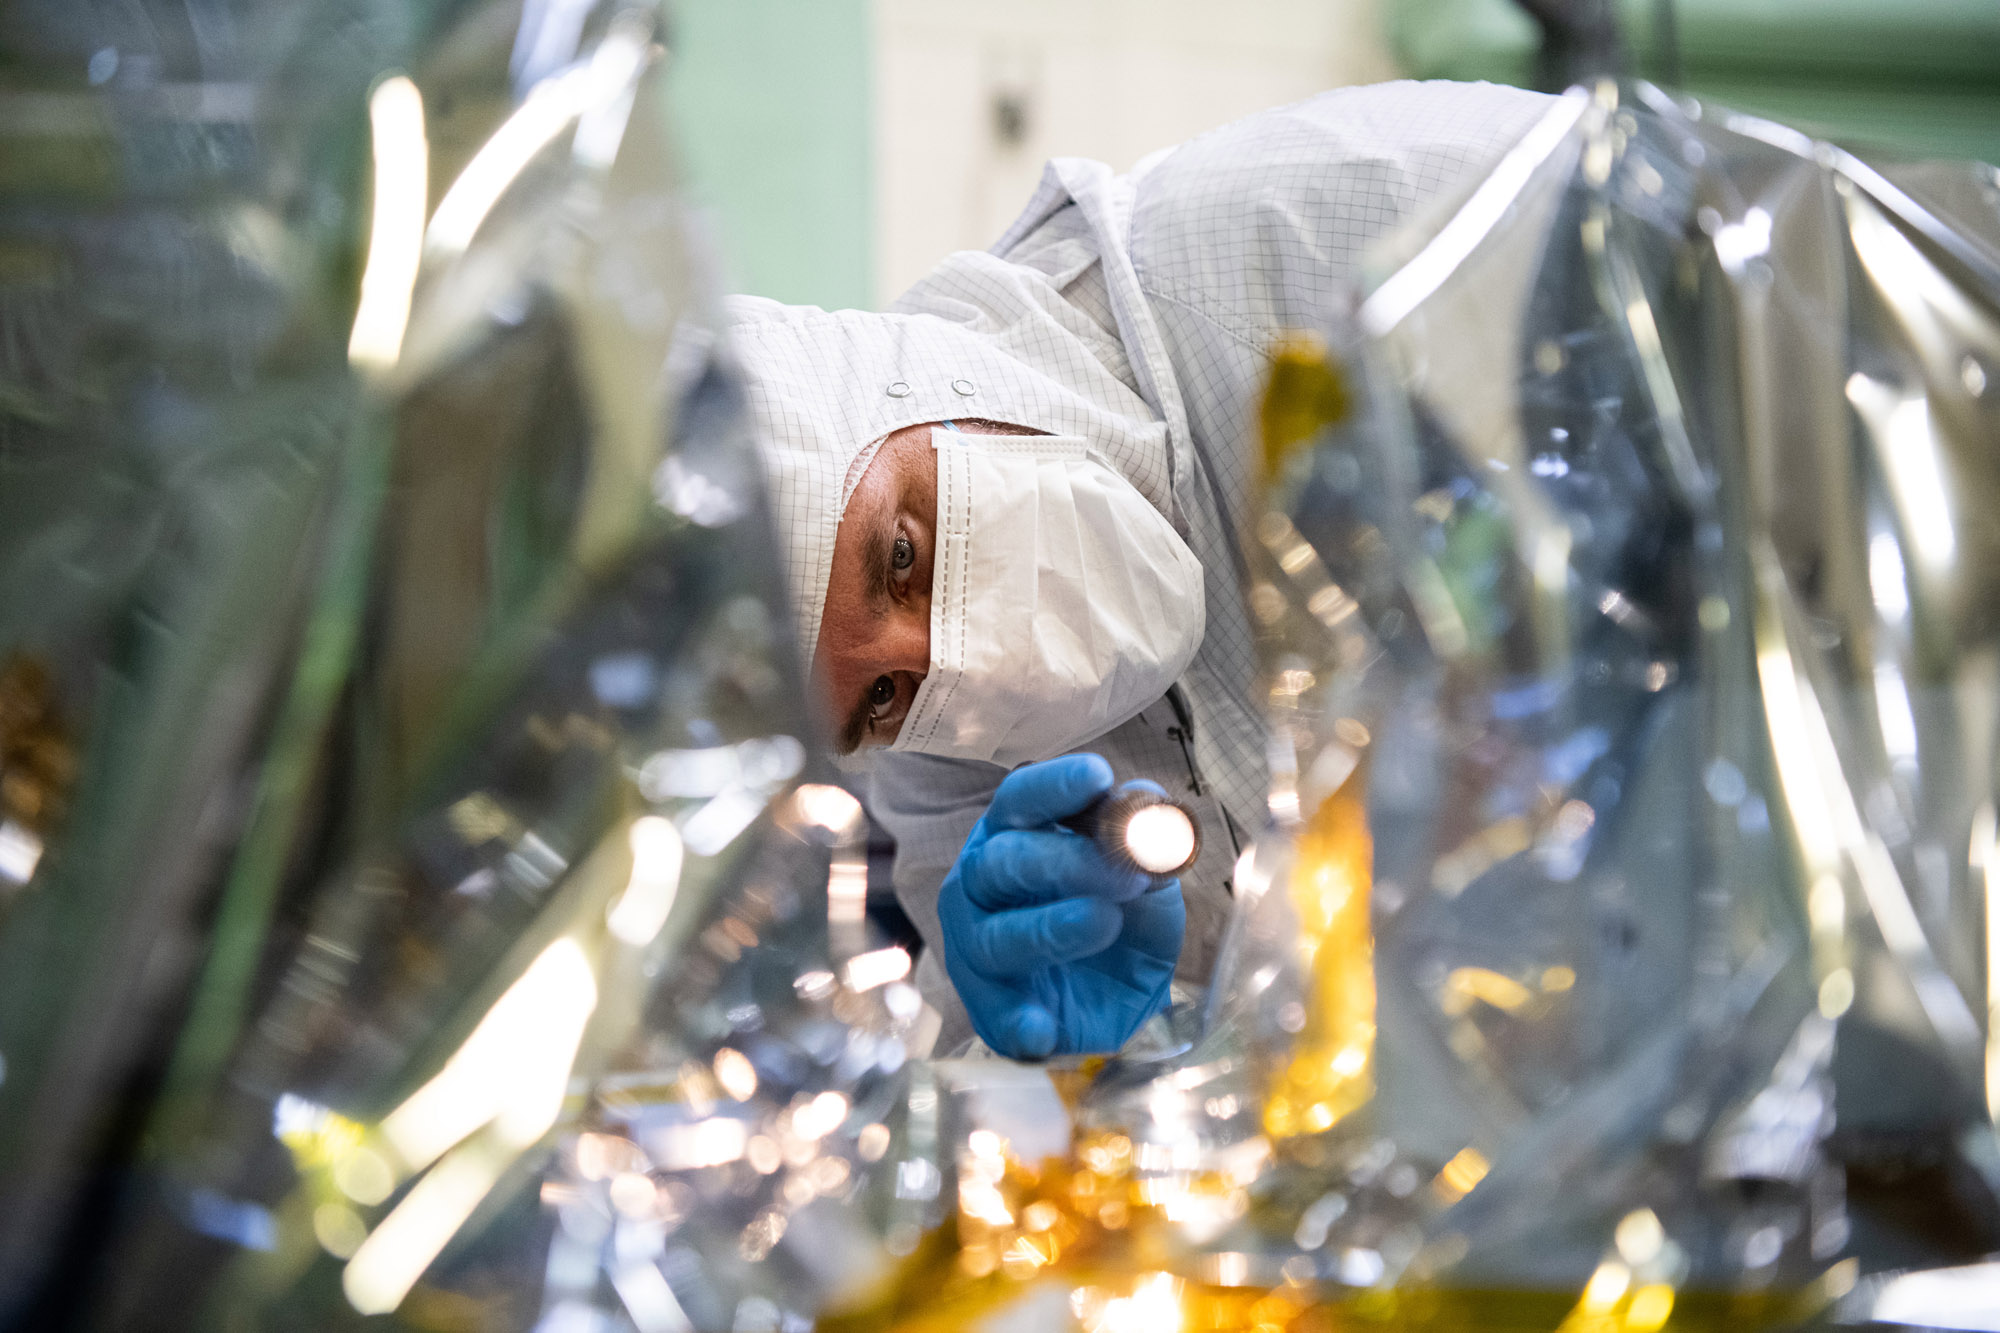
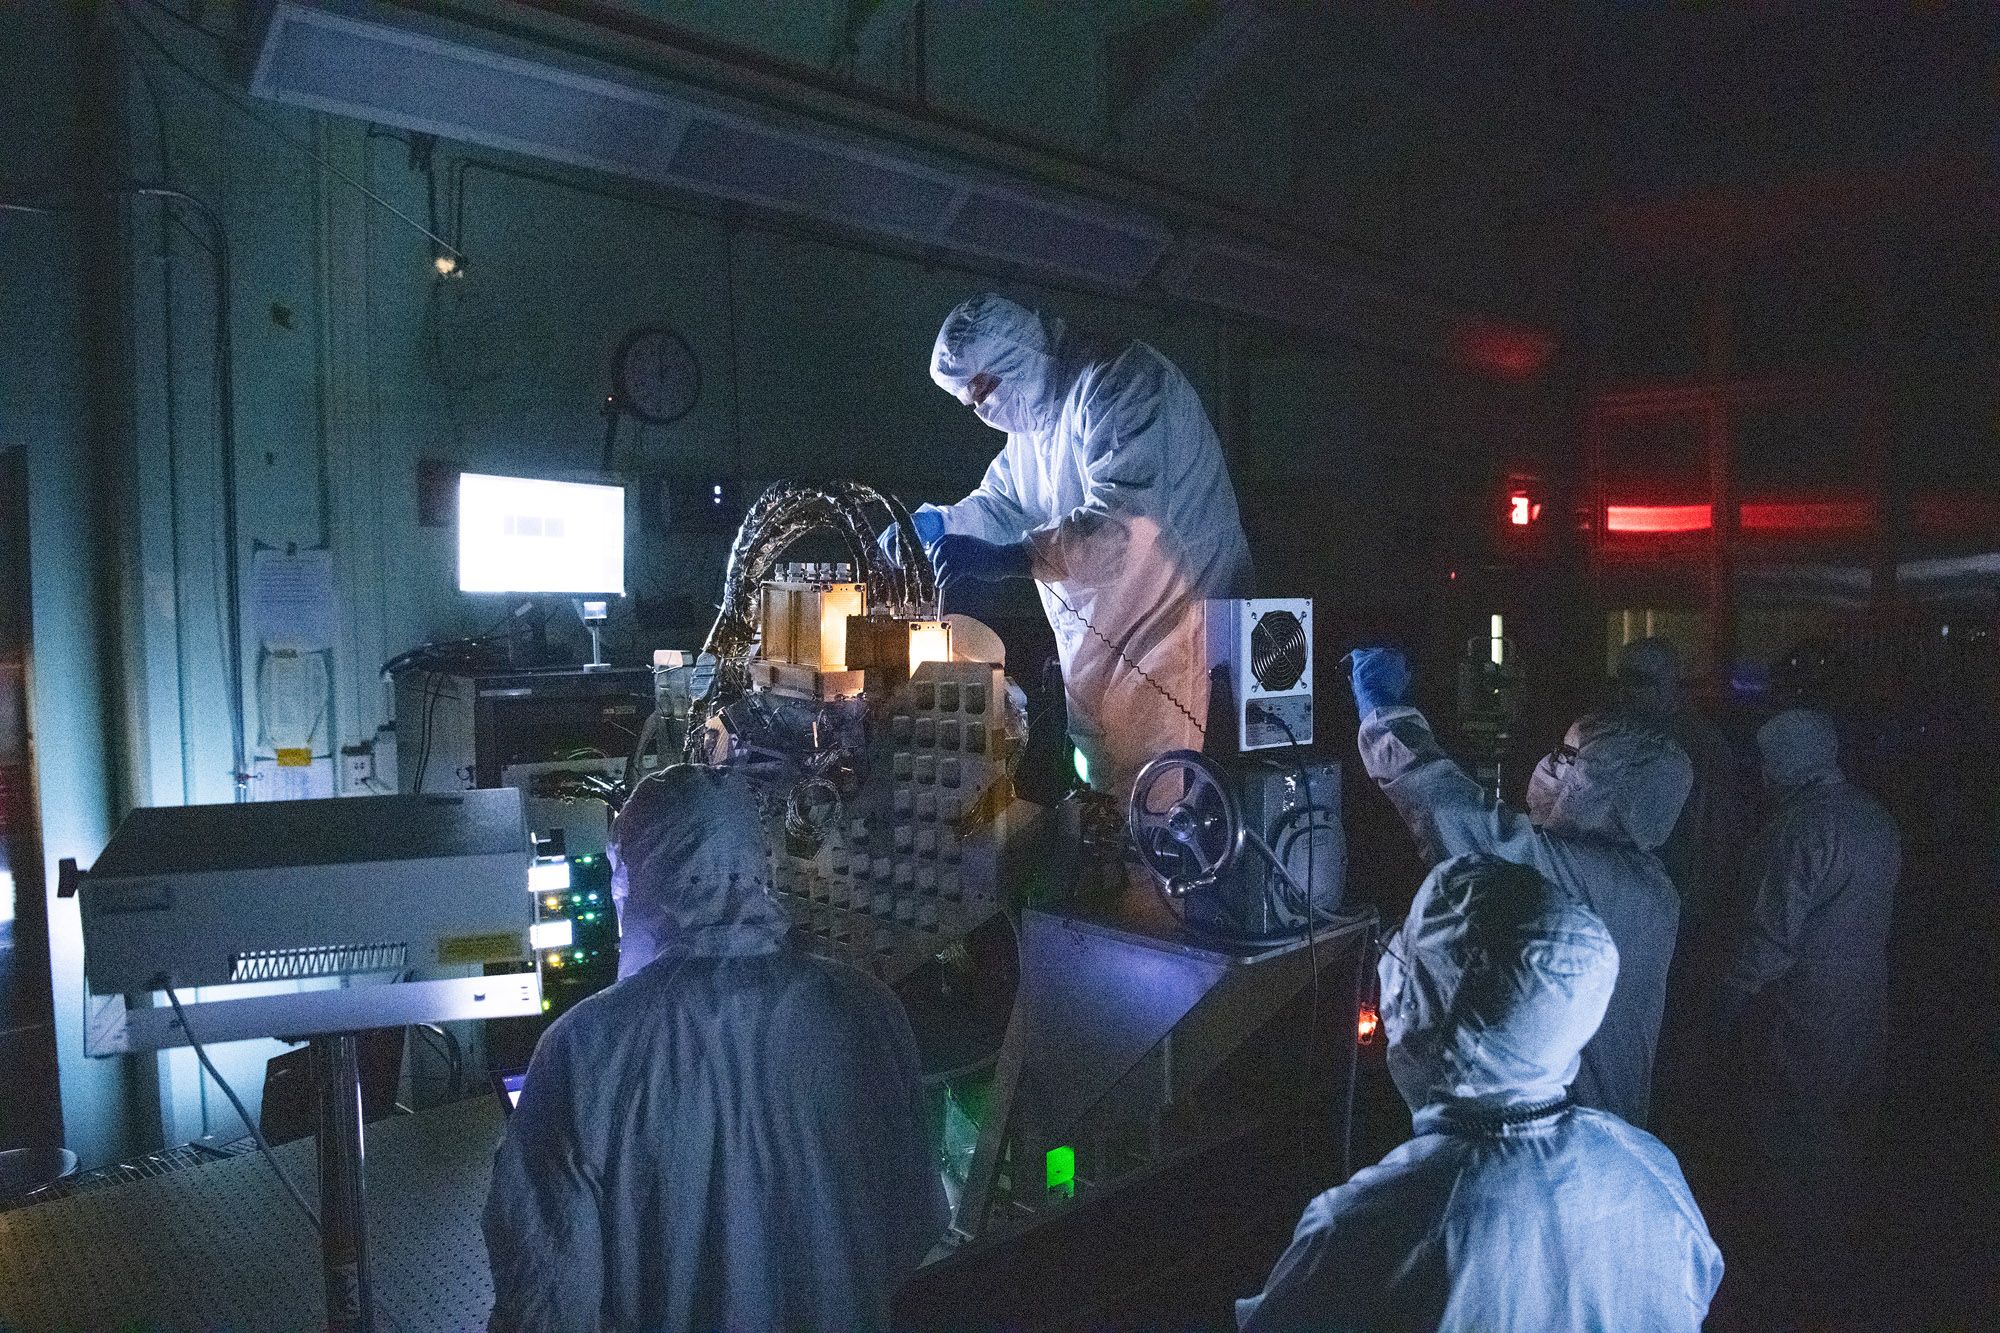
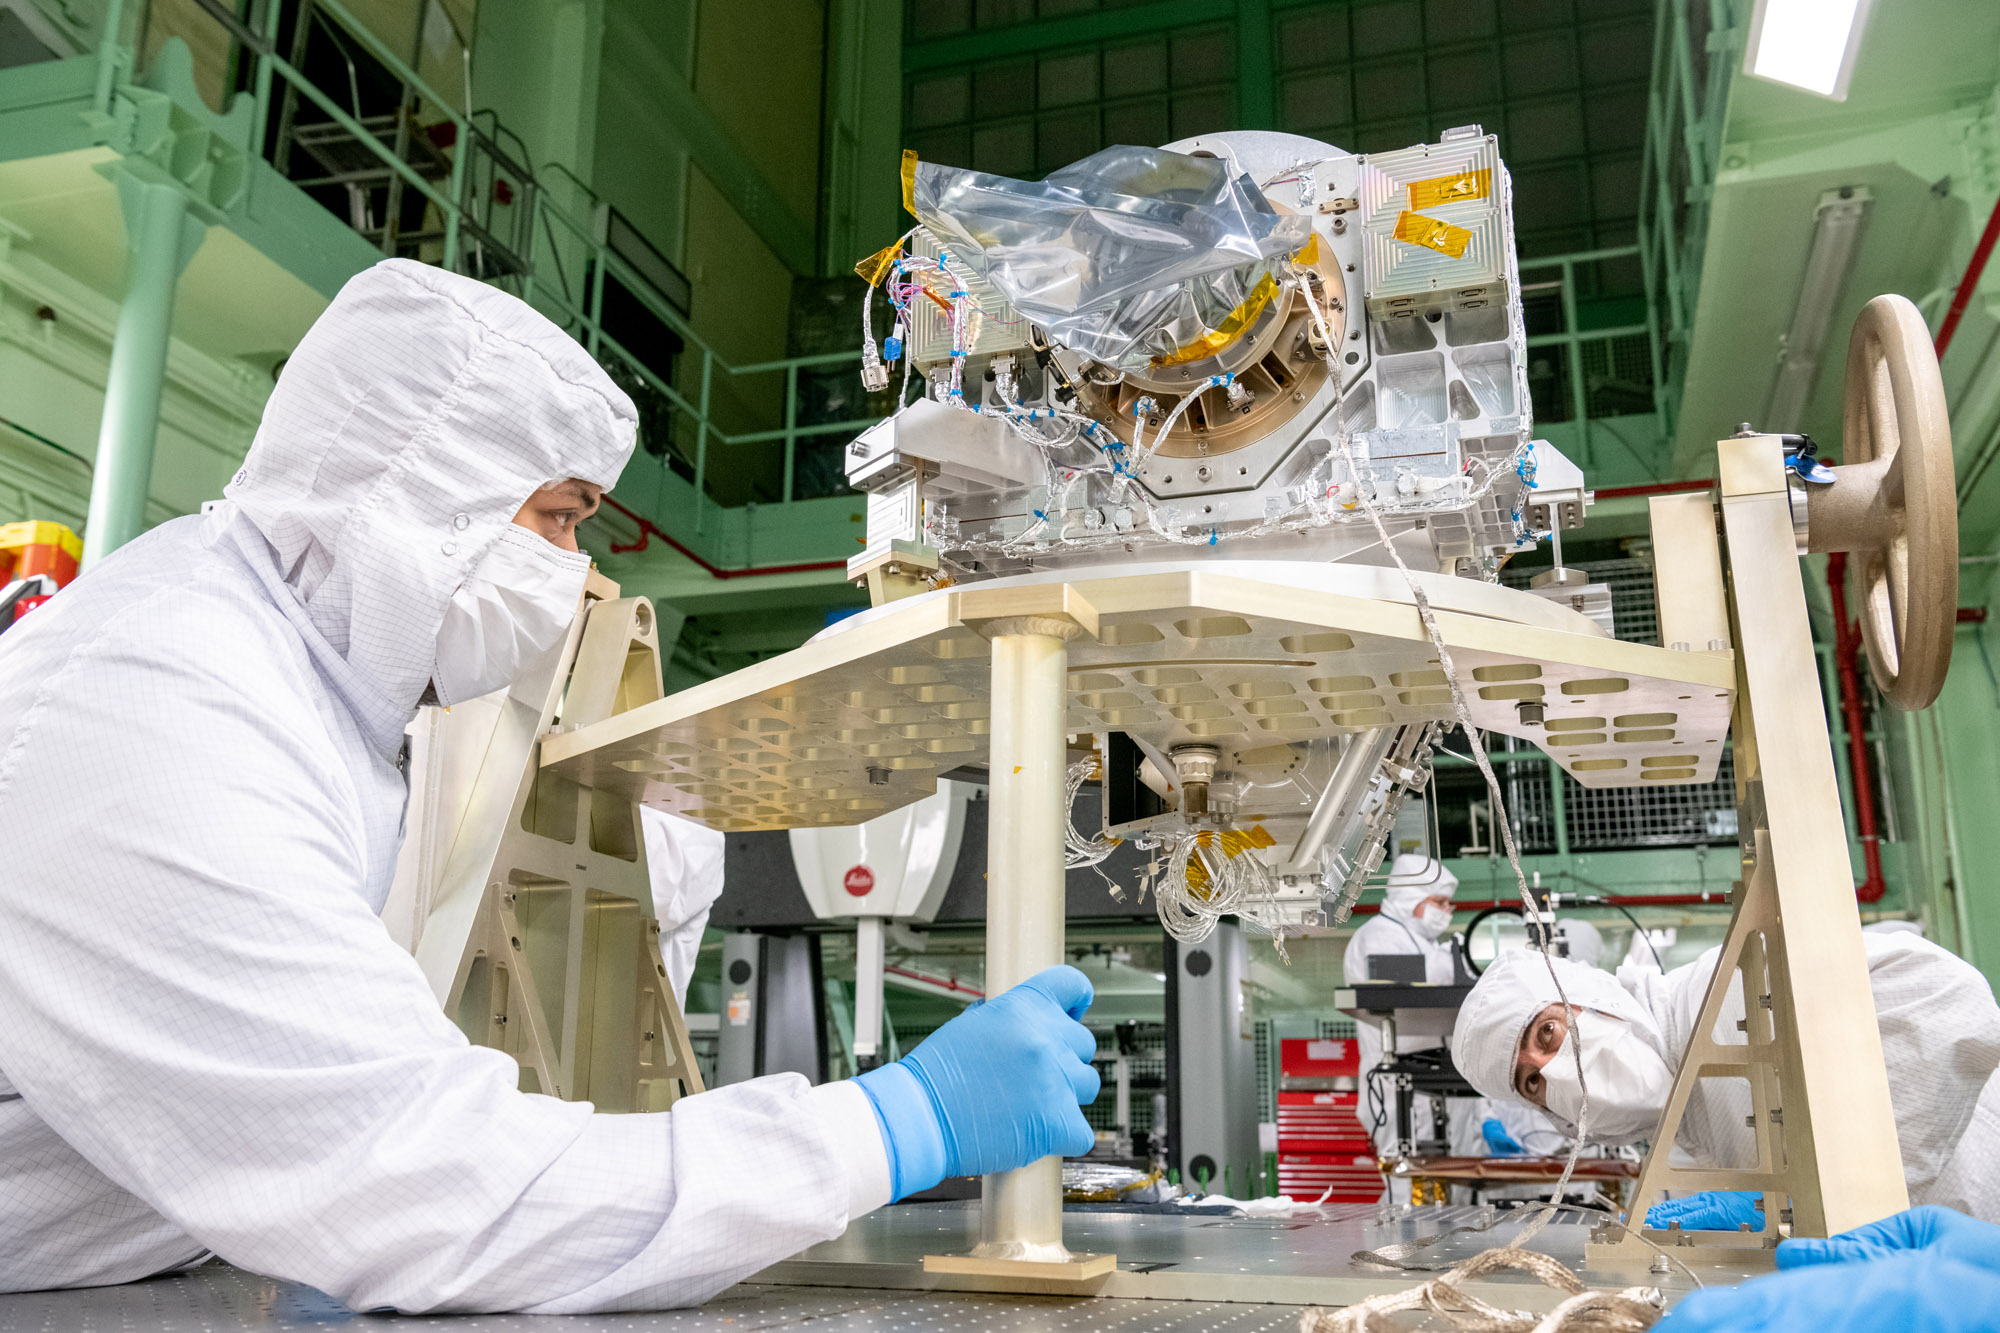
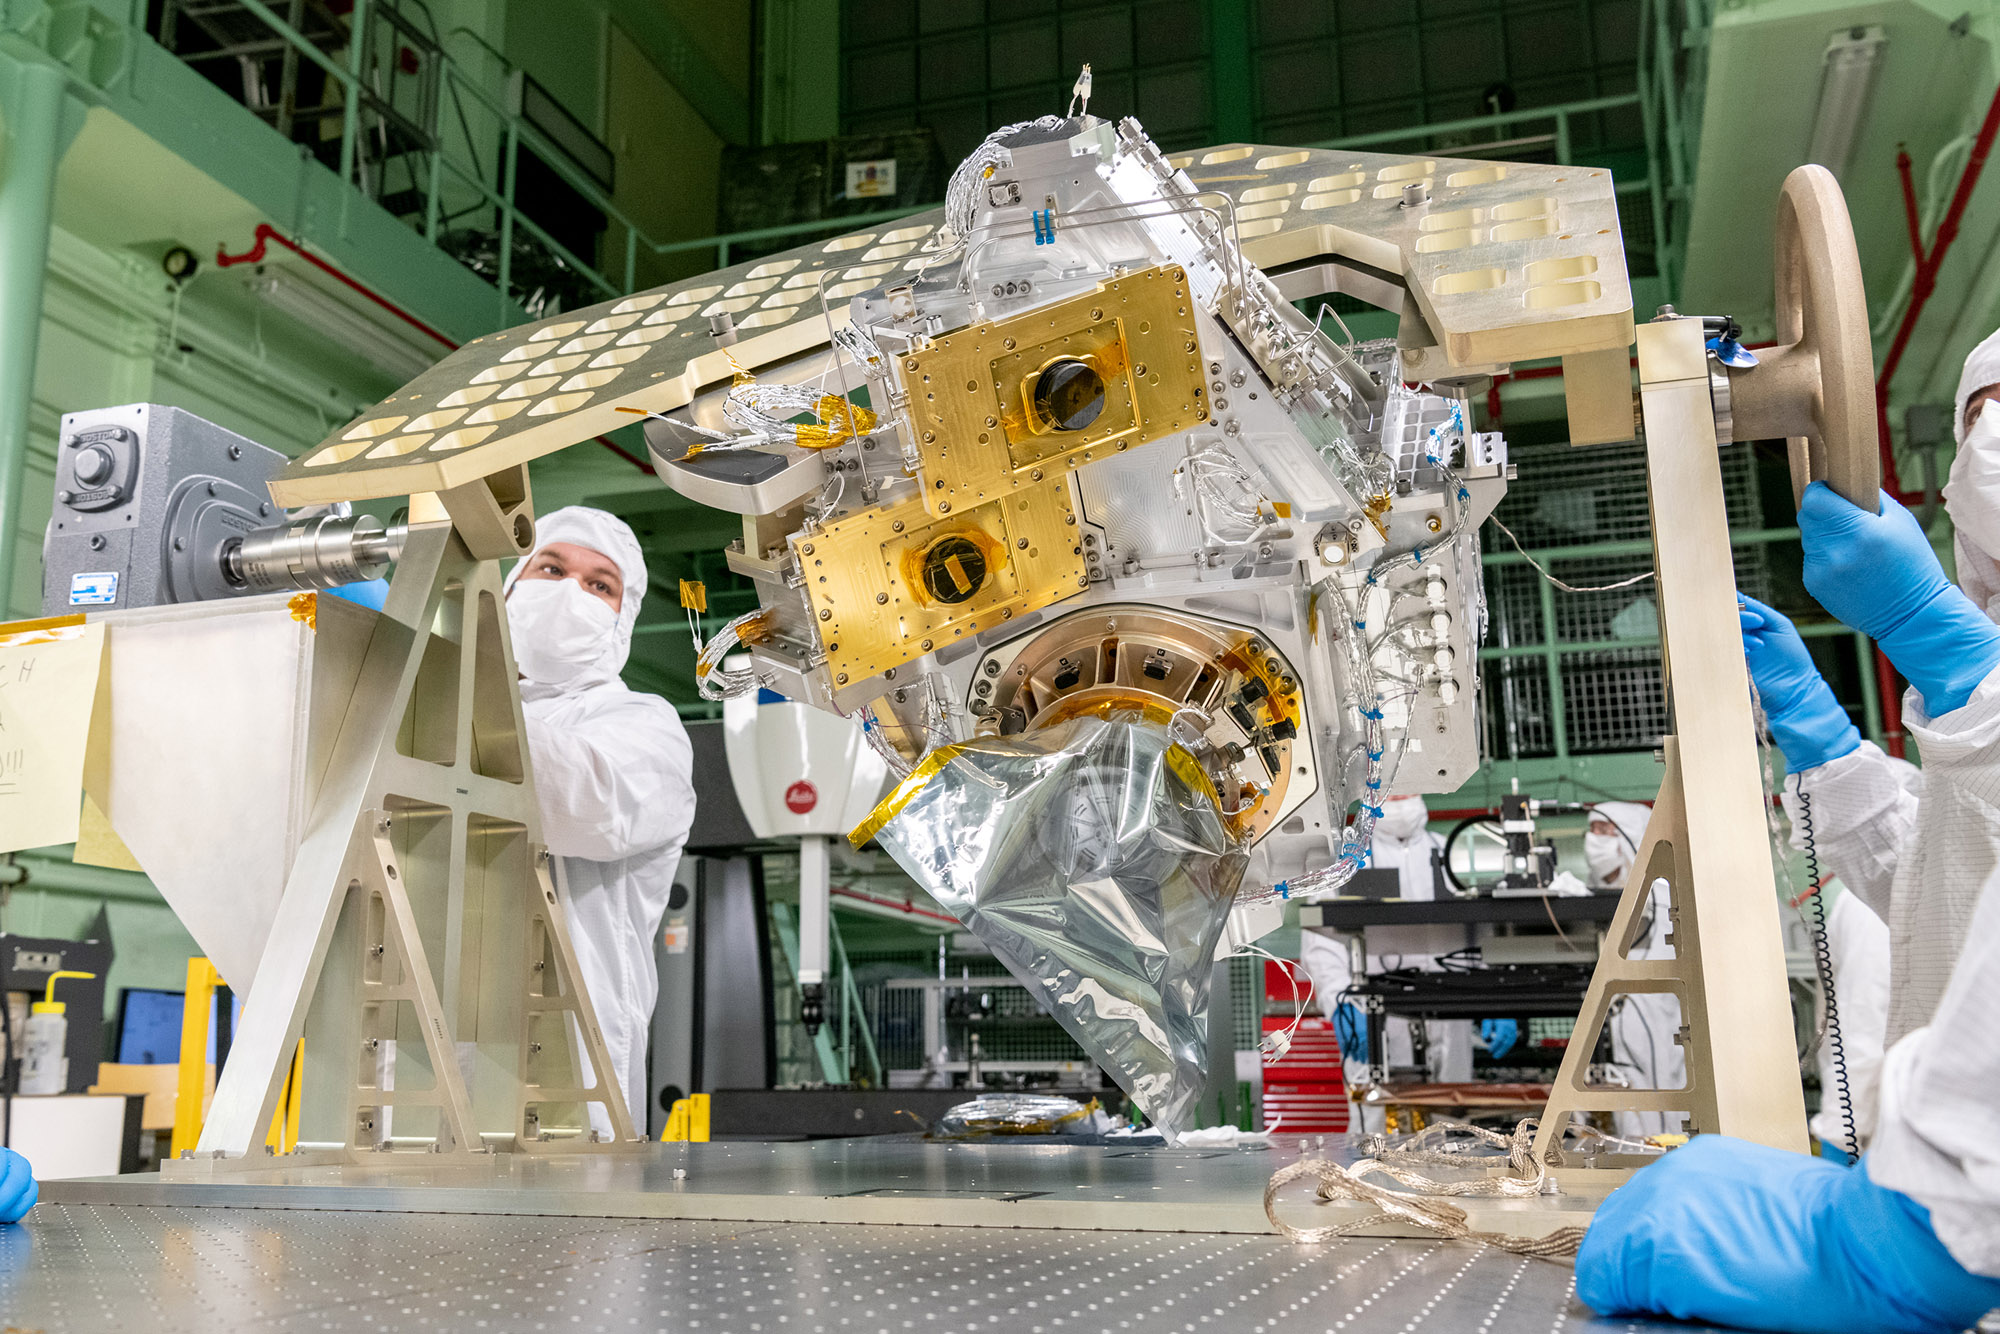
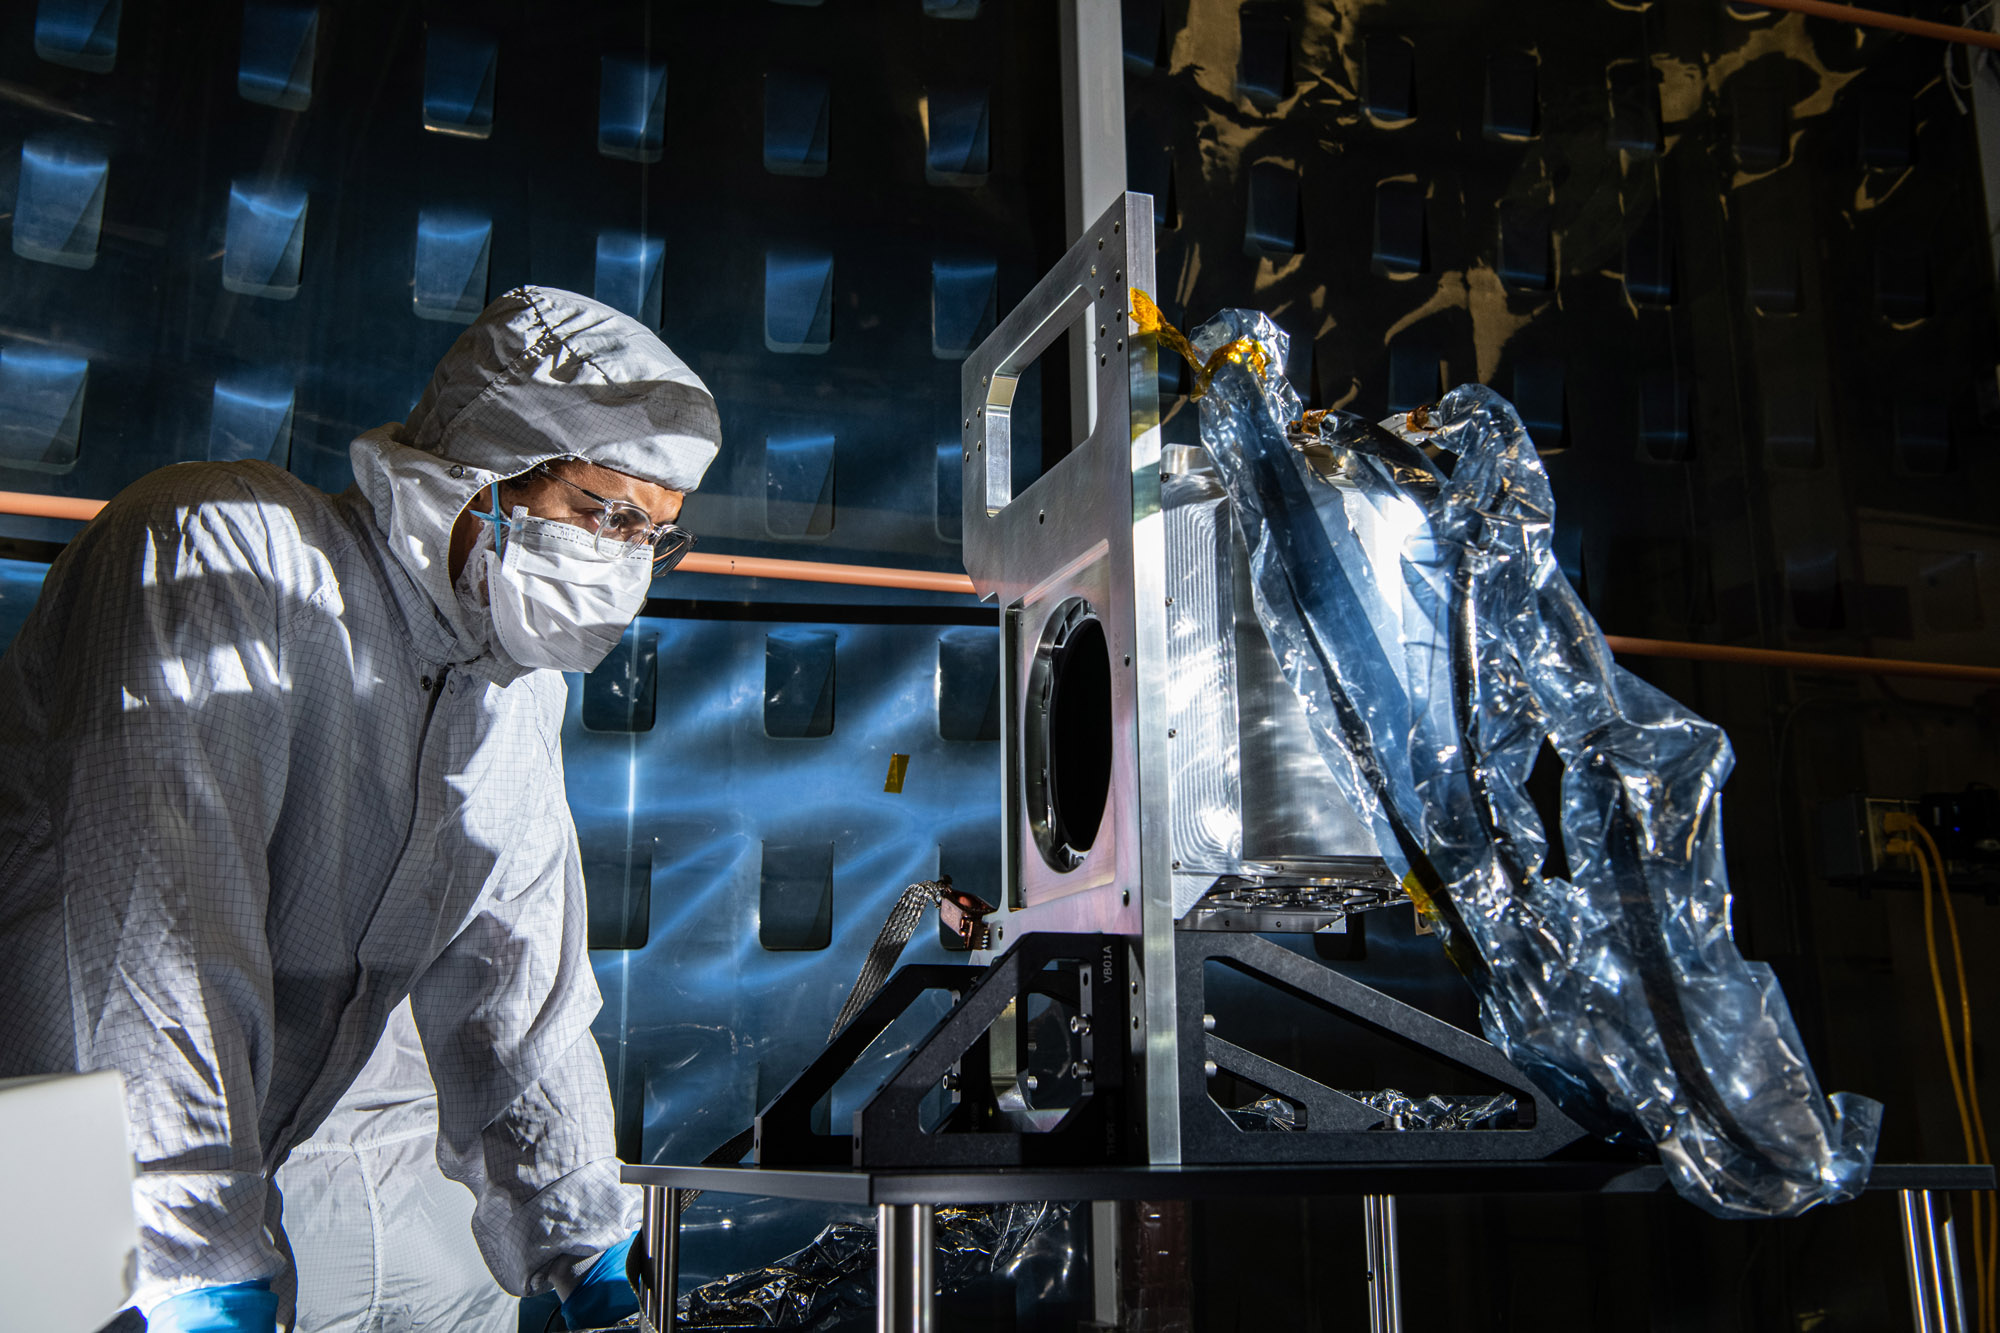
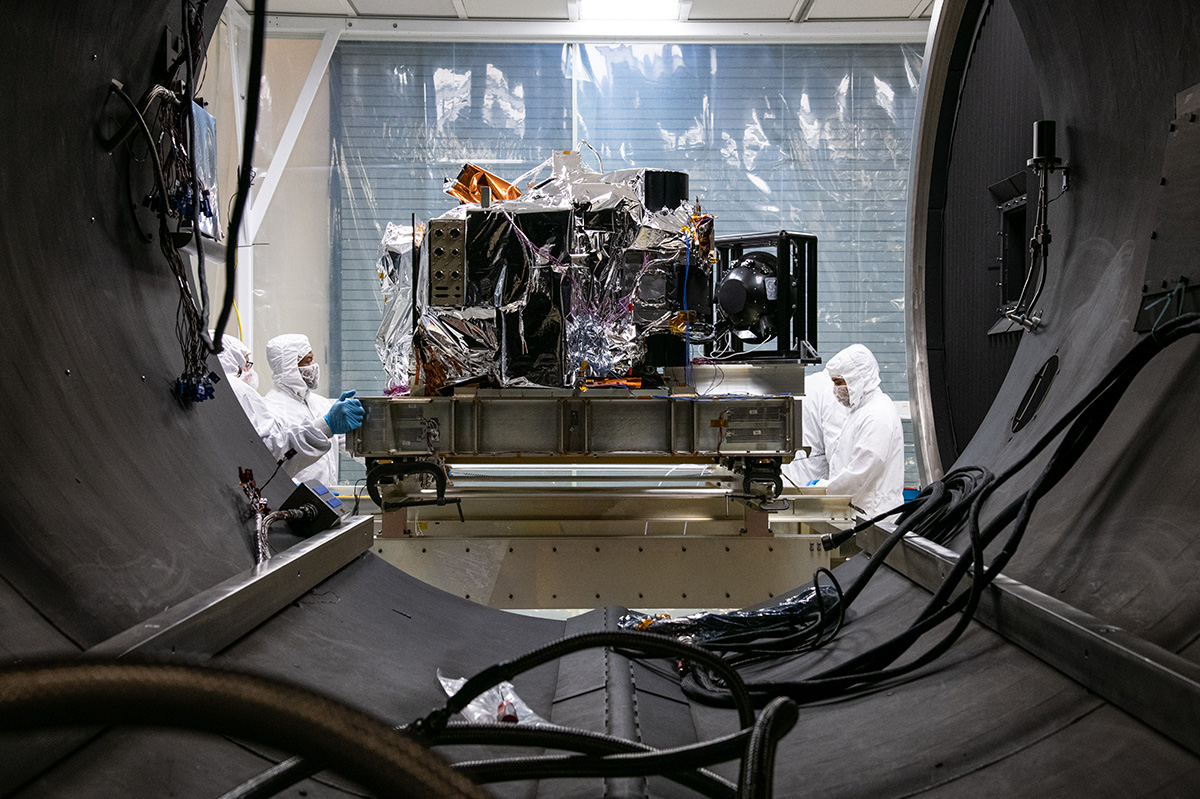
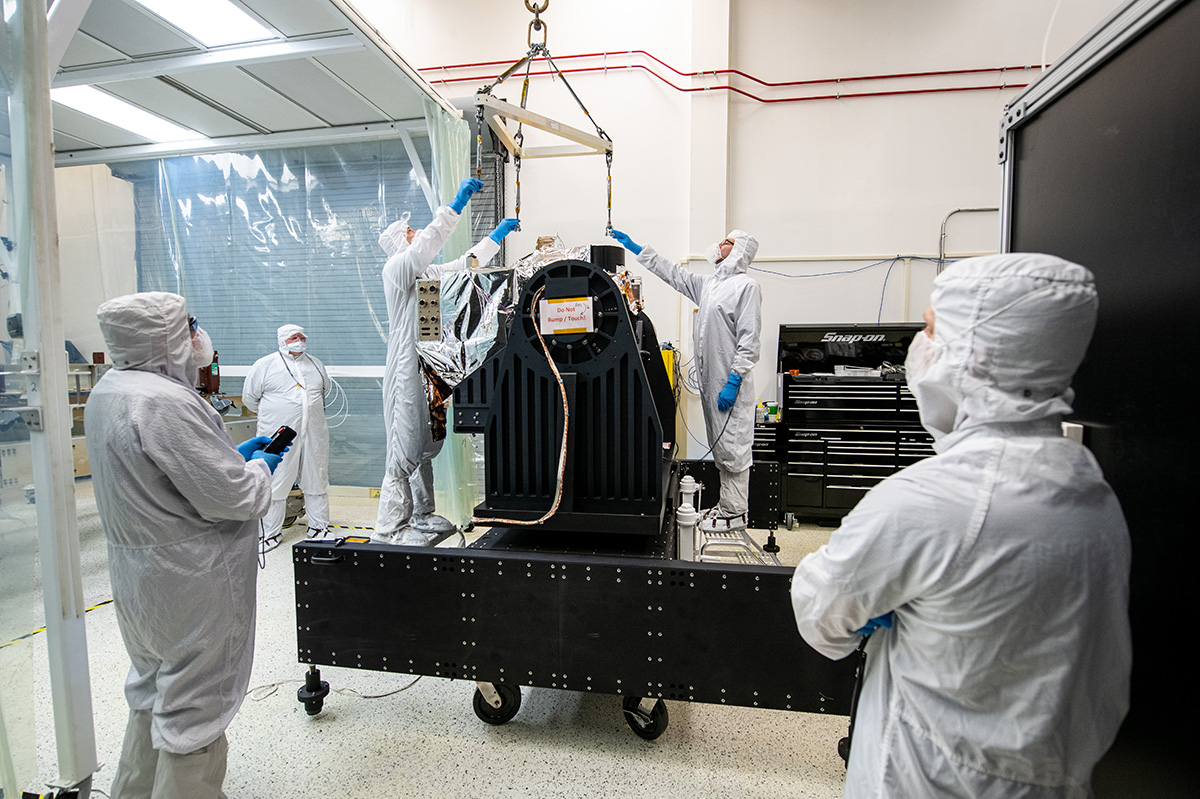
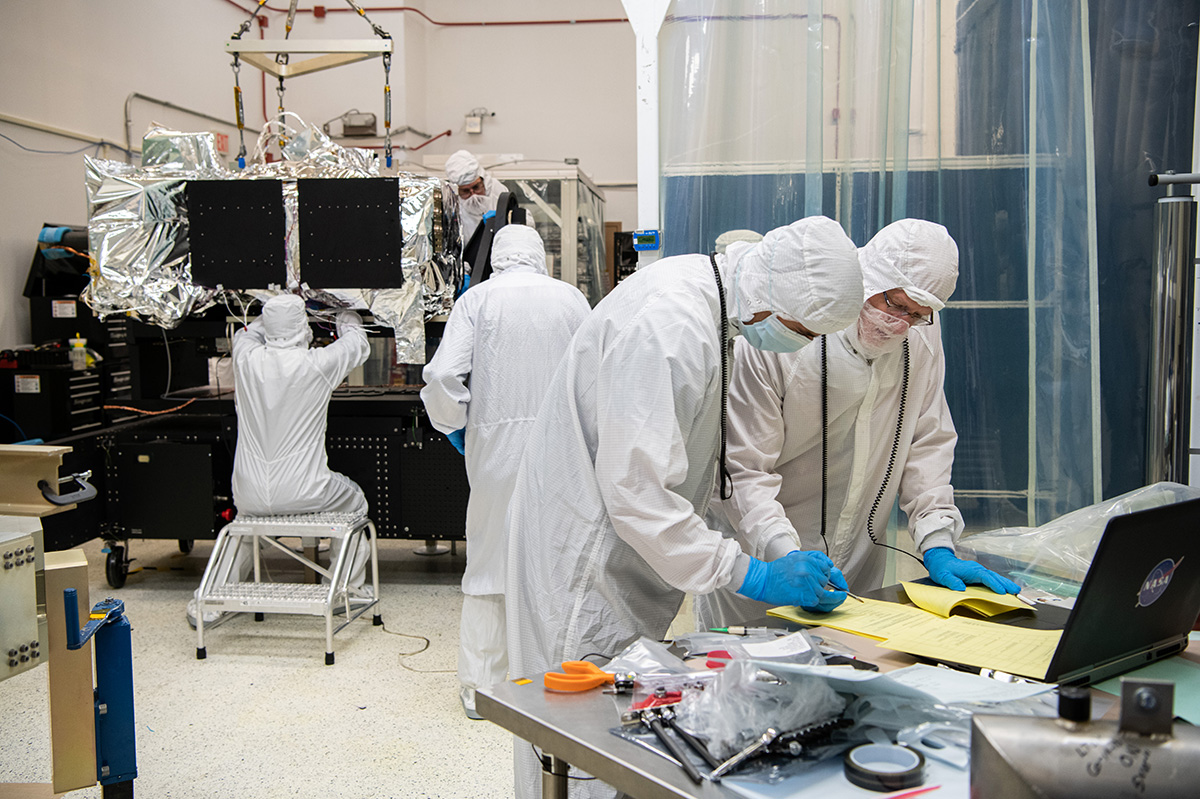
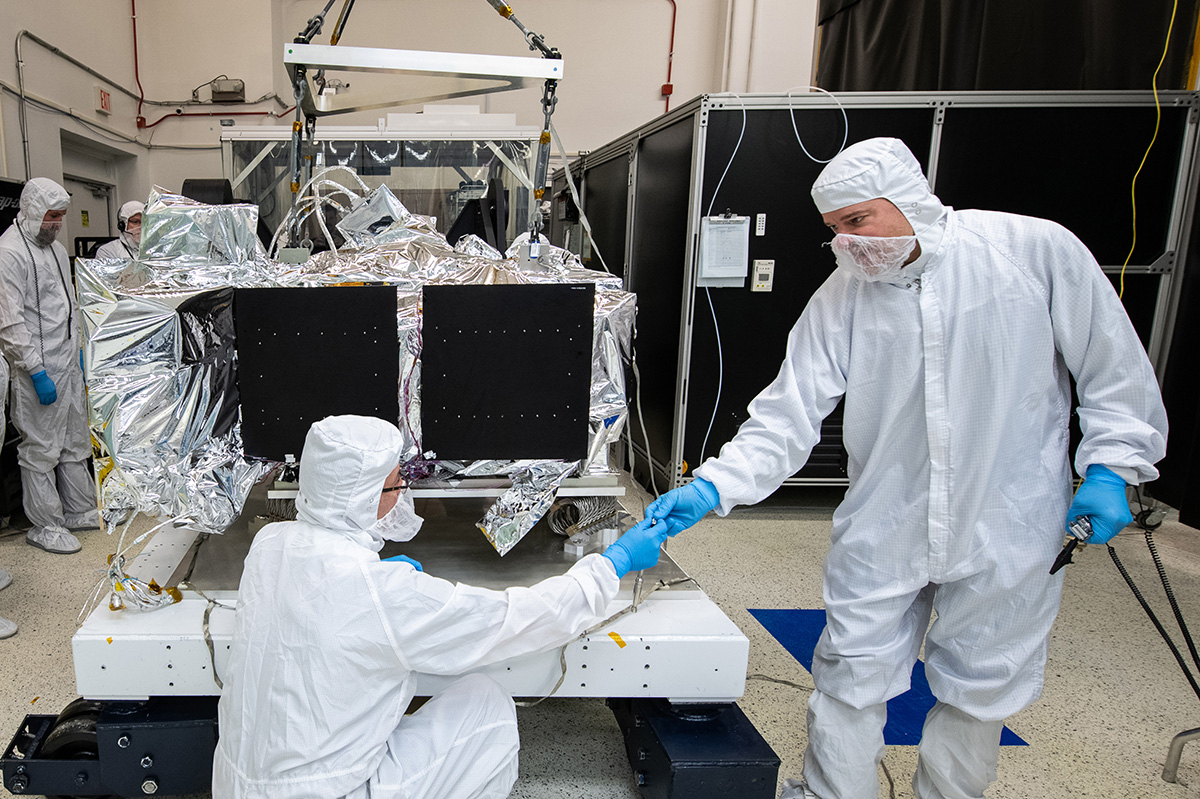
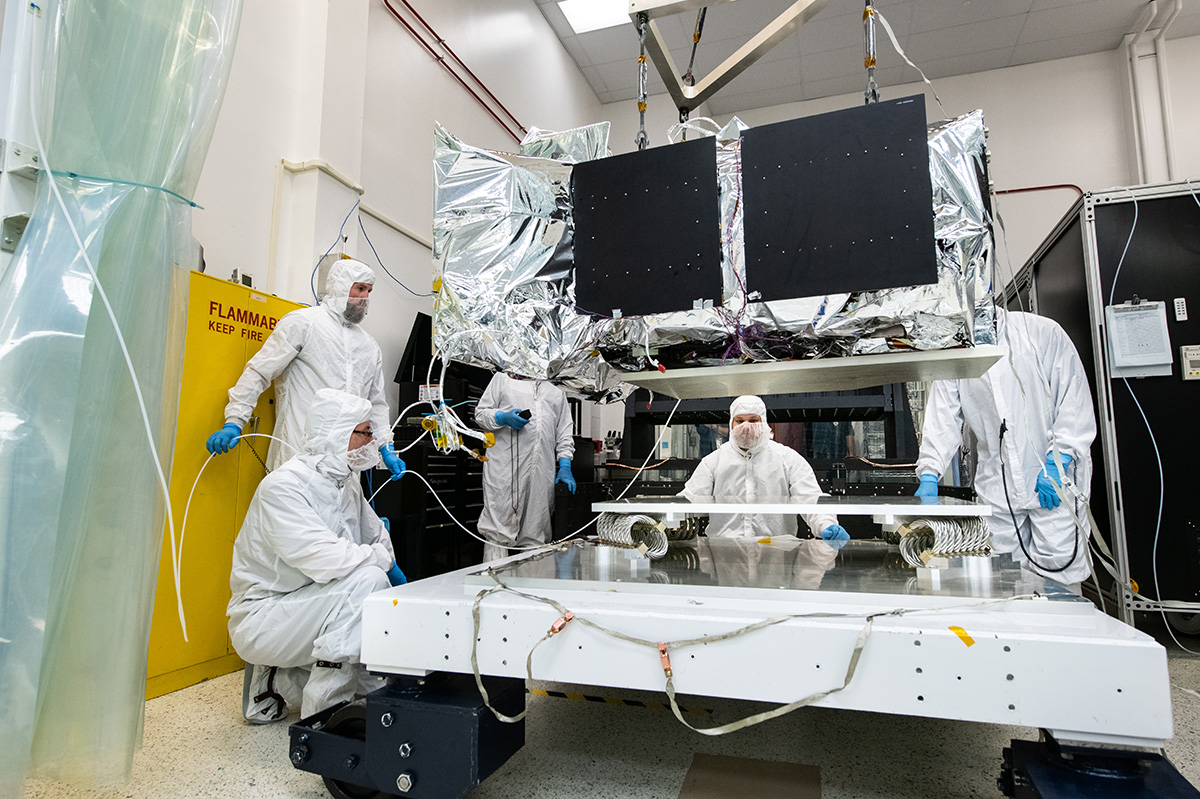
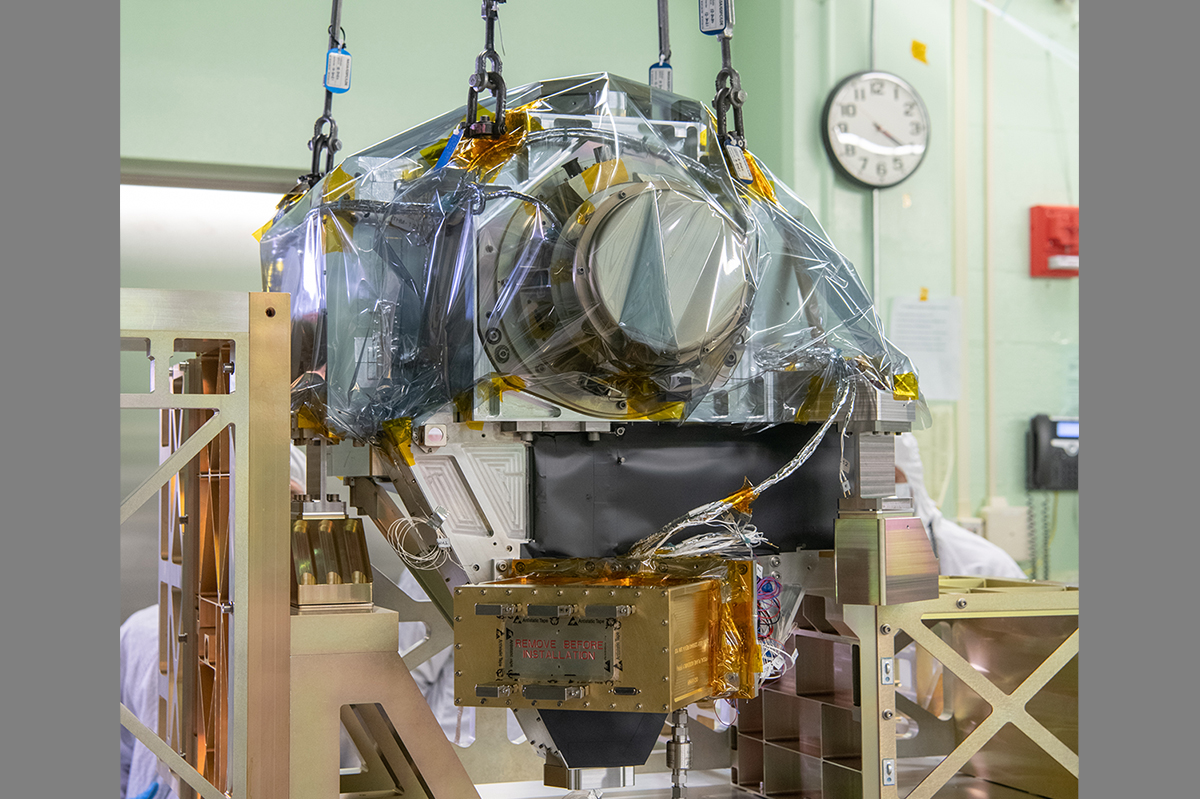
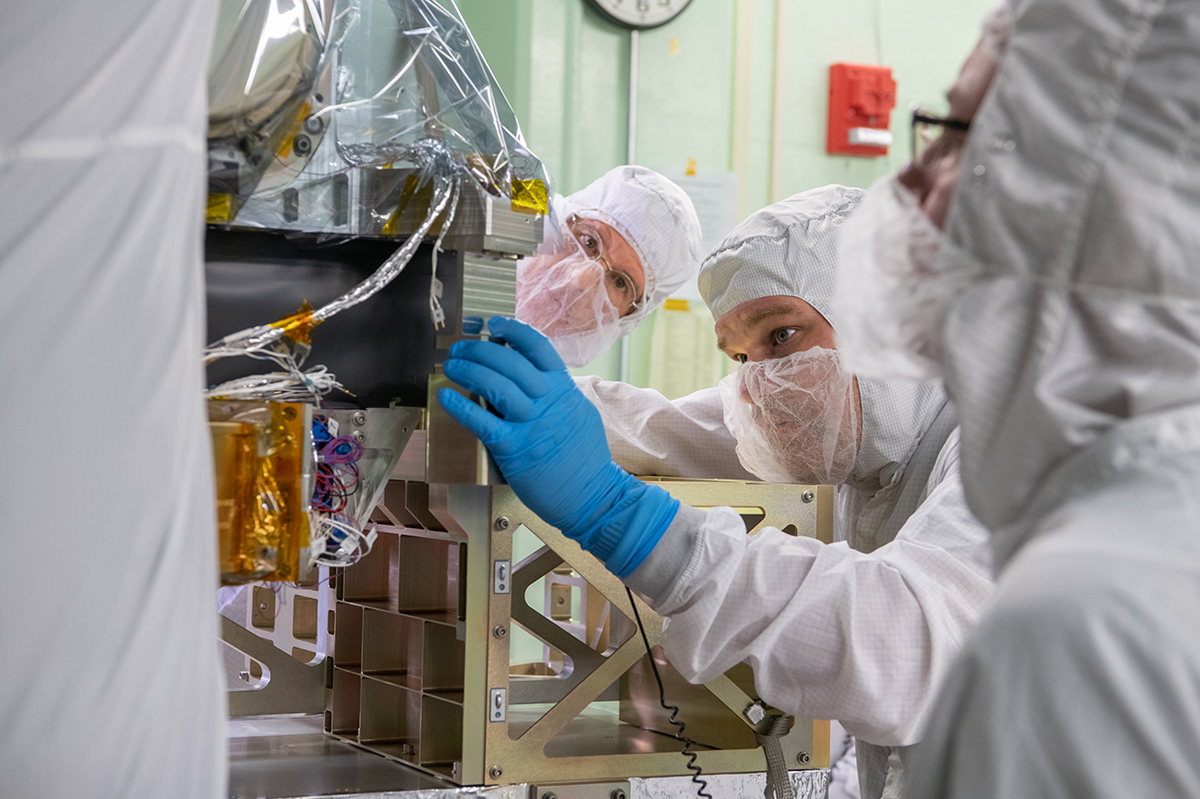
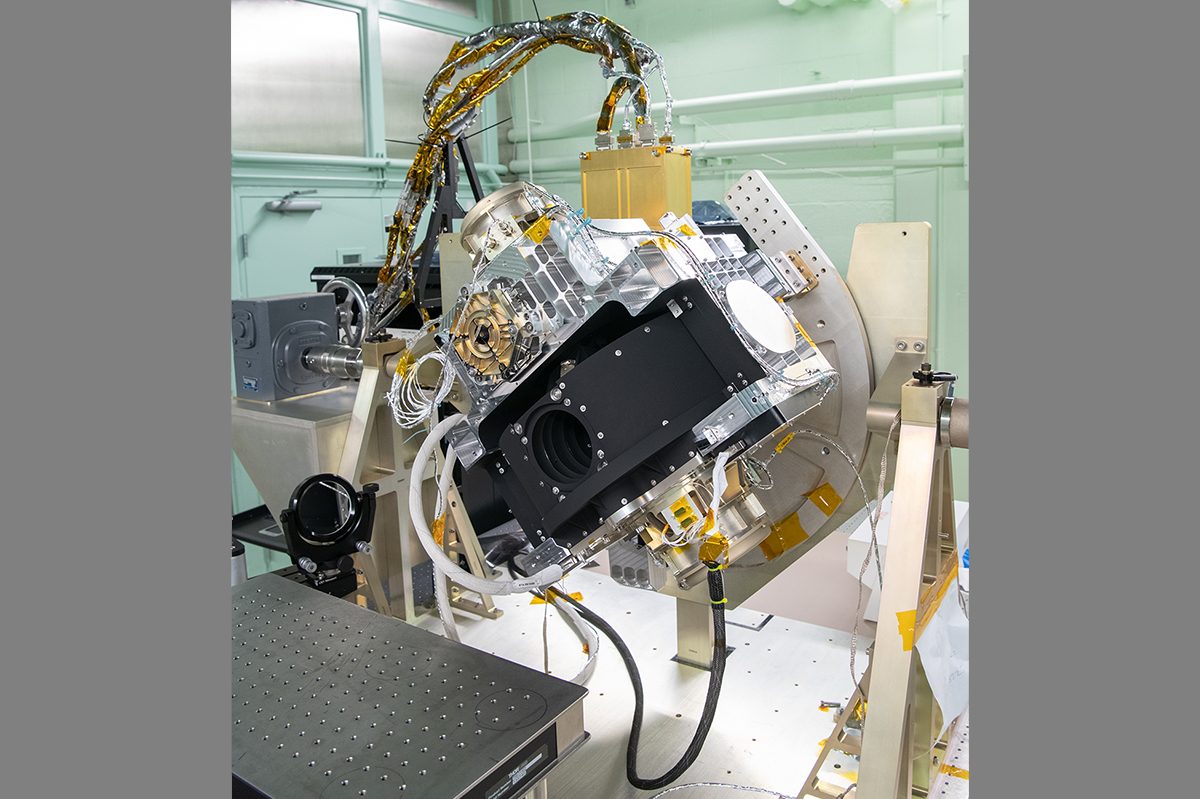
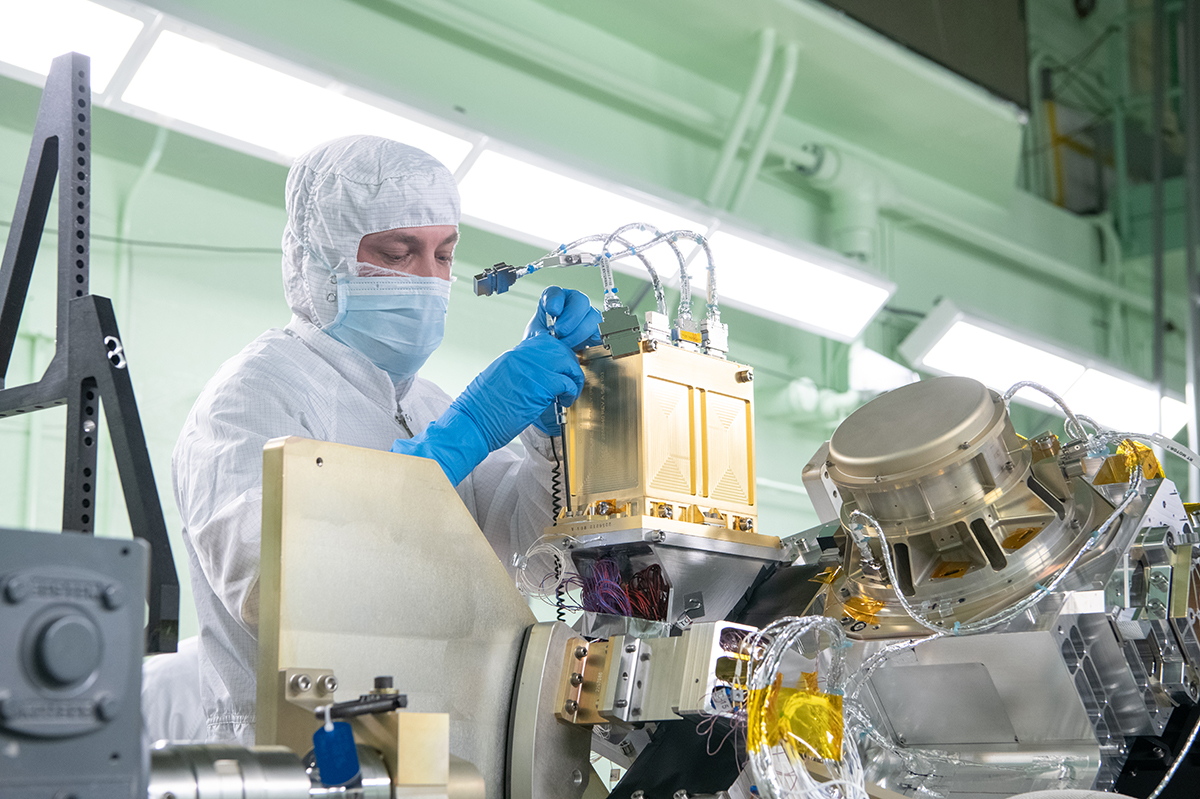
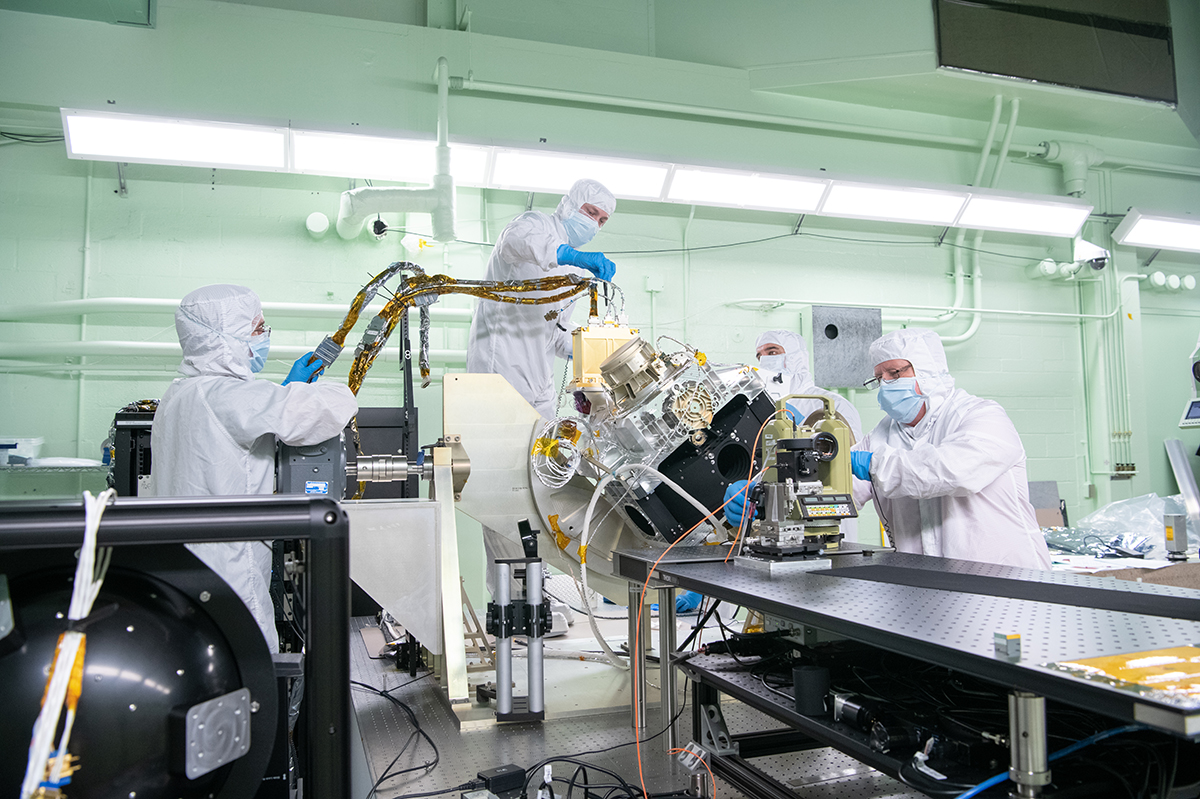
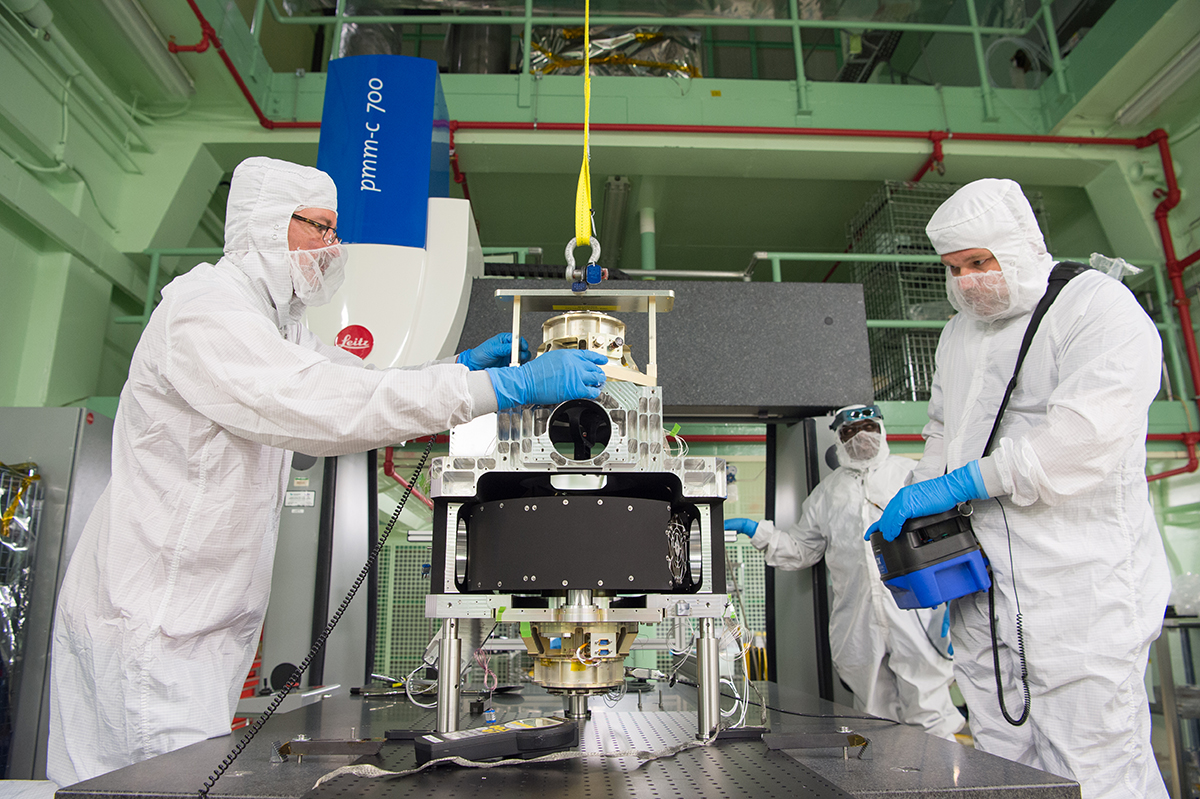
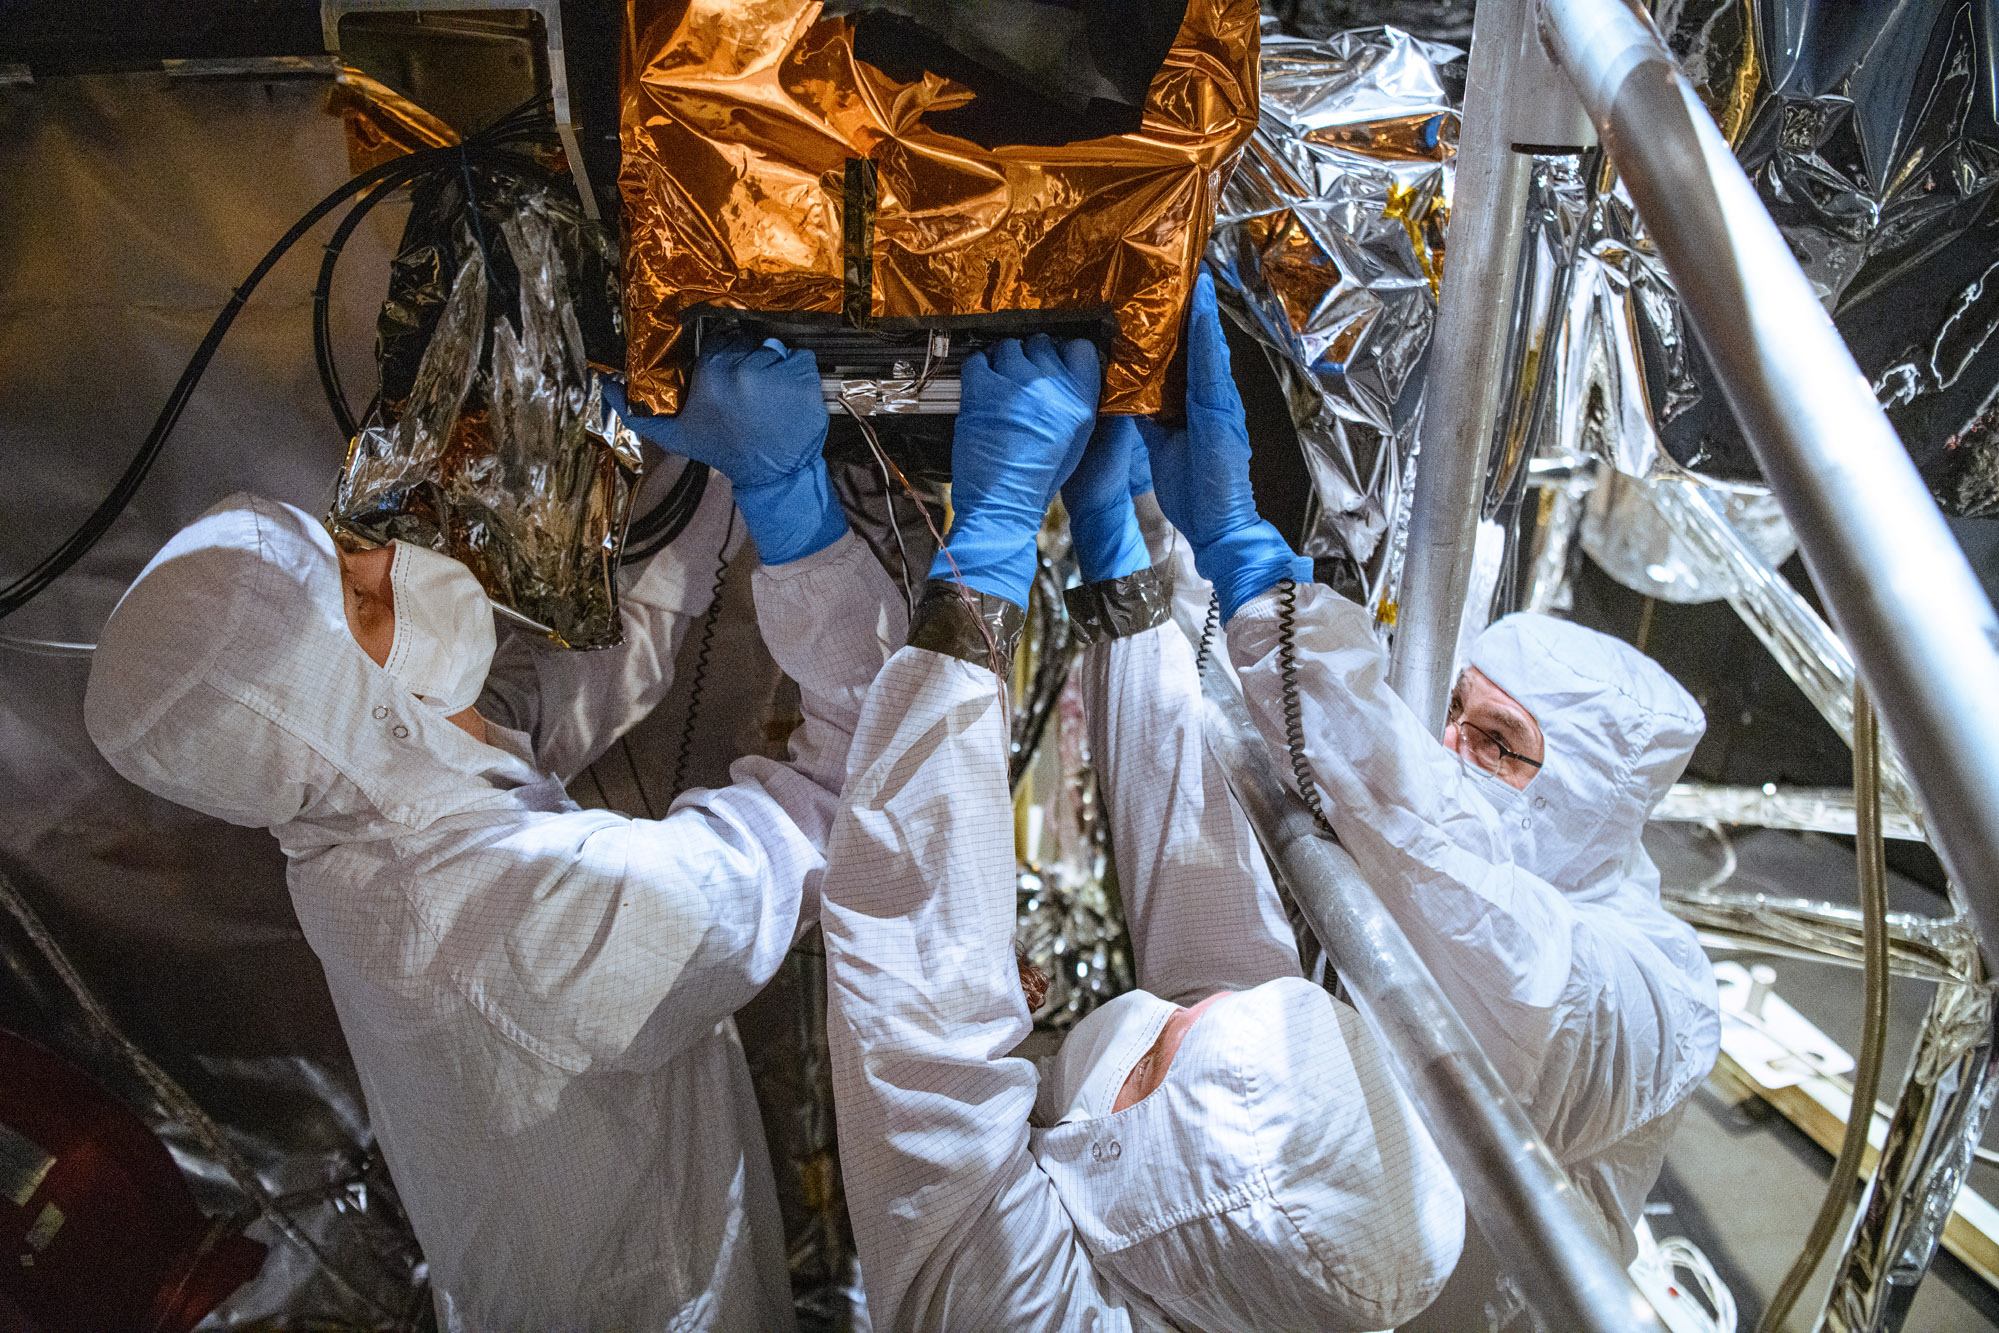
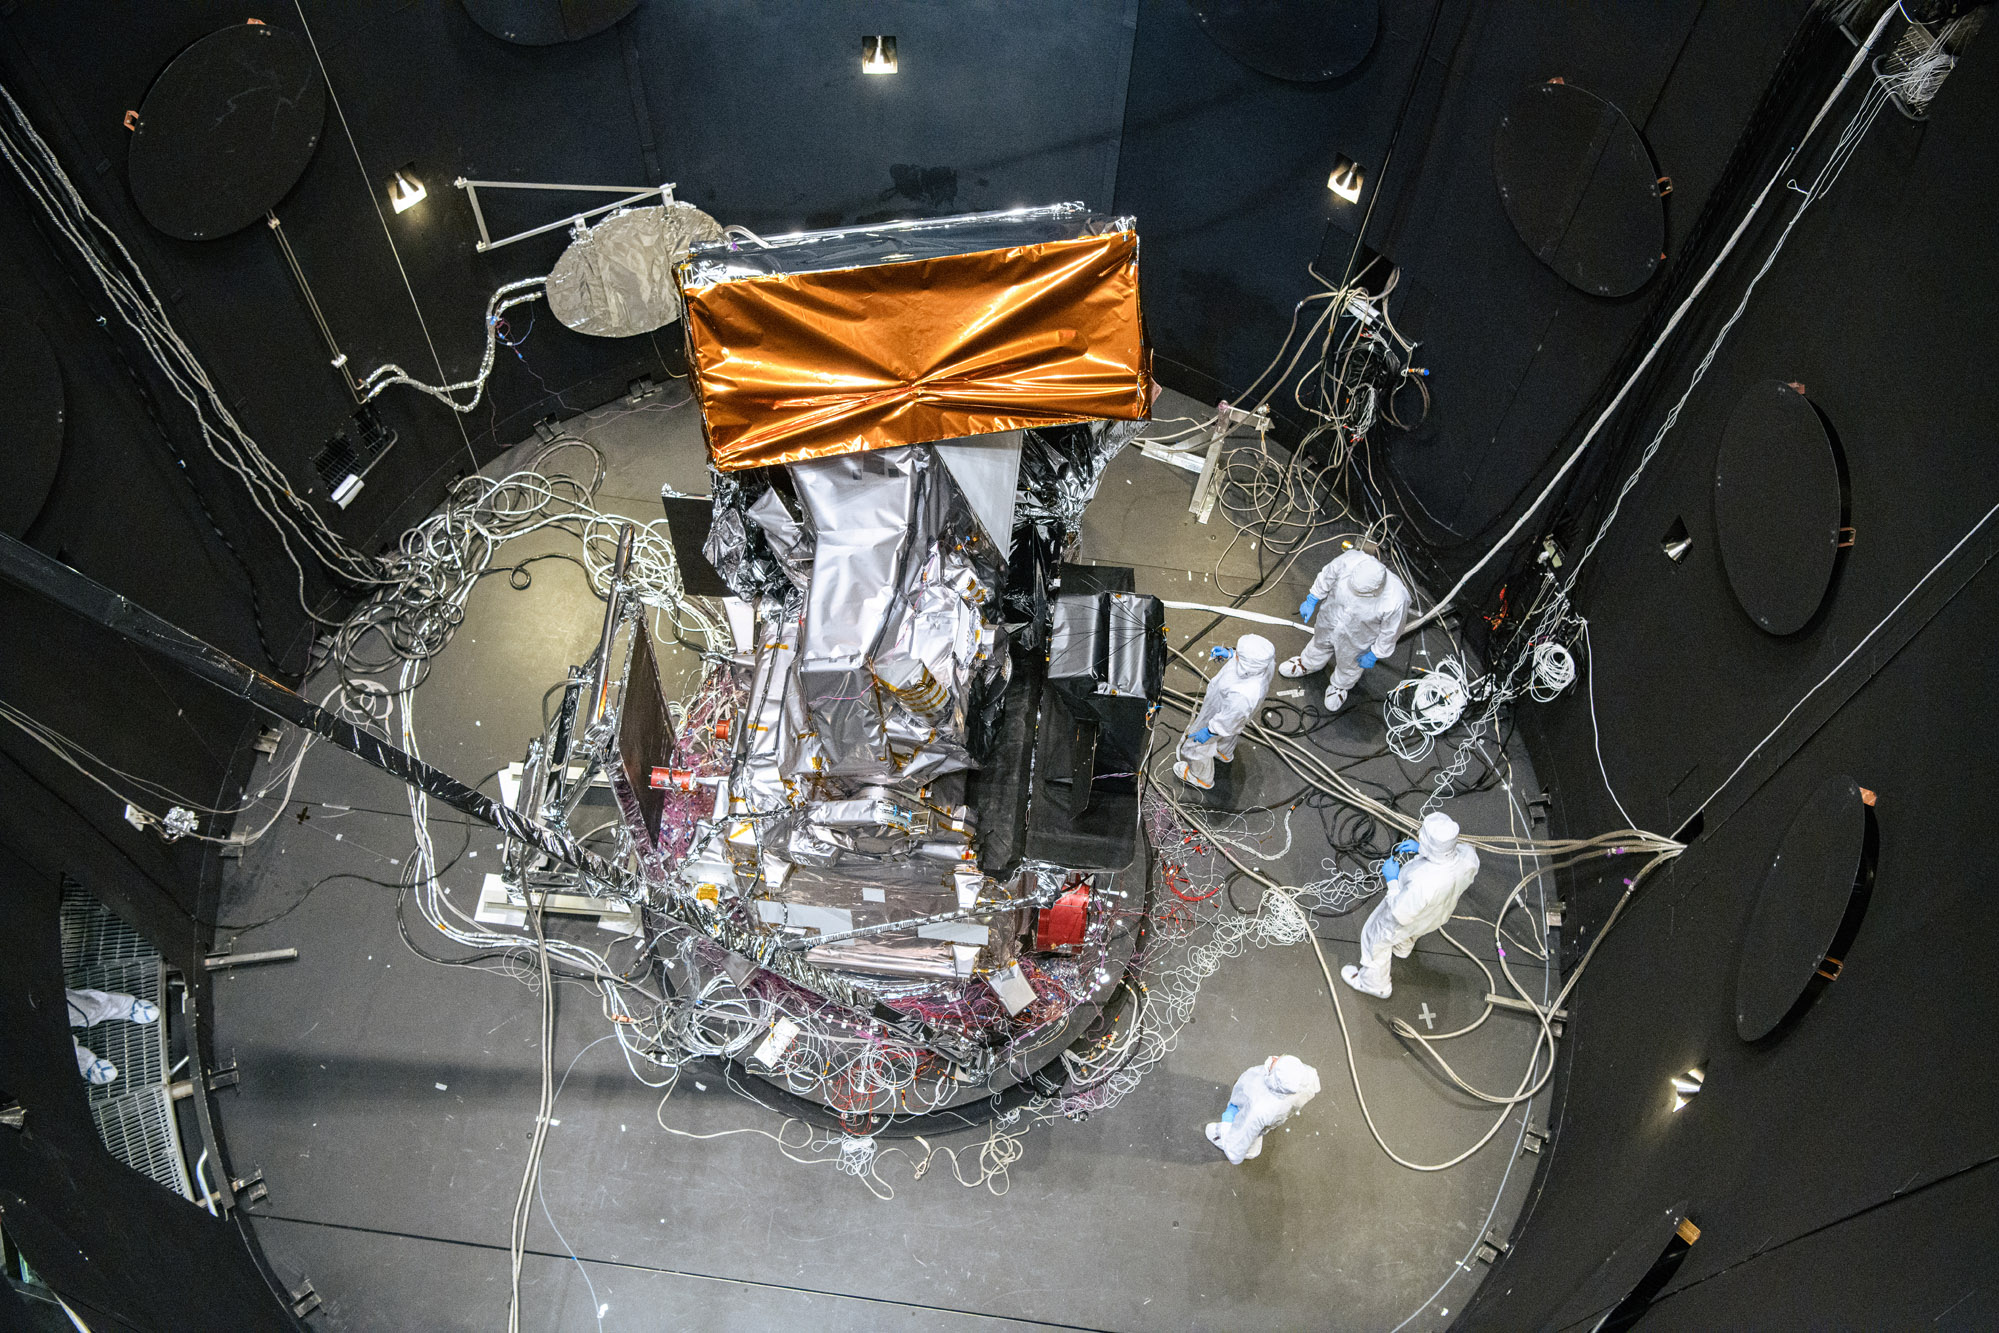
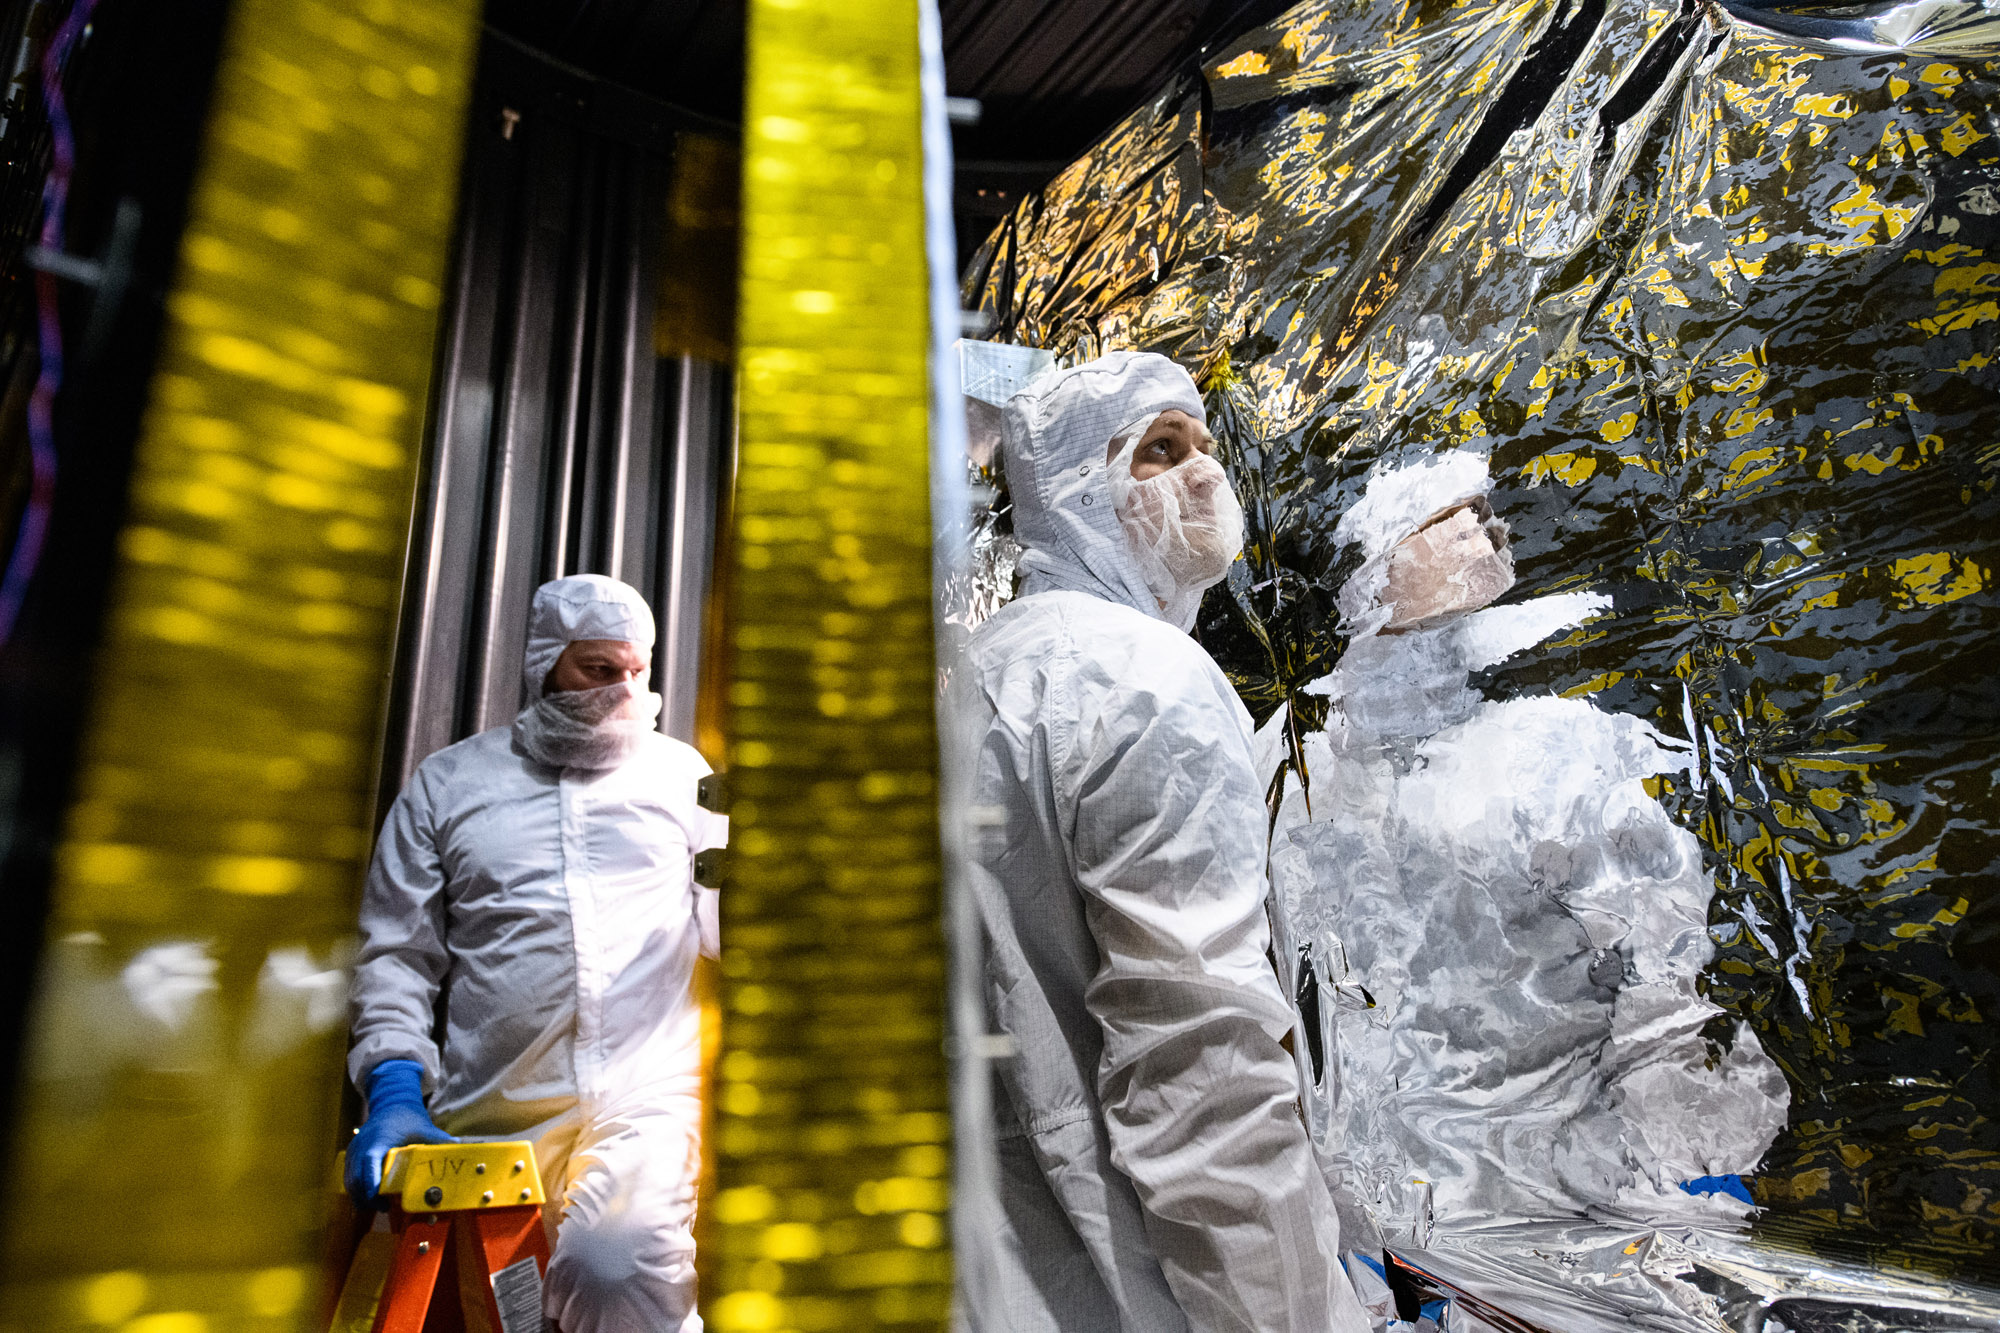
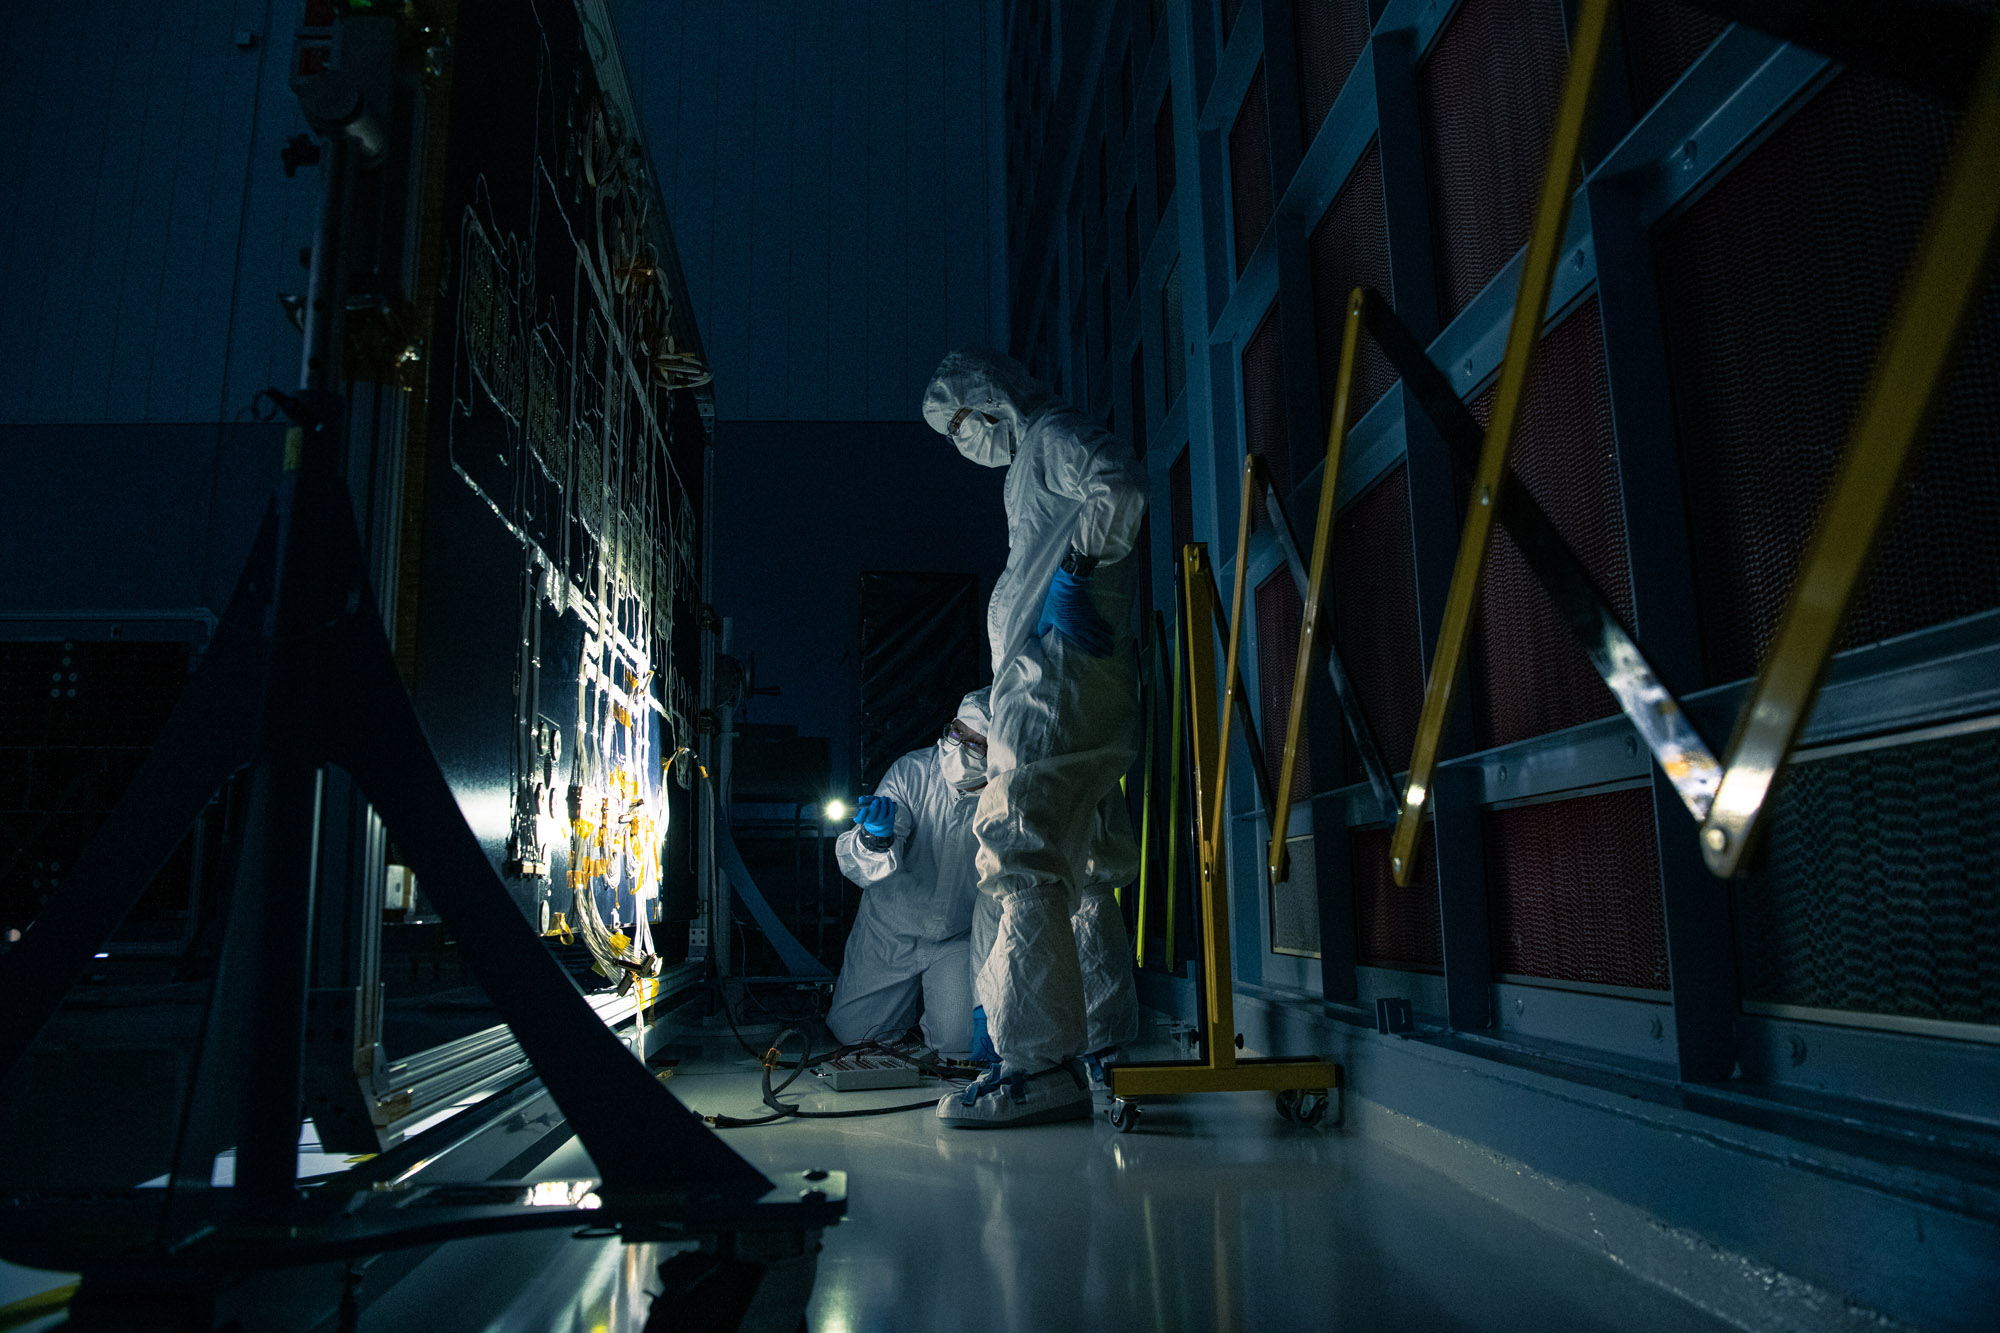
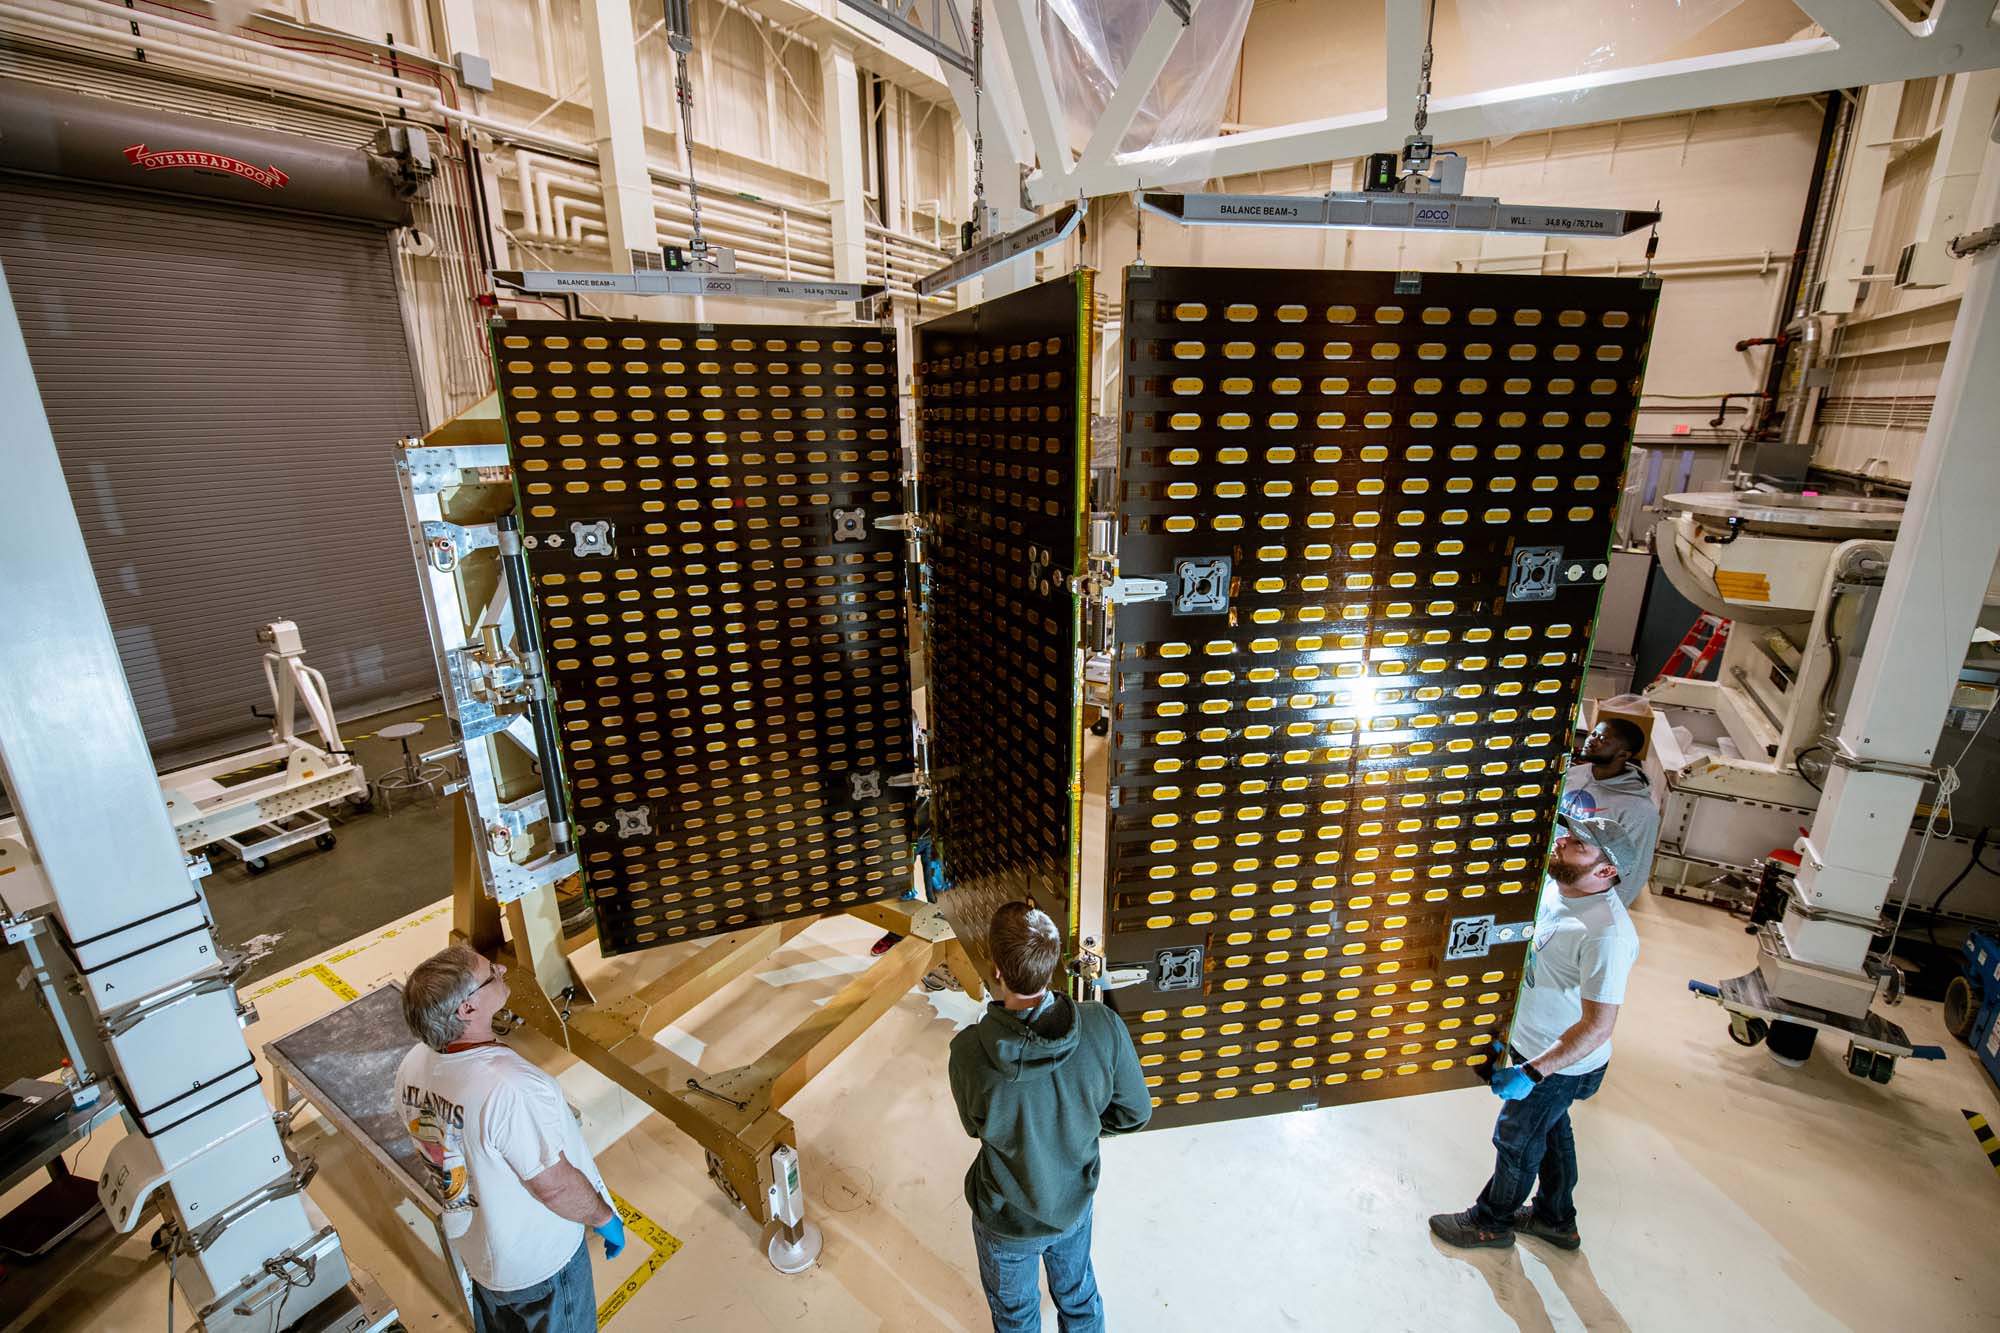
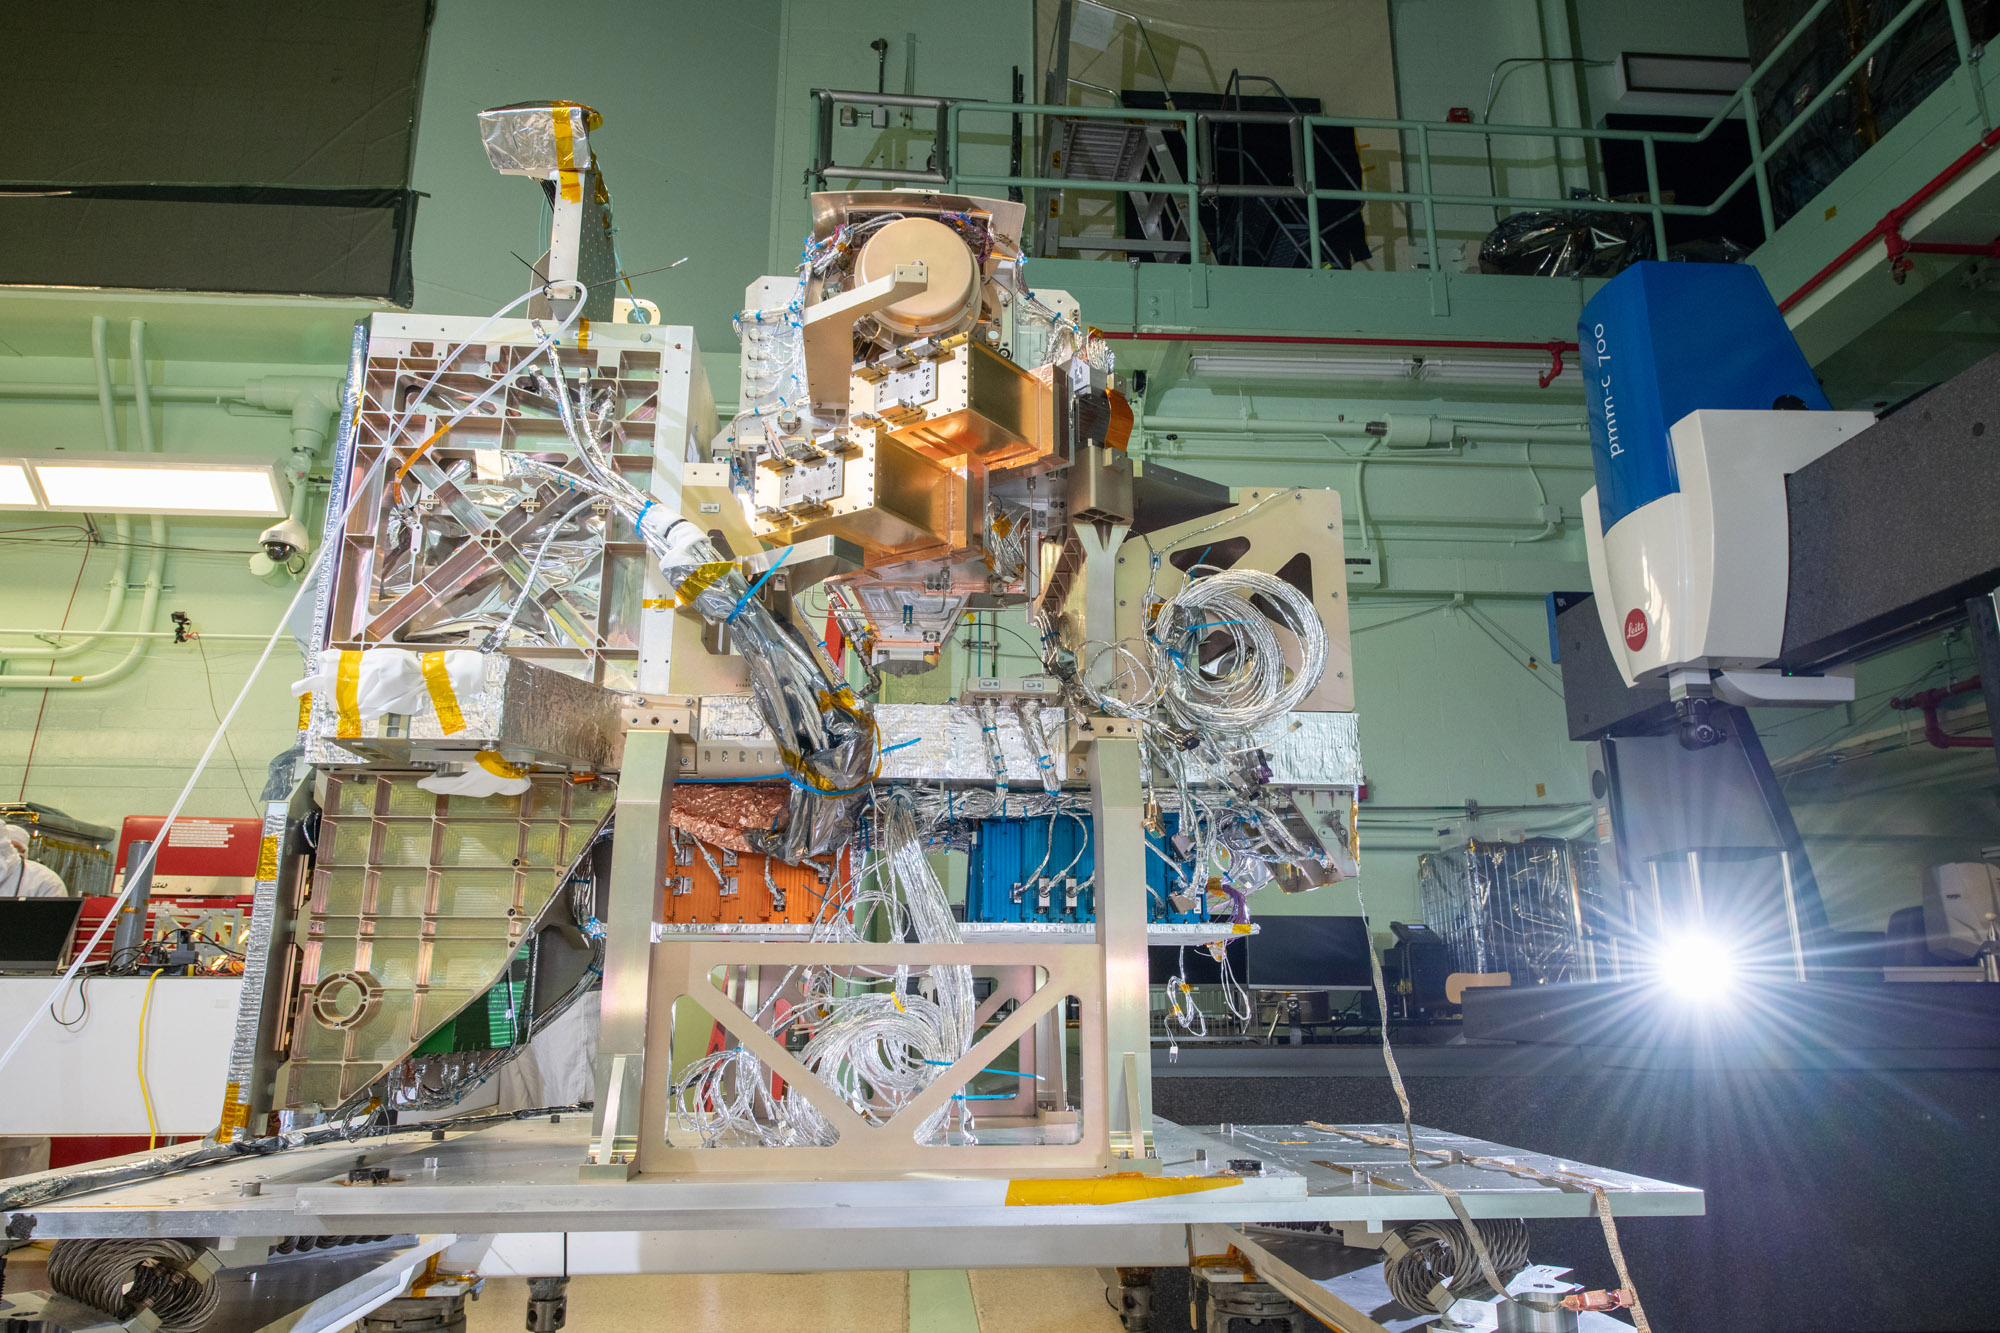
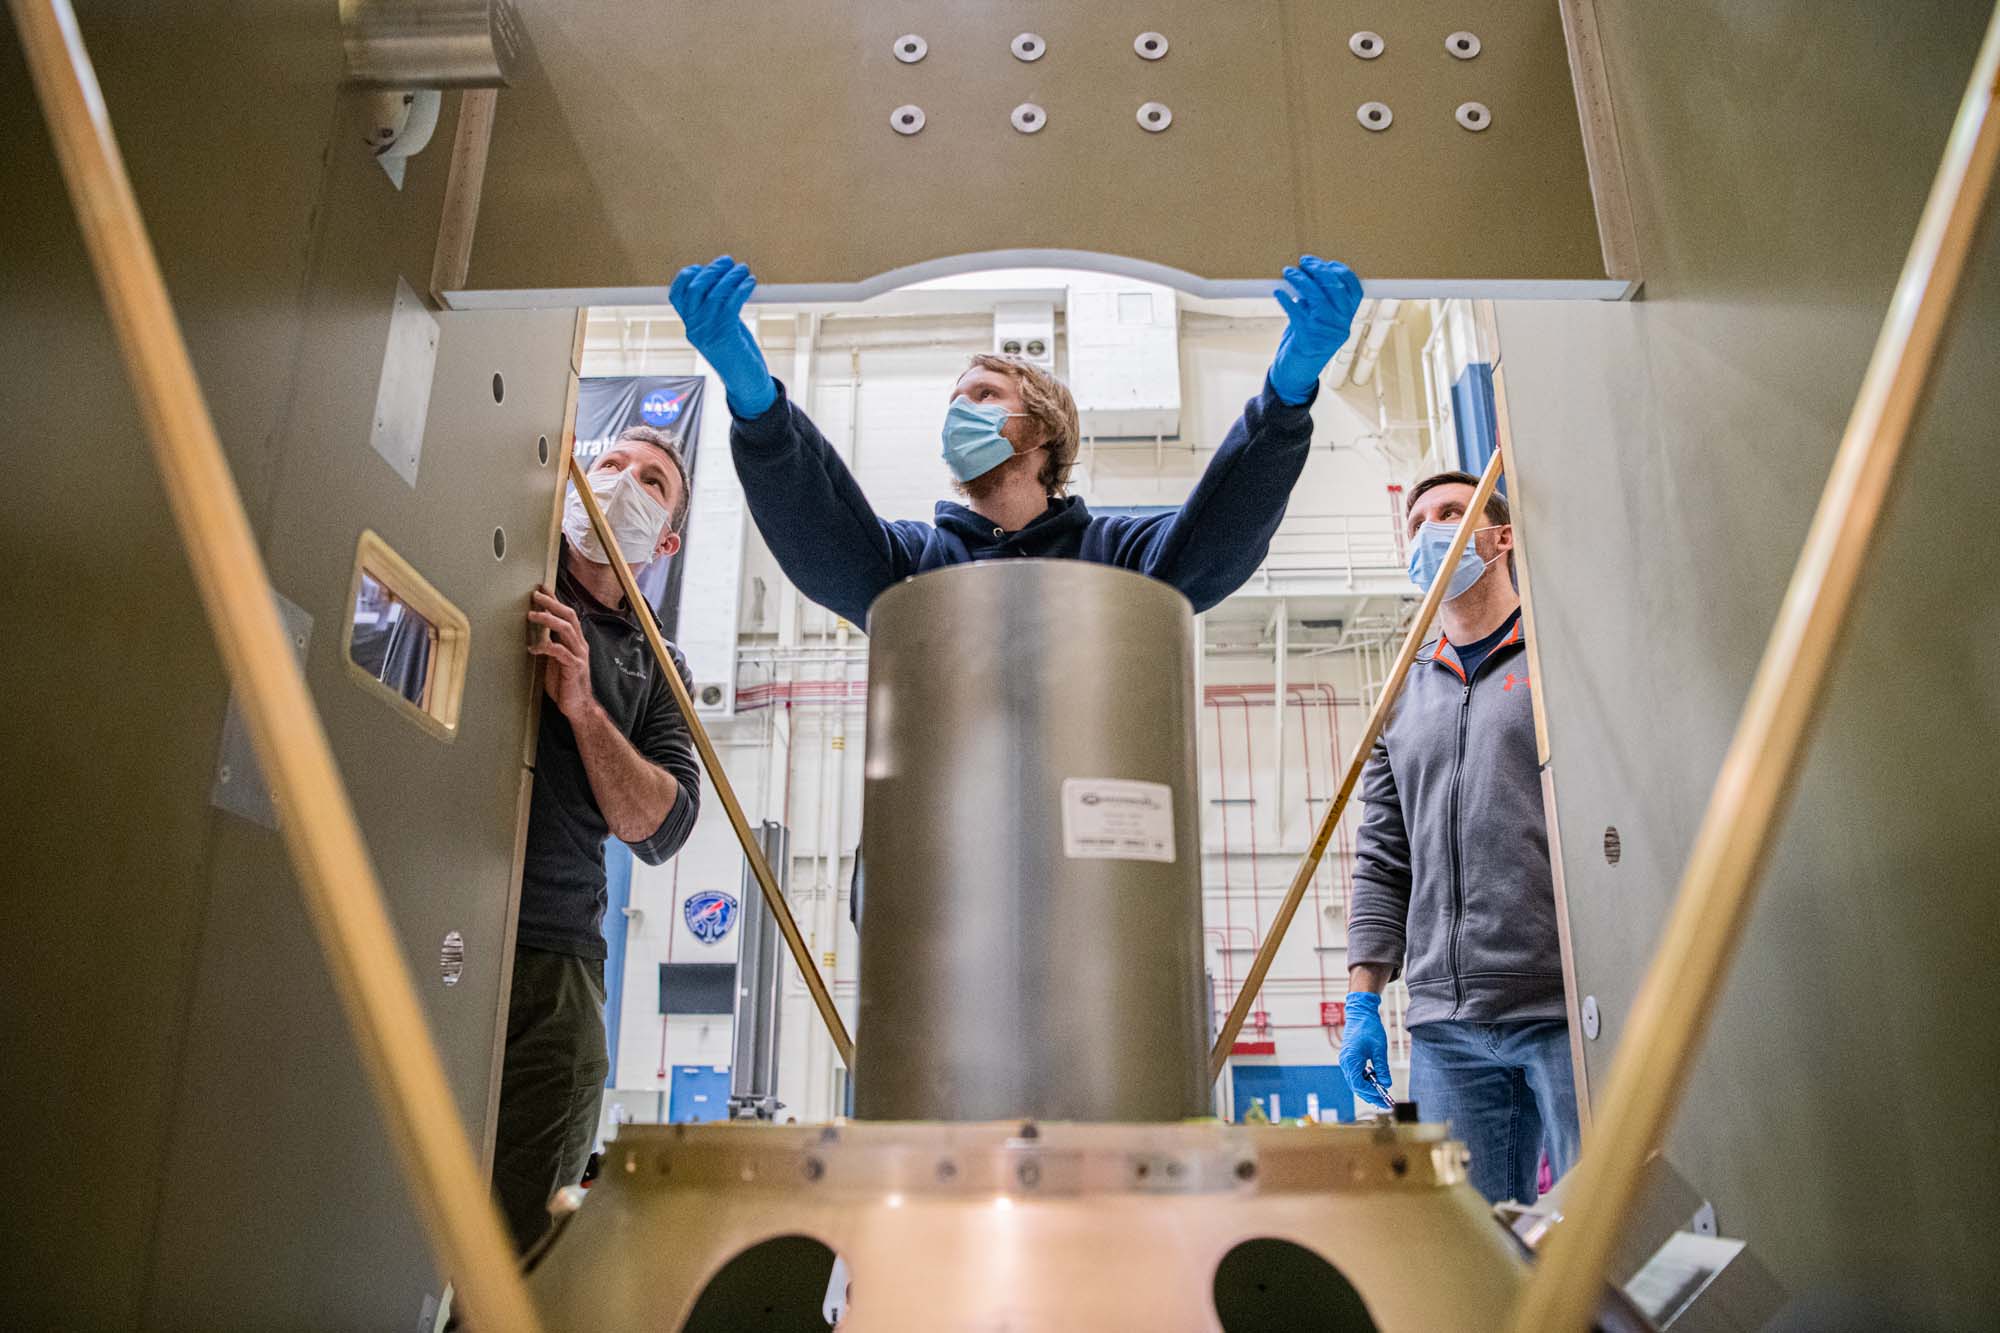
The Ocean Color Instrument team evaluates the instrument configuration in the Thermal Vacuum Chamber (TVAC) prior to closing the chamber door for testing. Credit: Mellos, Katherine
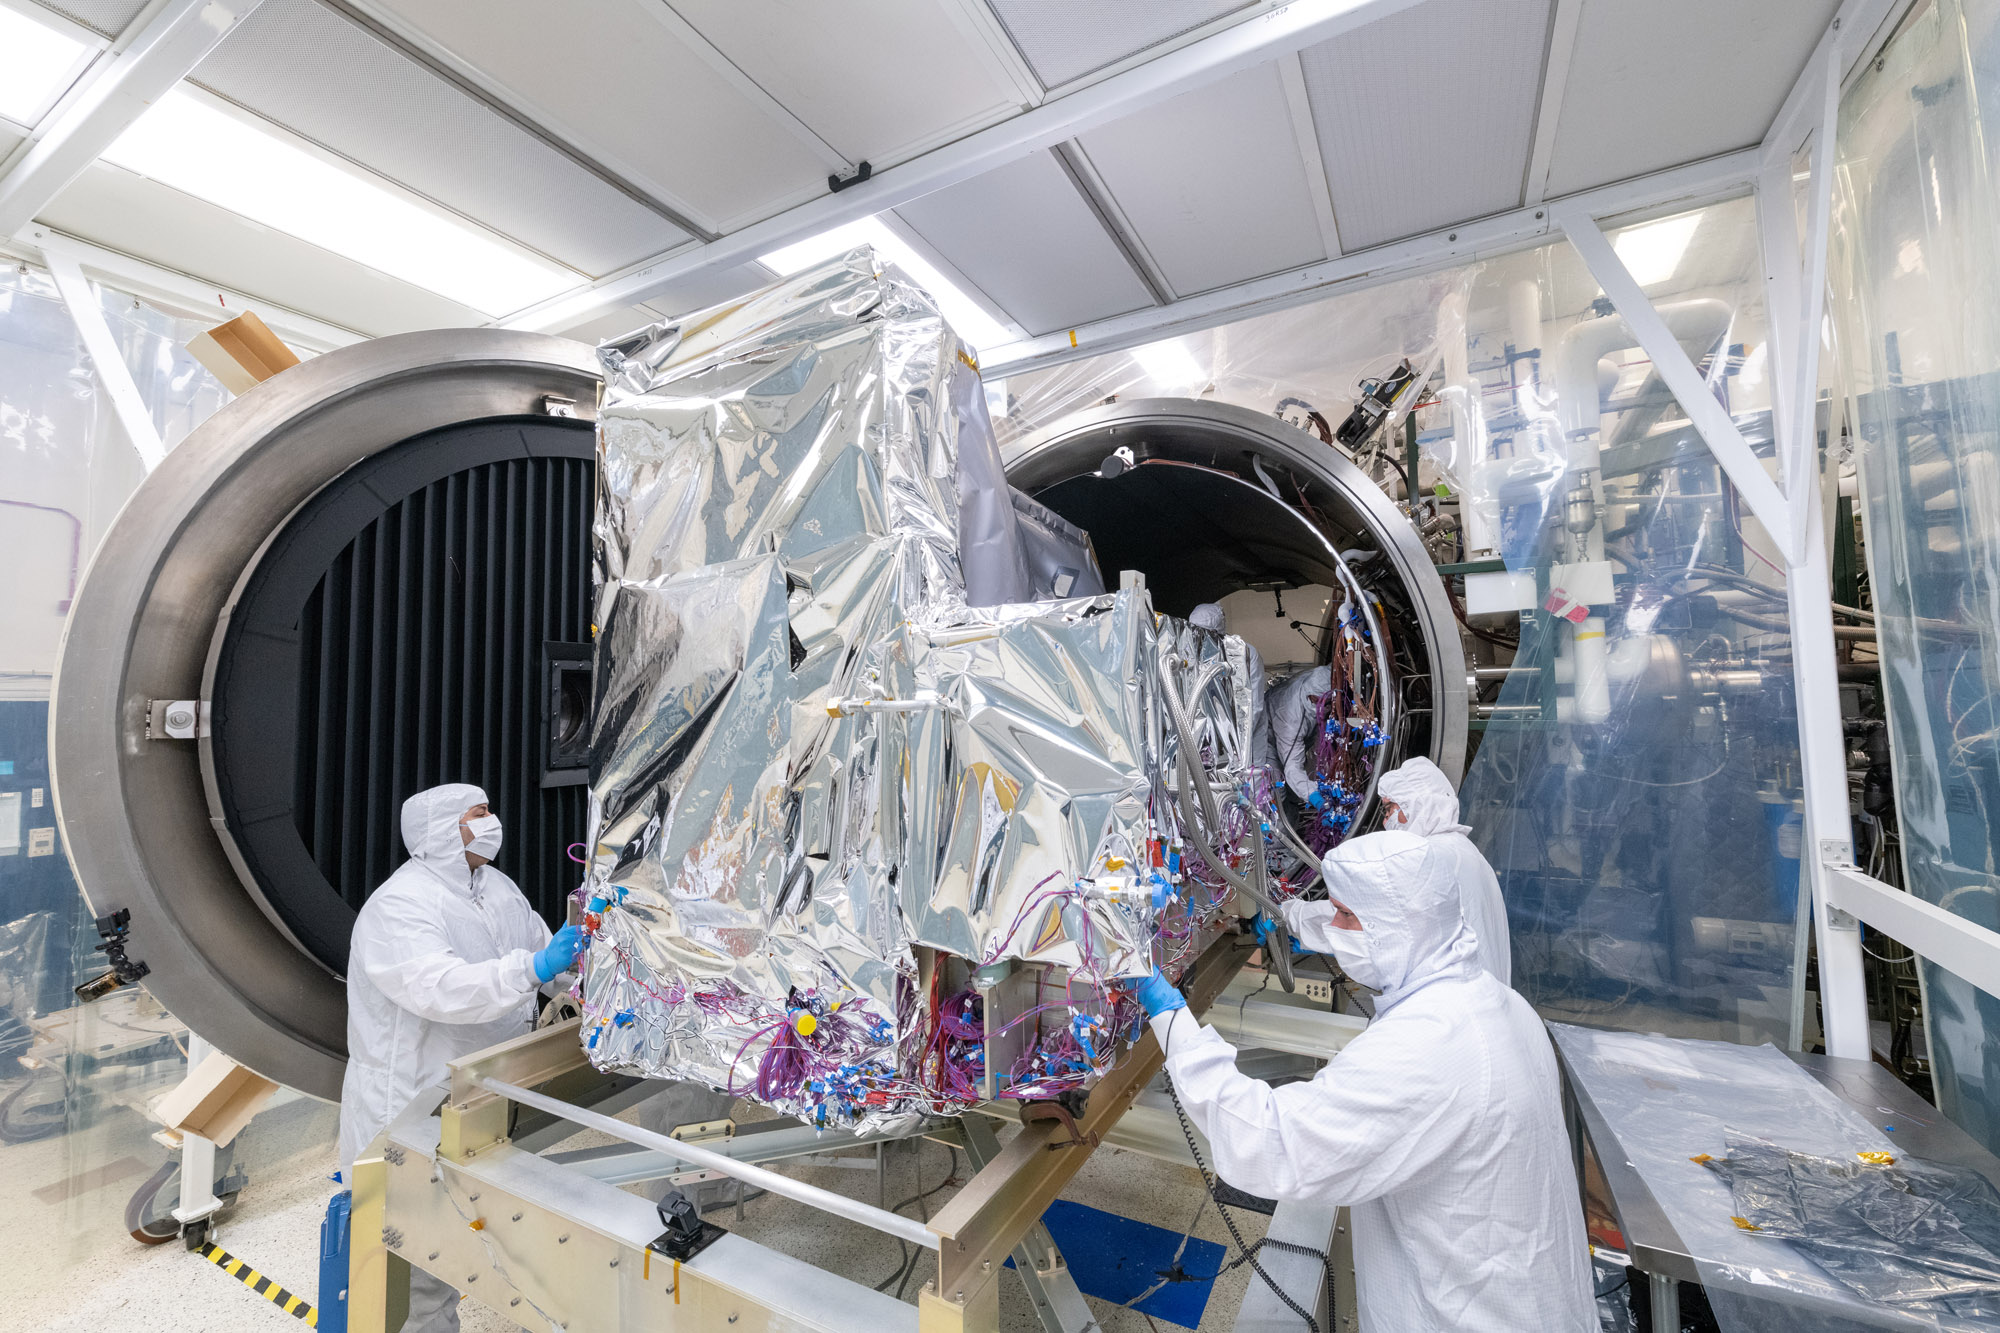
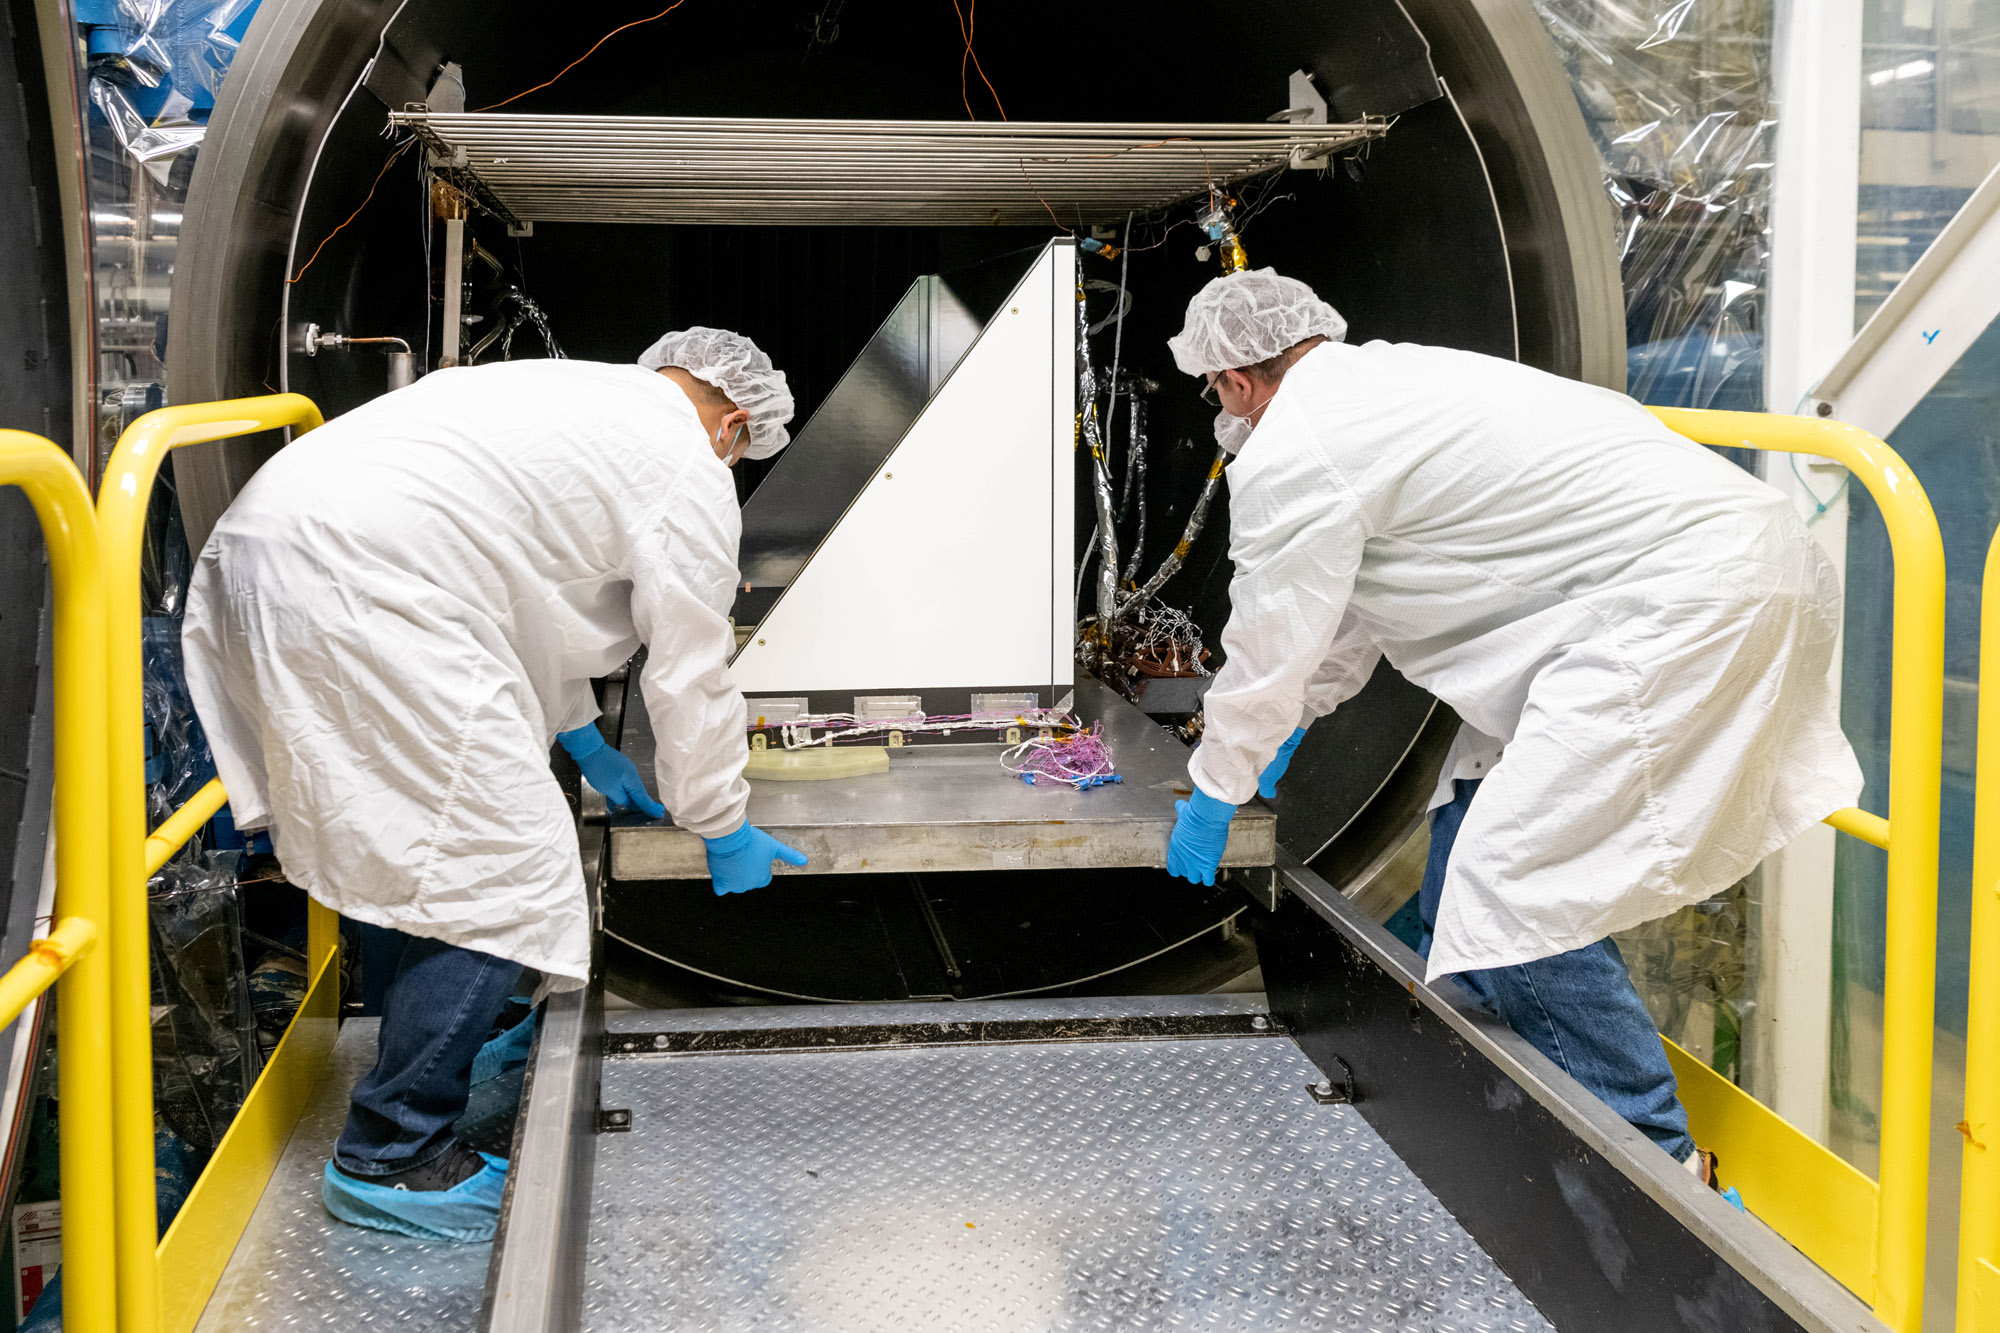
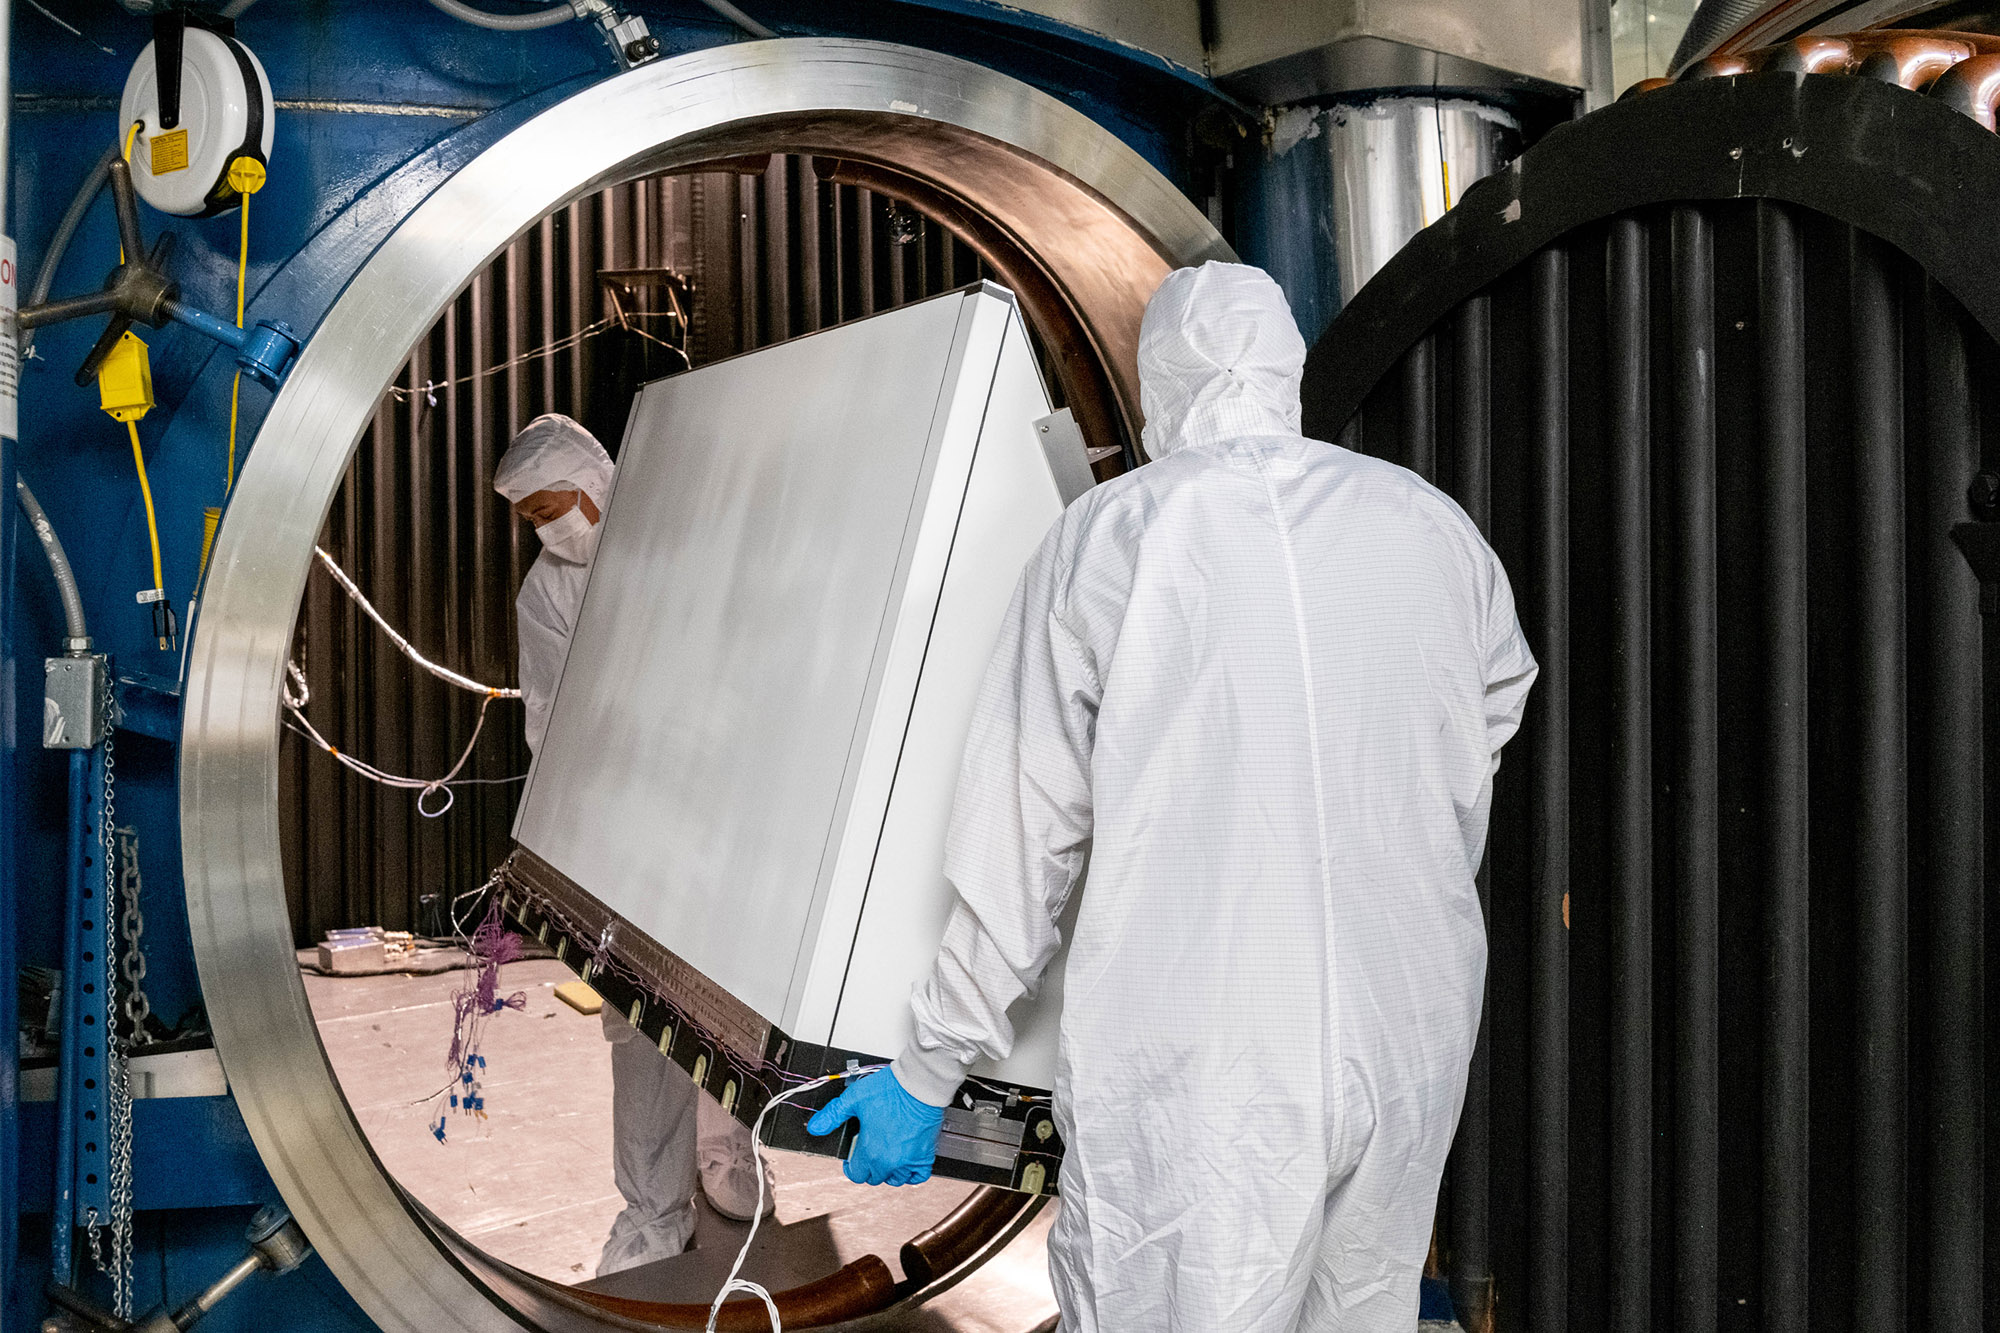
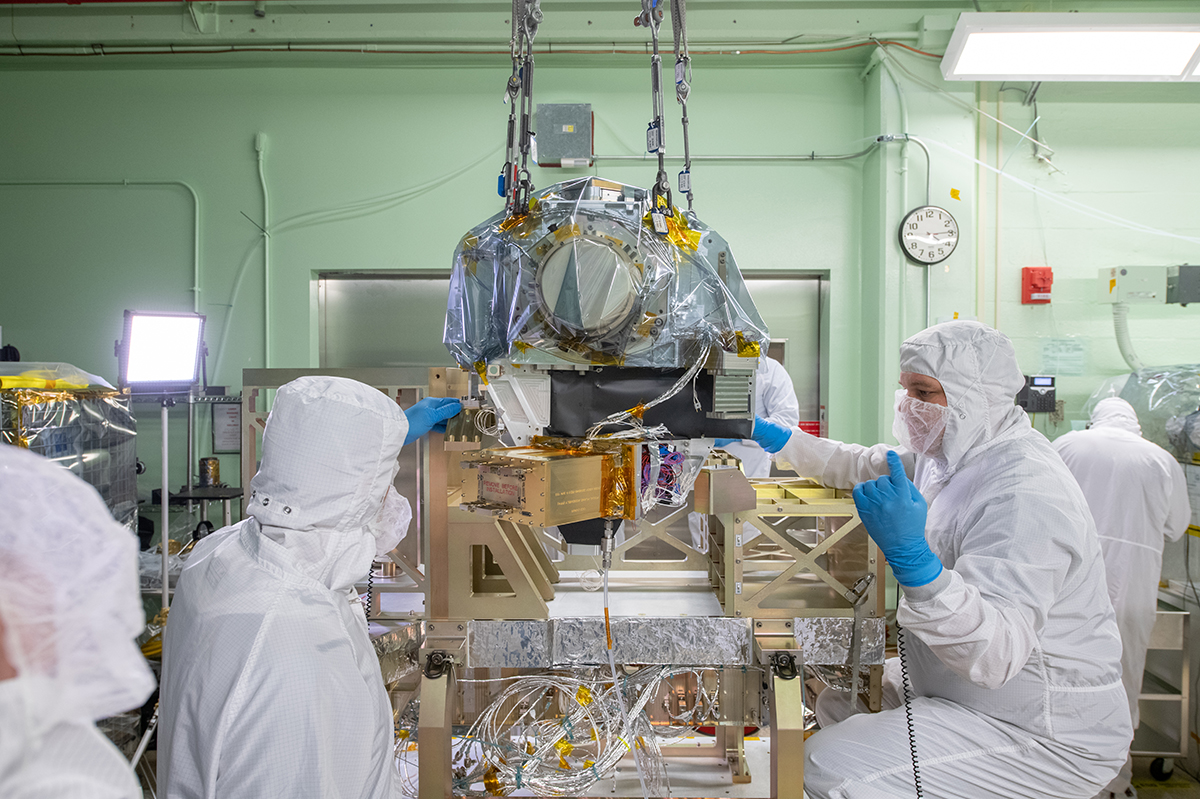
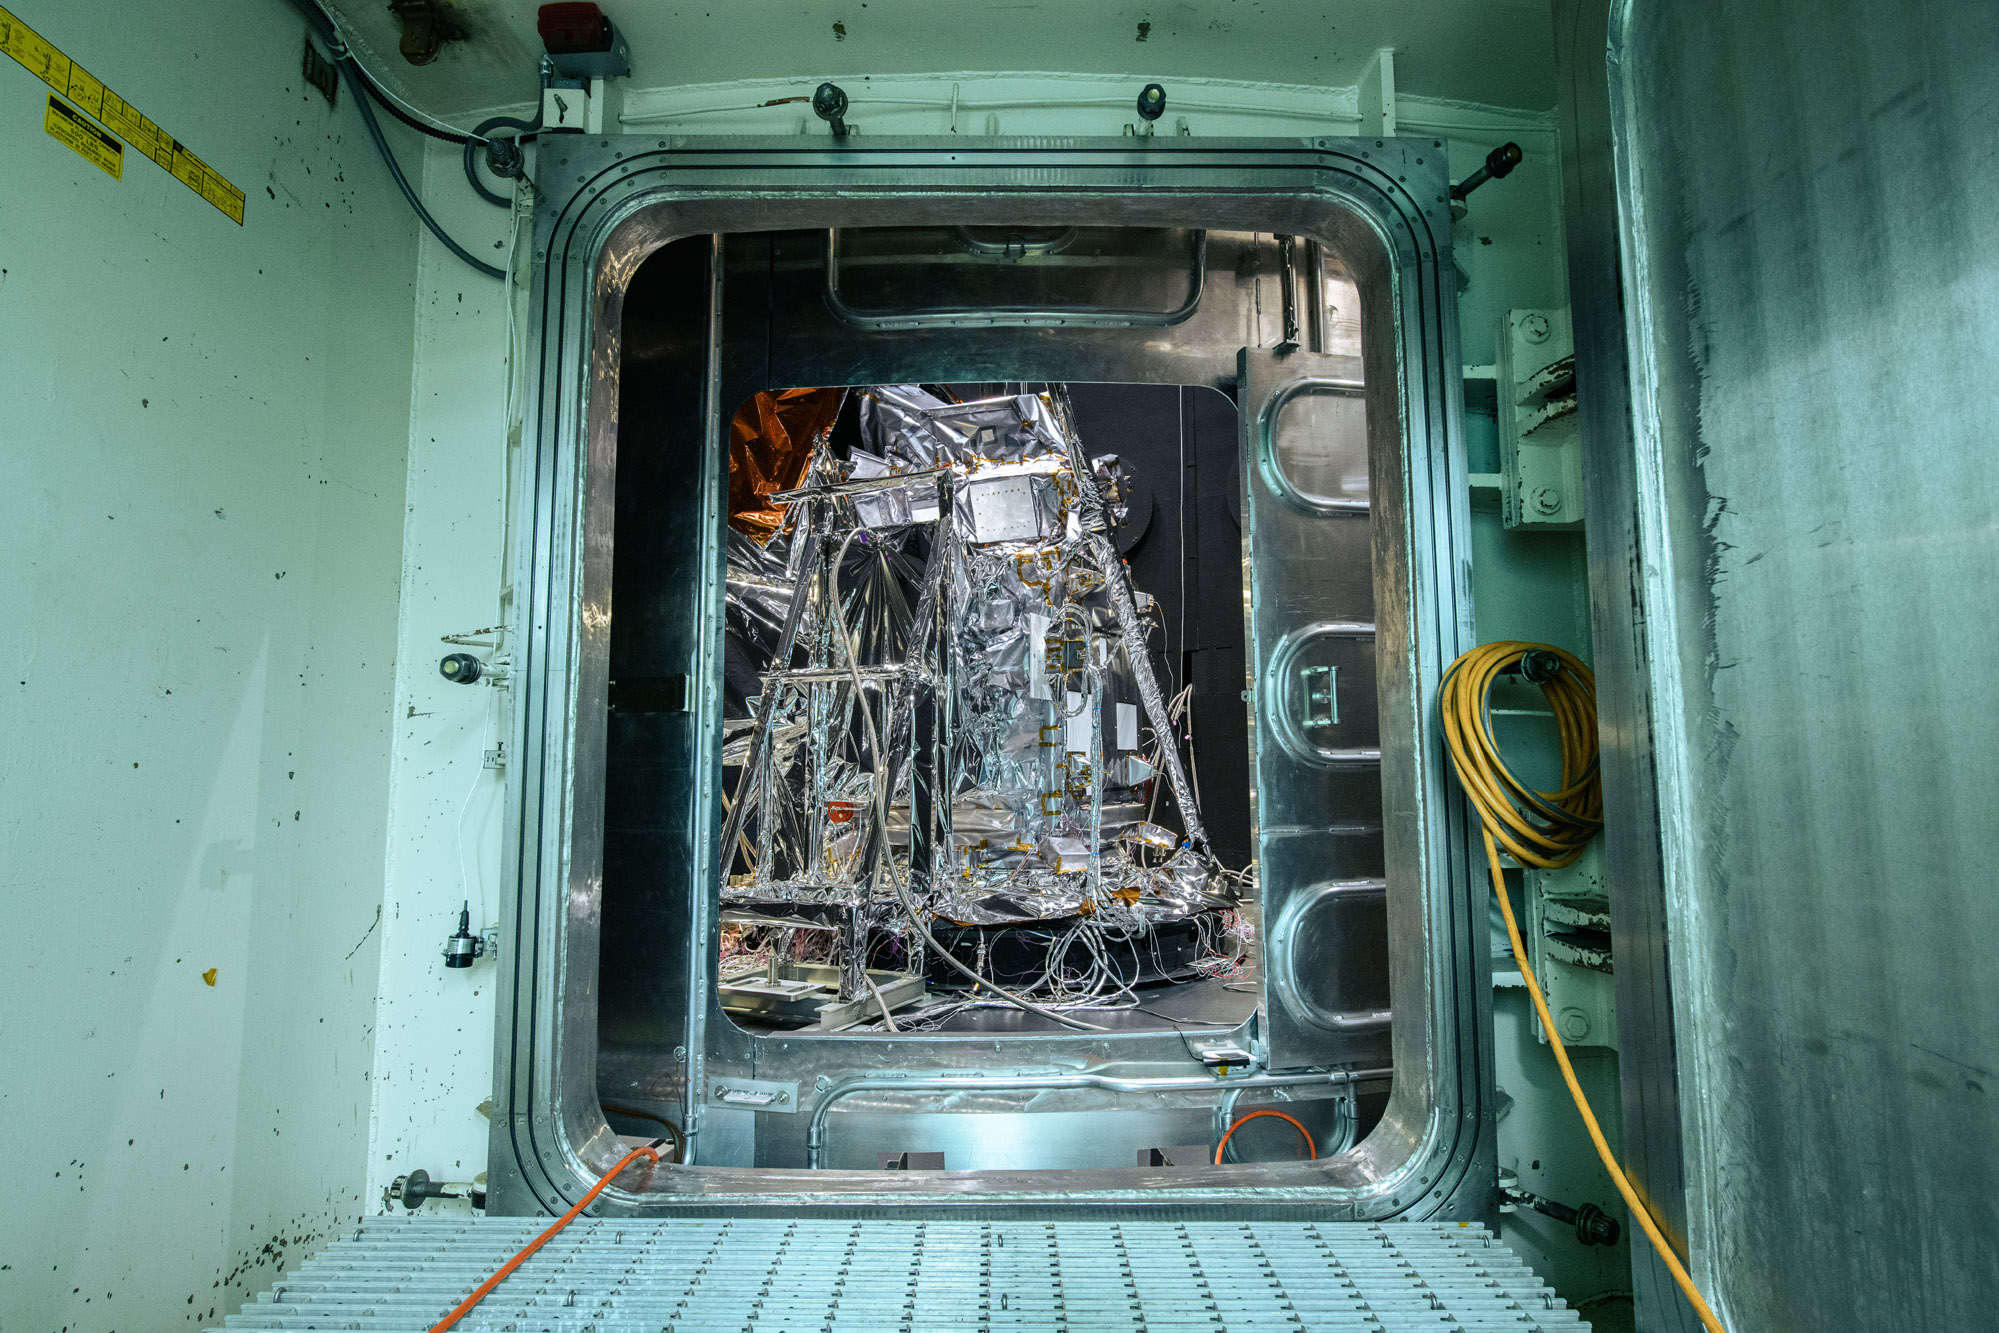
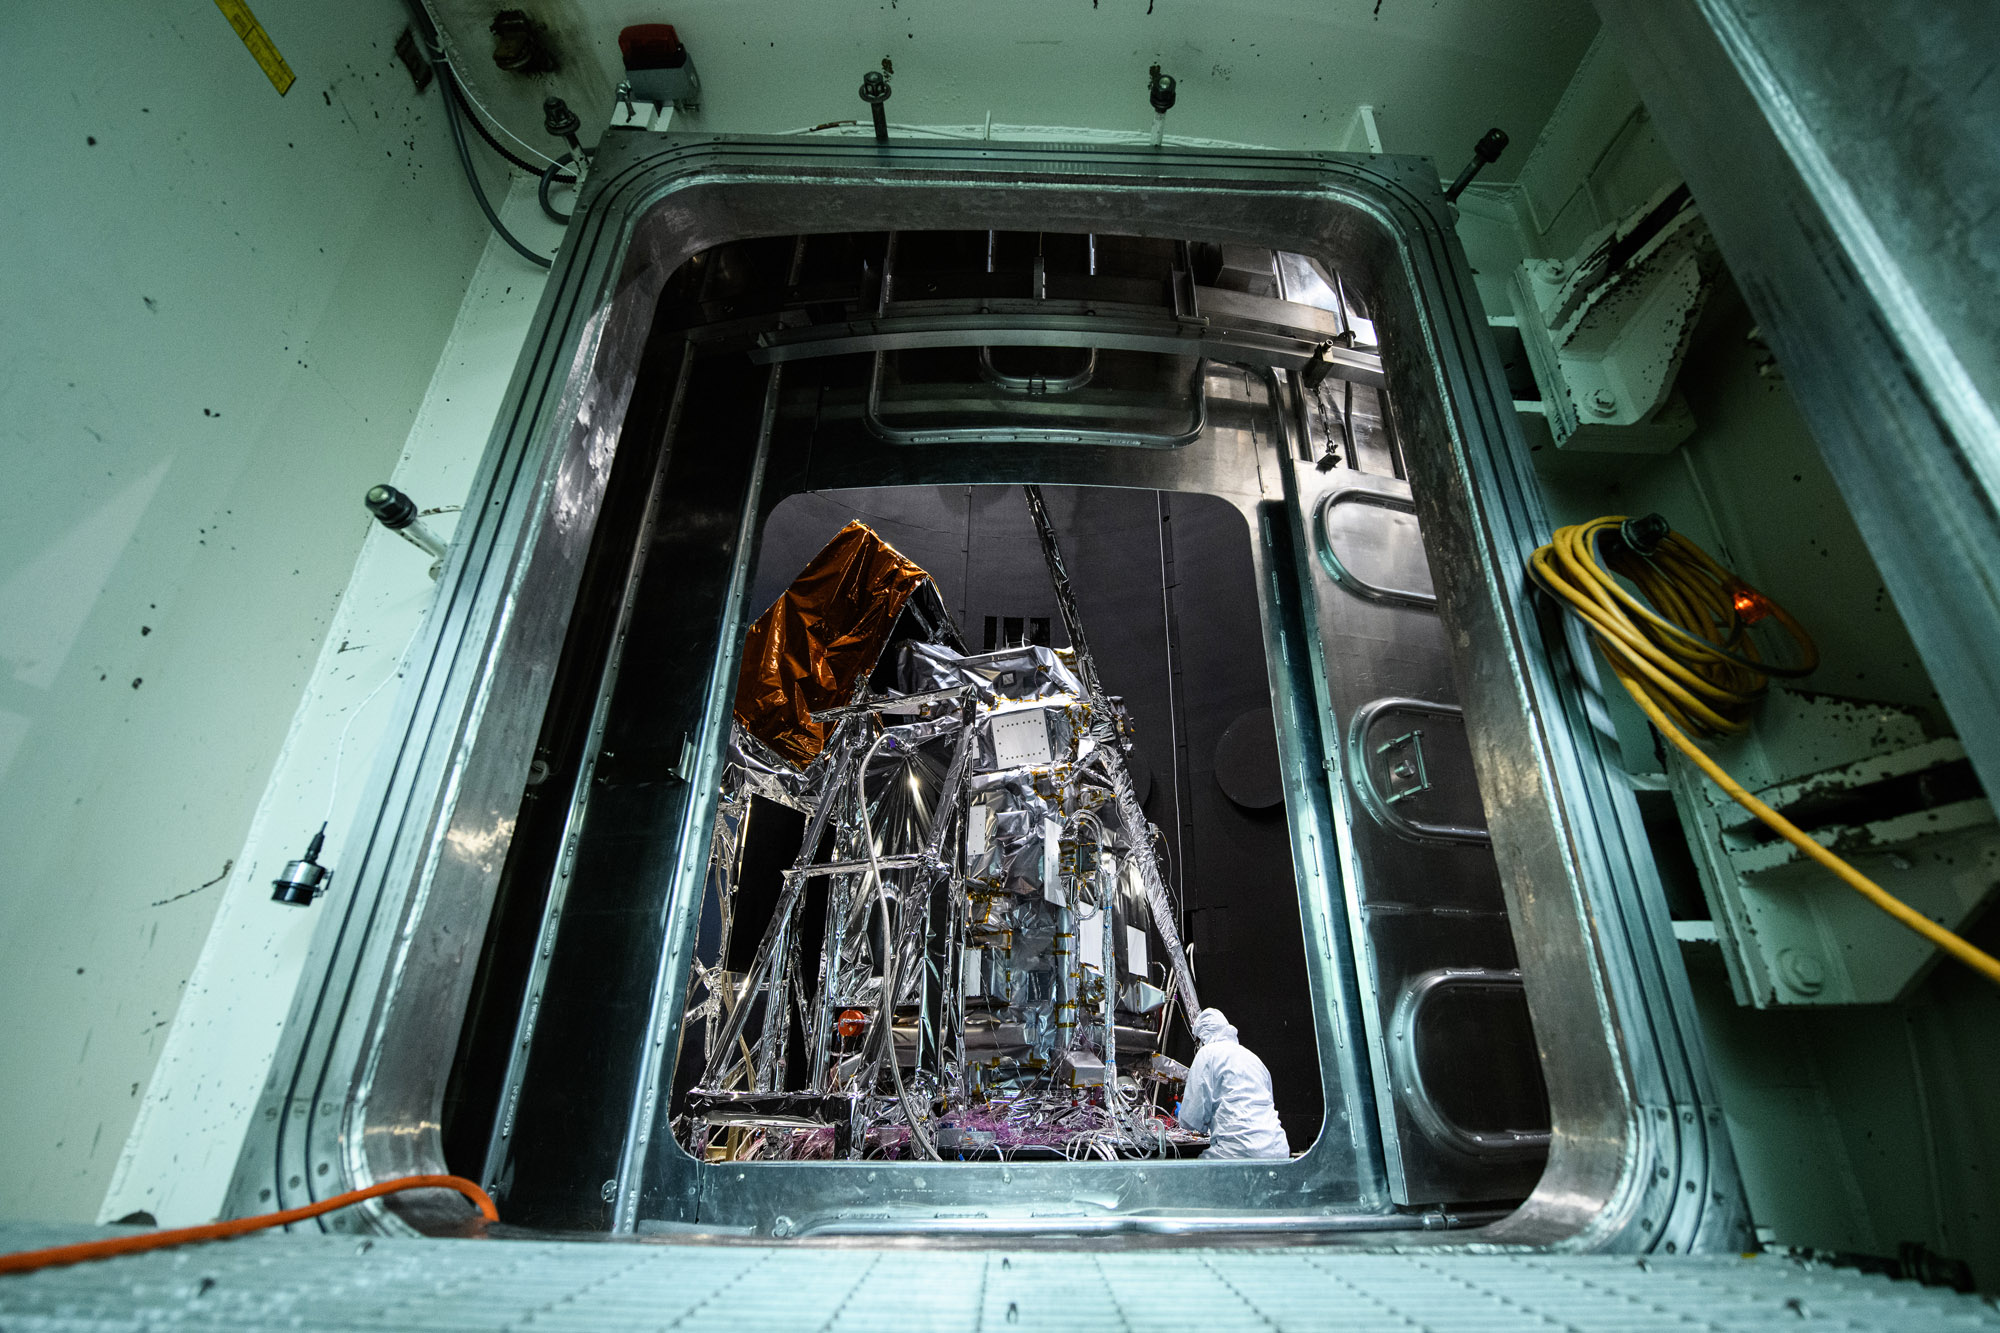
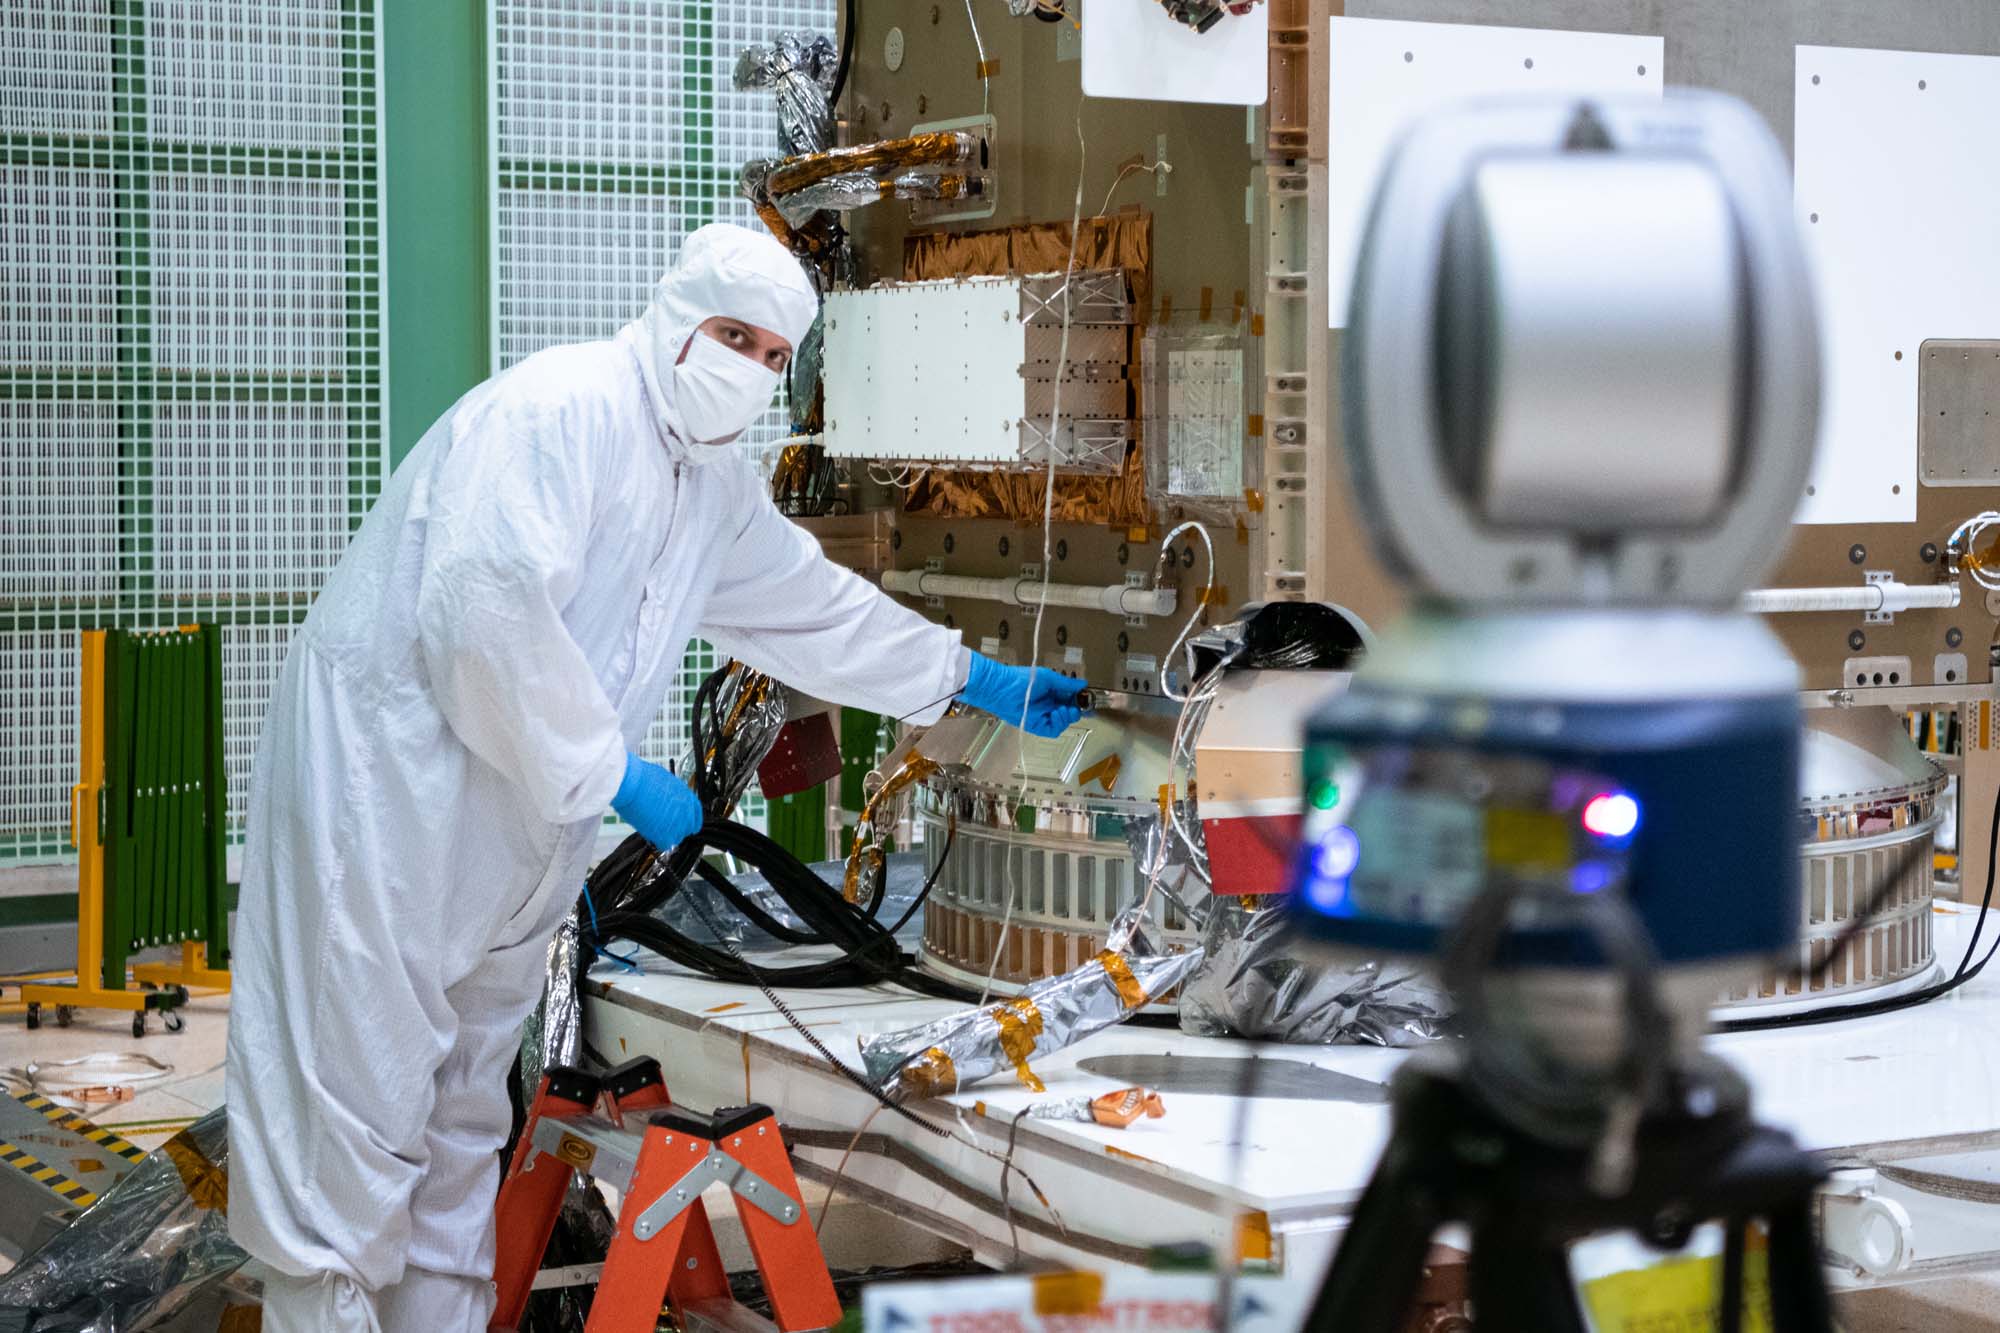
The Ocean Color Instrument team pushes the instrument into the Thermal Vacuum Chamber (TVAC) for environmental testing. Credit: Stover, Desiree
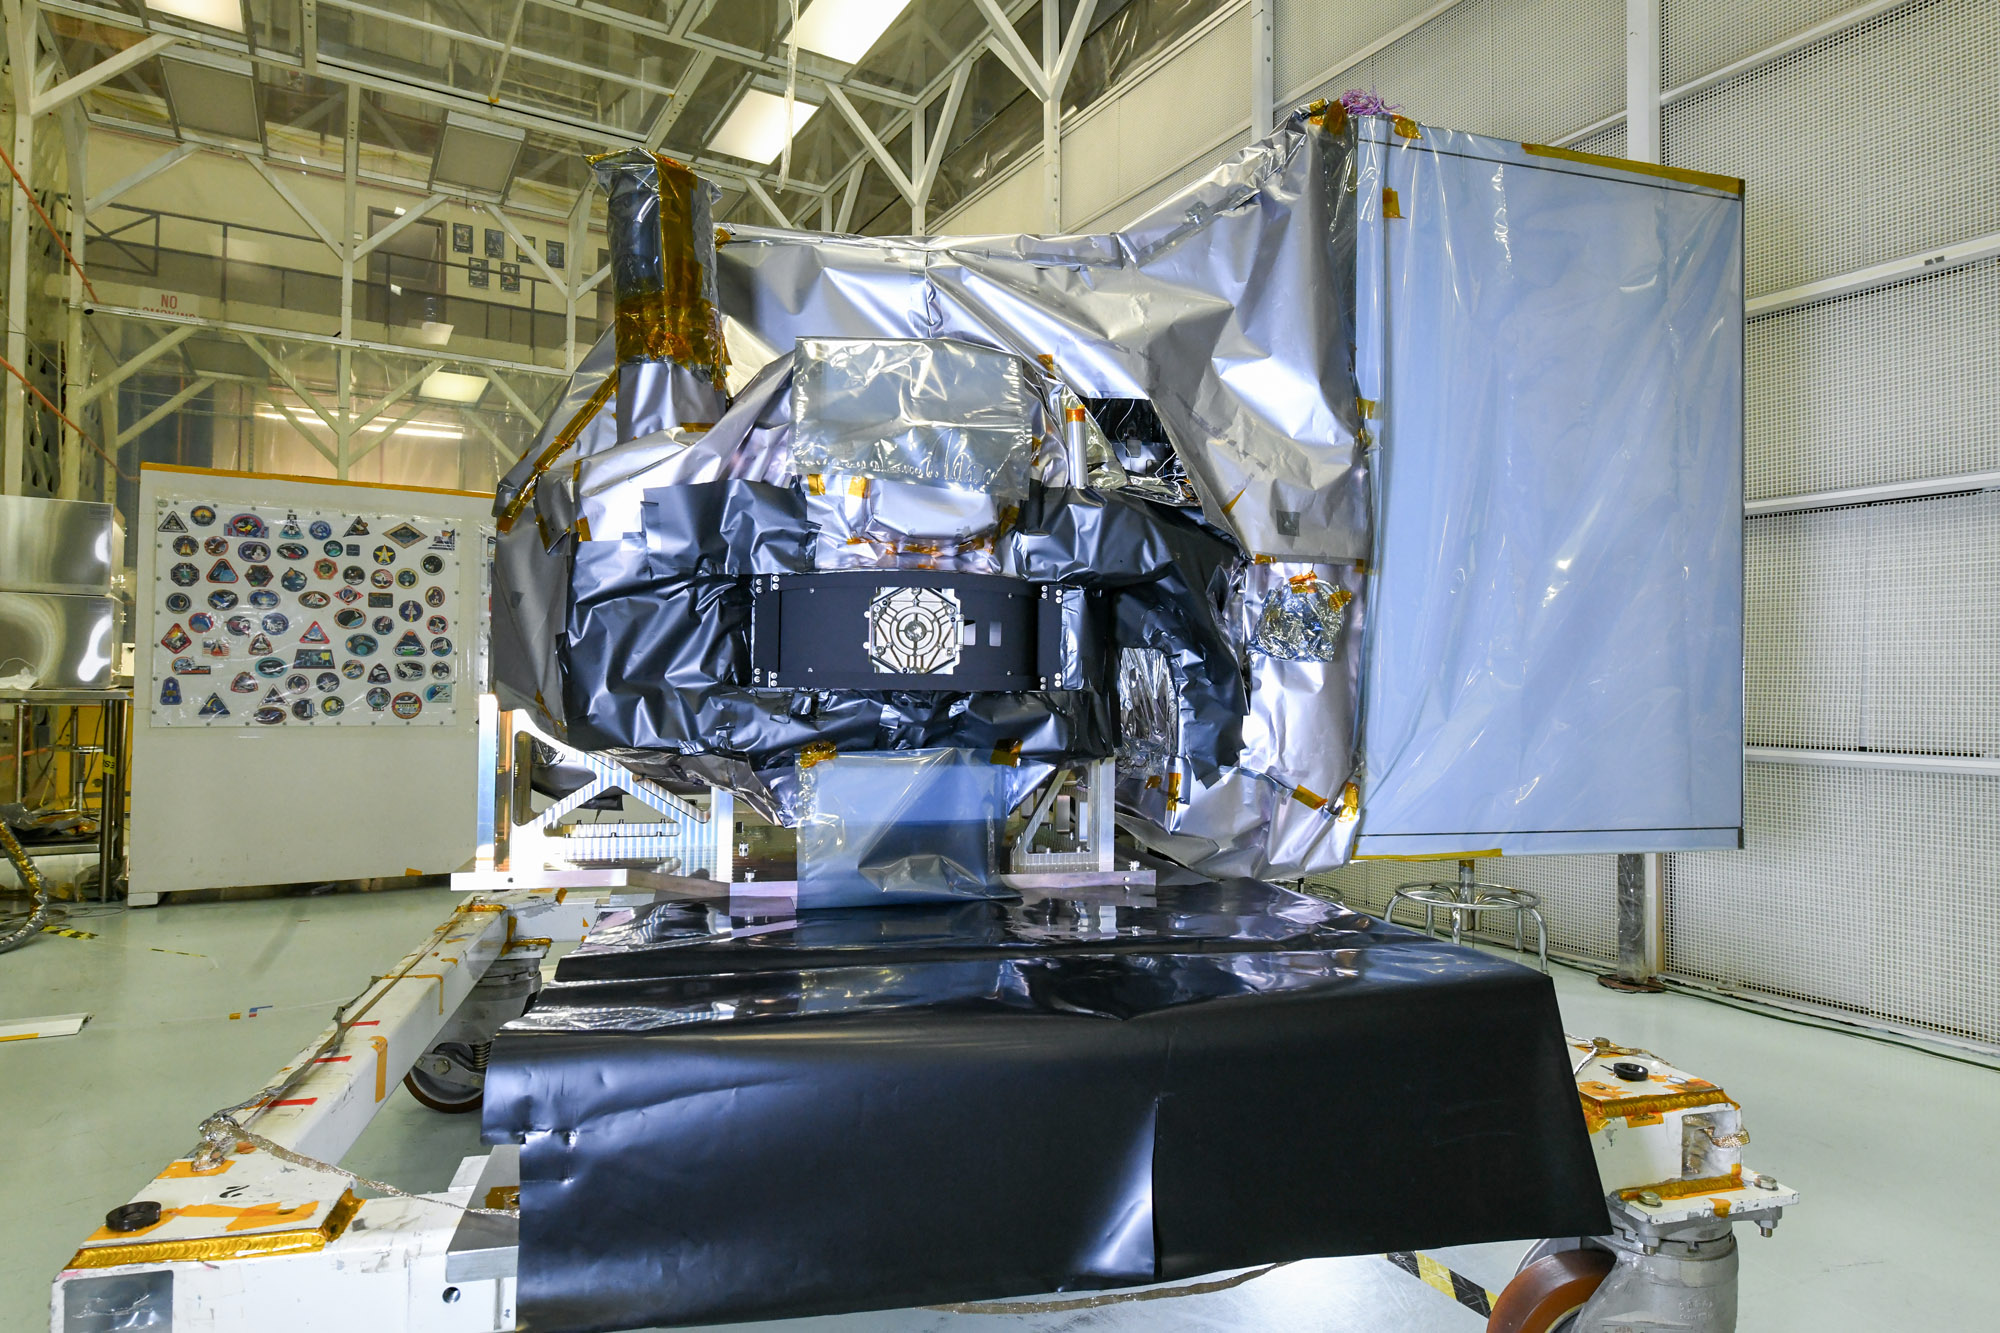
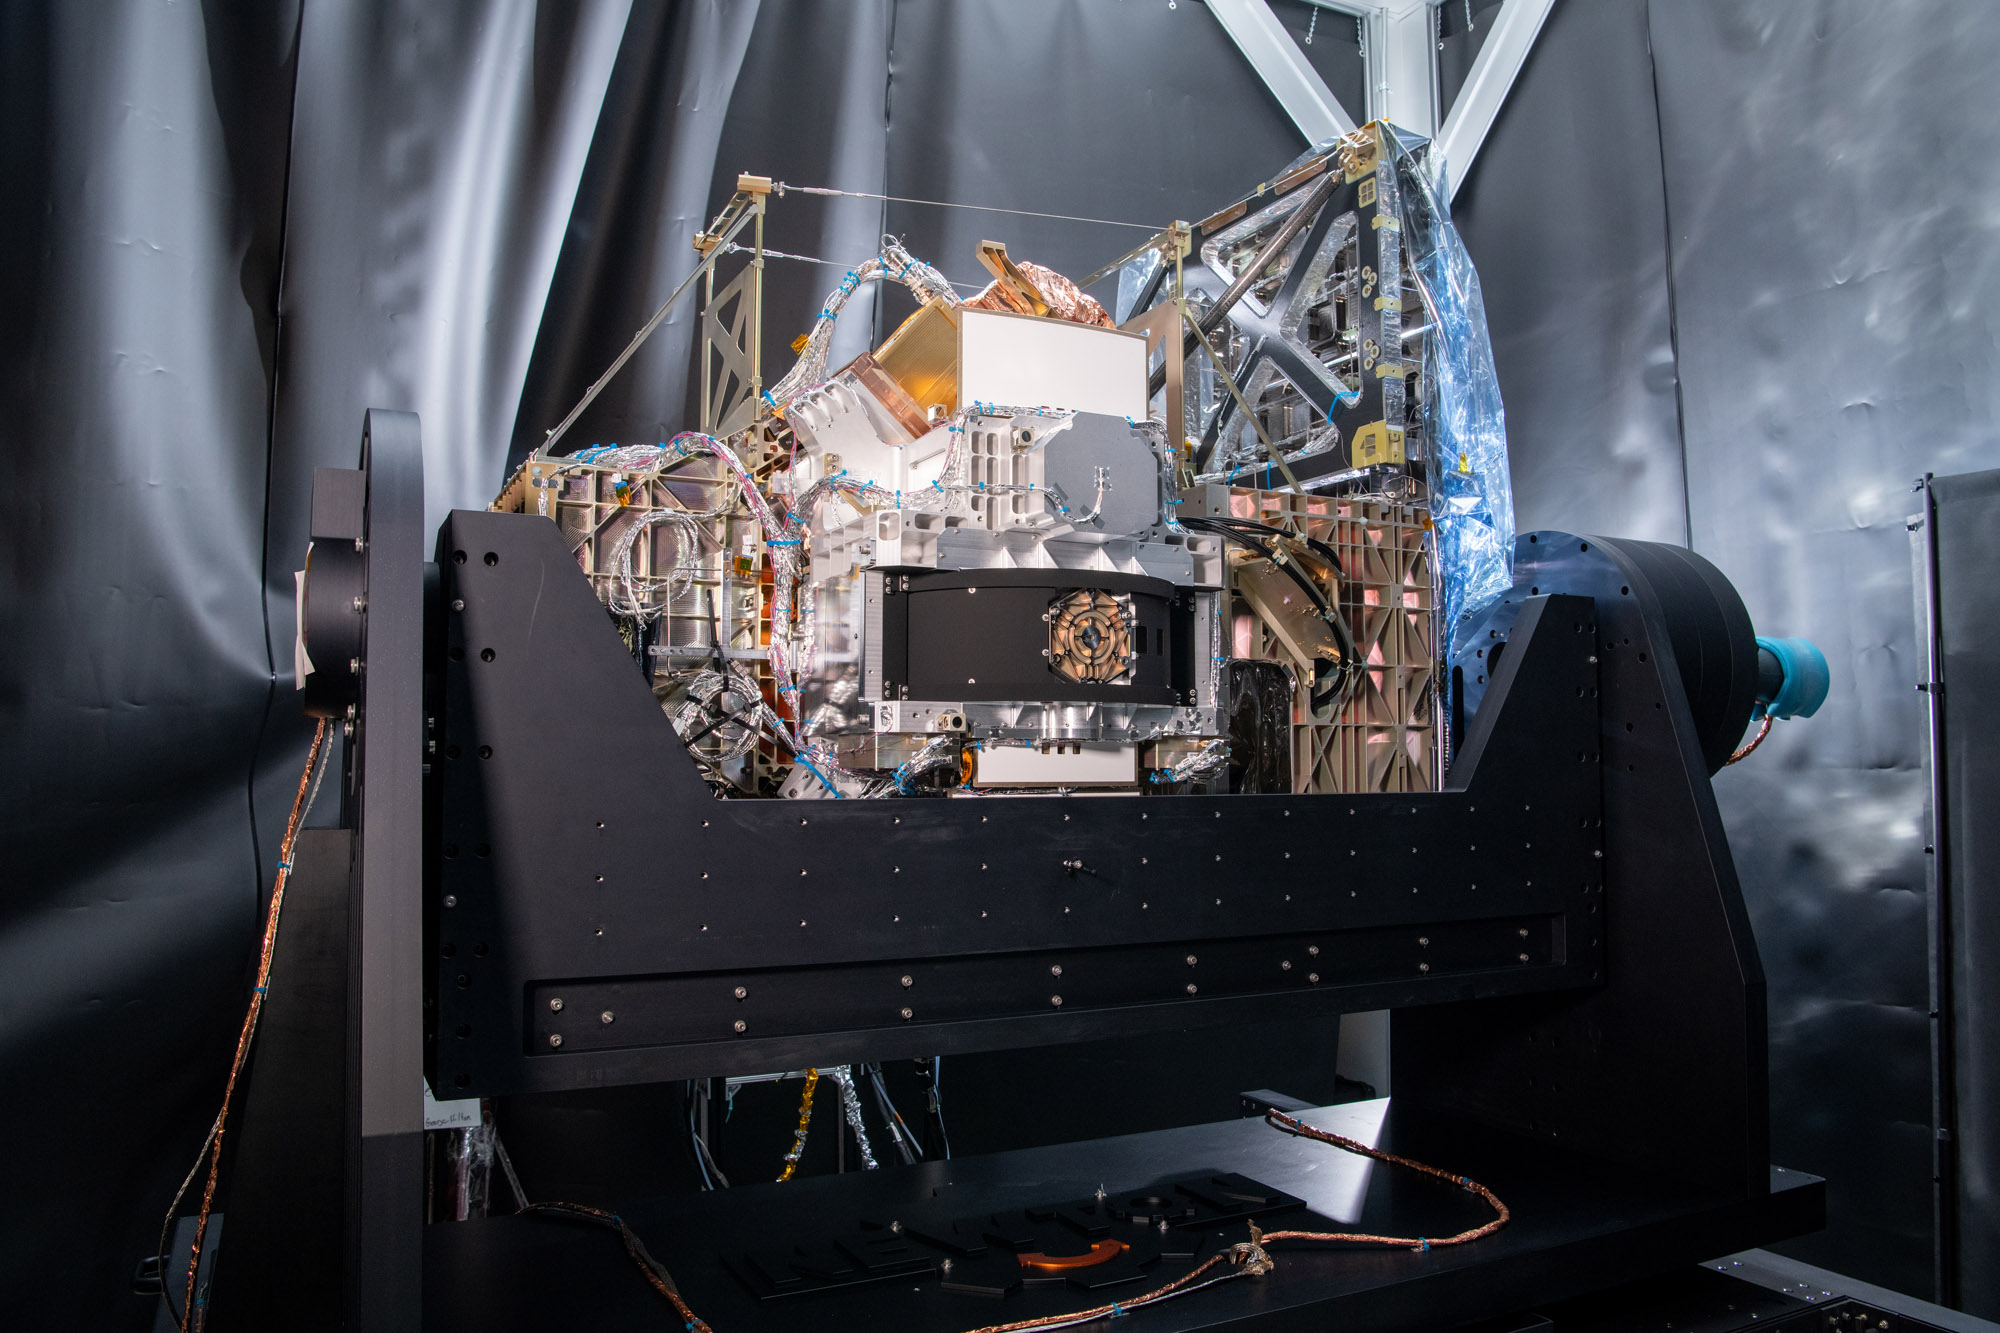
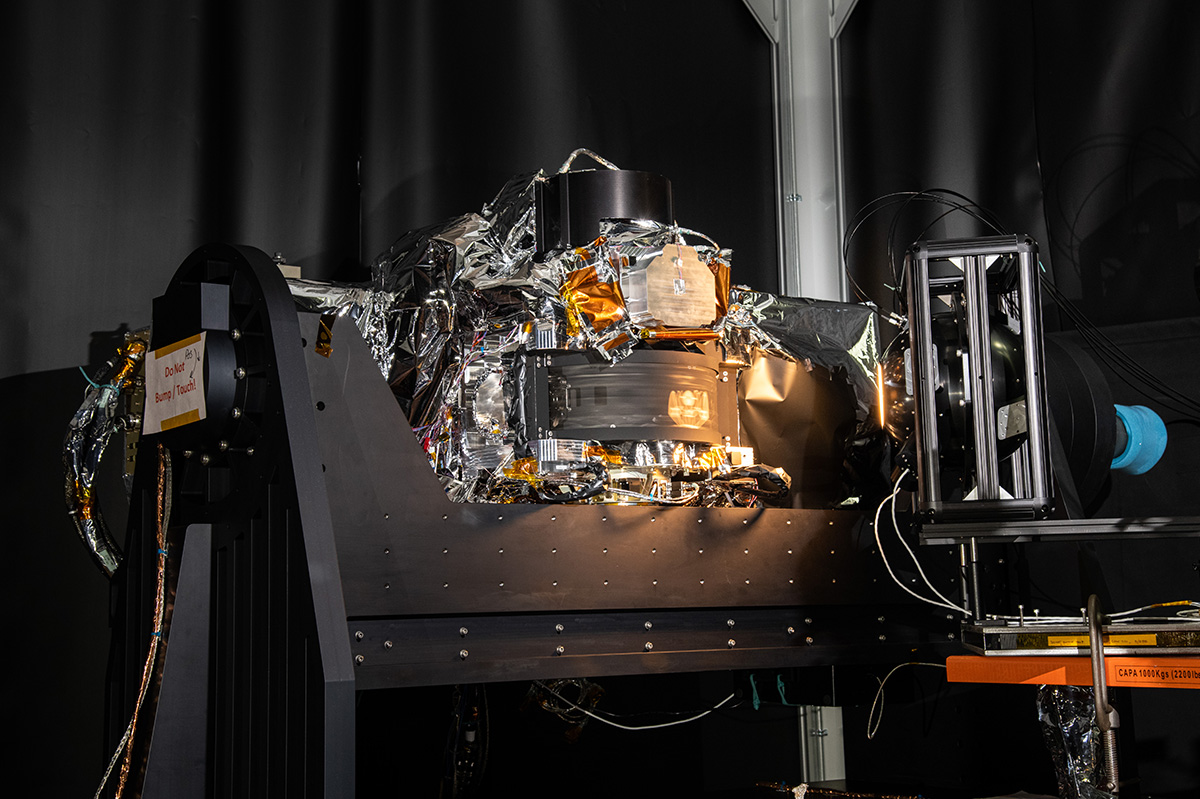
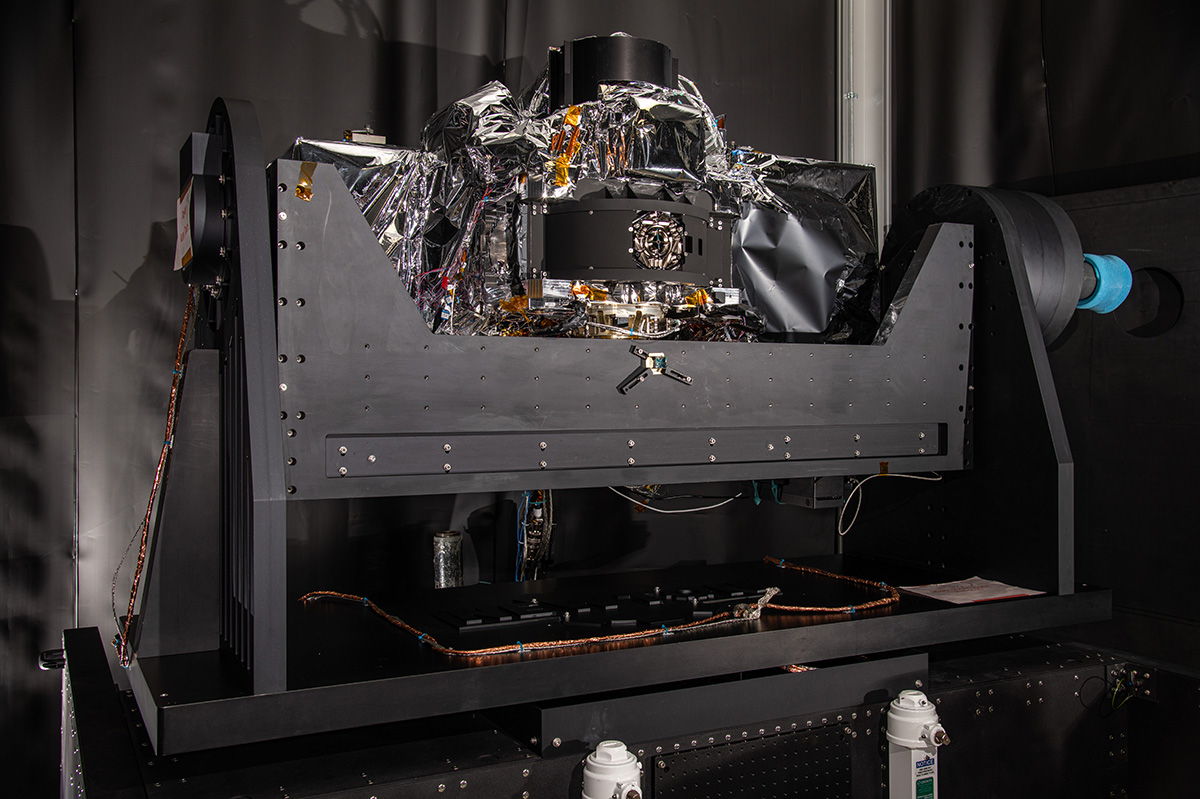
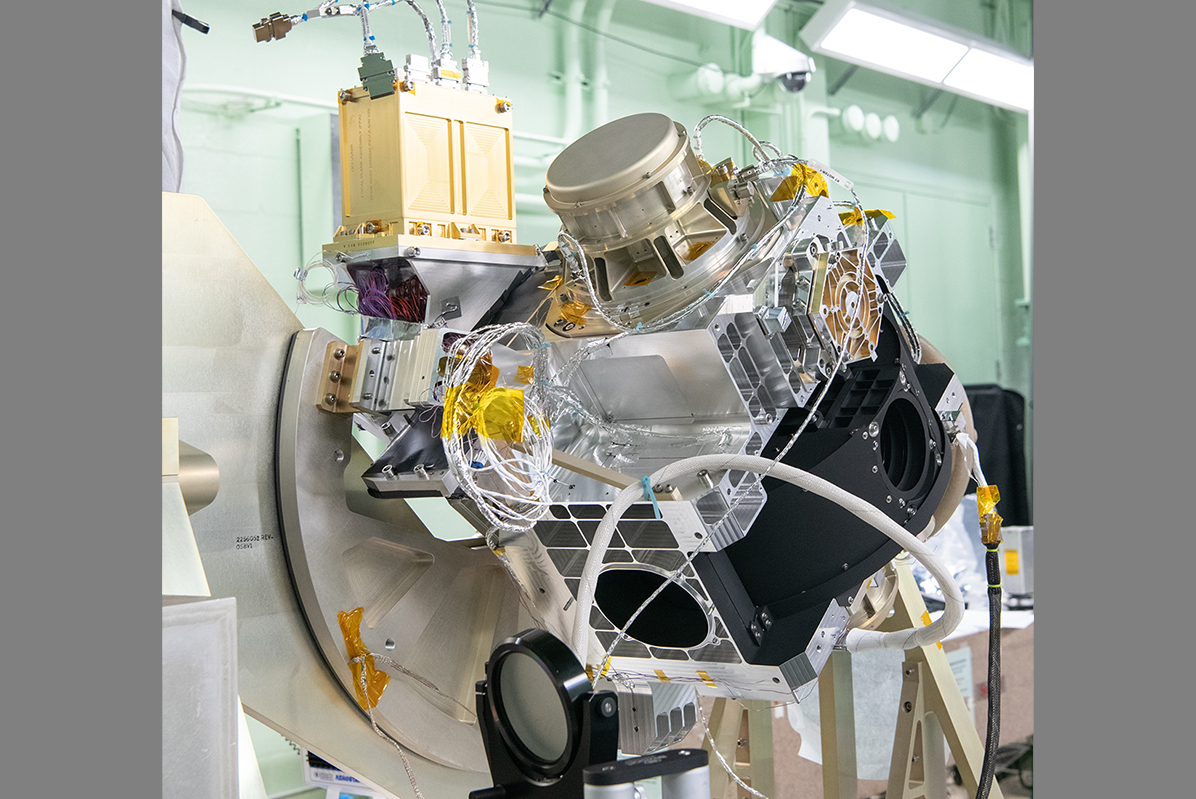
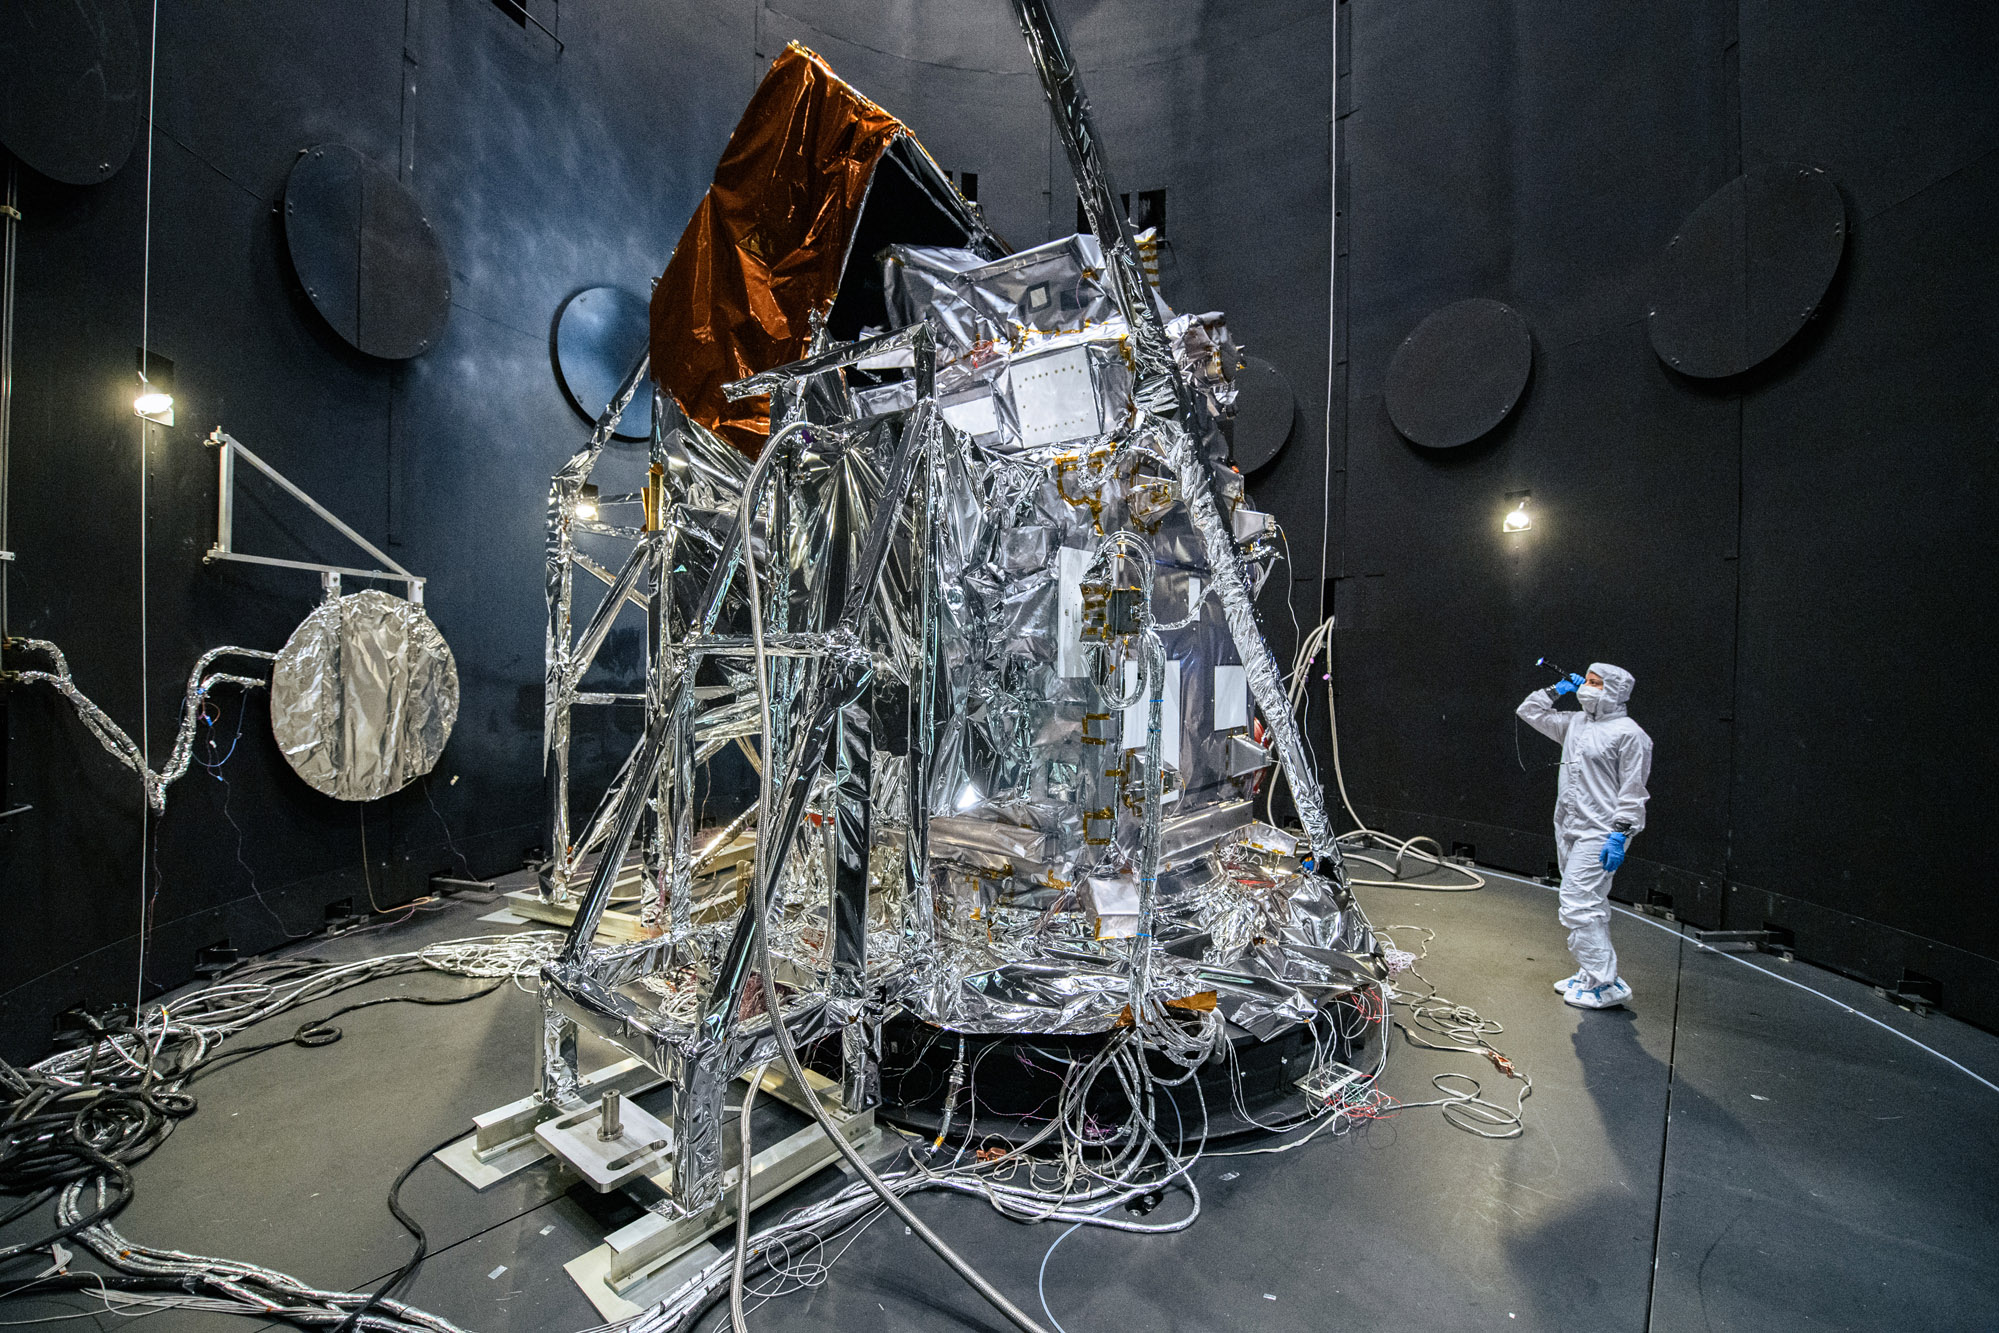
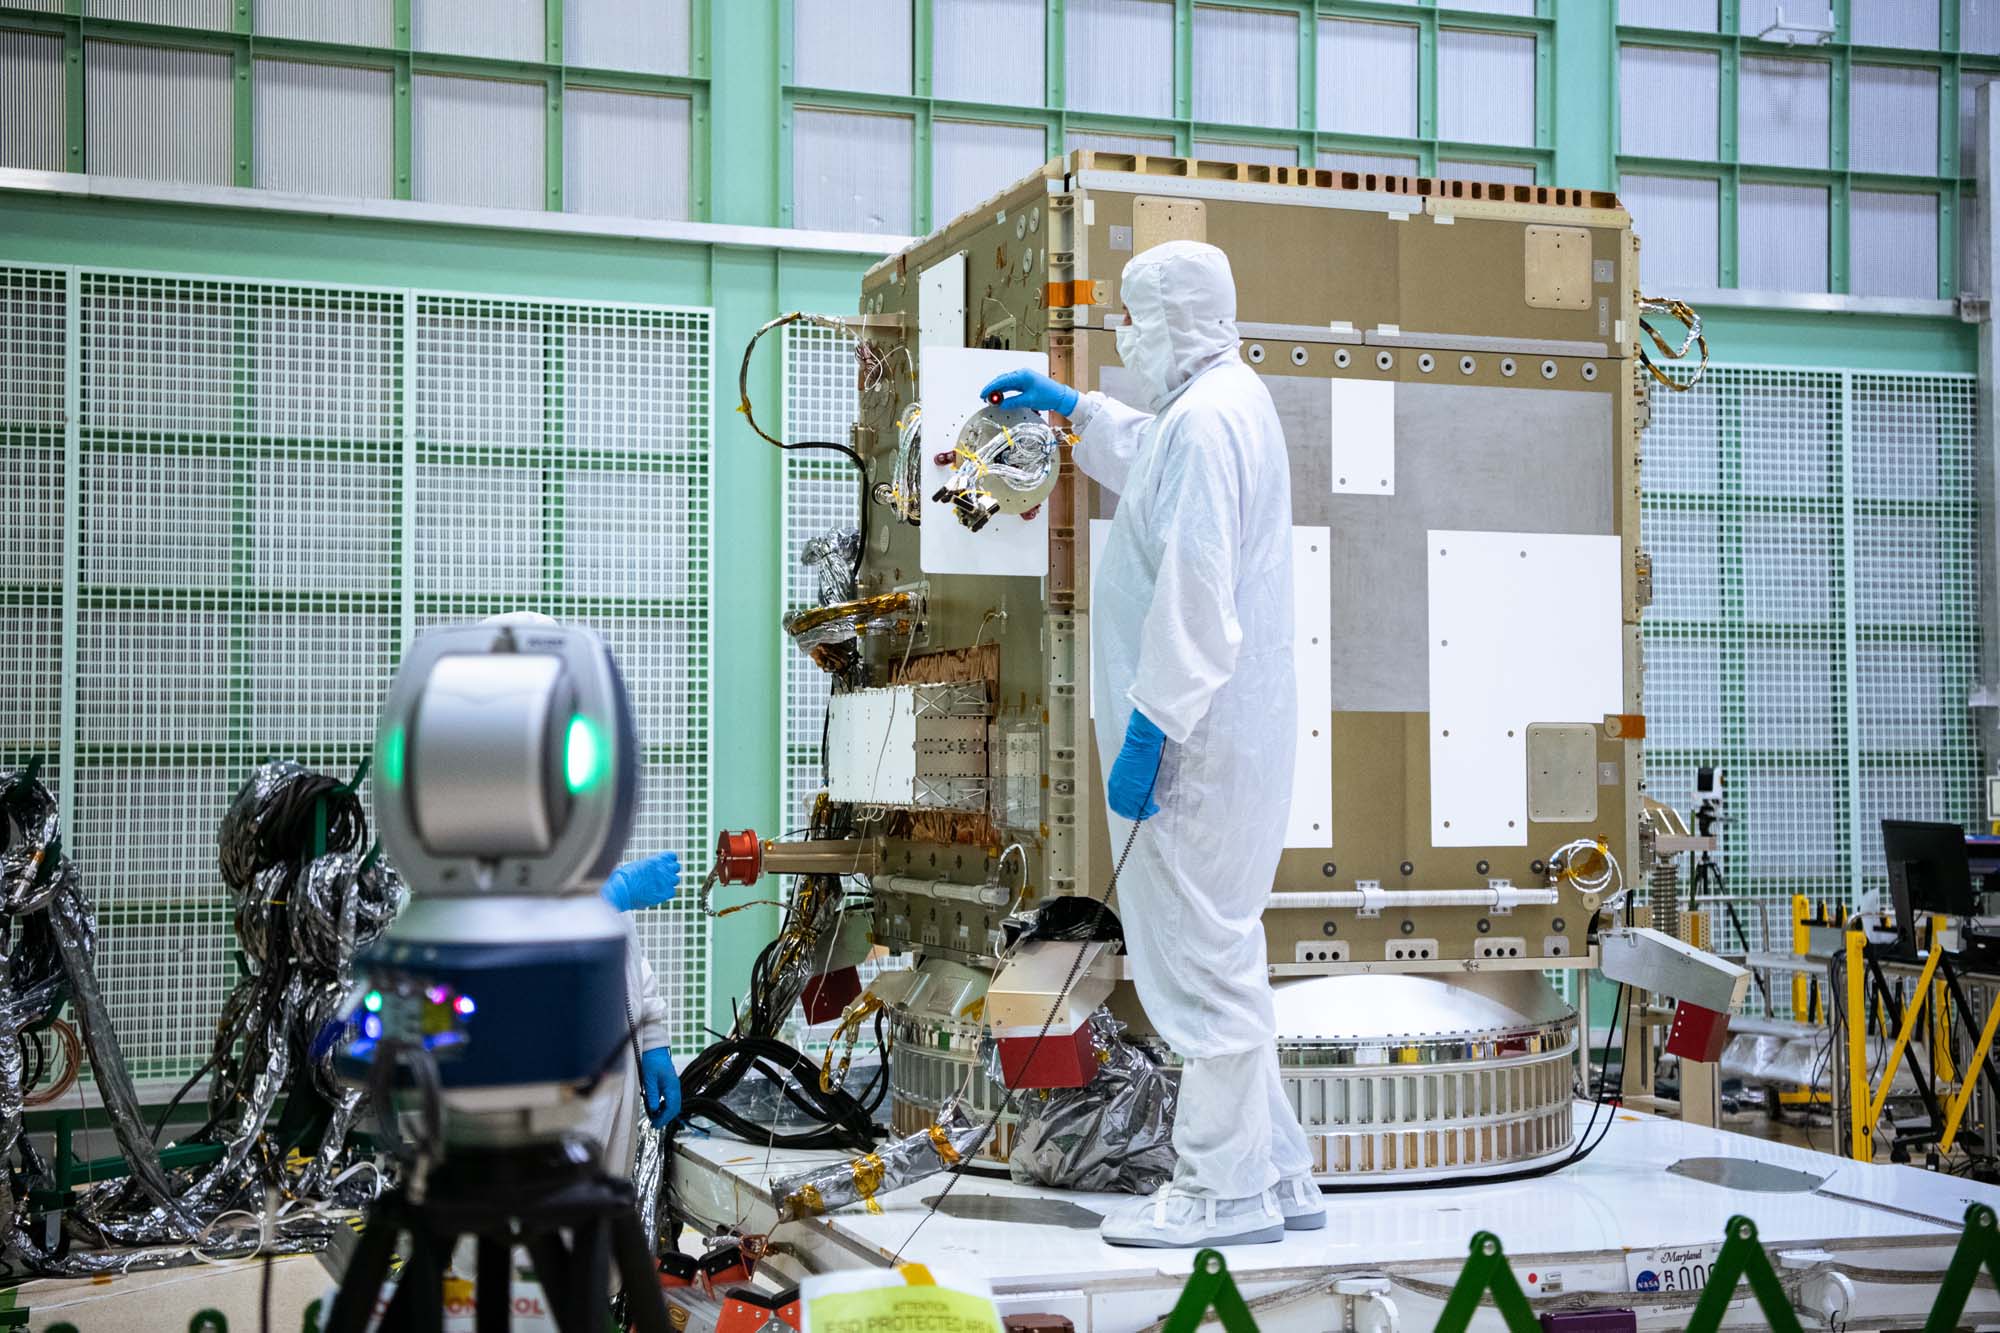
The flight Ocean Color Instrument is installed in the Thermal Vacuum Chamber (TVAC) for environmental testing. Credit: Mellos, Katherine
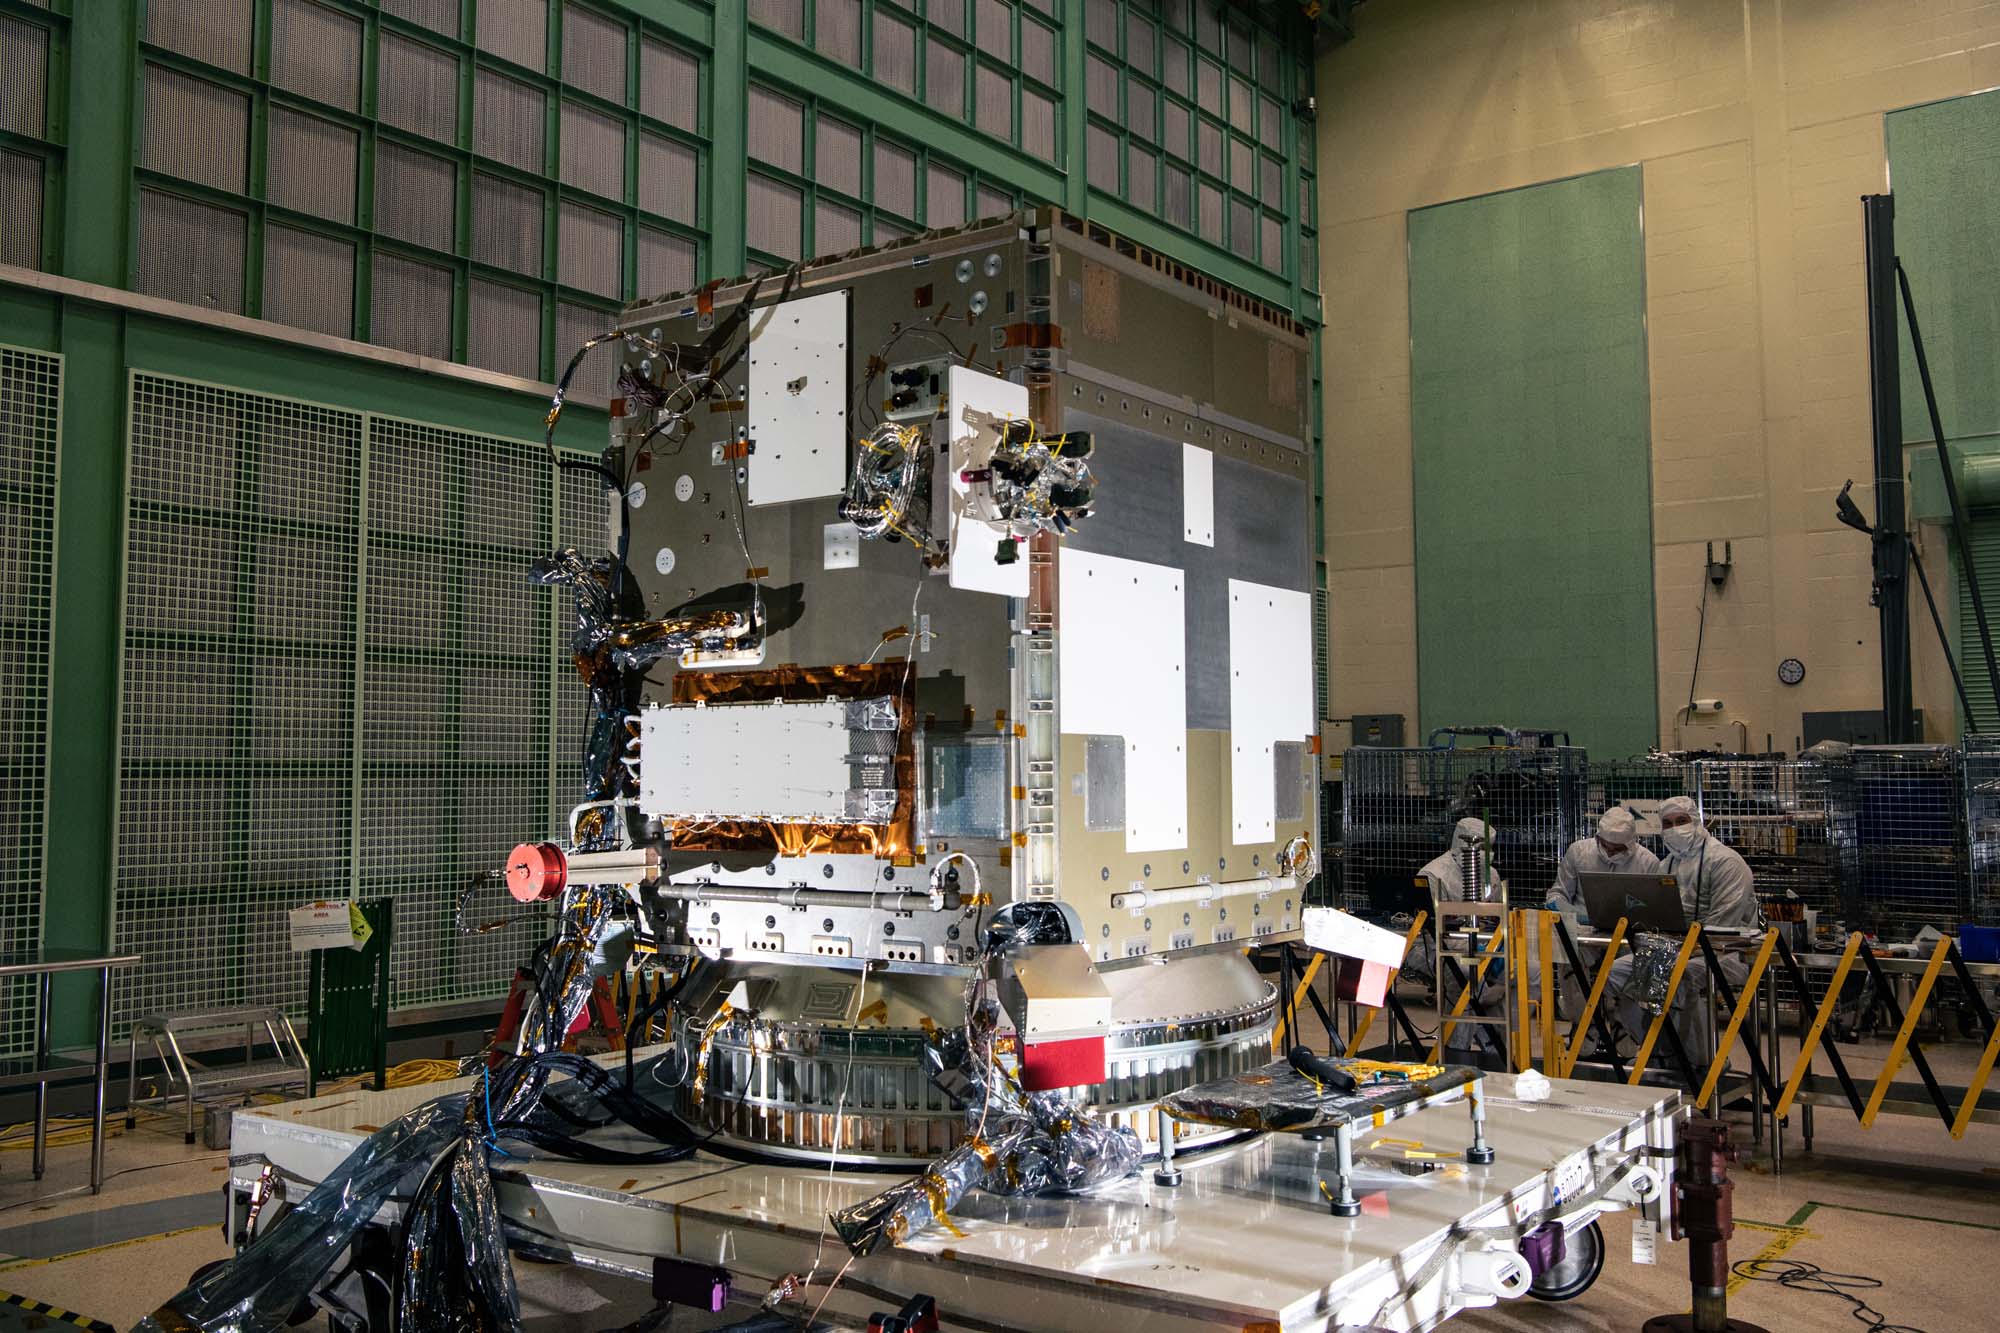
The Ocean Color Instrument is installed in the Thermal Vacuum (TVAC) chamber and prepared for thermal testing. Credit: Mellos, Katherine
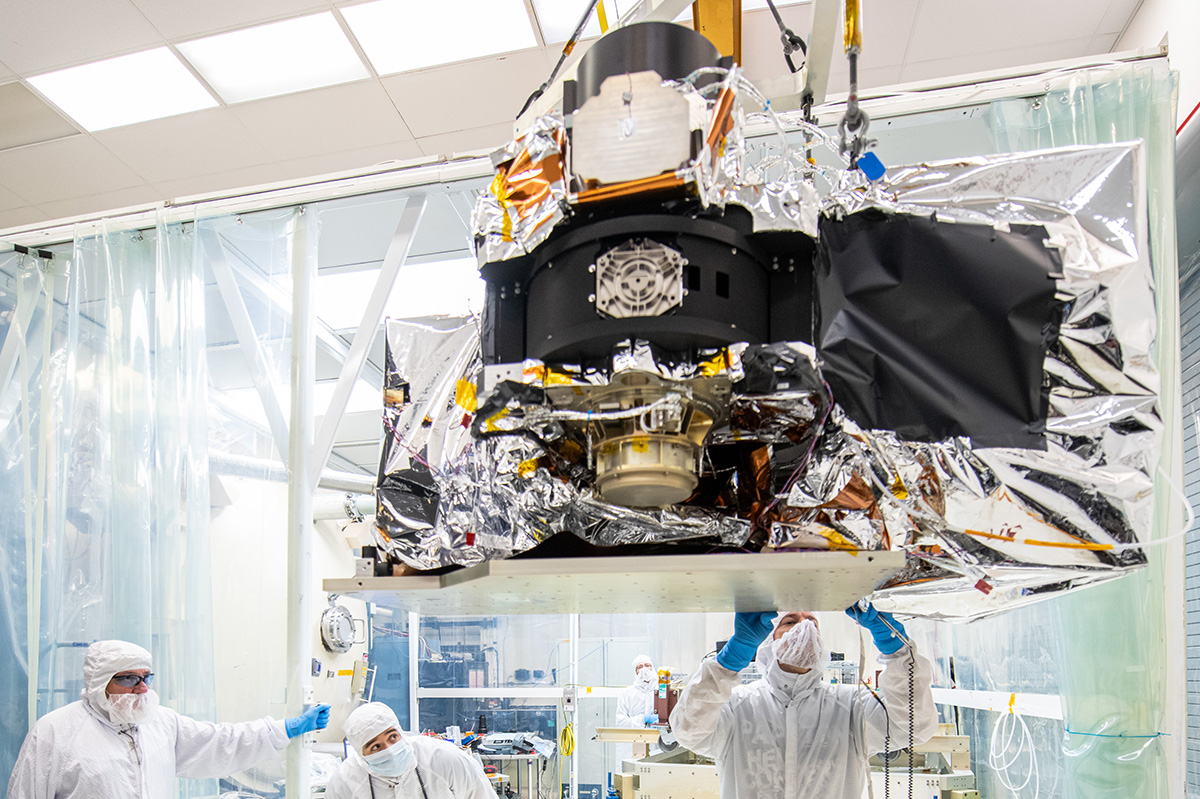
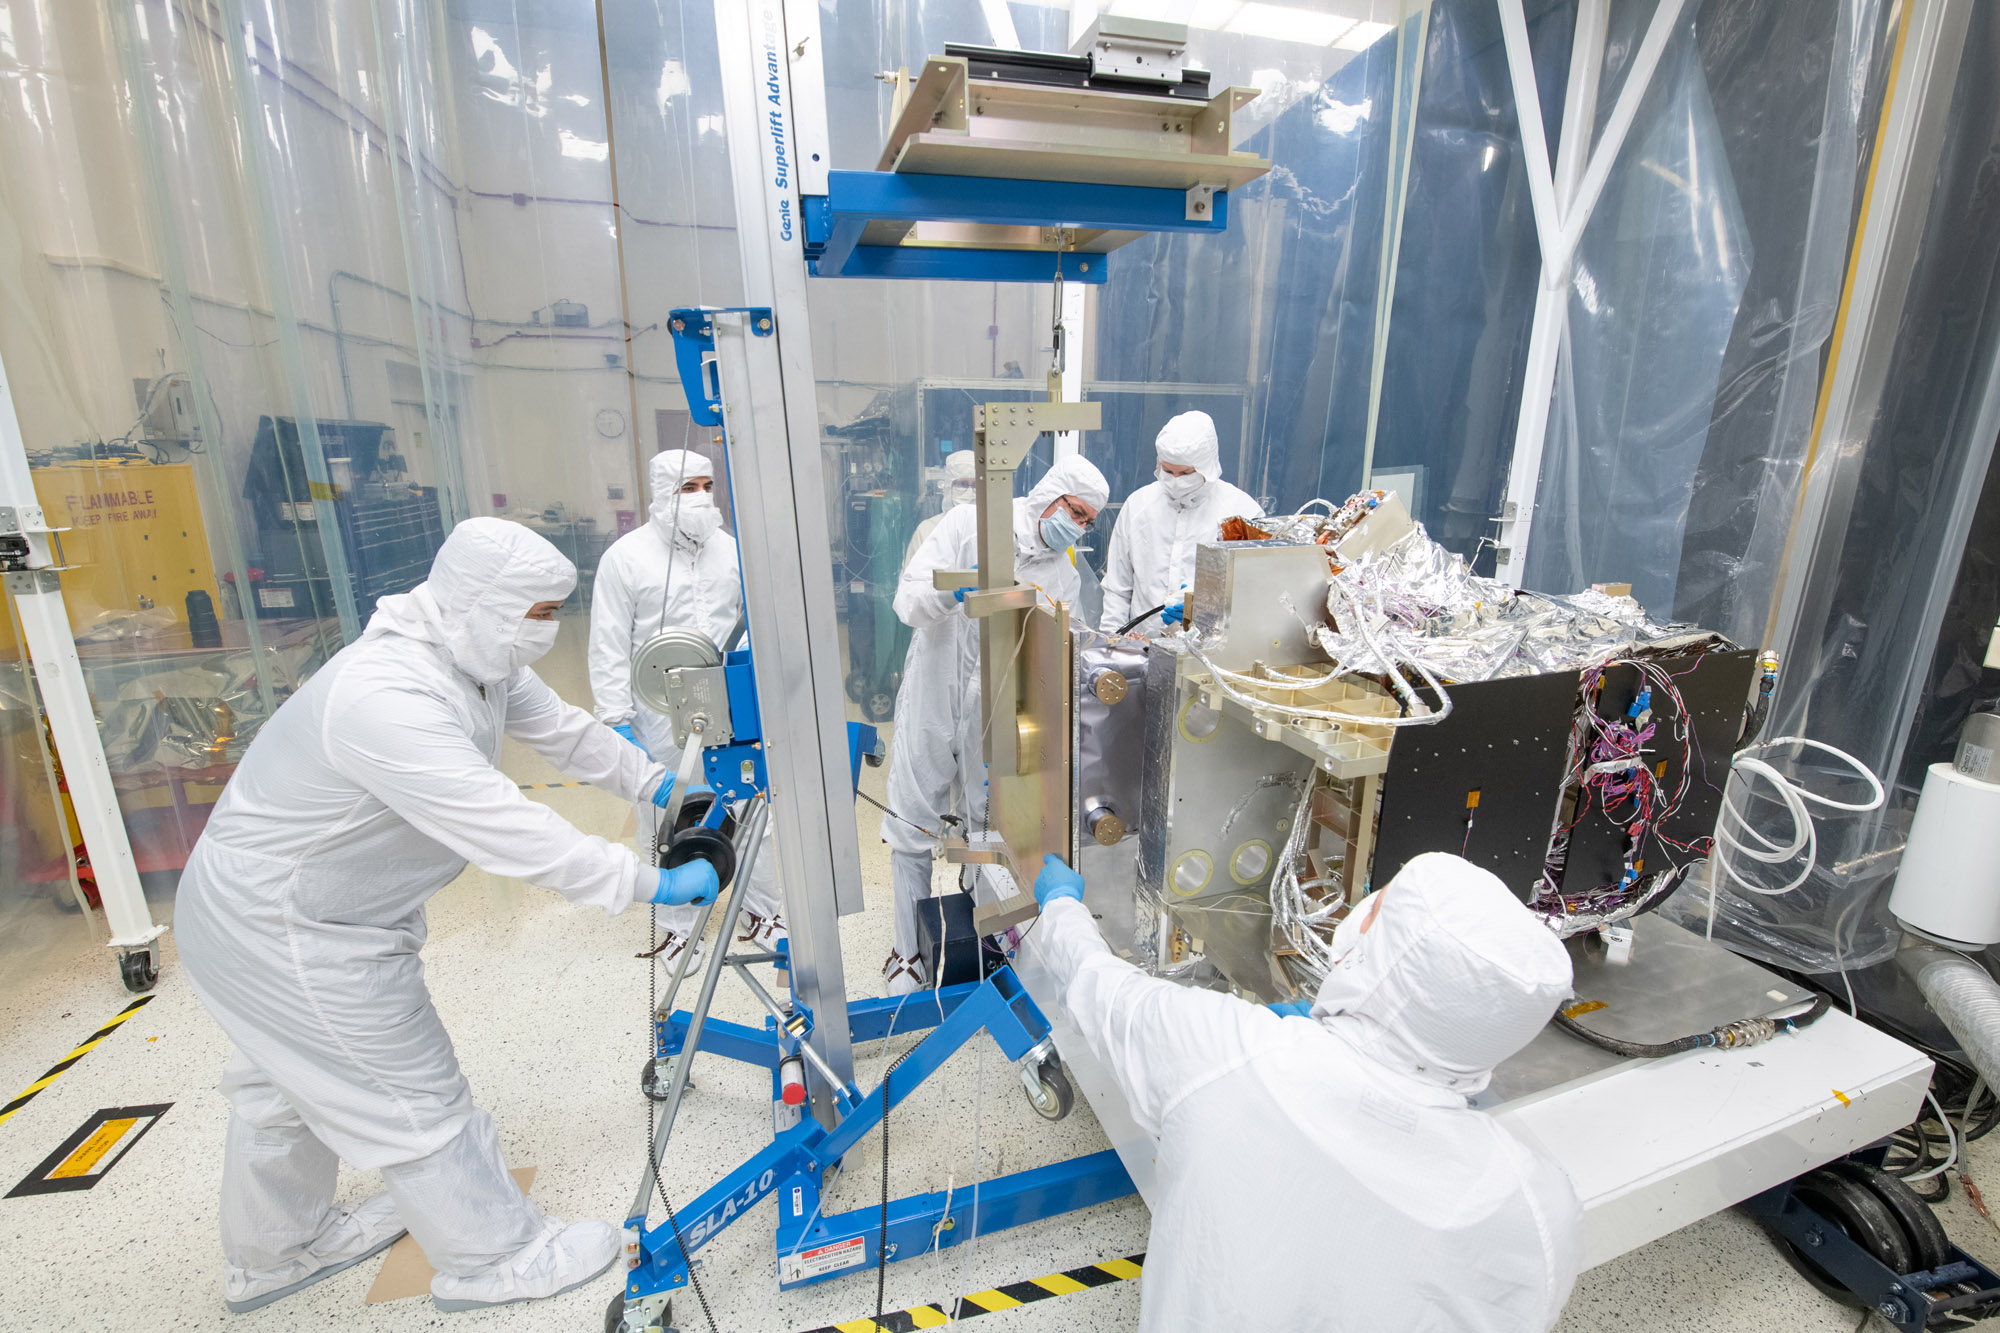
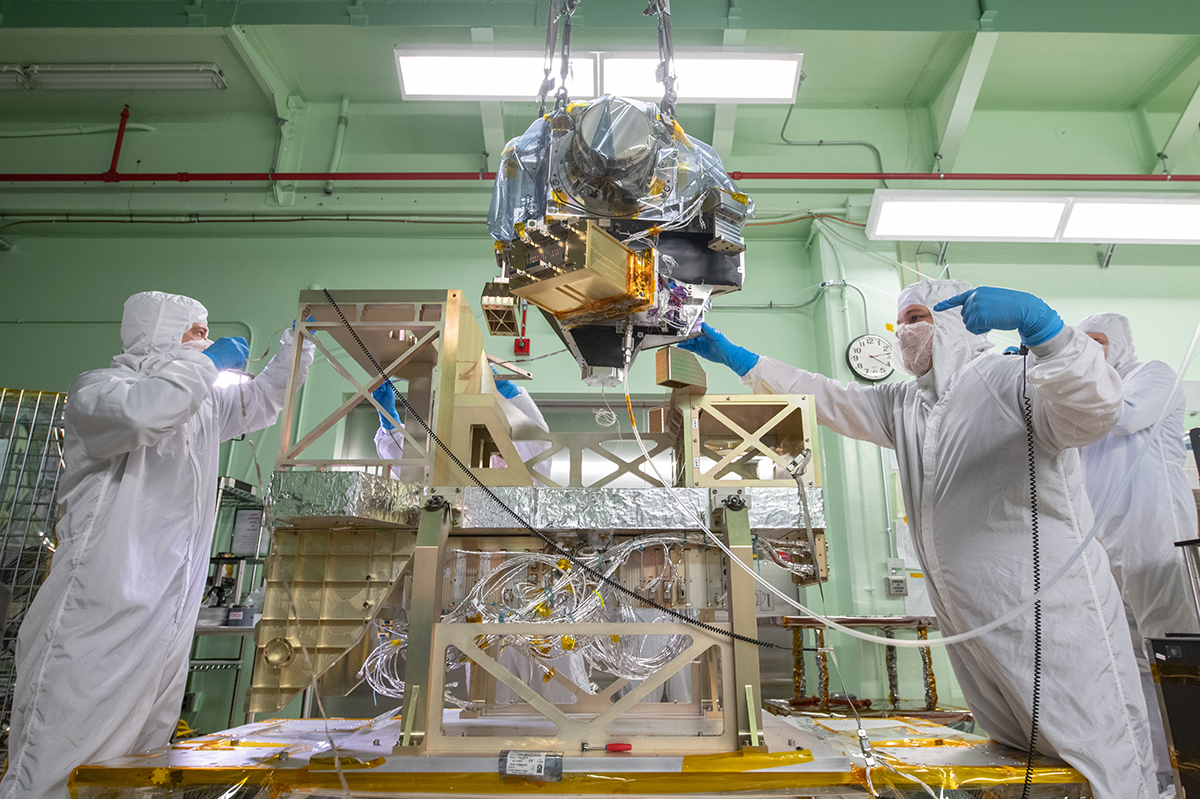
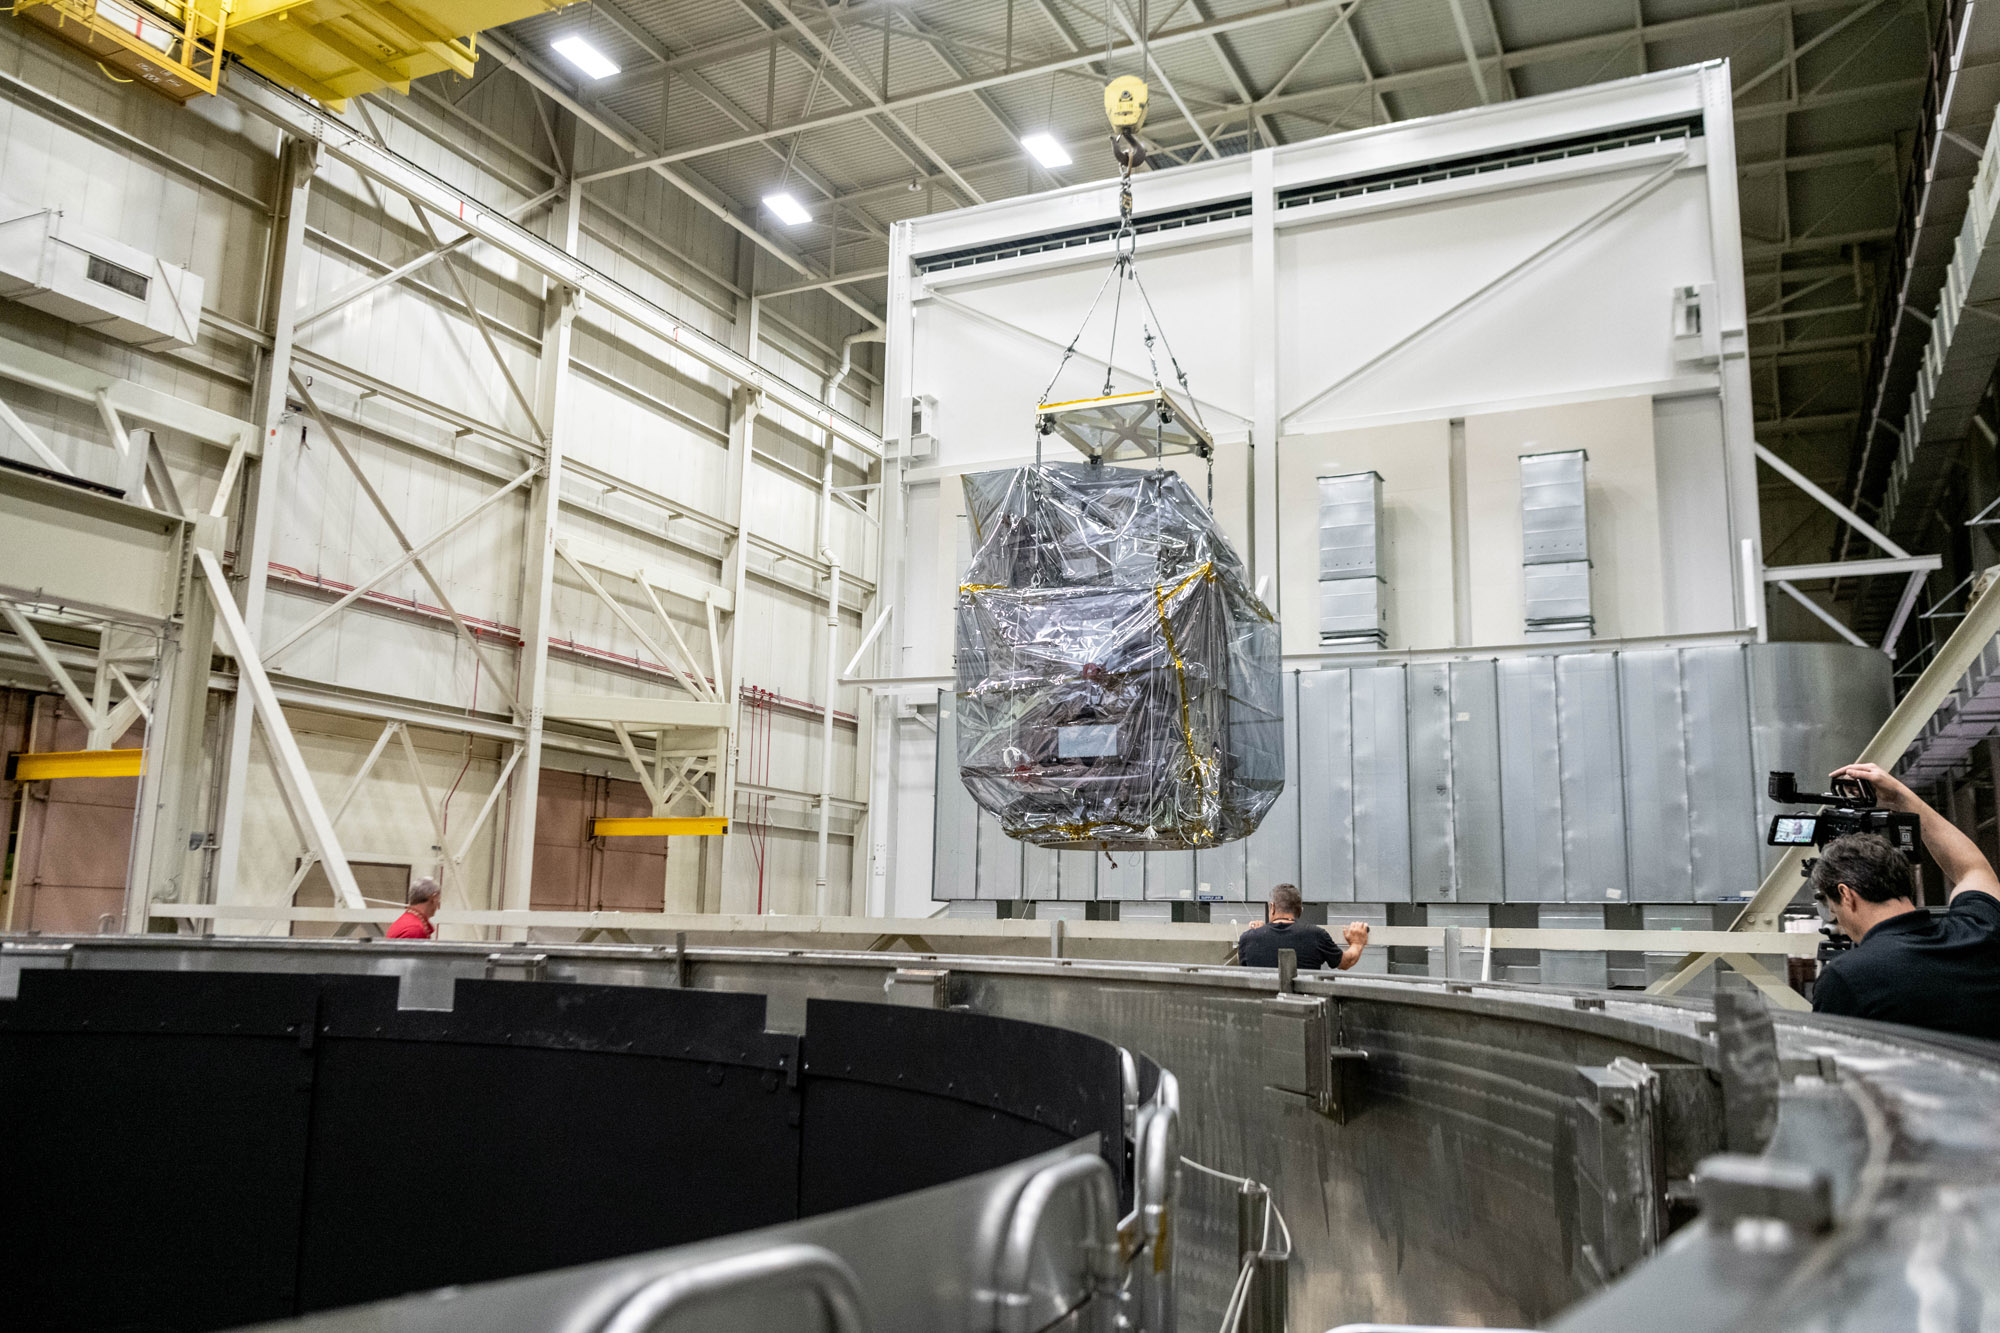
Mechanical technicians crane lift the Ocean Color Instrument on to the Thermal Vacuum Chamber (TVAC) cart. Credit: Stover, Desiree
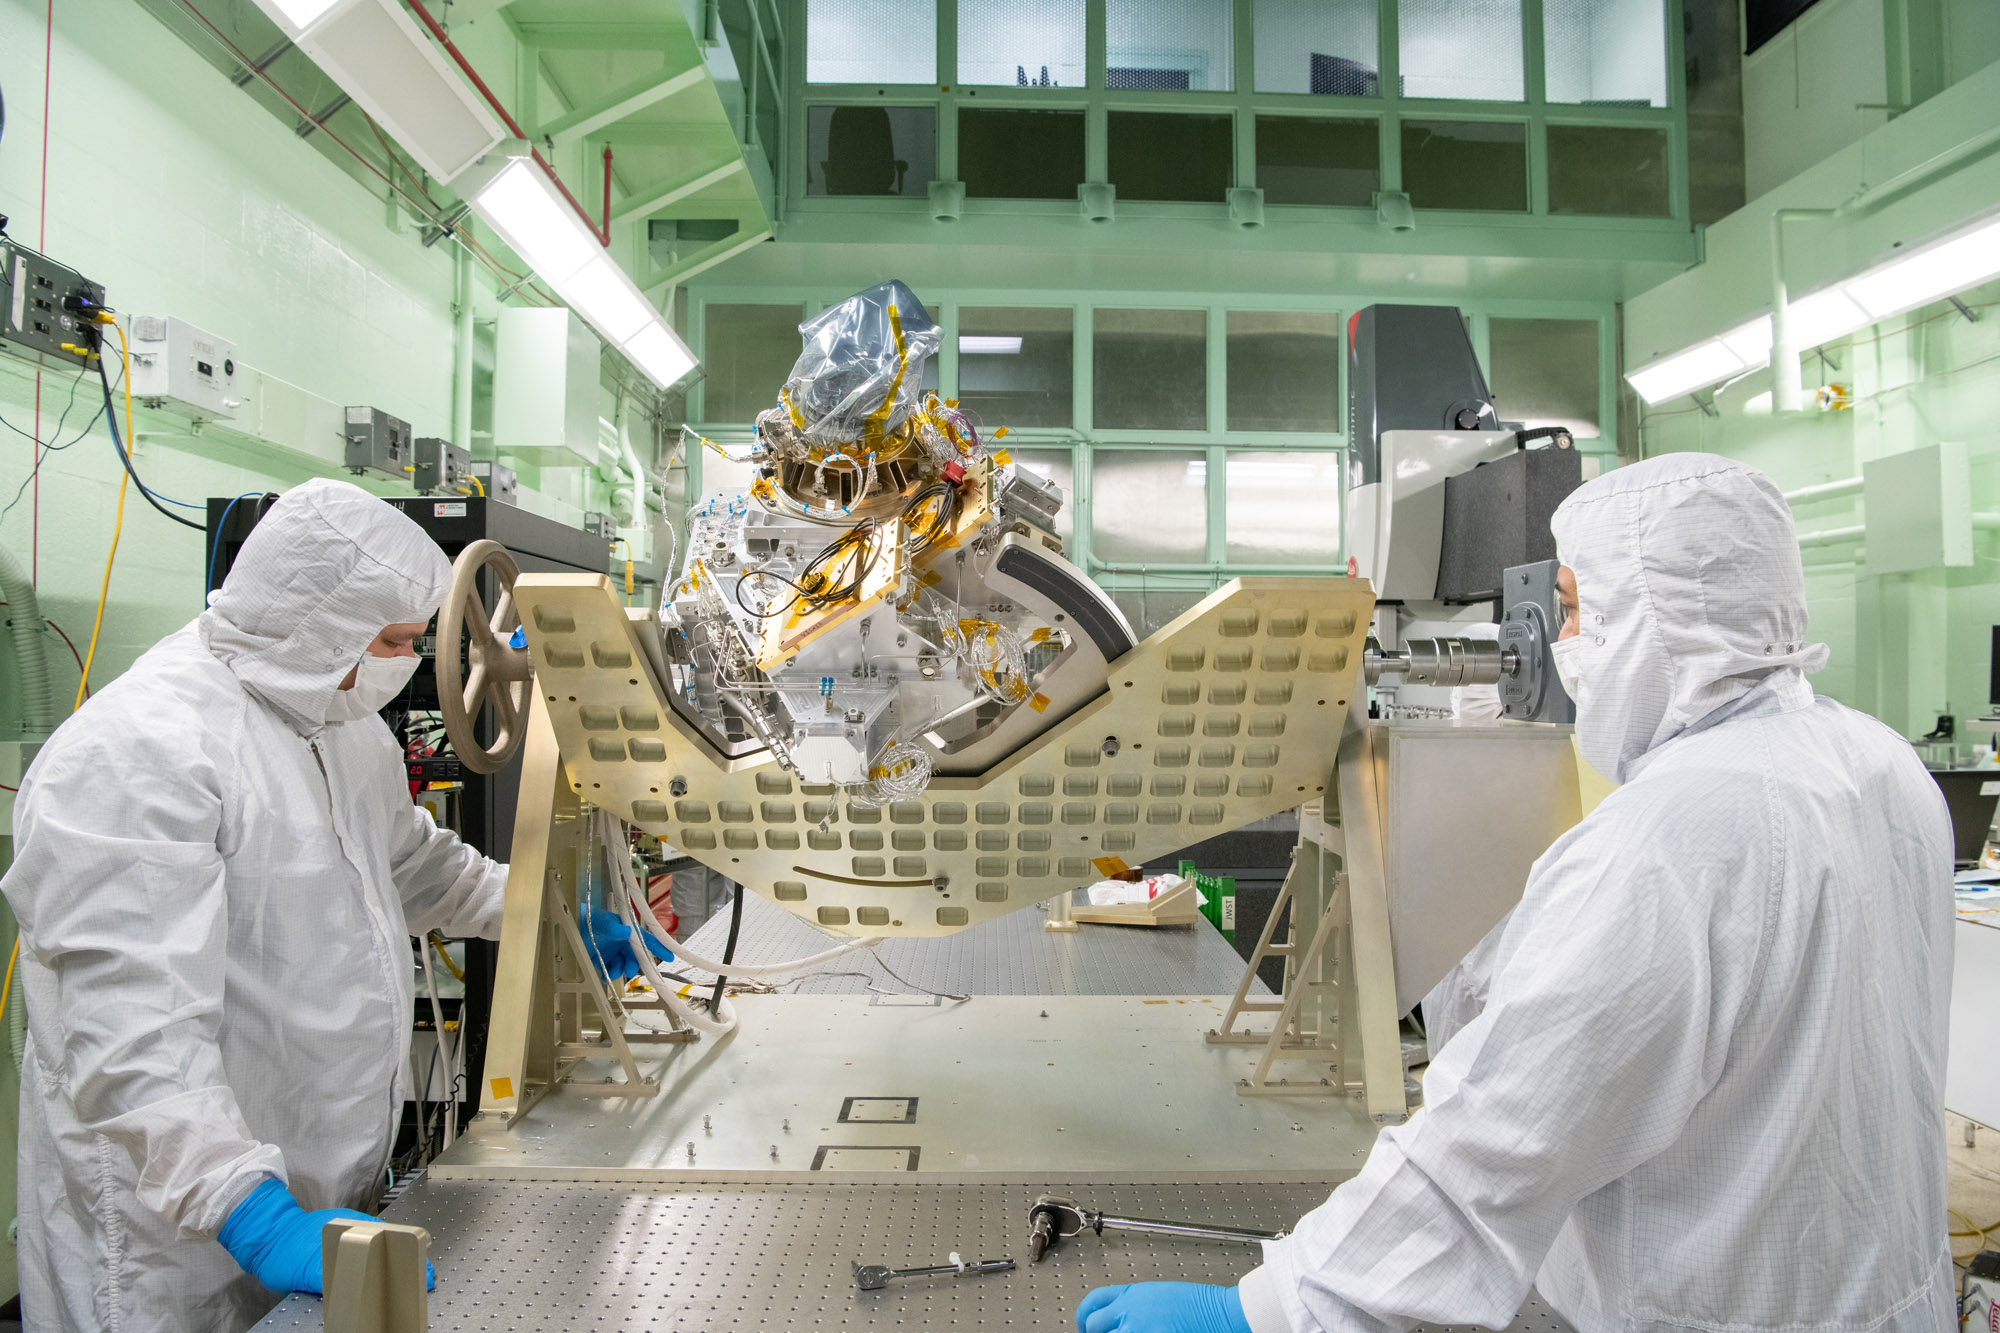
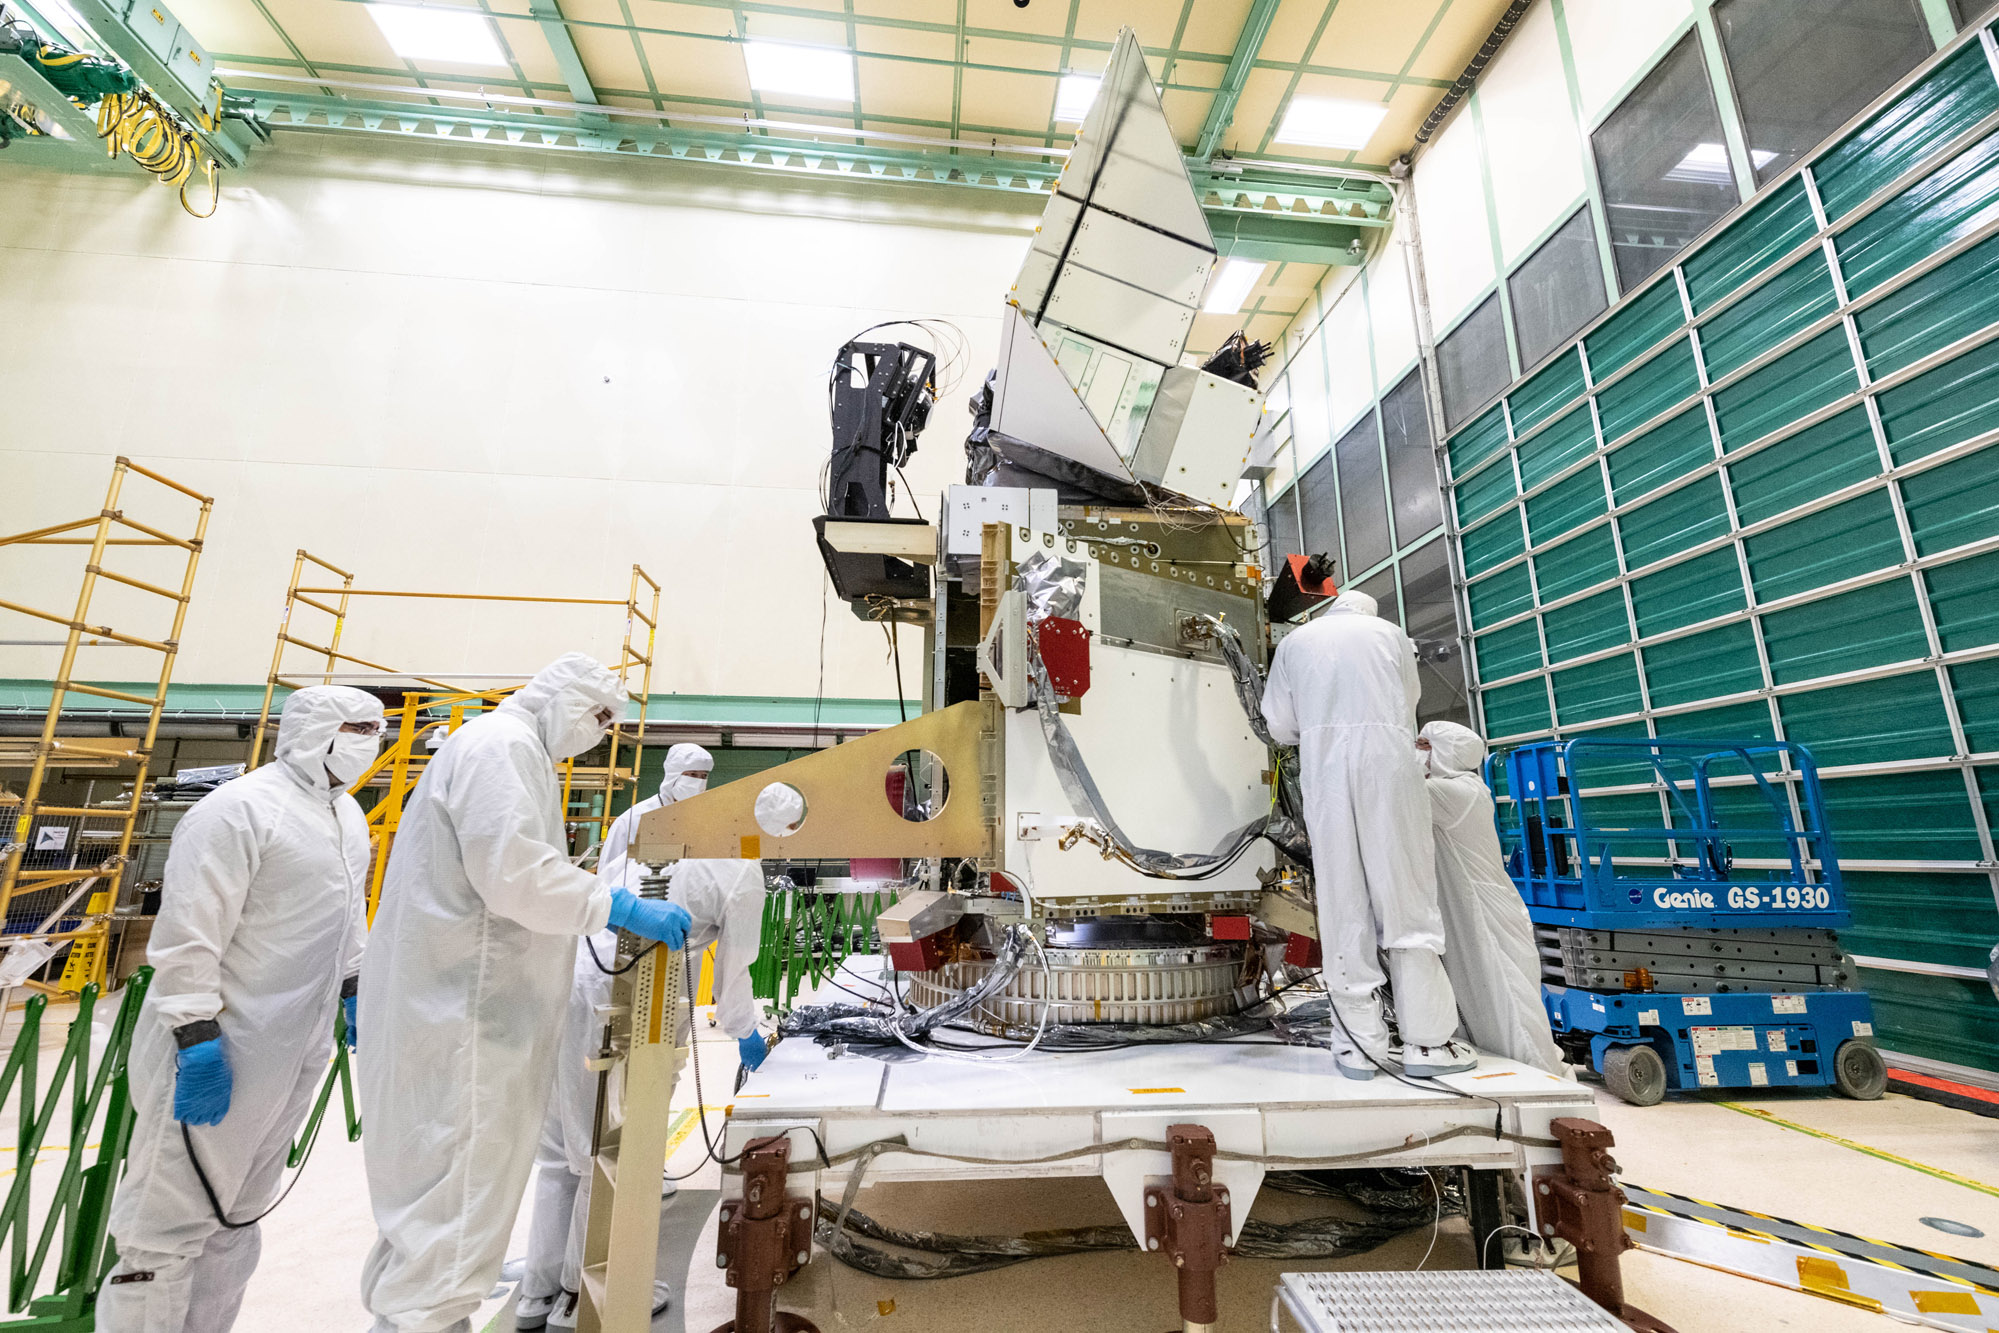
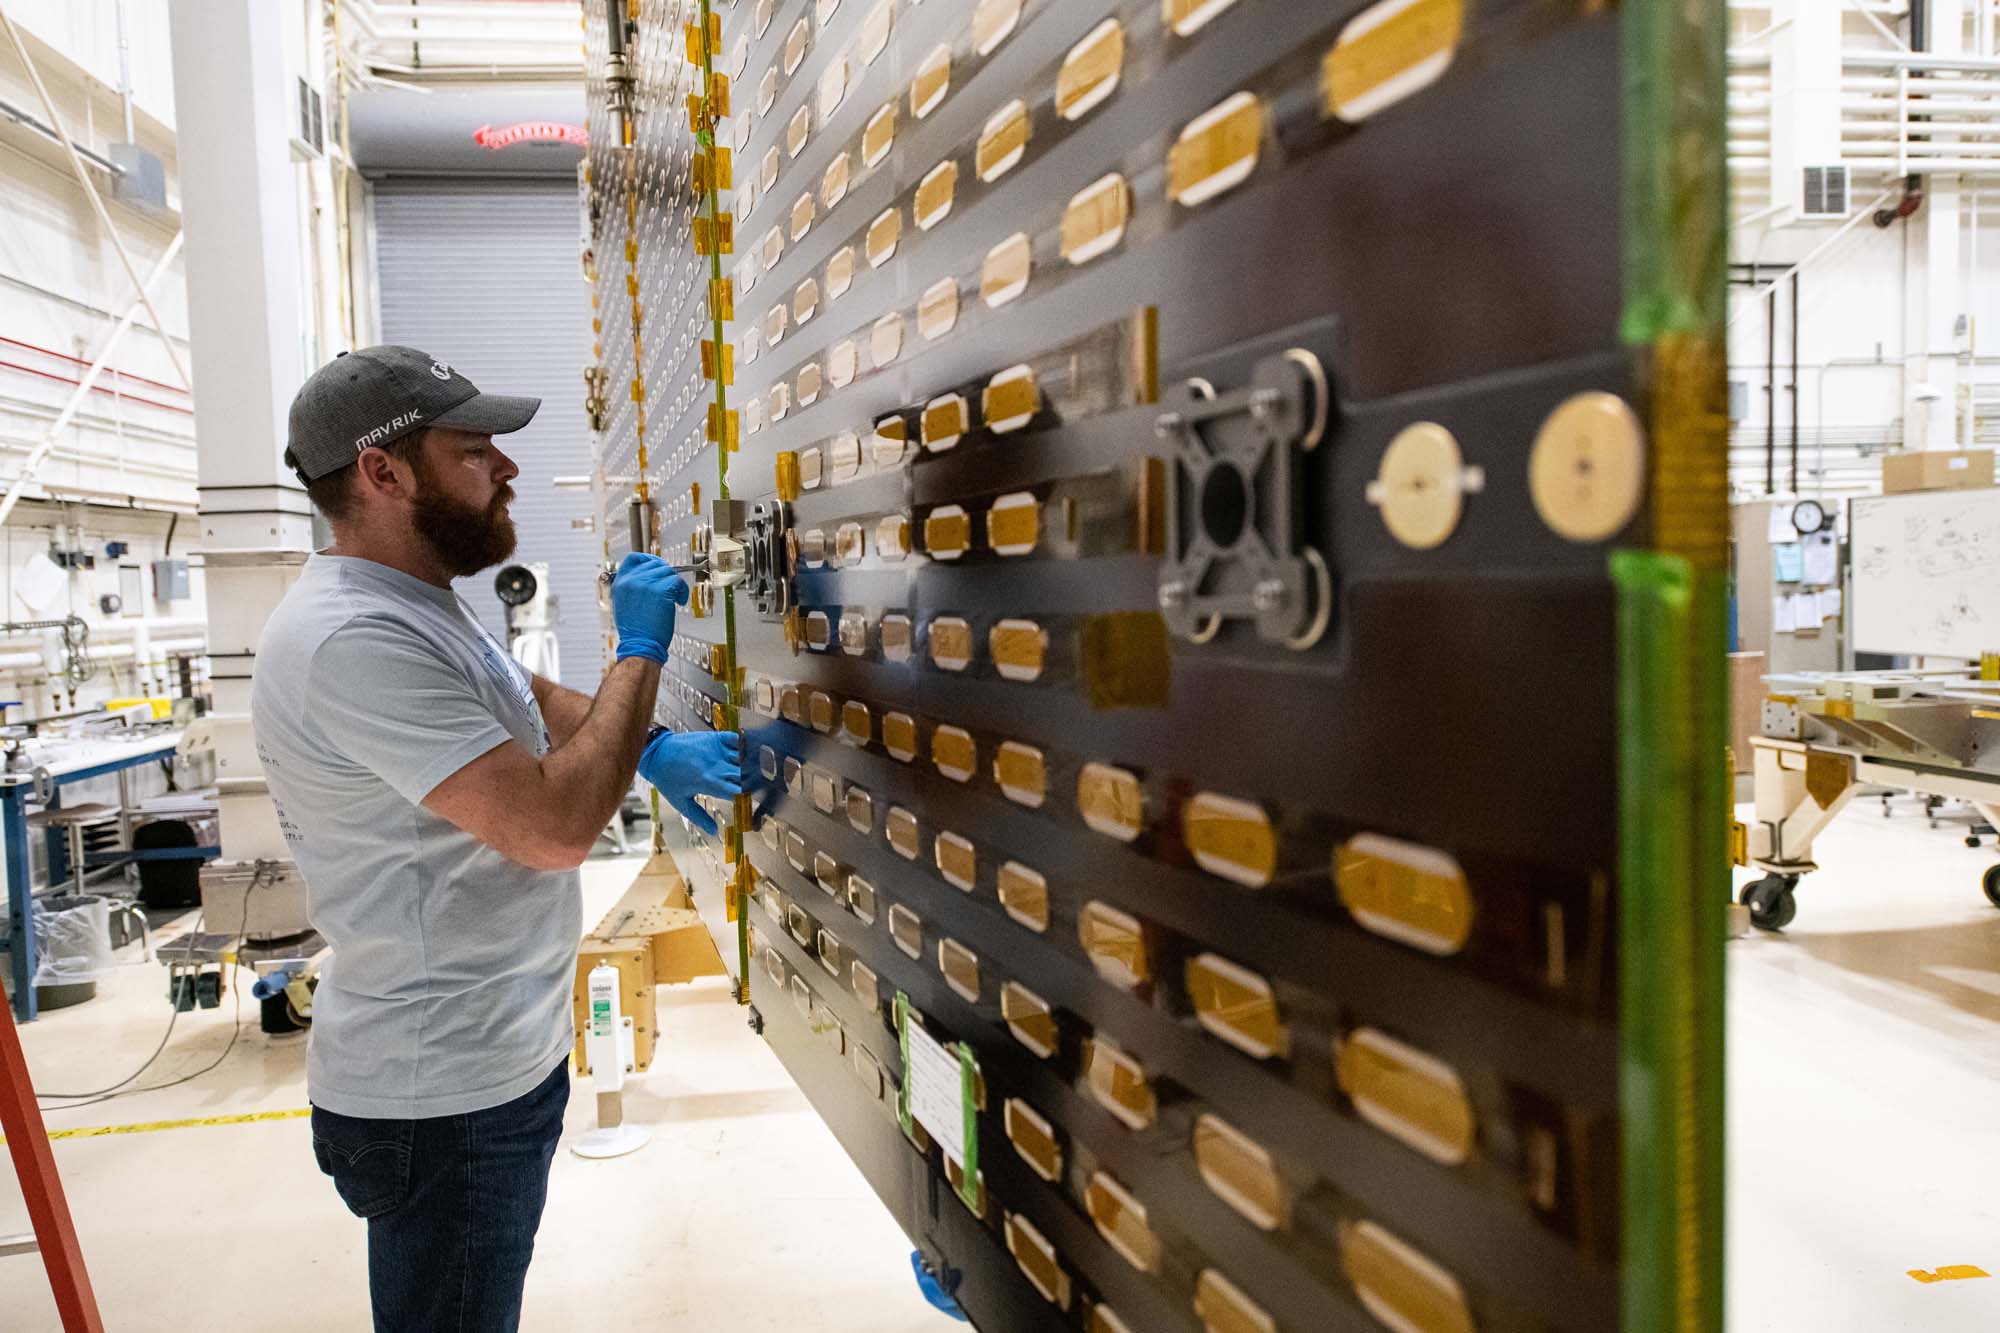
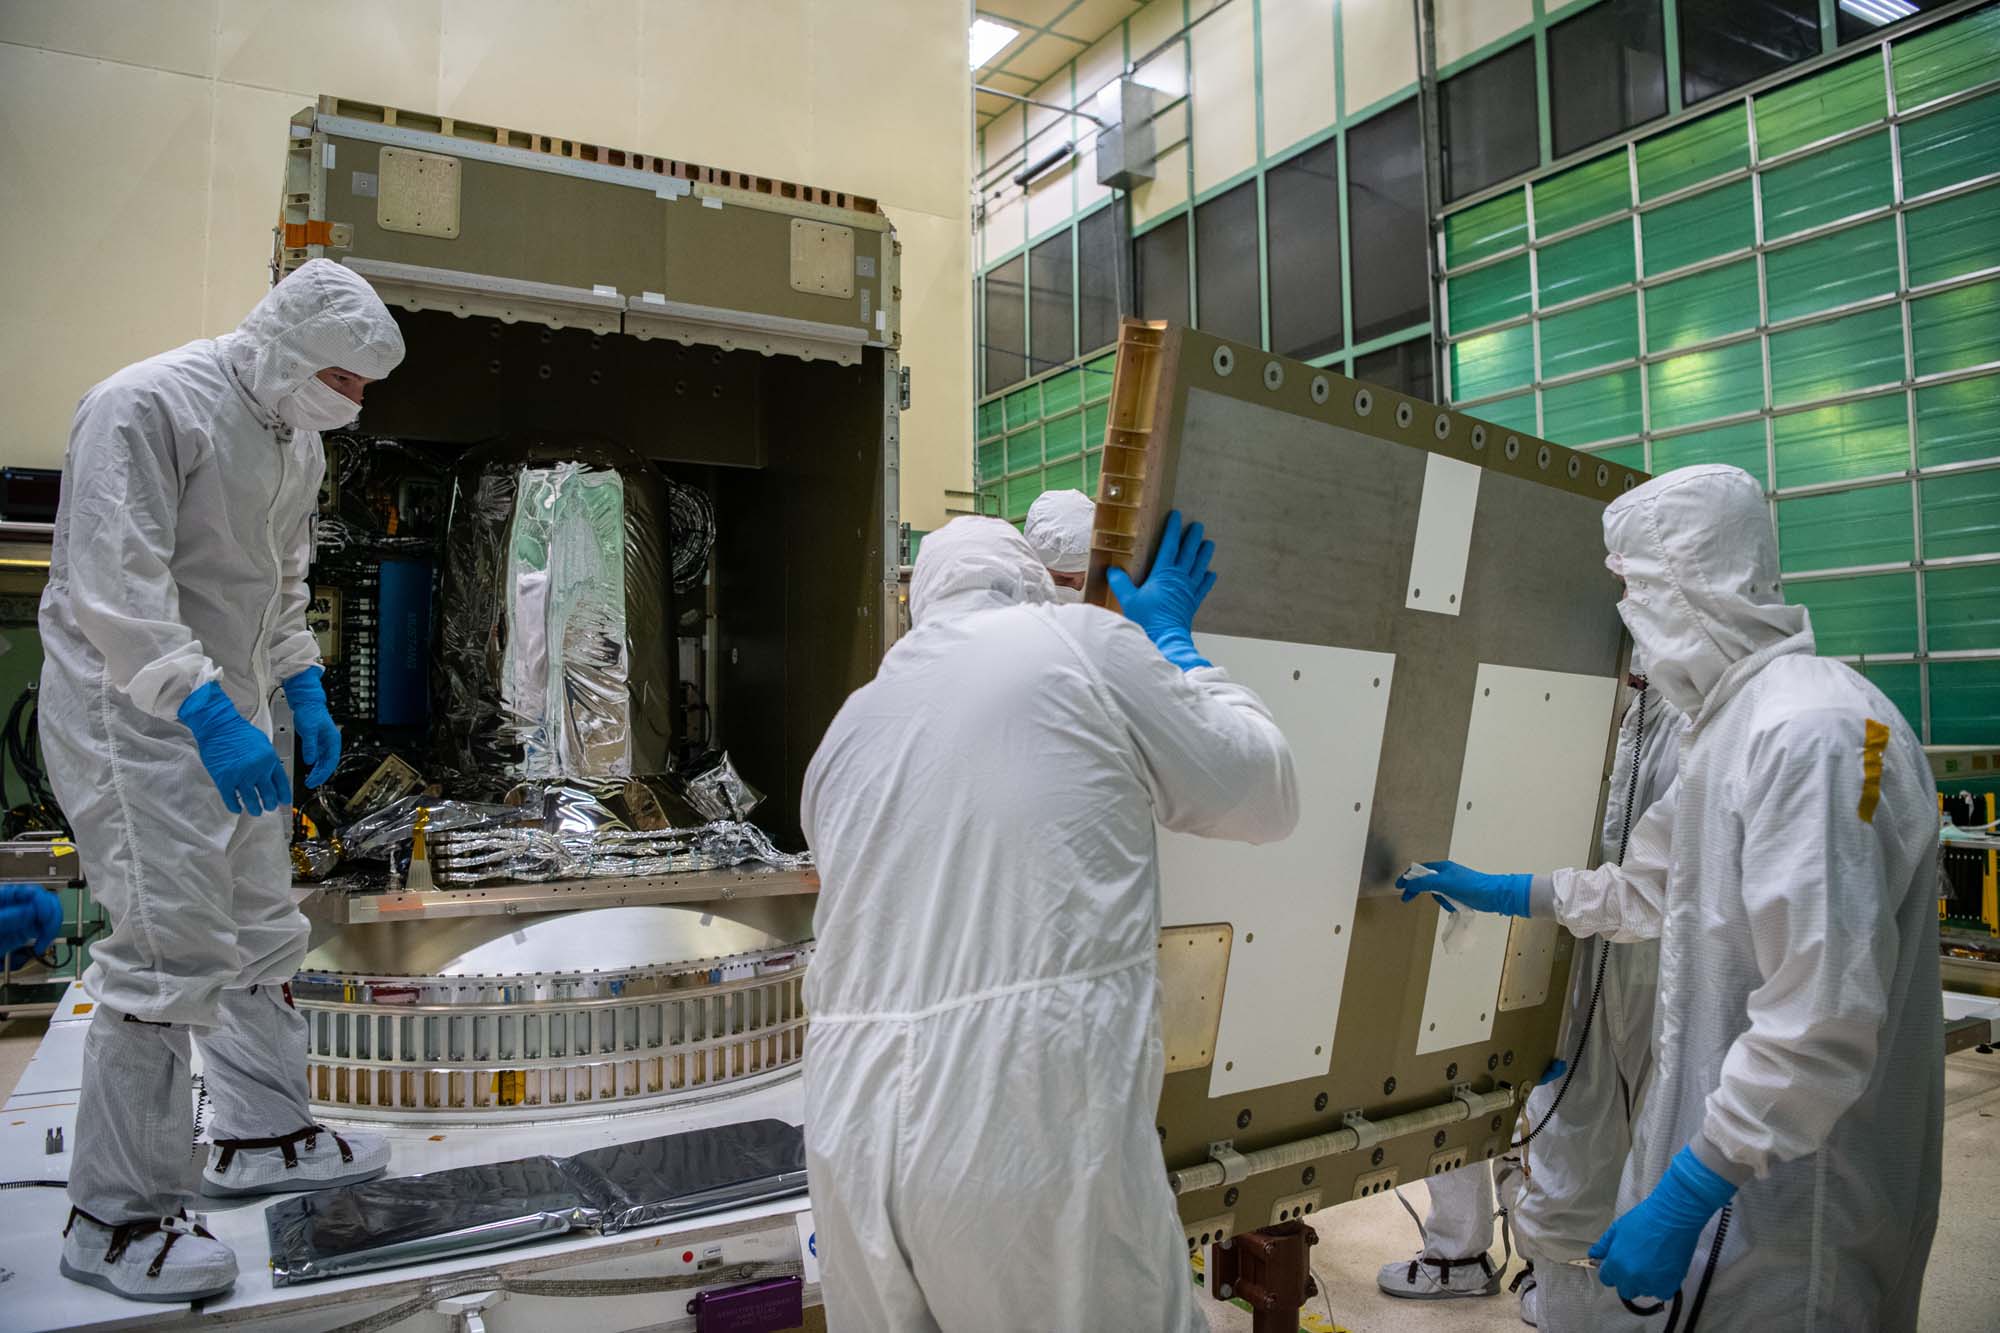
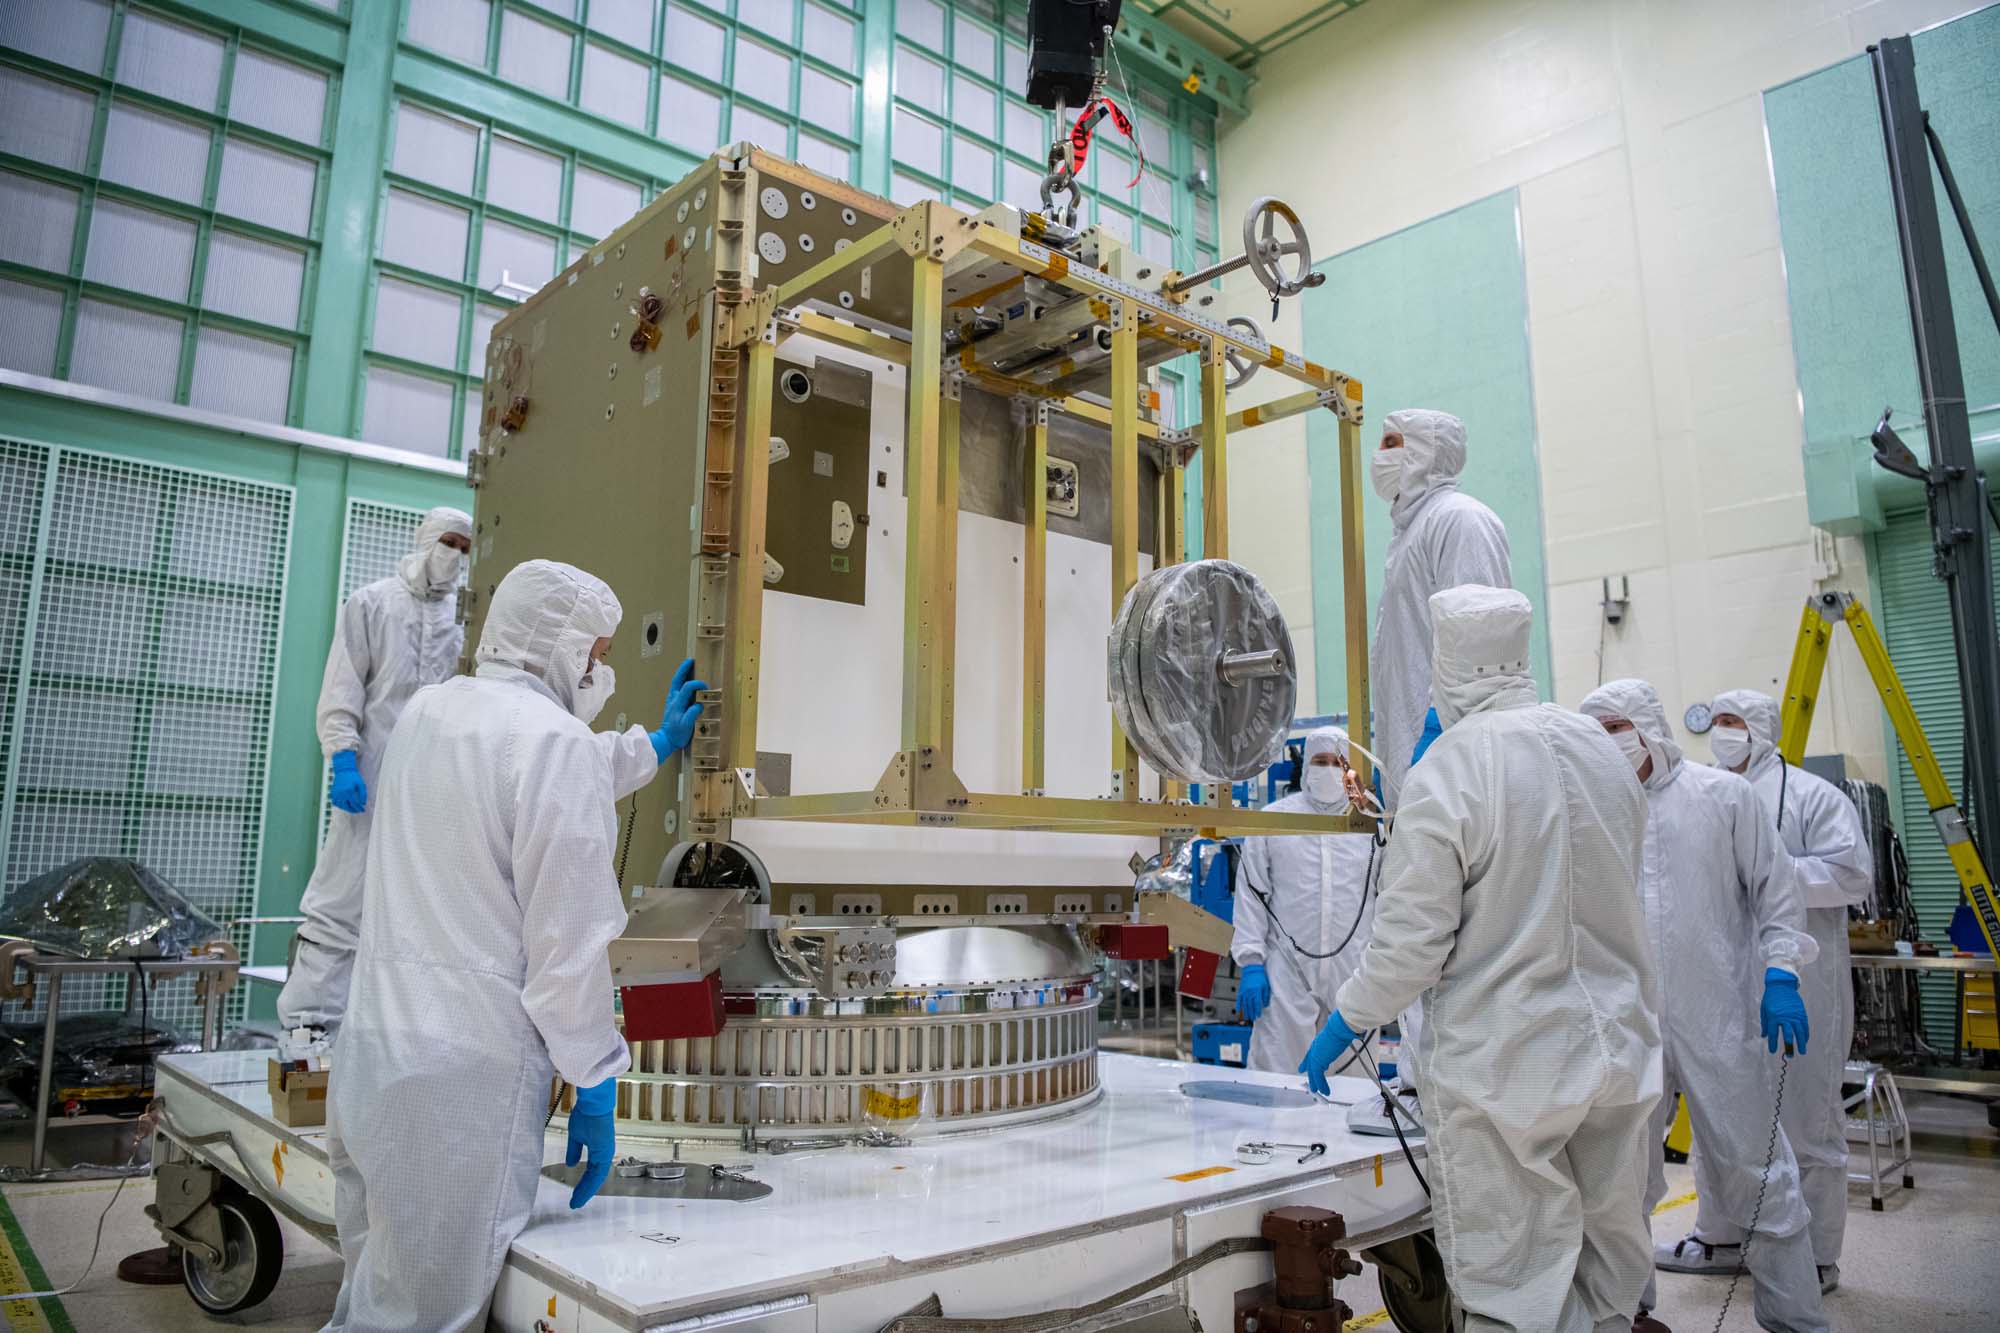
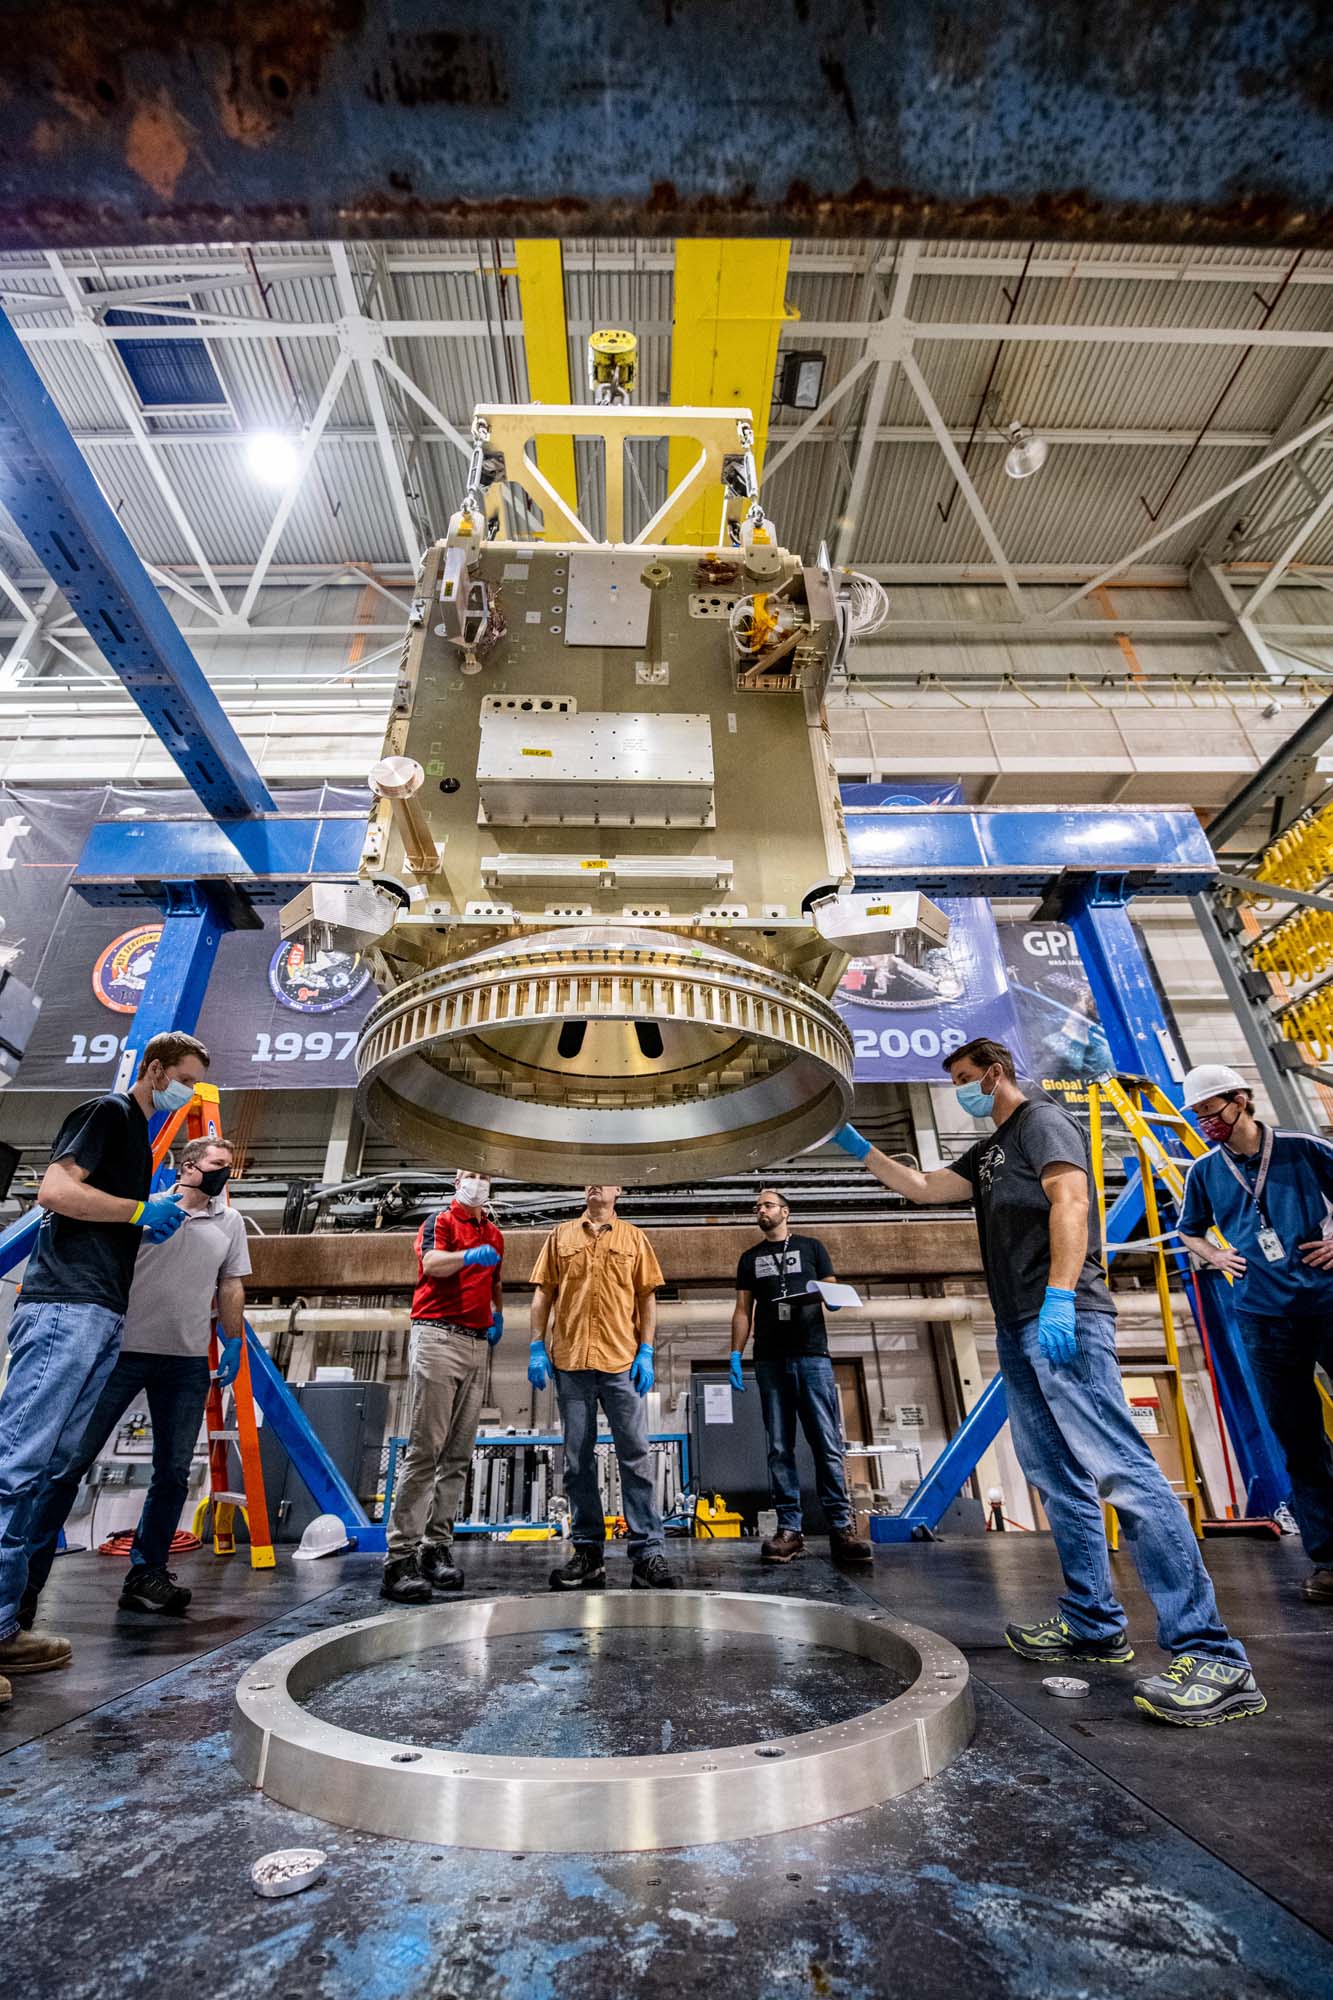
Quality engineer Luiz Mendez observes mechanical technician Tyere Garner remove bolts before lifting the Ocean Color Instrument from Tilt Mechanism to its ground support fixture. Credit: Henry, Dennis (Denny)
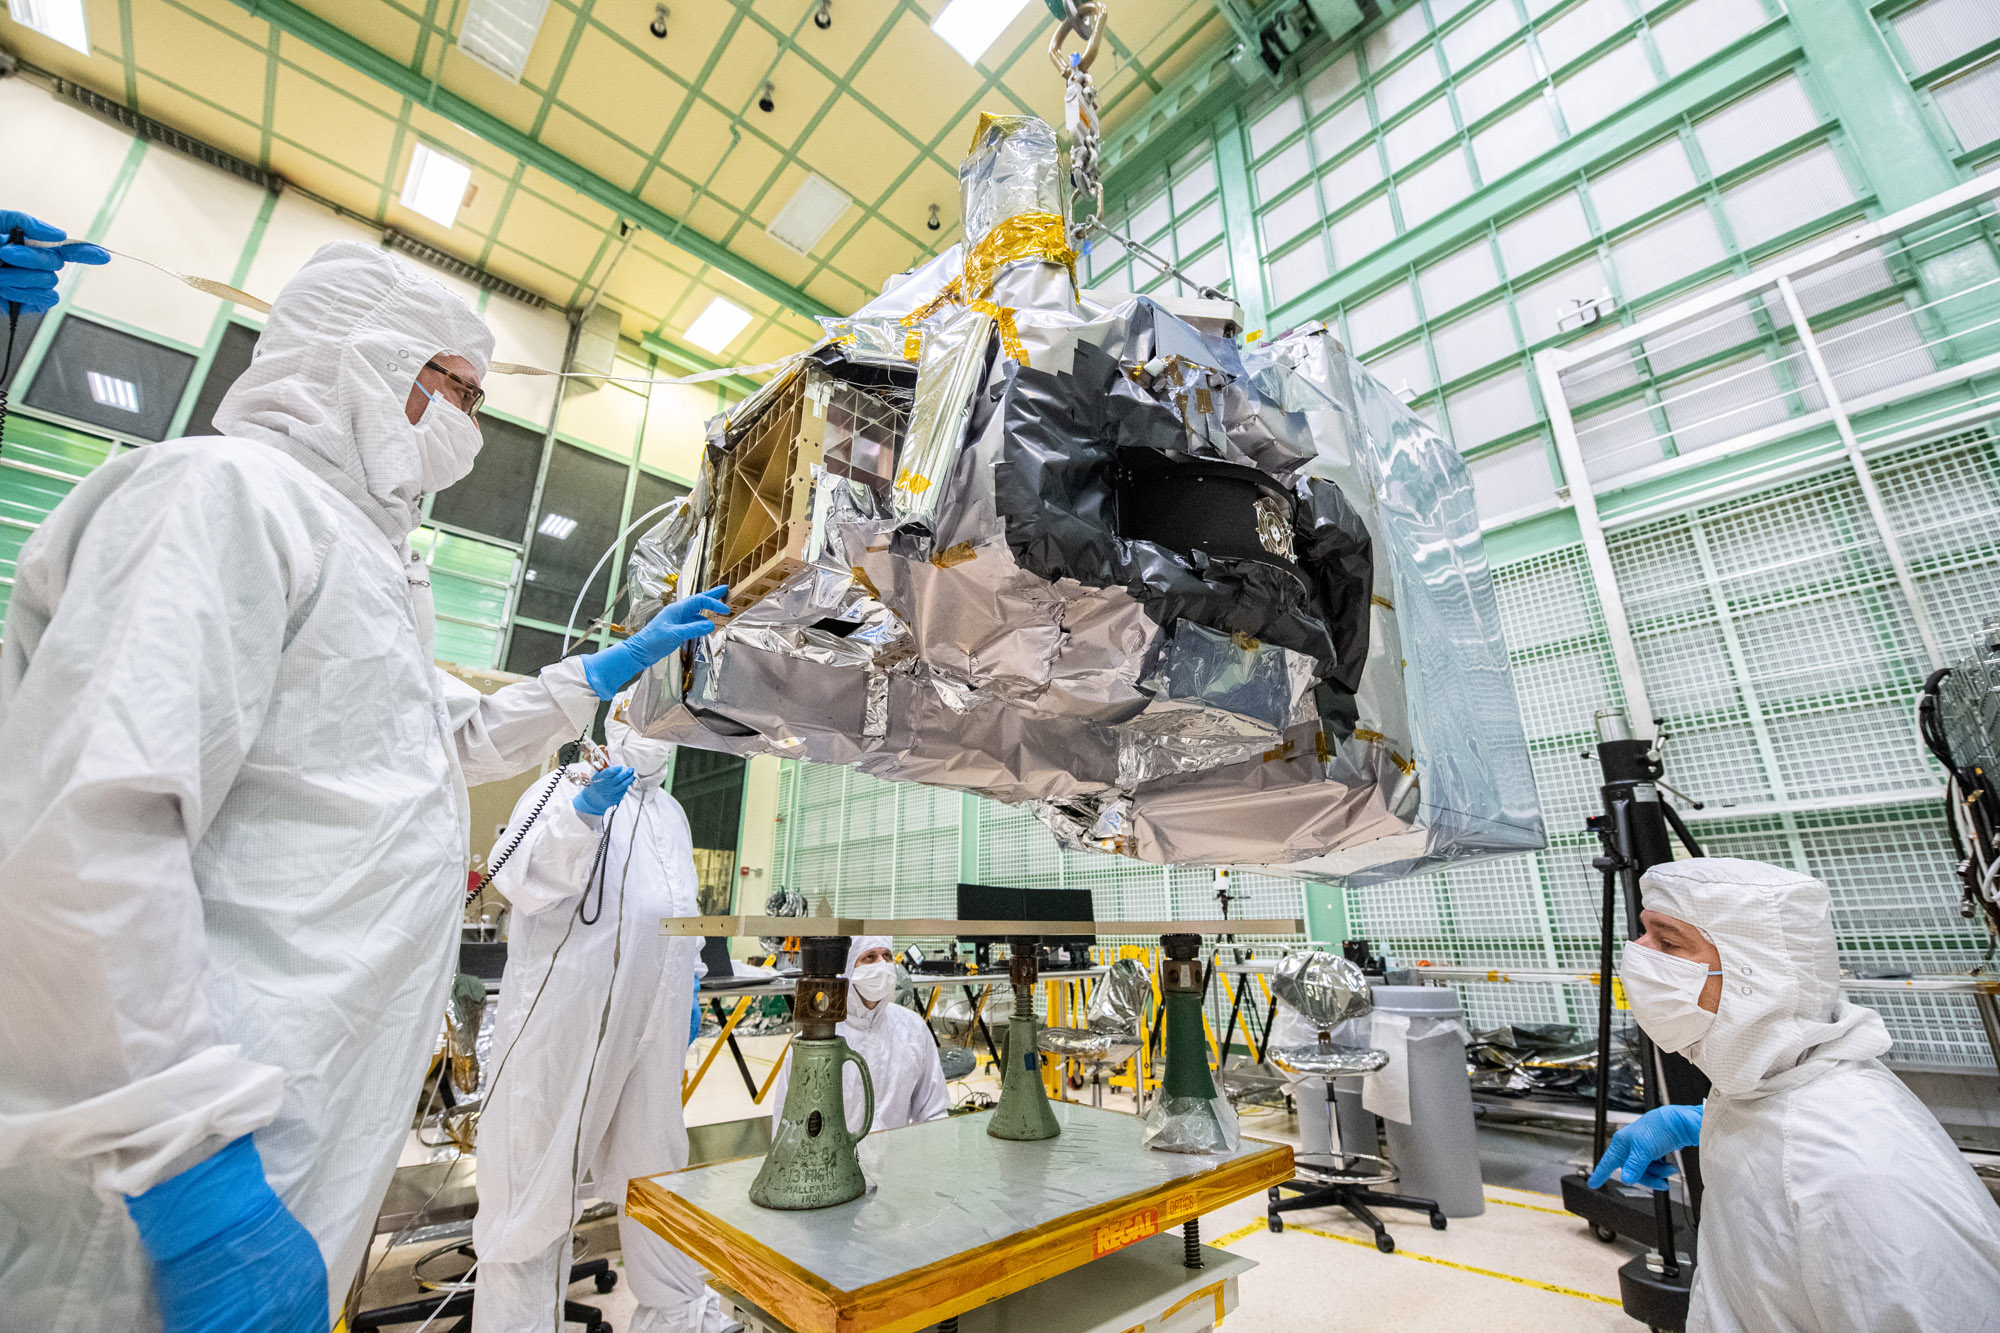
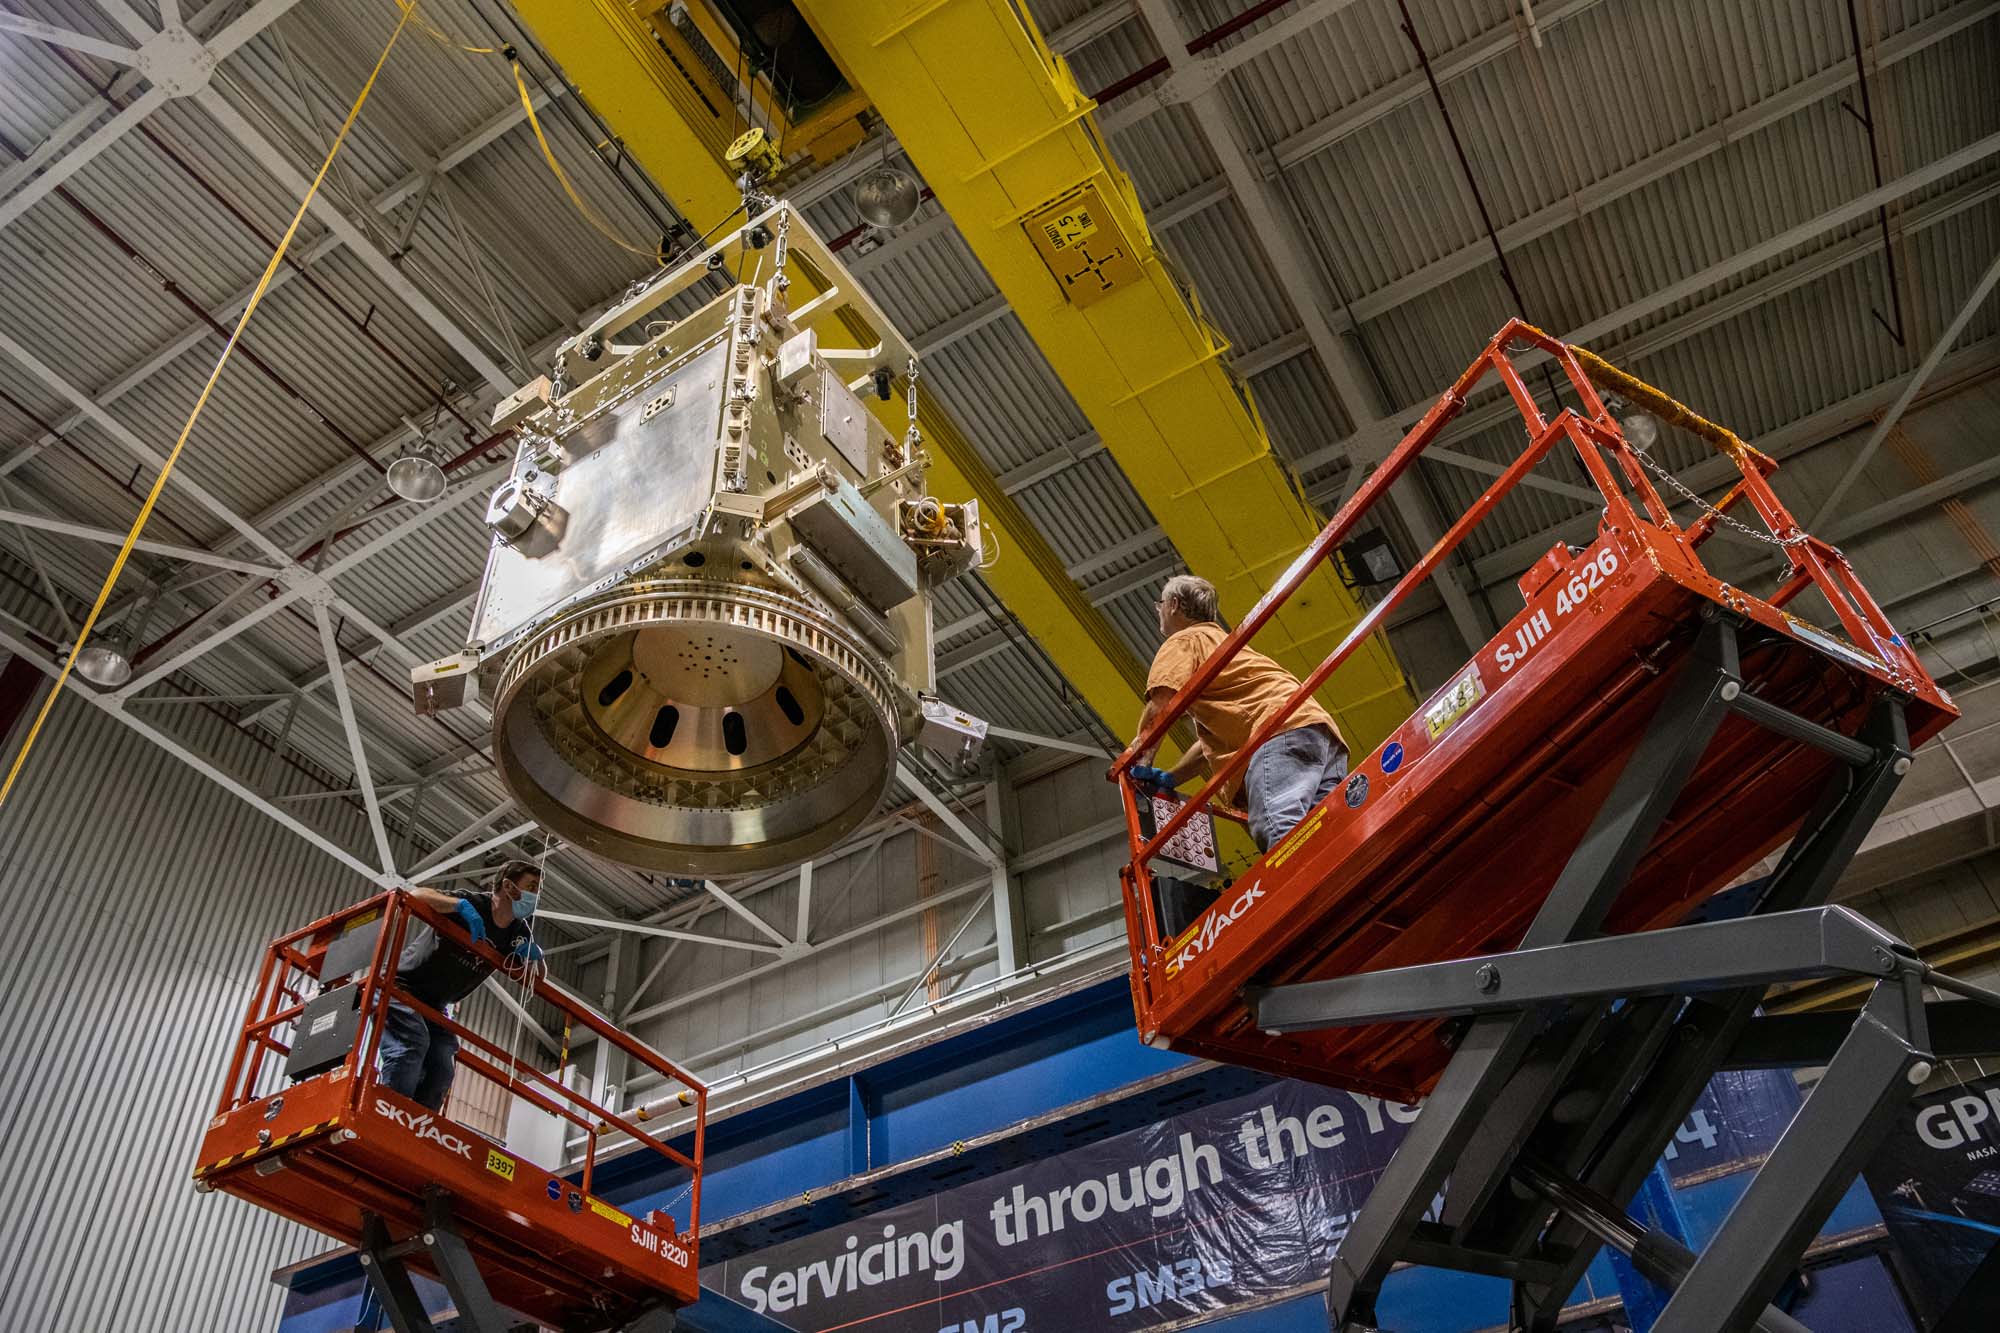
Mechanical technicians crane lift the Ocean Color Instrument from the Multi-purpose Ground Support Equipment (GSE) fixture. Credit: Henry, Dennis (Denny)
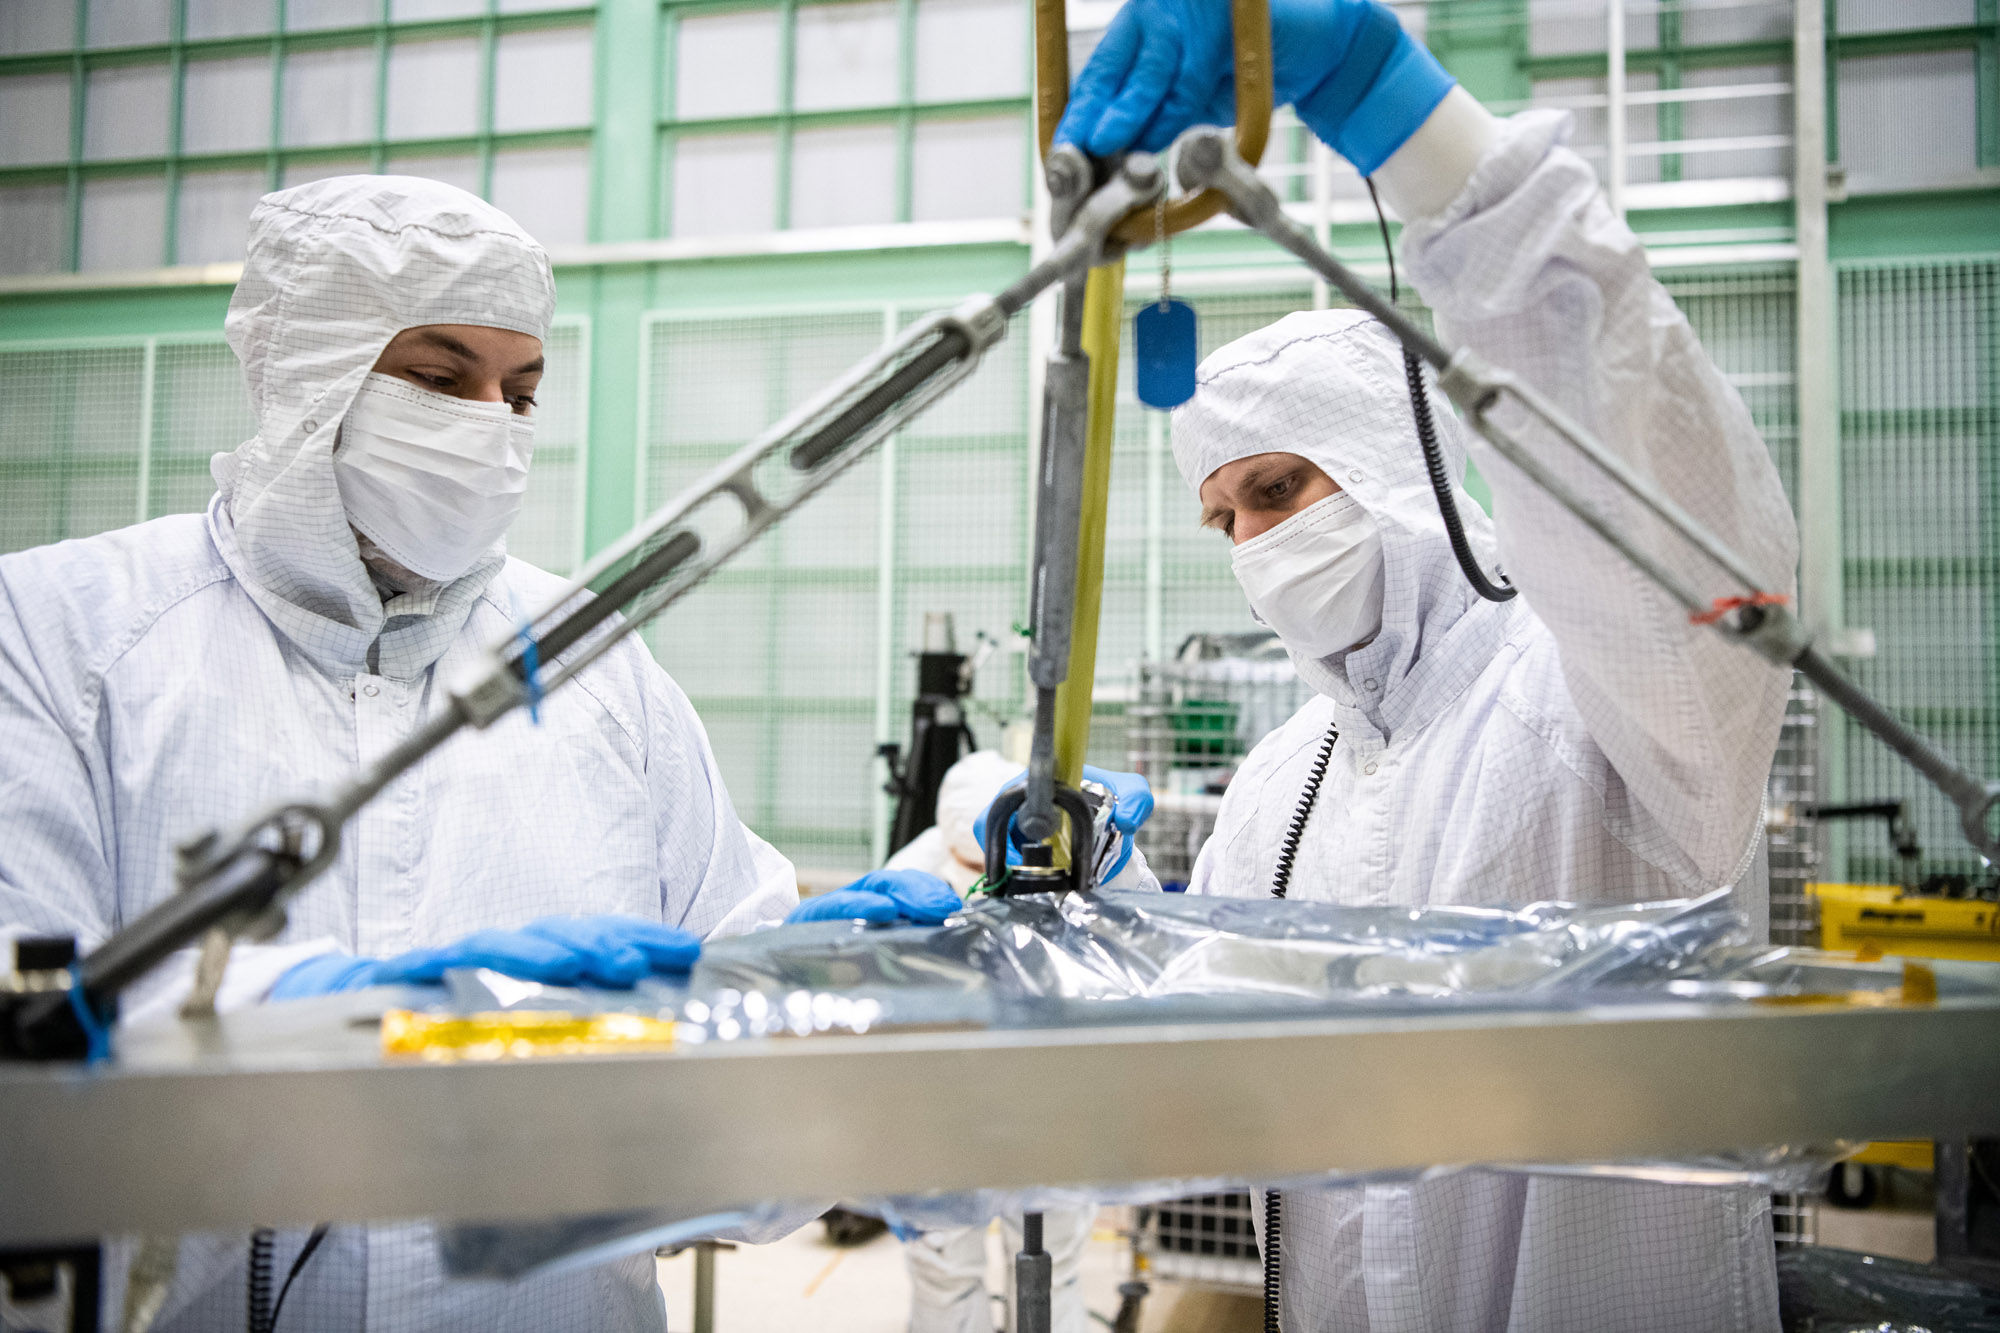
Mechanical engineer, Eduardo Rodriguez, and Mechanical Technician, Joe Eddy, prepare the vertical lift sling to crane lift the Ocean Color Instrument. Credit: Henry, Dennis (Denny)
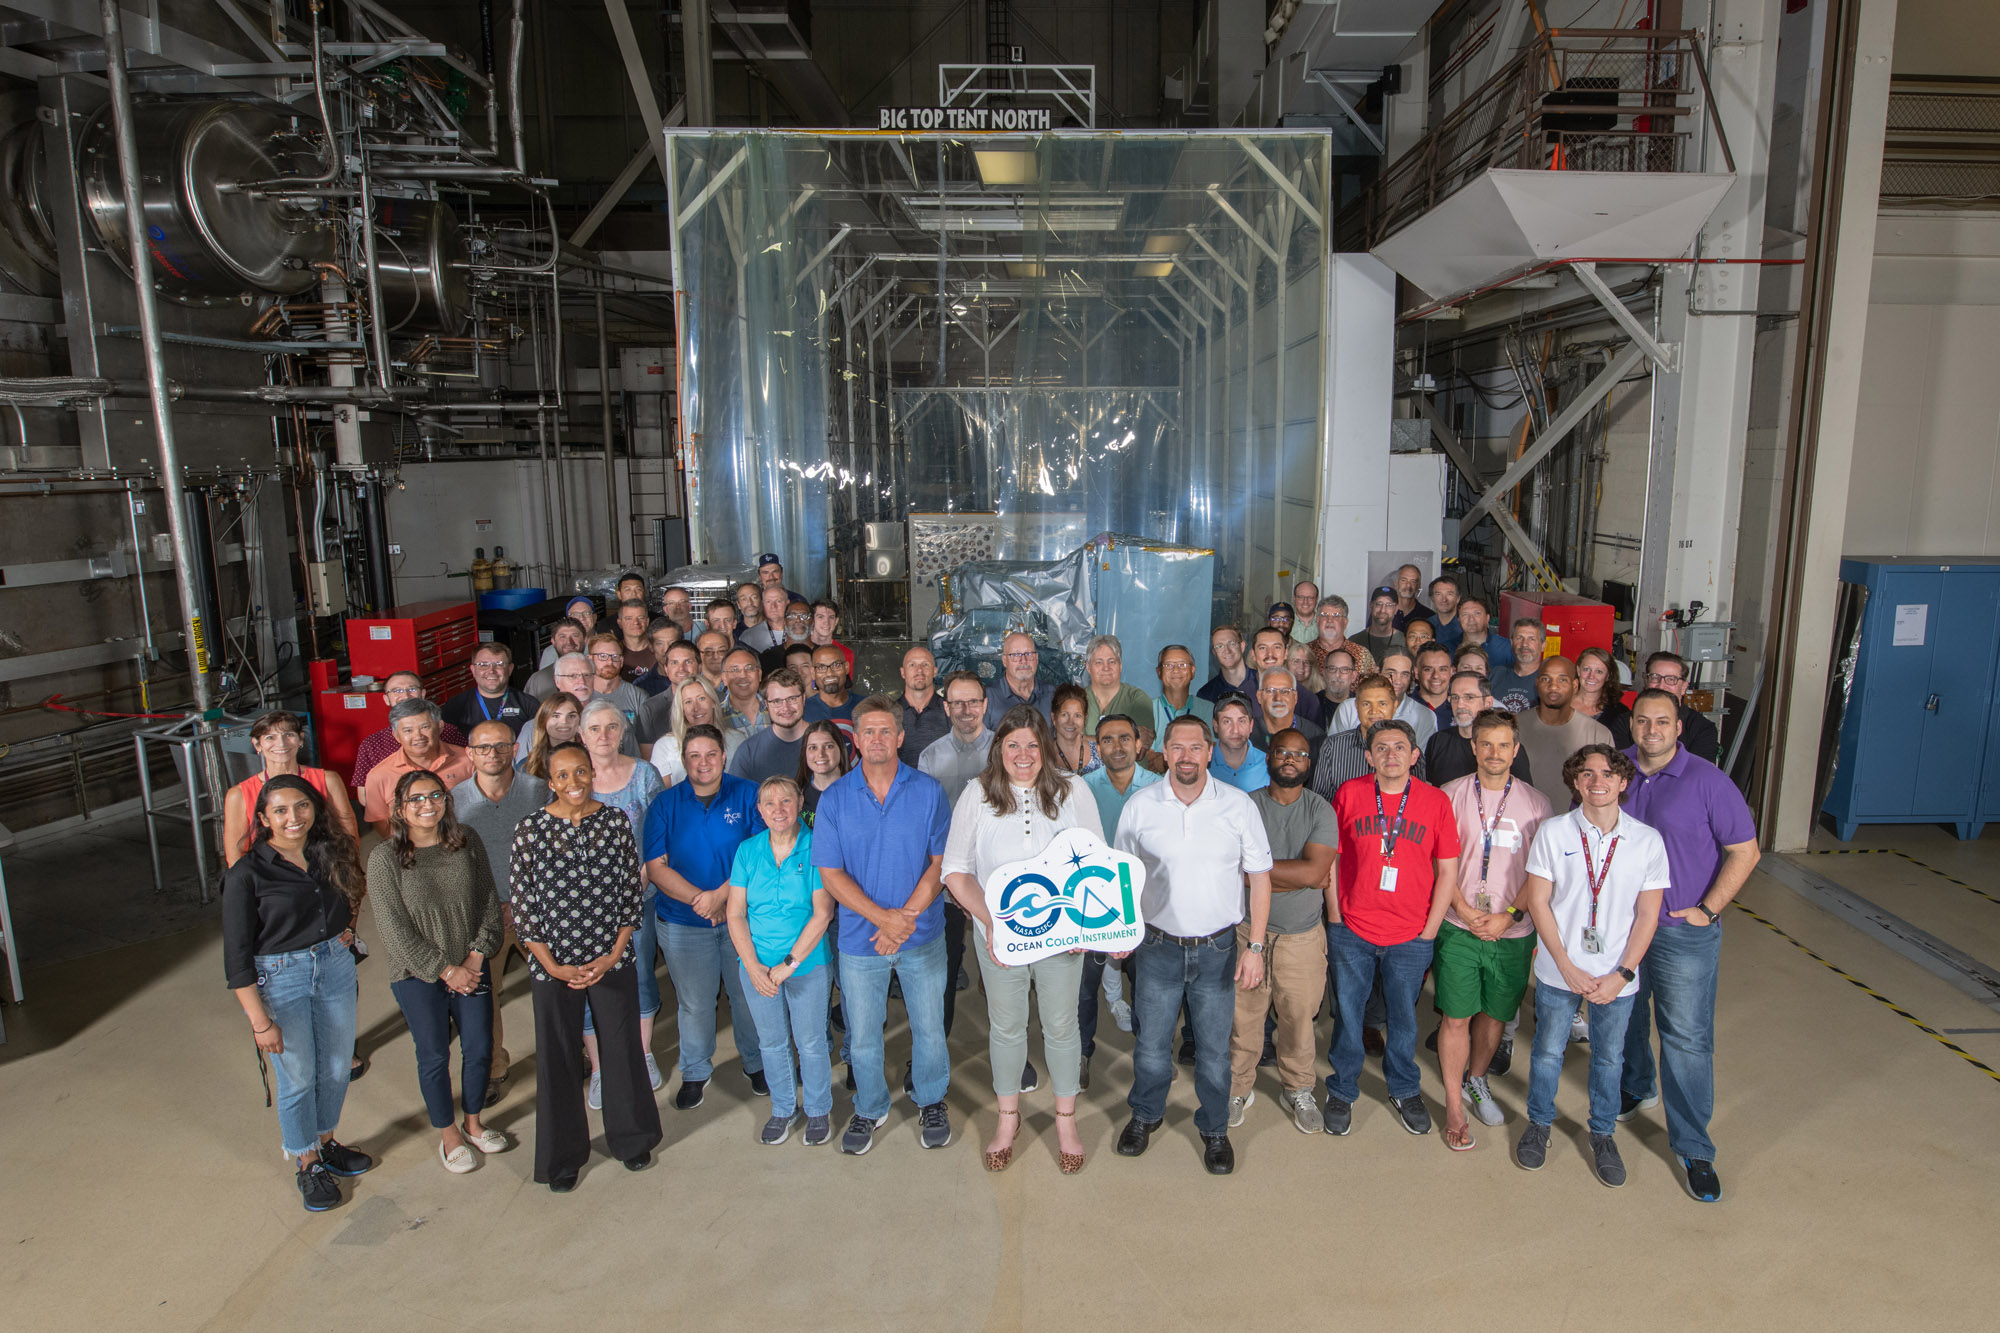
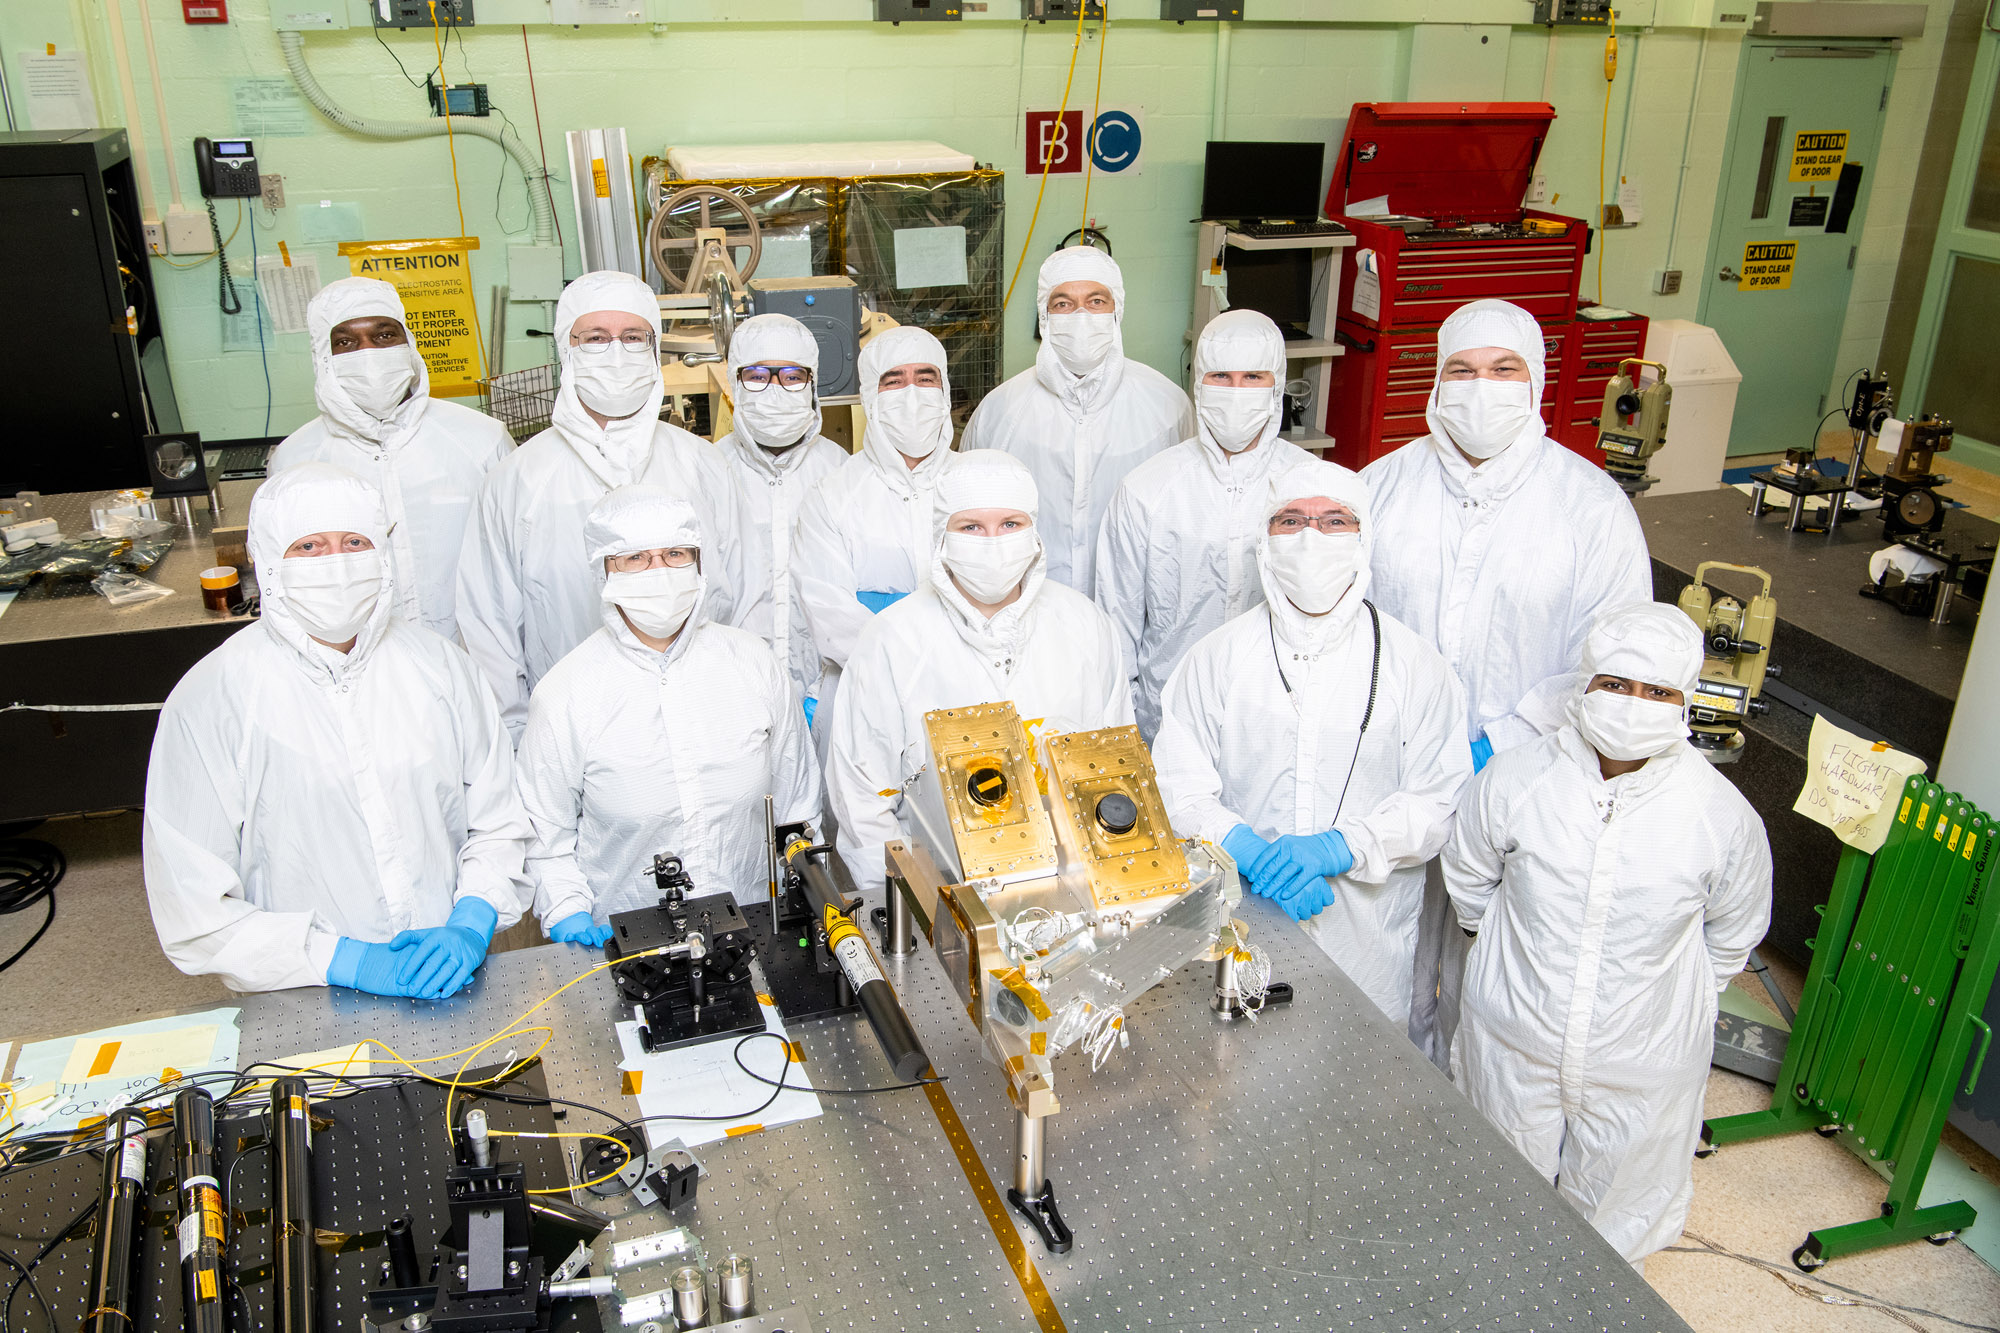
Ocean Color Instrument Team poses with the flight instrument behind them in a cleanroom tent on August 4, 2022. Credit: Stover, Desiree
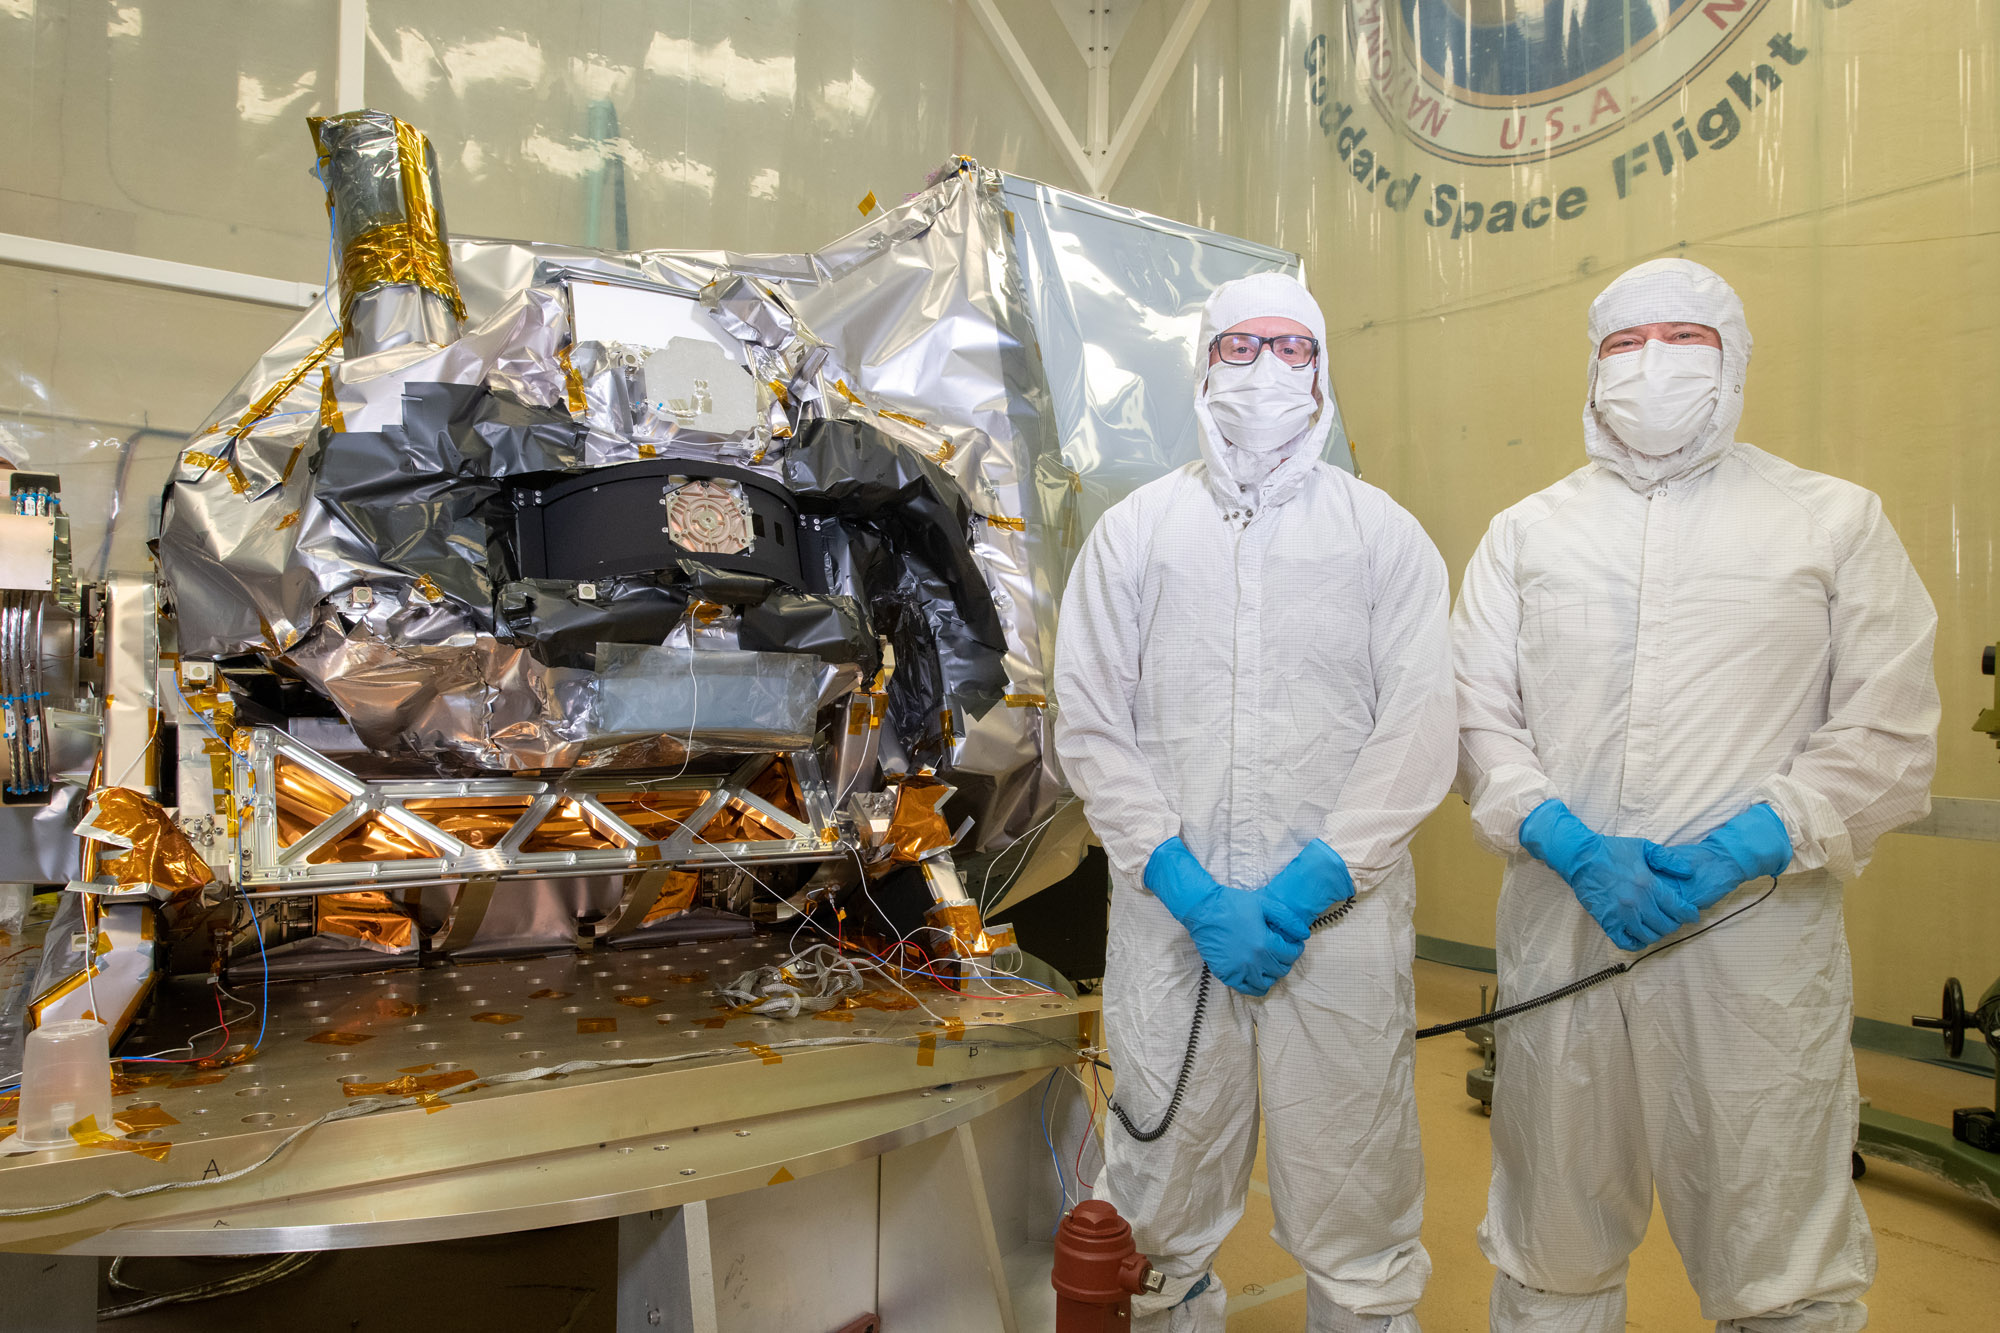
Eric Gorman & Robby Estep pose with the instrument and integrated earth shade and Tilt fixture in the acoustic chamber. Credit: Stover, Desiree
Ocean Color Instrument managers (Brian Clemons, Eric Gorman, Ulrik Gliese, Leland Chemerys, Joe Knuble, Robby Estep) pose with the instrument in the acoustic chamber. Credit: Stover, Desiree
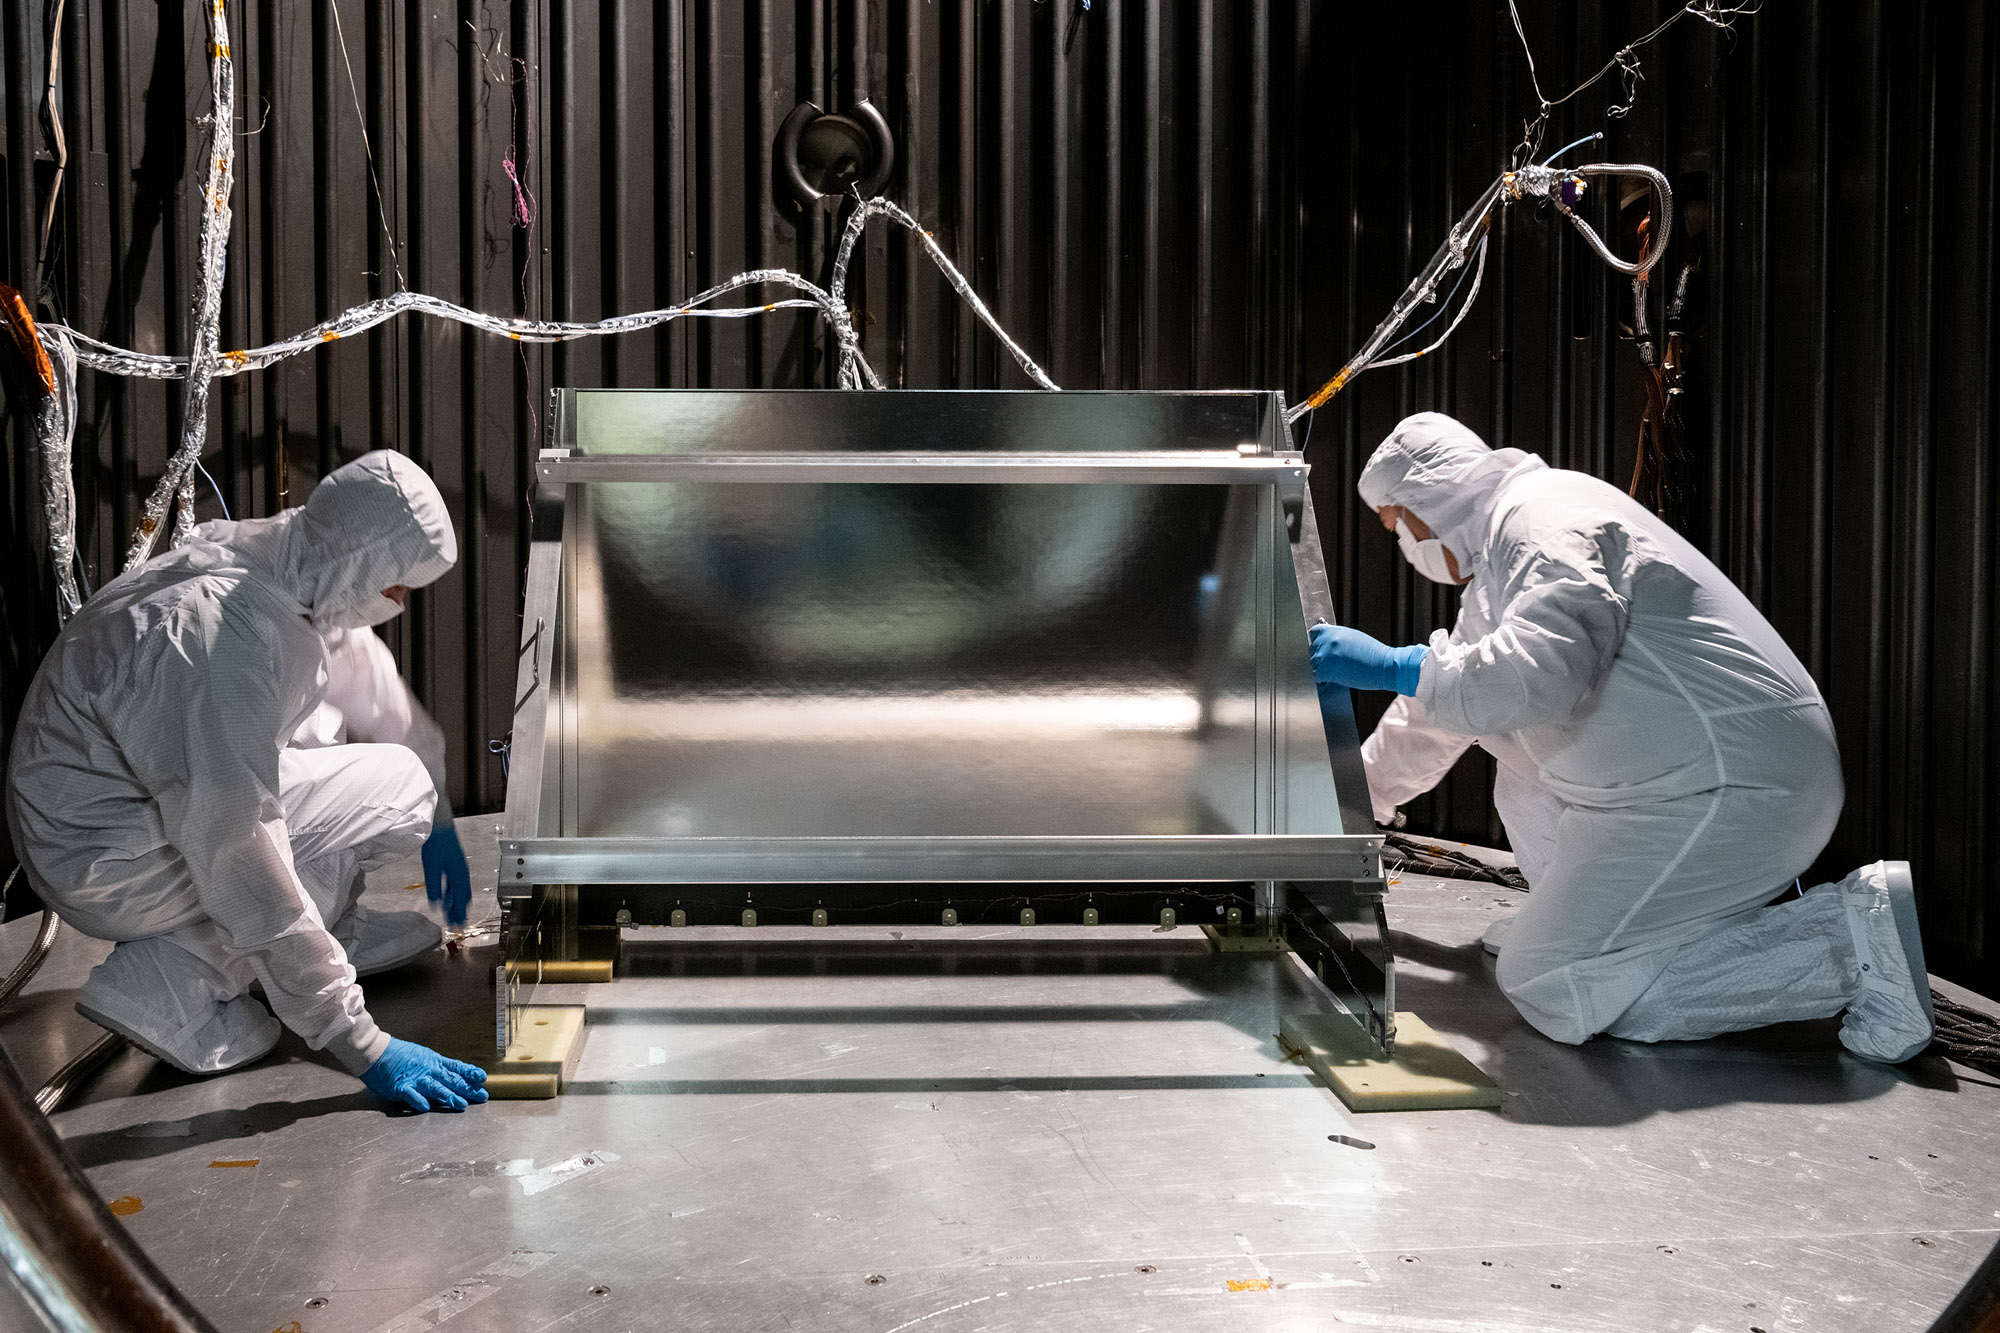
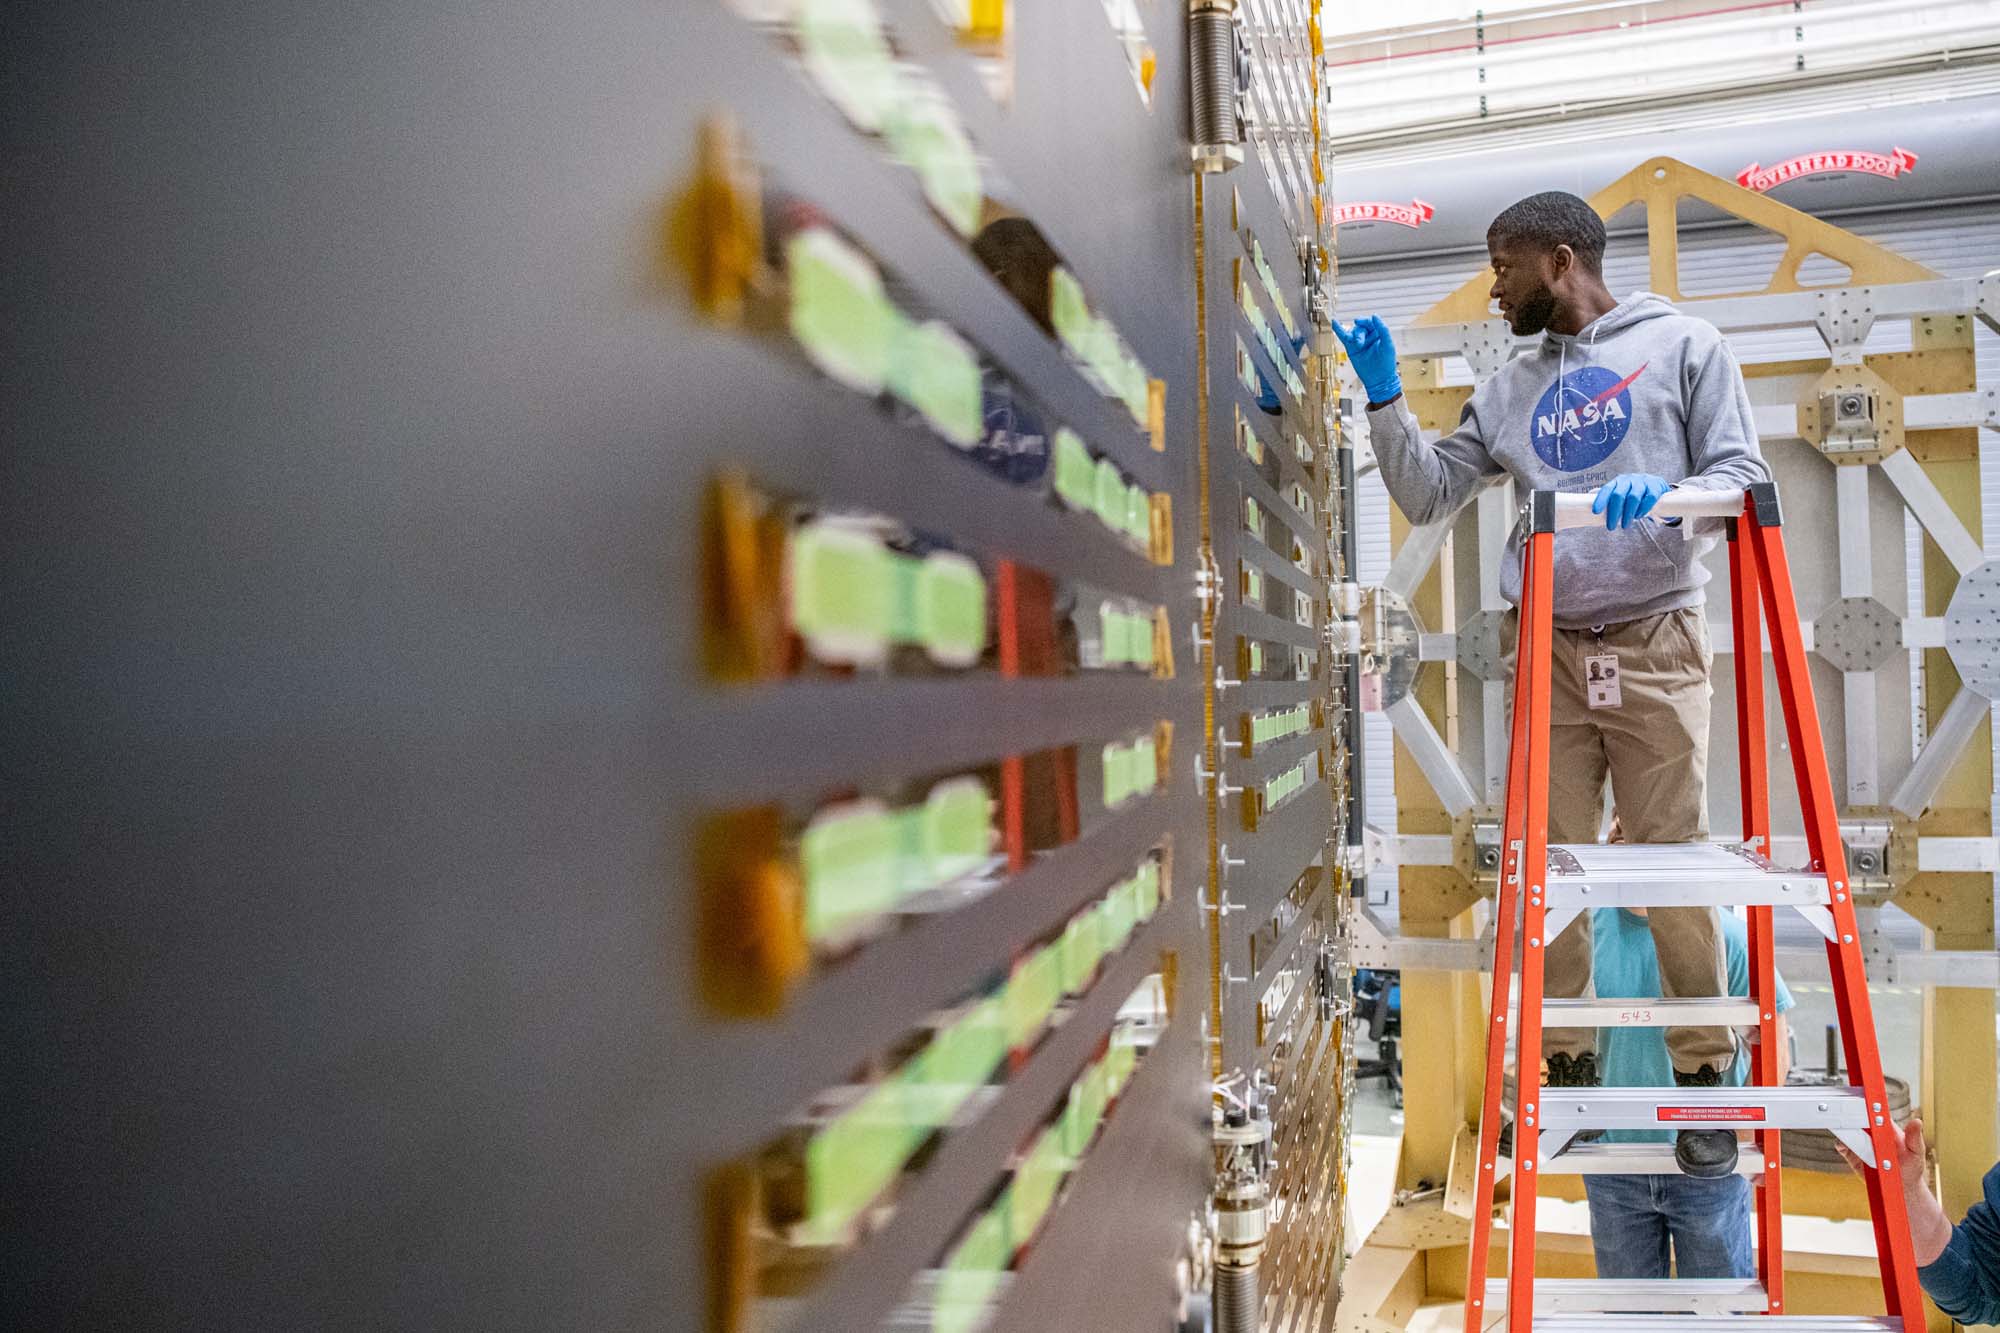
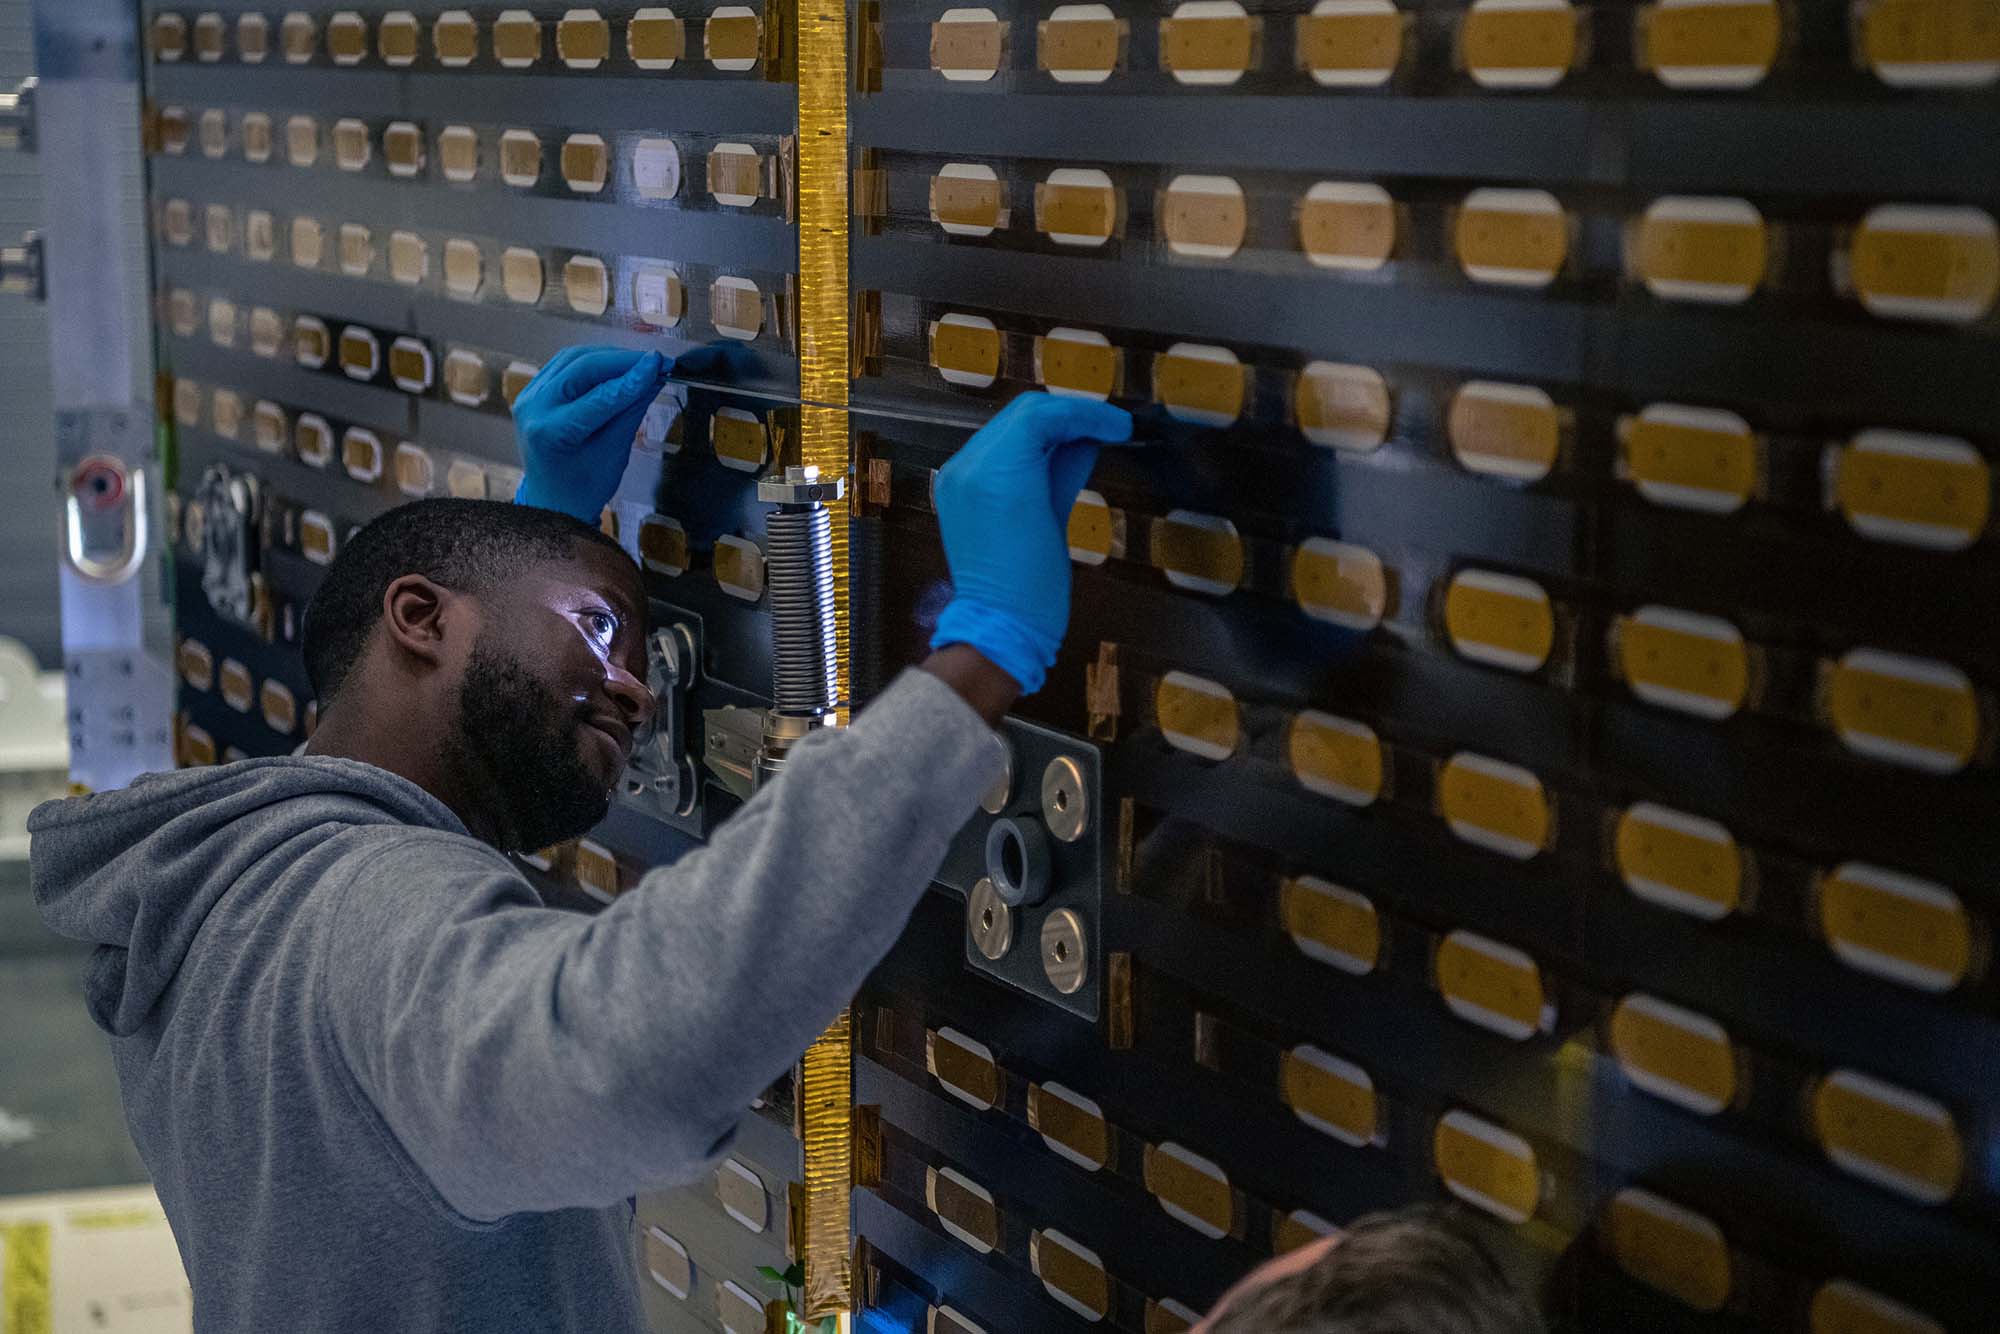
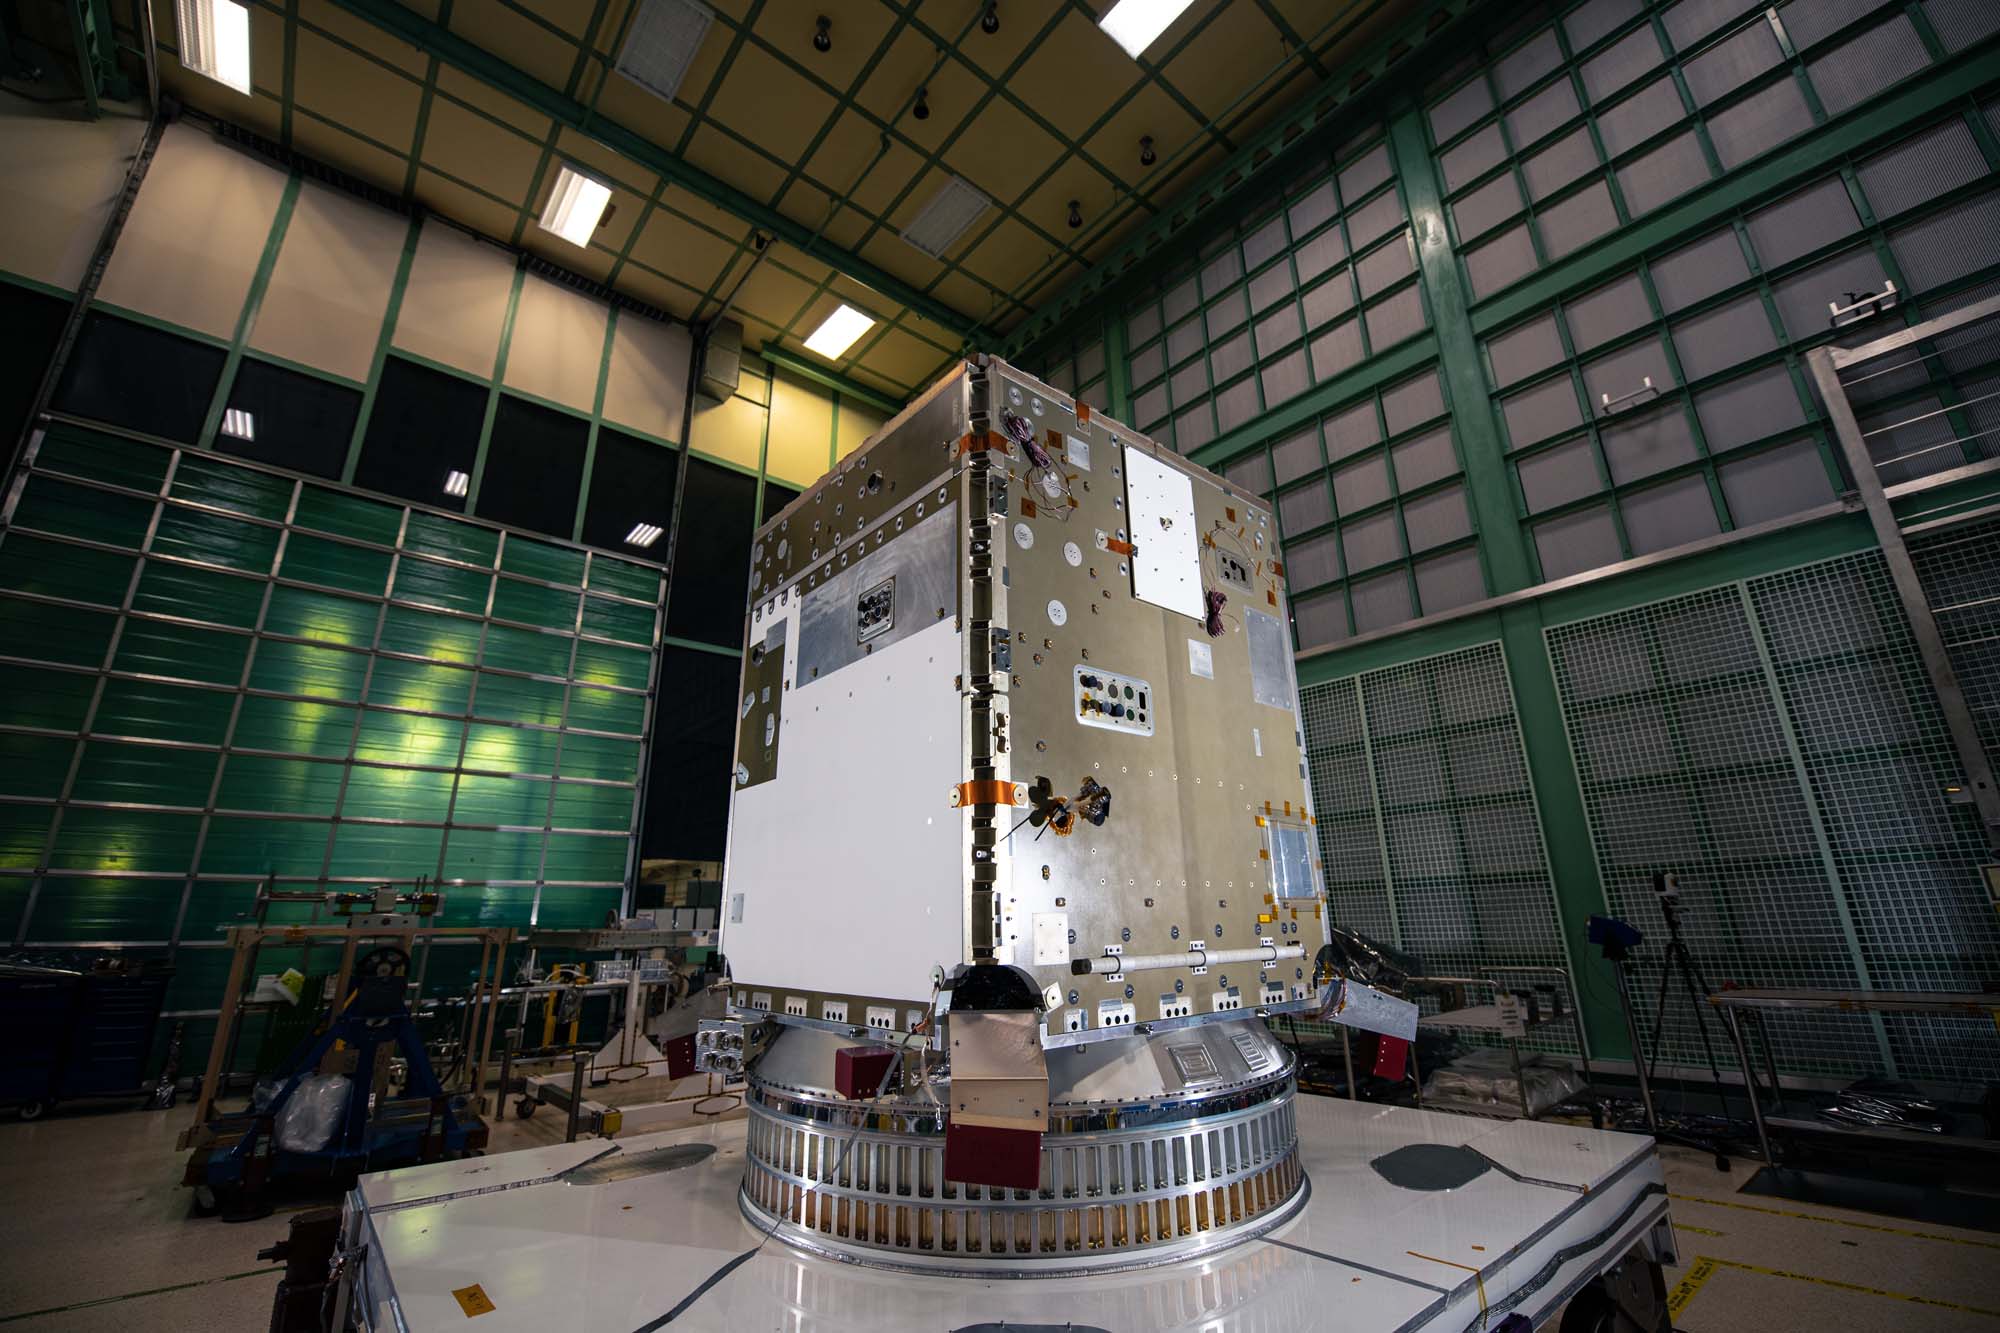
The Earth Shade (ES) radiators on the Ocean Color Instrument are displayed as it is tested in a cleanroom at Goddard Space Flight Center. Credit: Stover, Desiree
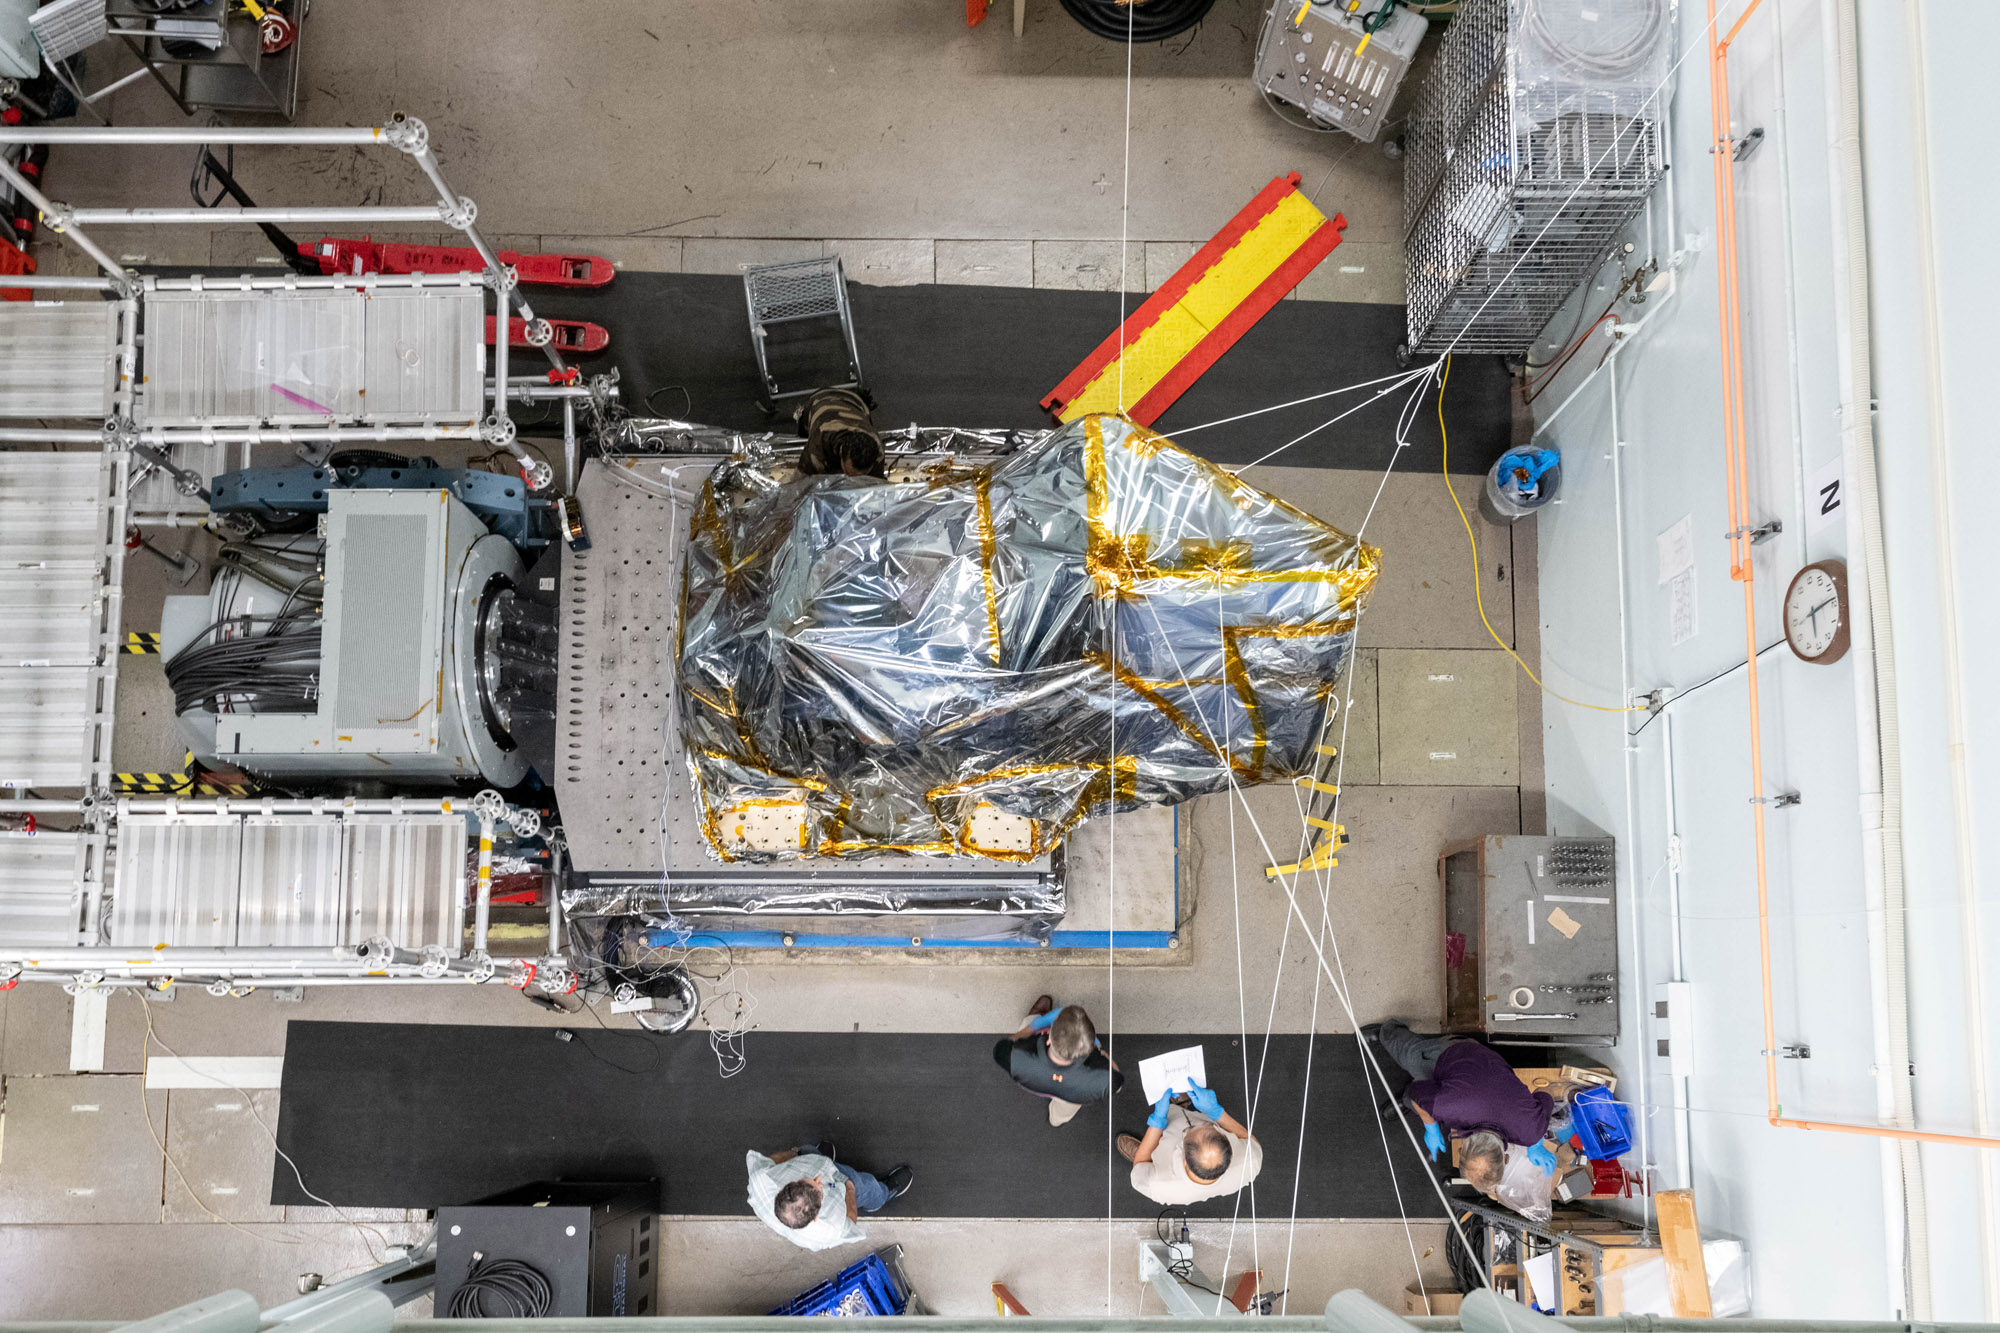
Technician Nathan Allen connects the purge line to the Ocean Color Instrument in preparation for X-Axis (vertical) vibration testing. Credit: Stover, Desiree
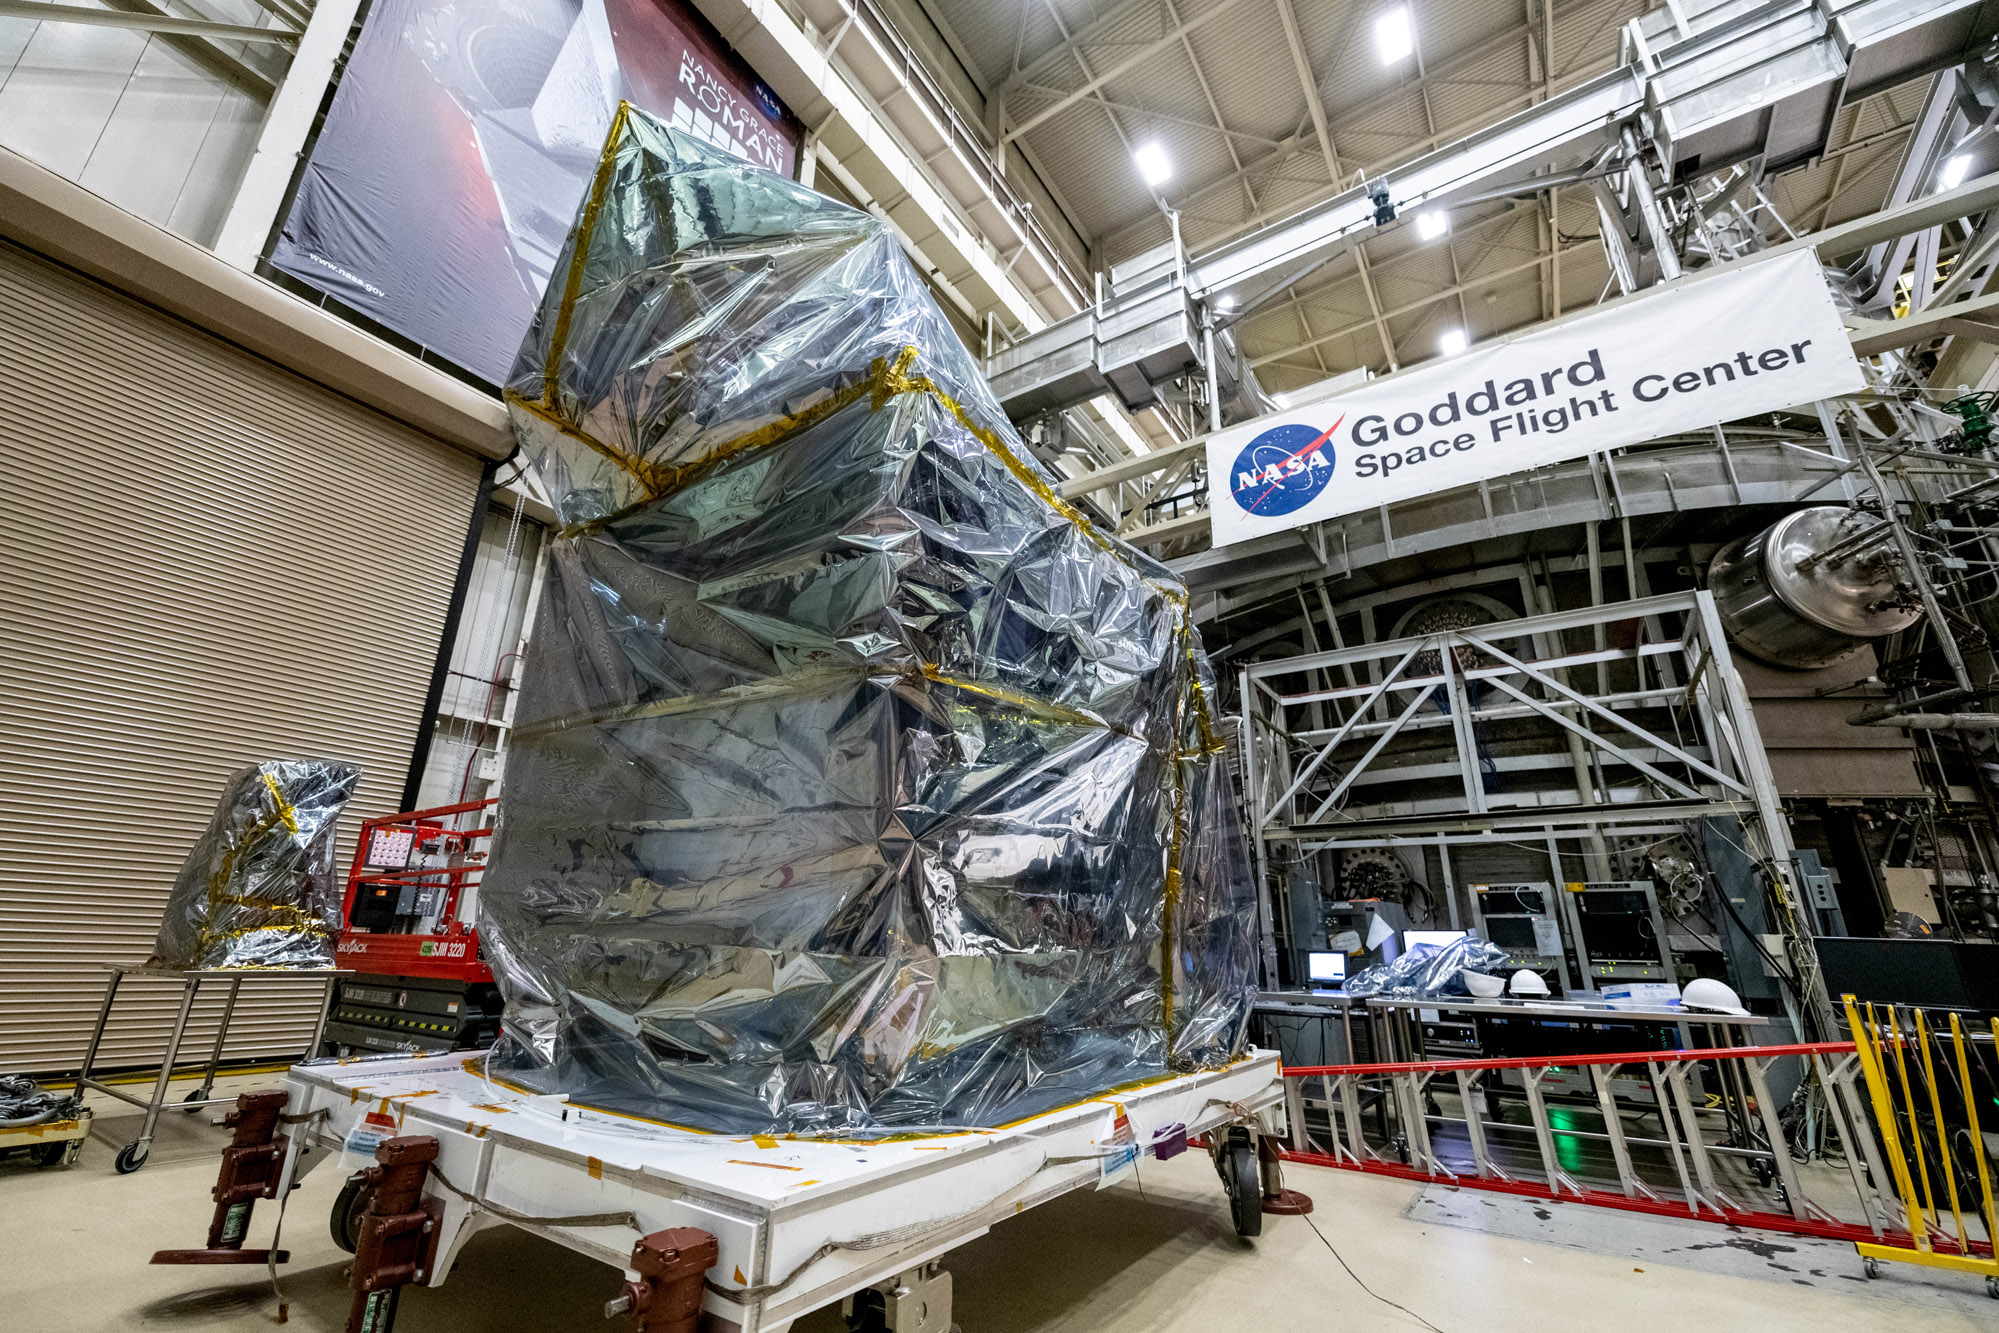
Ocean Color Instrument mechanical team poses with the bagged instrument behind them after a successful environmental testing campaign. Credit: Stover, Desiree
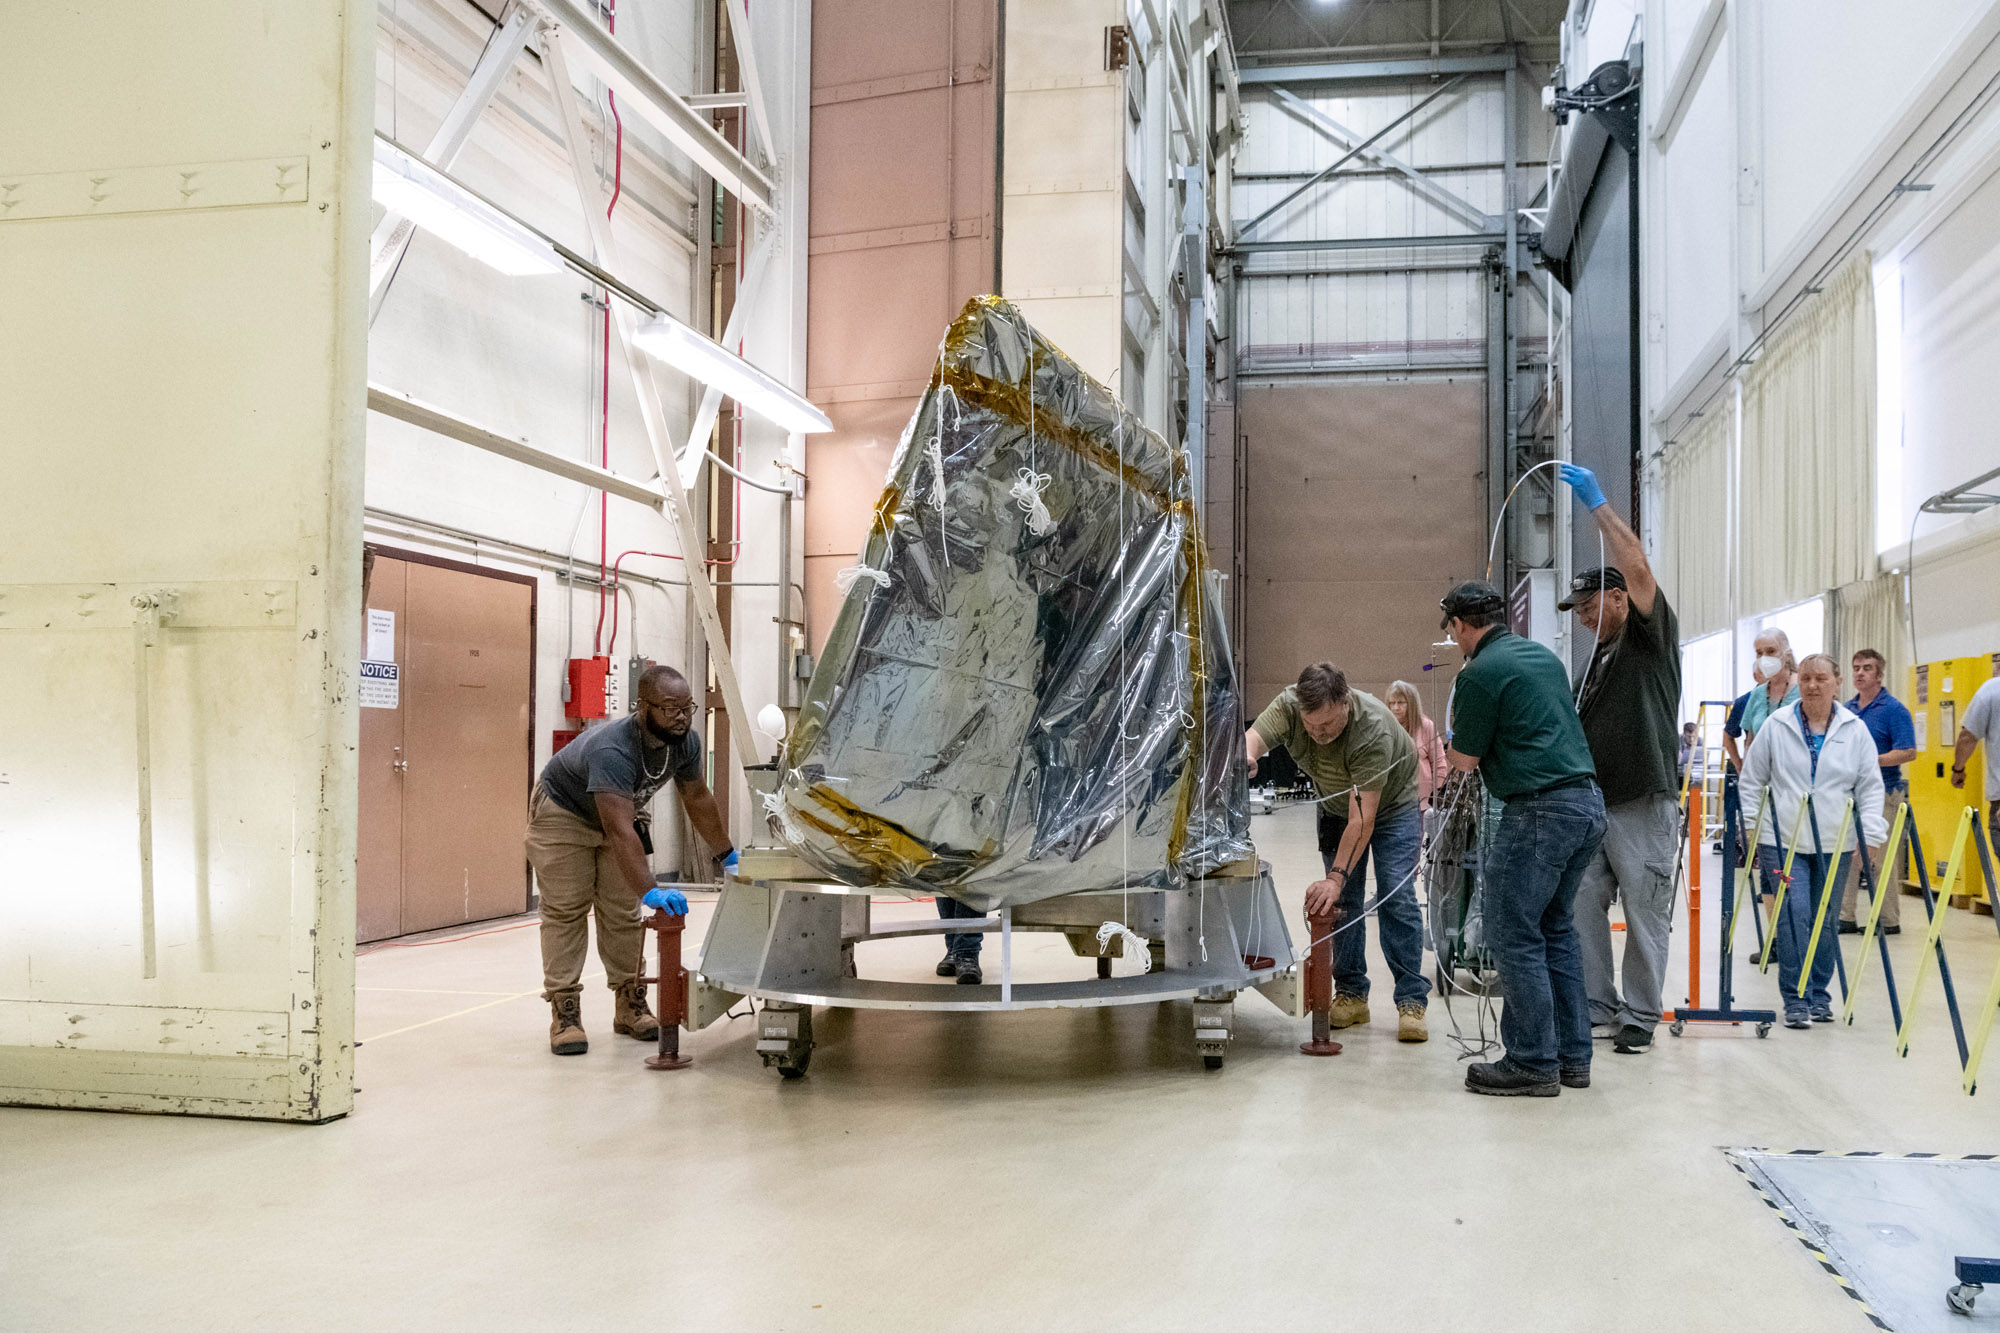
Mechanical technicians transport the Ocean Color Instrument through the integration and testing complex to X-Axis (vertical) vibration chamber. Credit: Mellos, Katherine
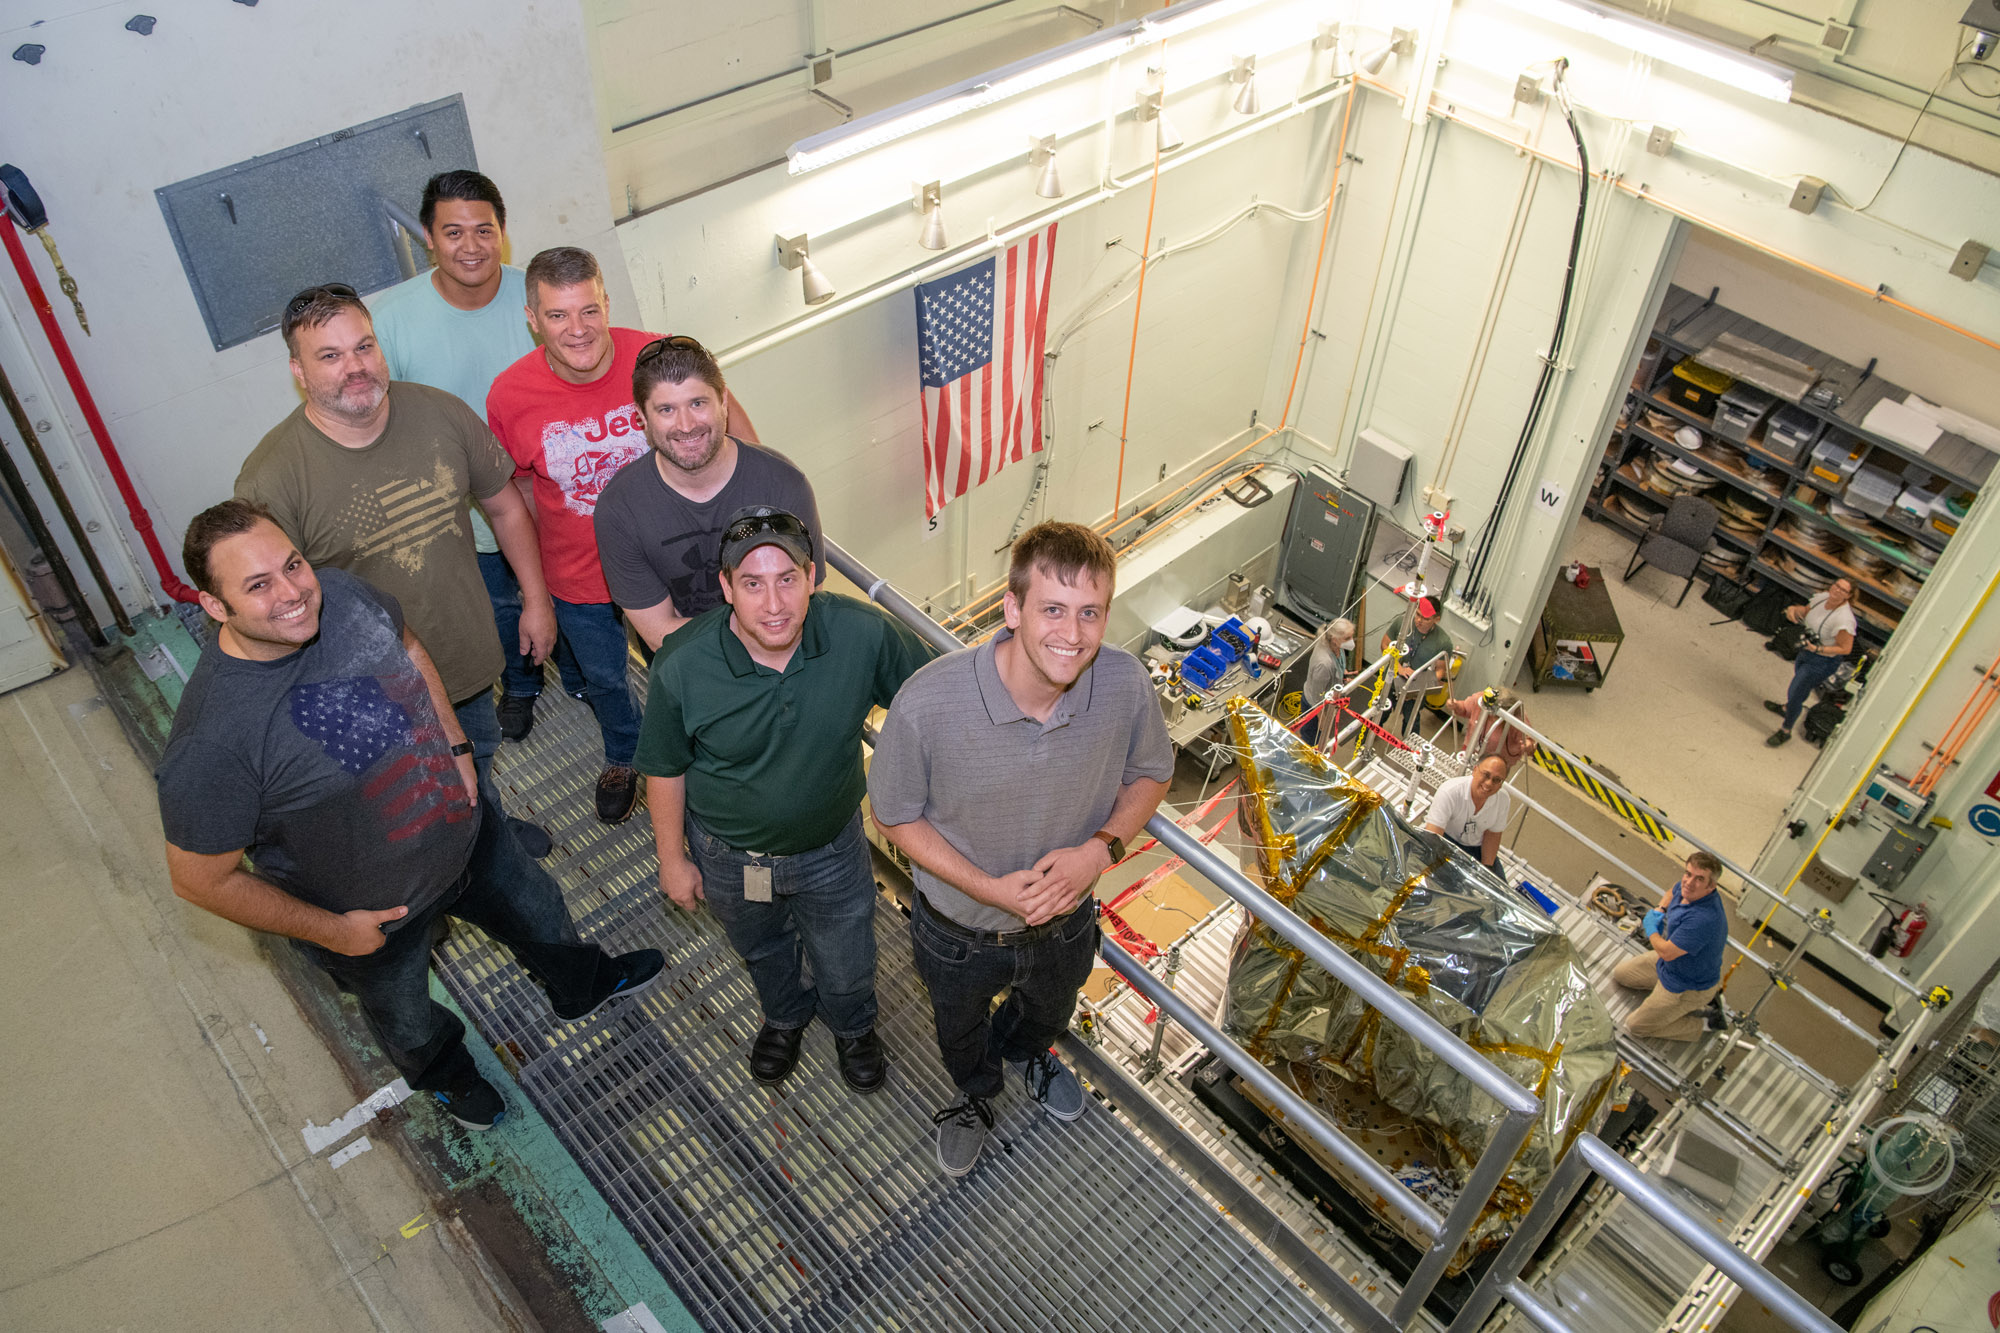
The Ocean Color Instrument mechanical team stands on the balcony overlooking the bagged instrument after successfully installing it onto the X axis (vertical) vibration shaker table. Credit: Stover, Desiree
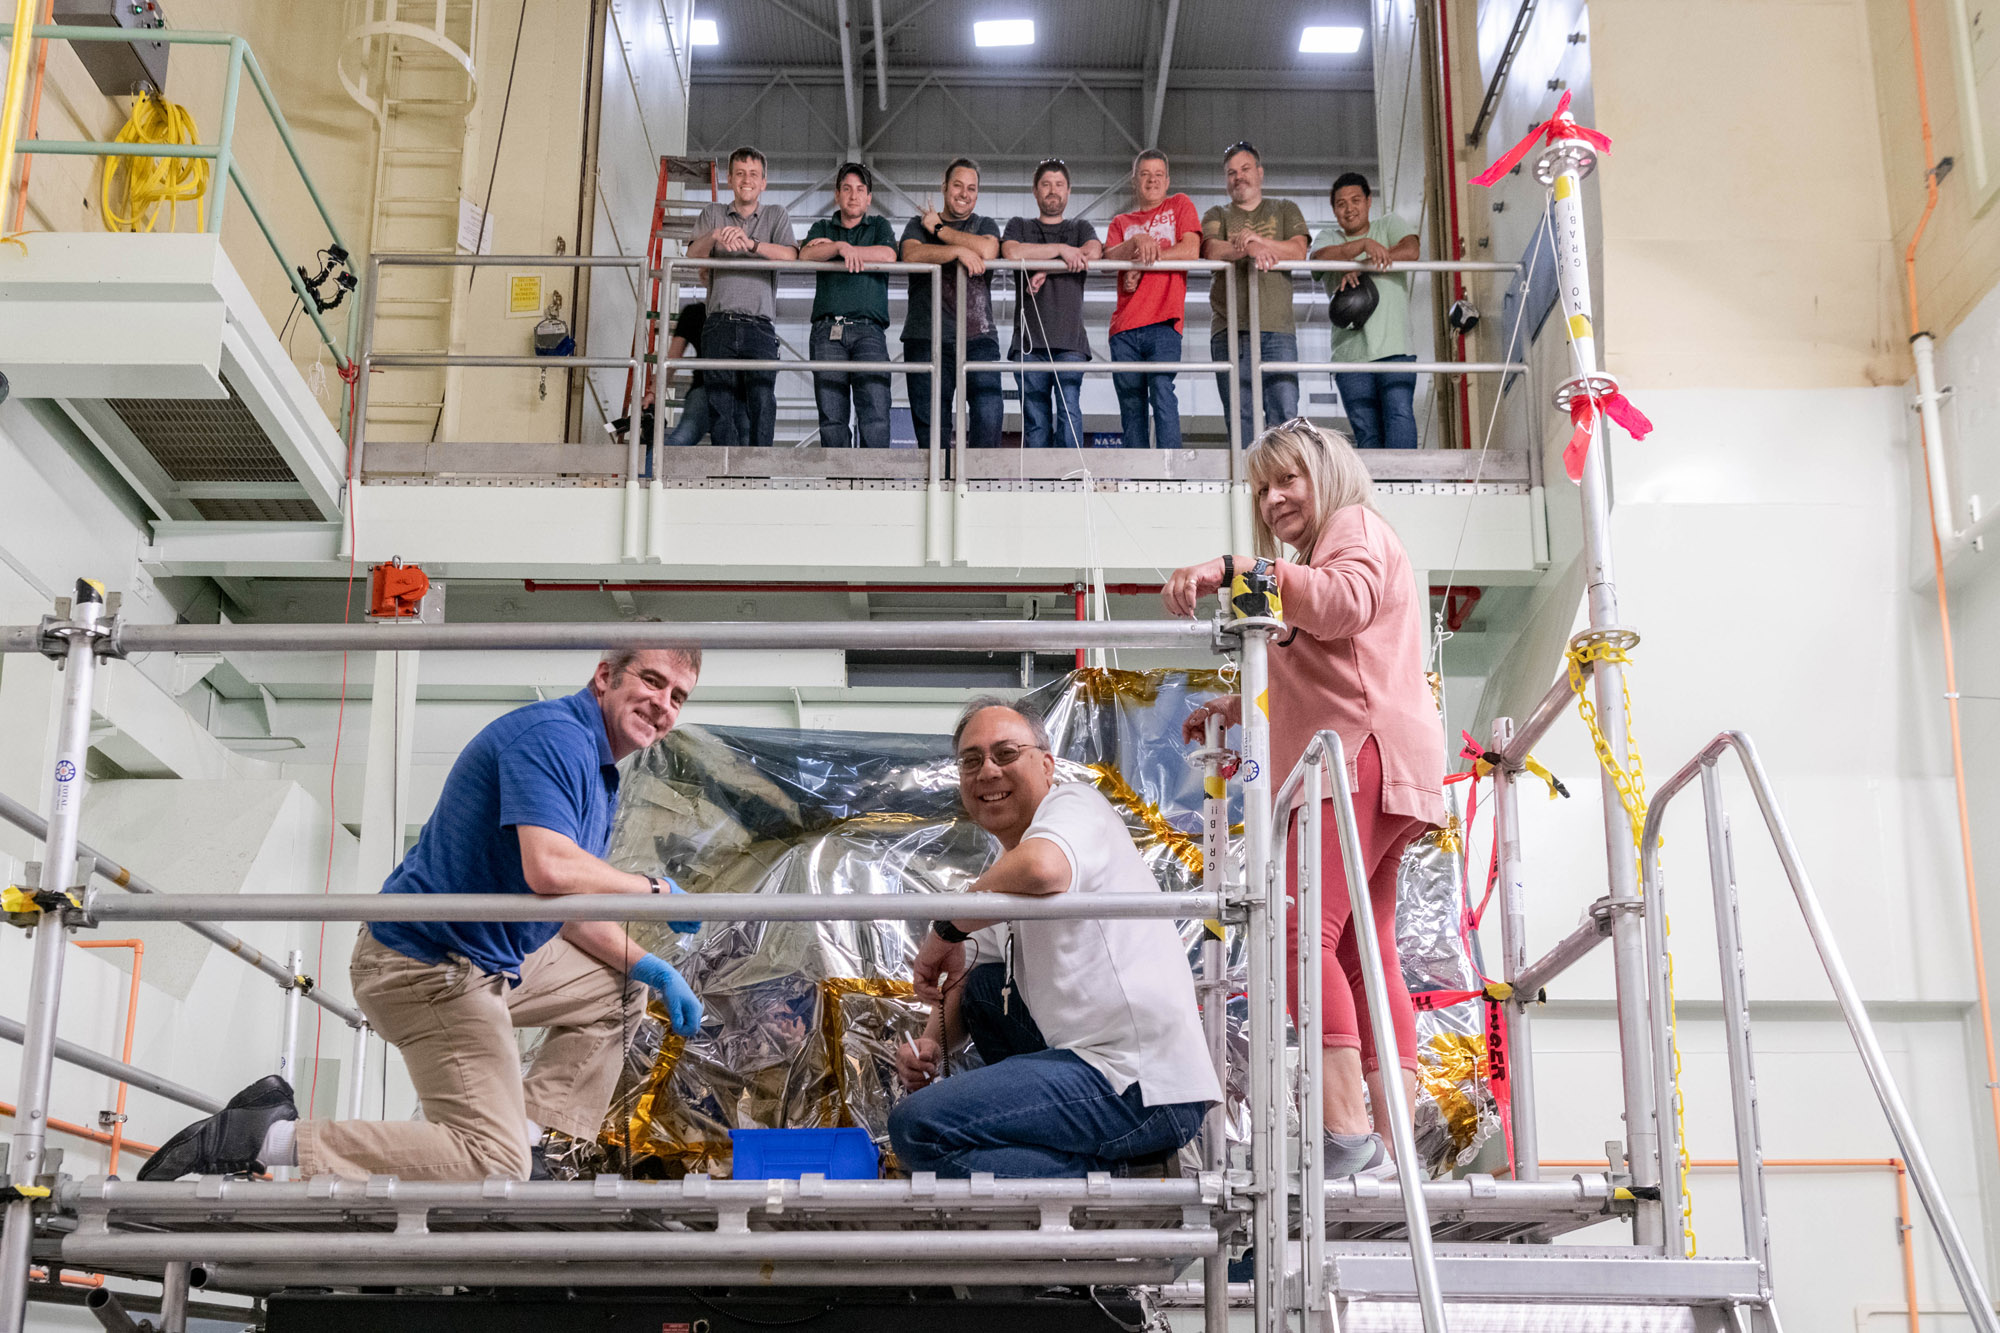
The Ocean Color Instrument mechanical team poses with the bagged instrument after successfully installing it onto the X-Axis (vertical) vibration shaker table. Credit: Mellos, Katherine
The Ocean Color Instrument is crane lifted onto the Y-axis vibration table. Credit: Mellos, Katherine
The GSFC environmental testing team poses with the bagged Ocean Color Instrument in the acoustic chamber prior to testing. Credit: Stover, Desiree
Mechanical technicians crane lift the Ocean Color Instrument with Earth Shade onto the Flight Tilt Mechanism. Credit: Stover, Desiree
The Ocean Color Instrument integrated onto the Flight Tilt Mechanism with the Earth Shade. Credit: Stover, Desiree
The Ocean Color Instrument is prepared for environmental testing with installed thermal blankets, protective contamination covers, and flight Earth Shade (ES). Credit: Stover, Desiree
The Ocean Color Instrument (OCI) is prepared for environmental testing with installed thermal blankets and flight Earth Shade in a cleanroom at Goddard Space Flight Center. Credit: Stover, Desiree
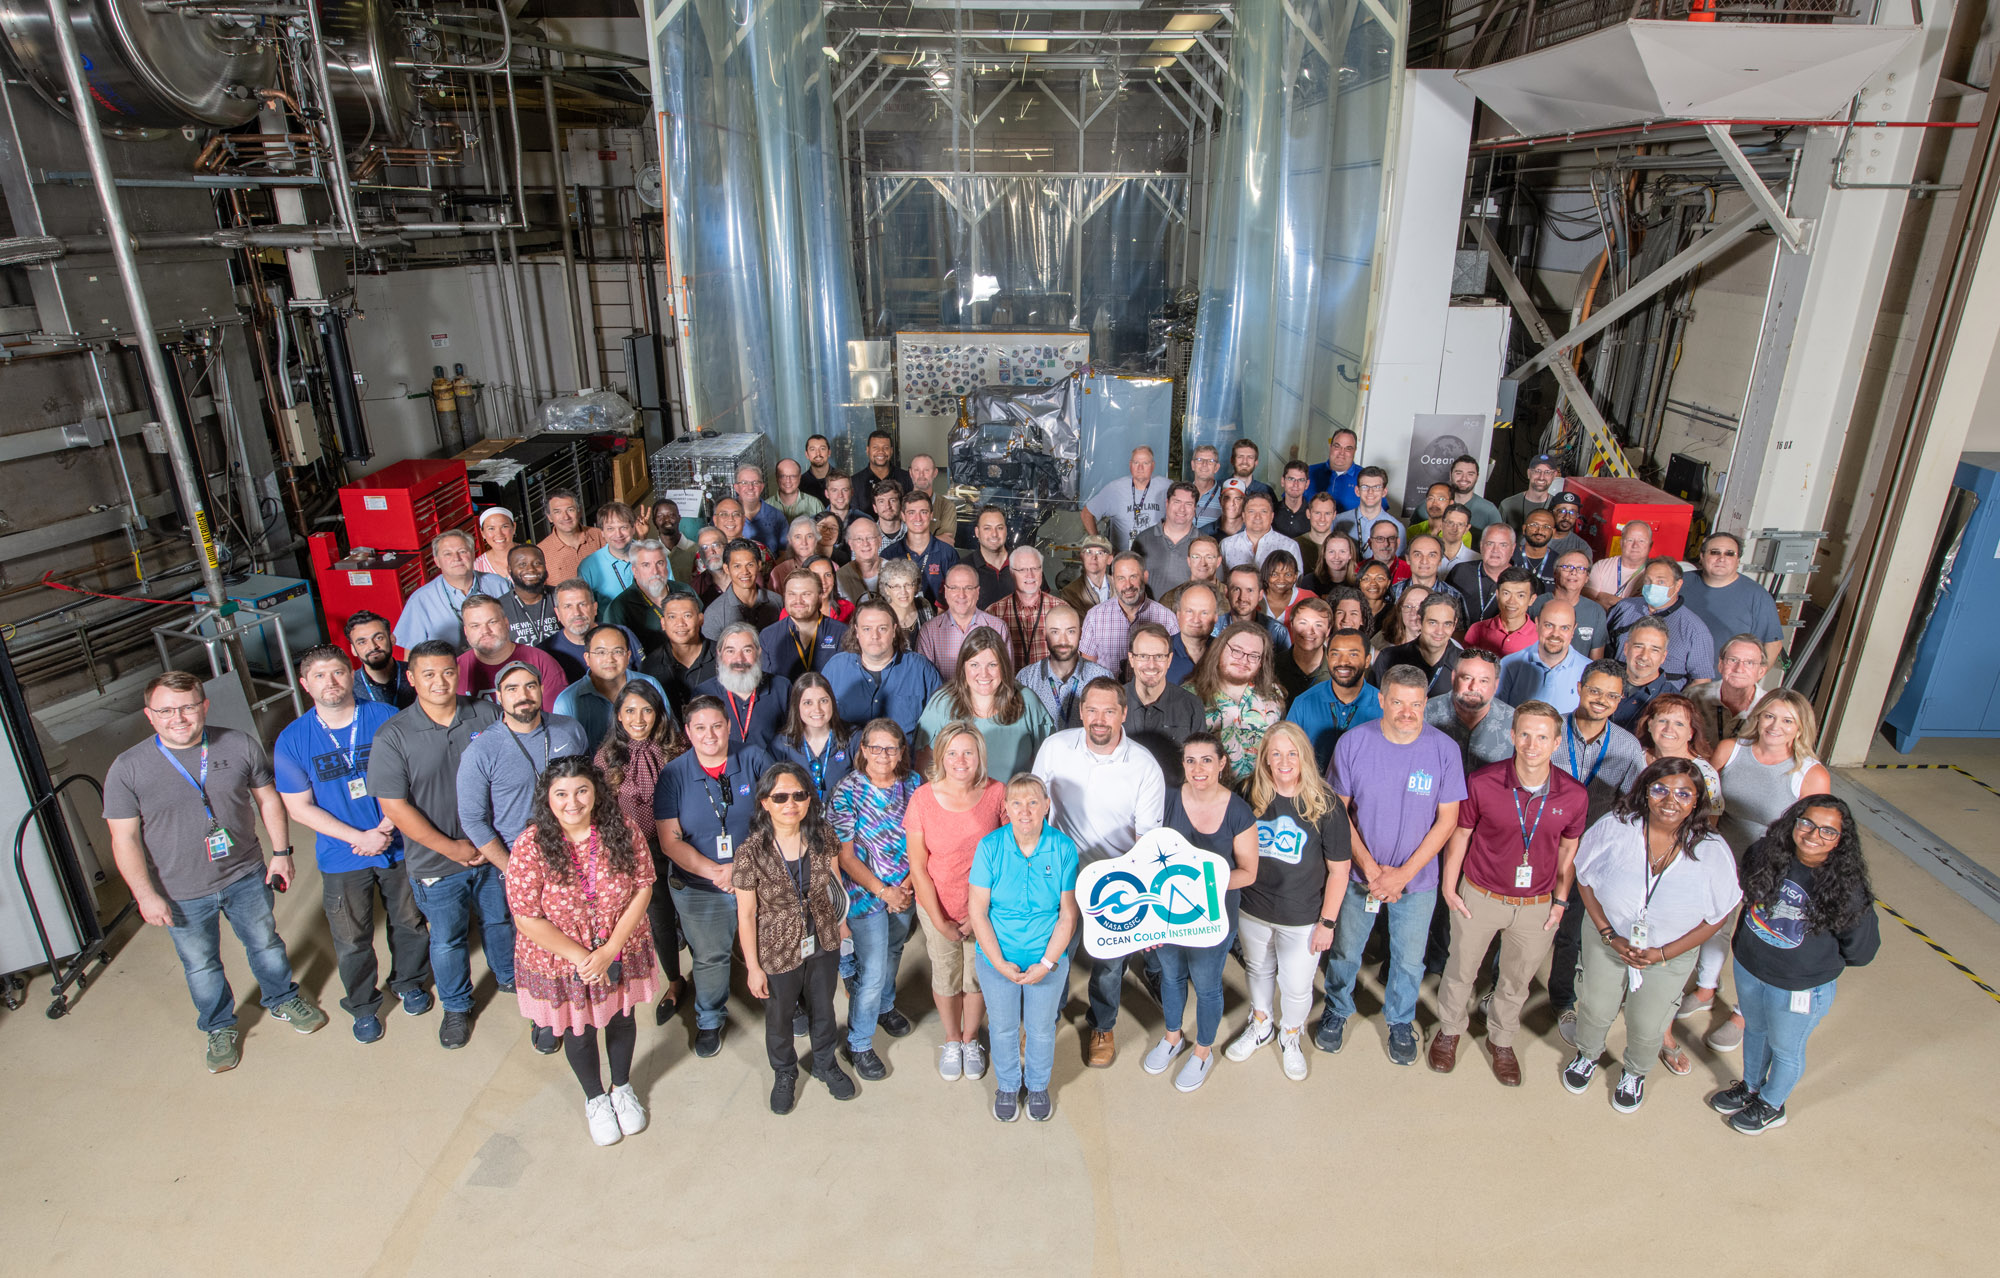
The Ocean Color Instrument (OCI) team poses with OCI and its integrated Earth Shade in June 2022 at Goddard Space Flight Center. Credit: Stover, Desiree
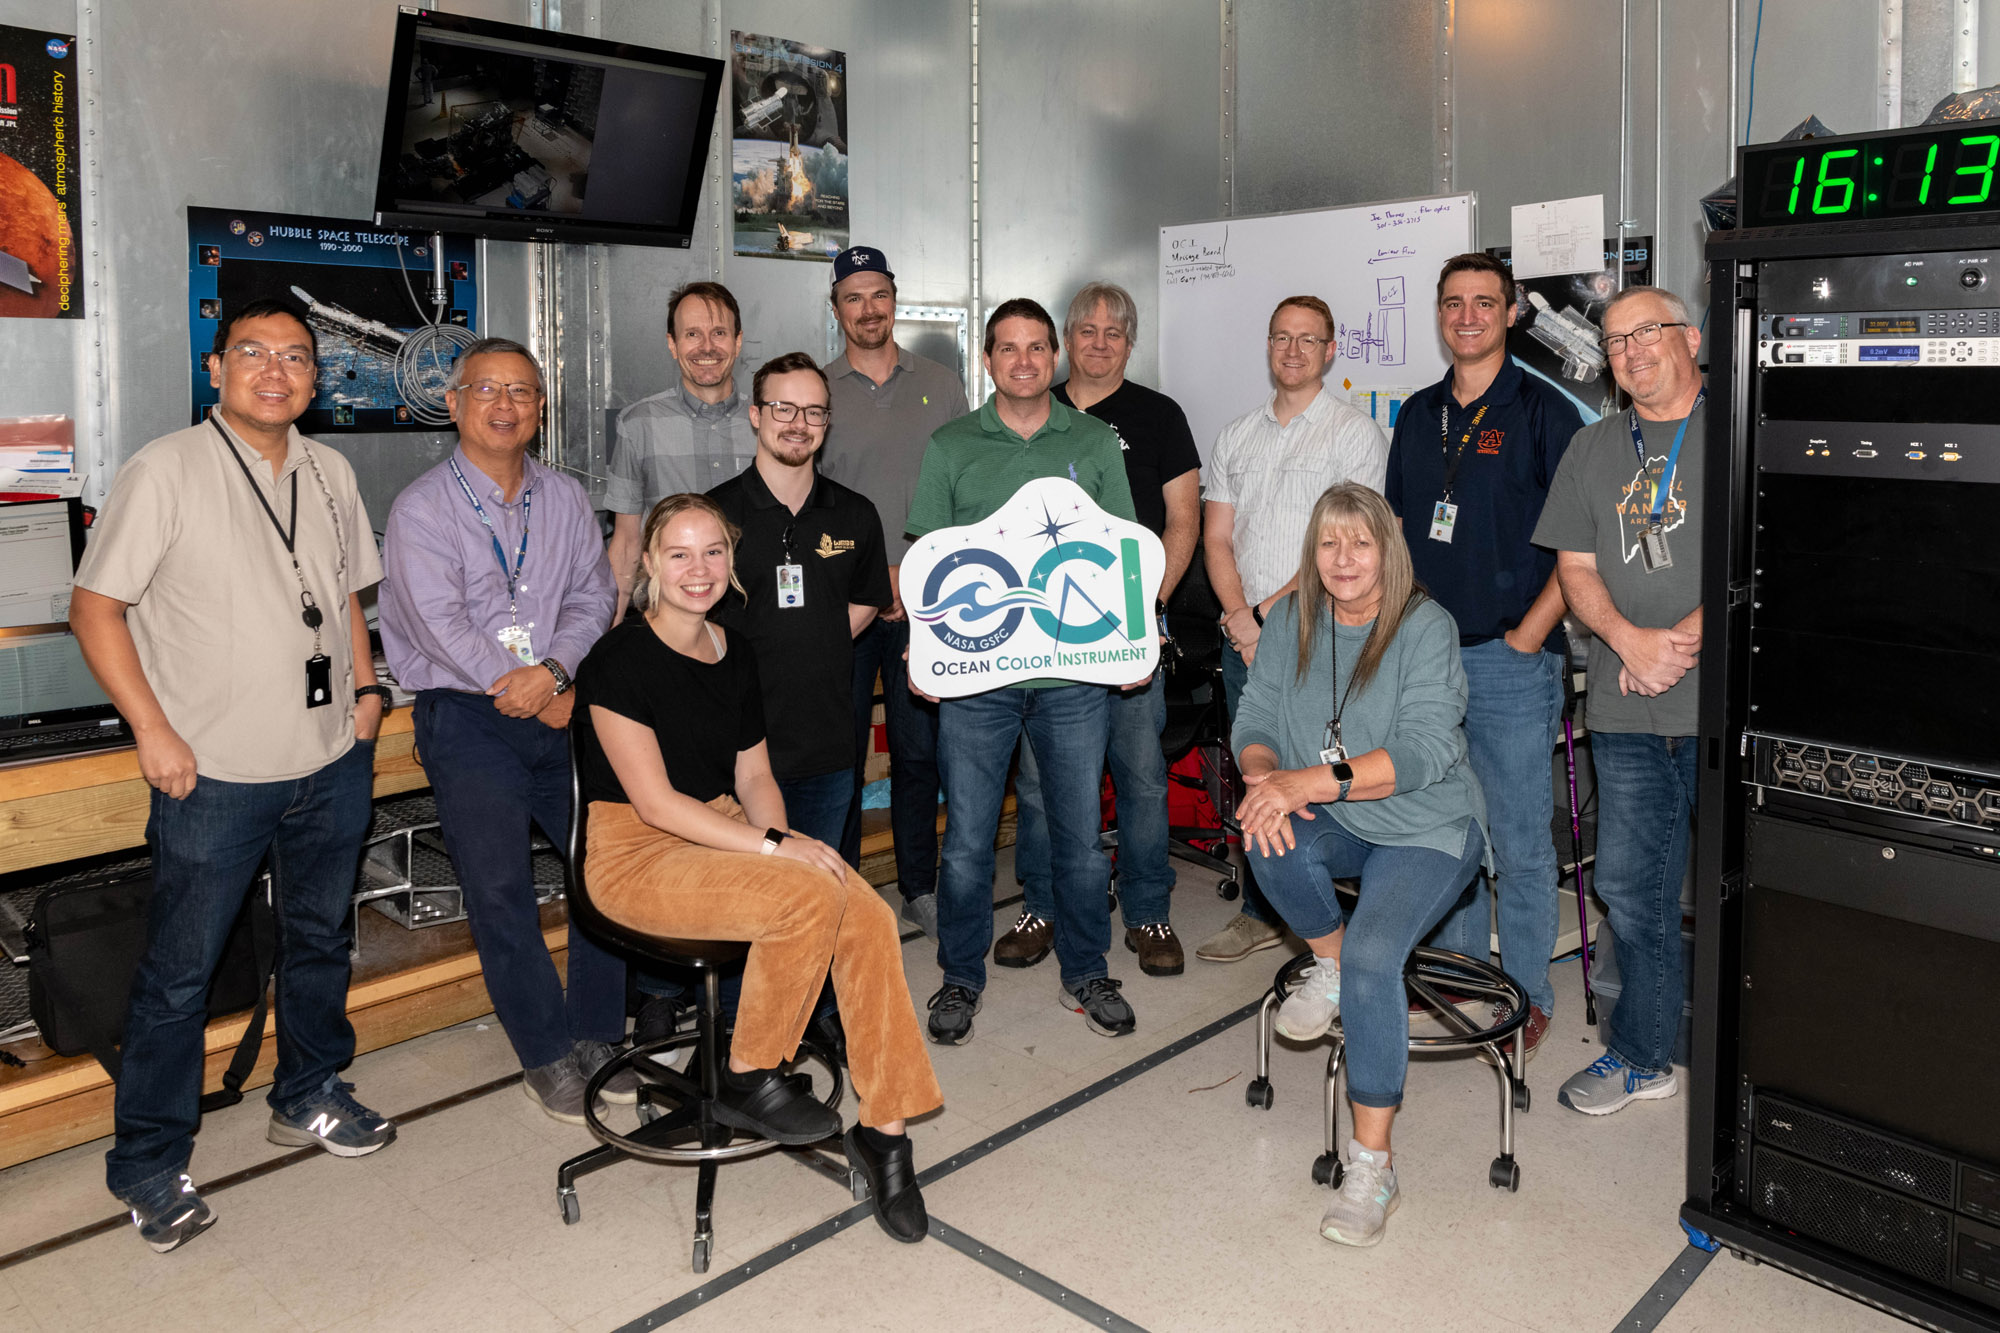
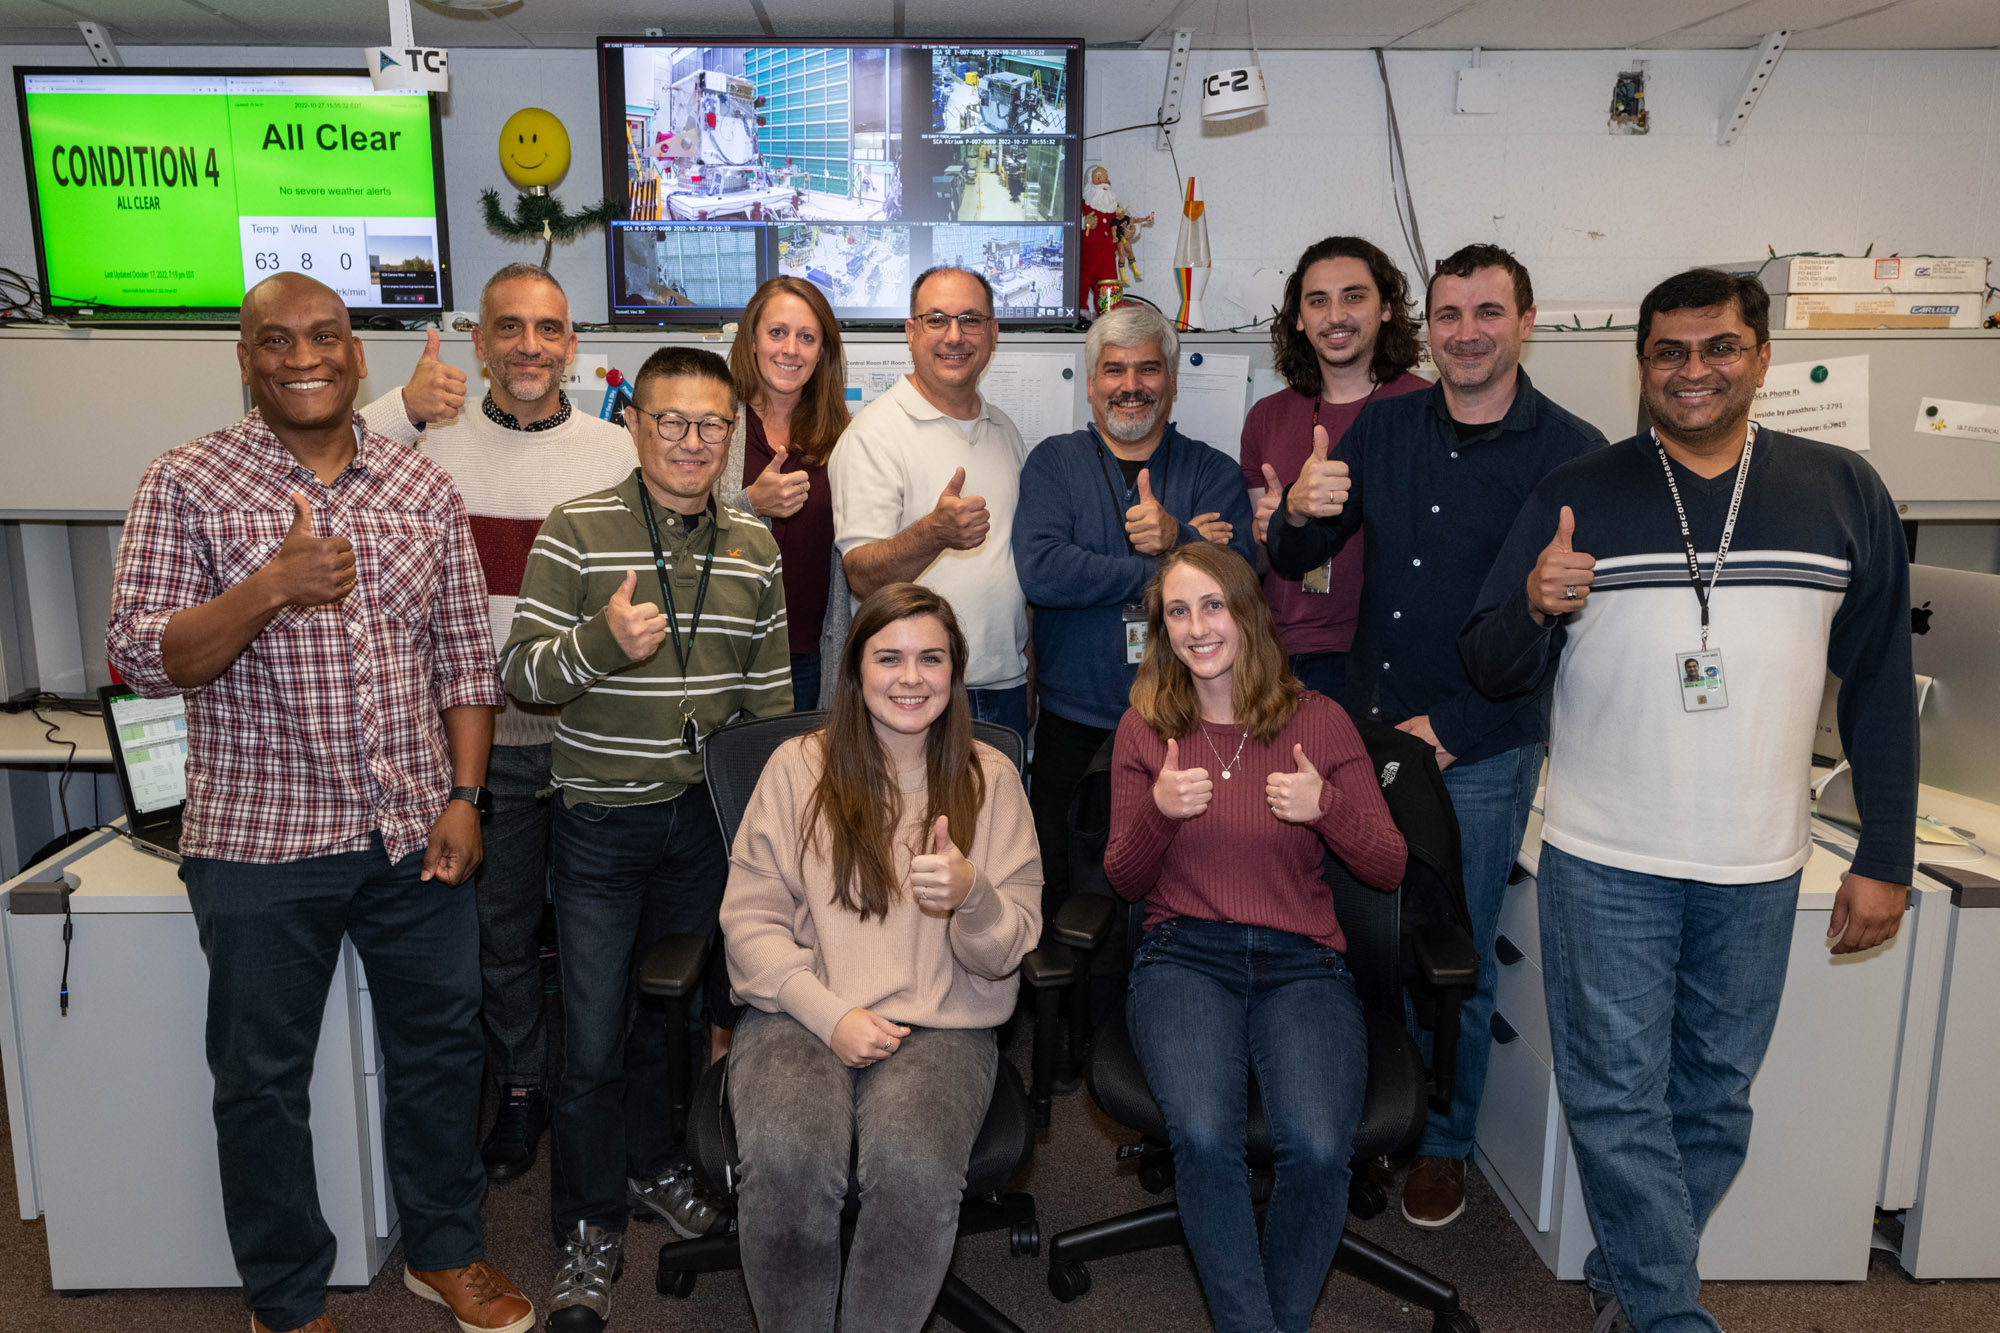
The Ocean Color Instrument Electro-Magnetic Interference (EMI) & Electrical Ground Support Equipment (EGSE) Team pose in the control room at at Goddard Space Flight Center. Credit: Mellos, Katherine
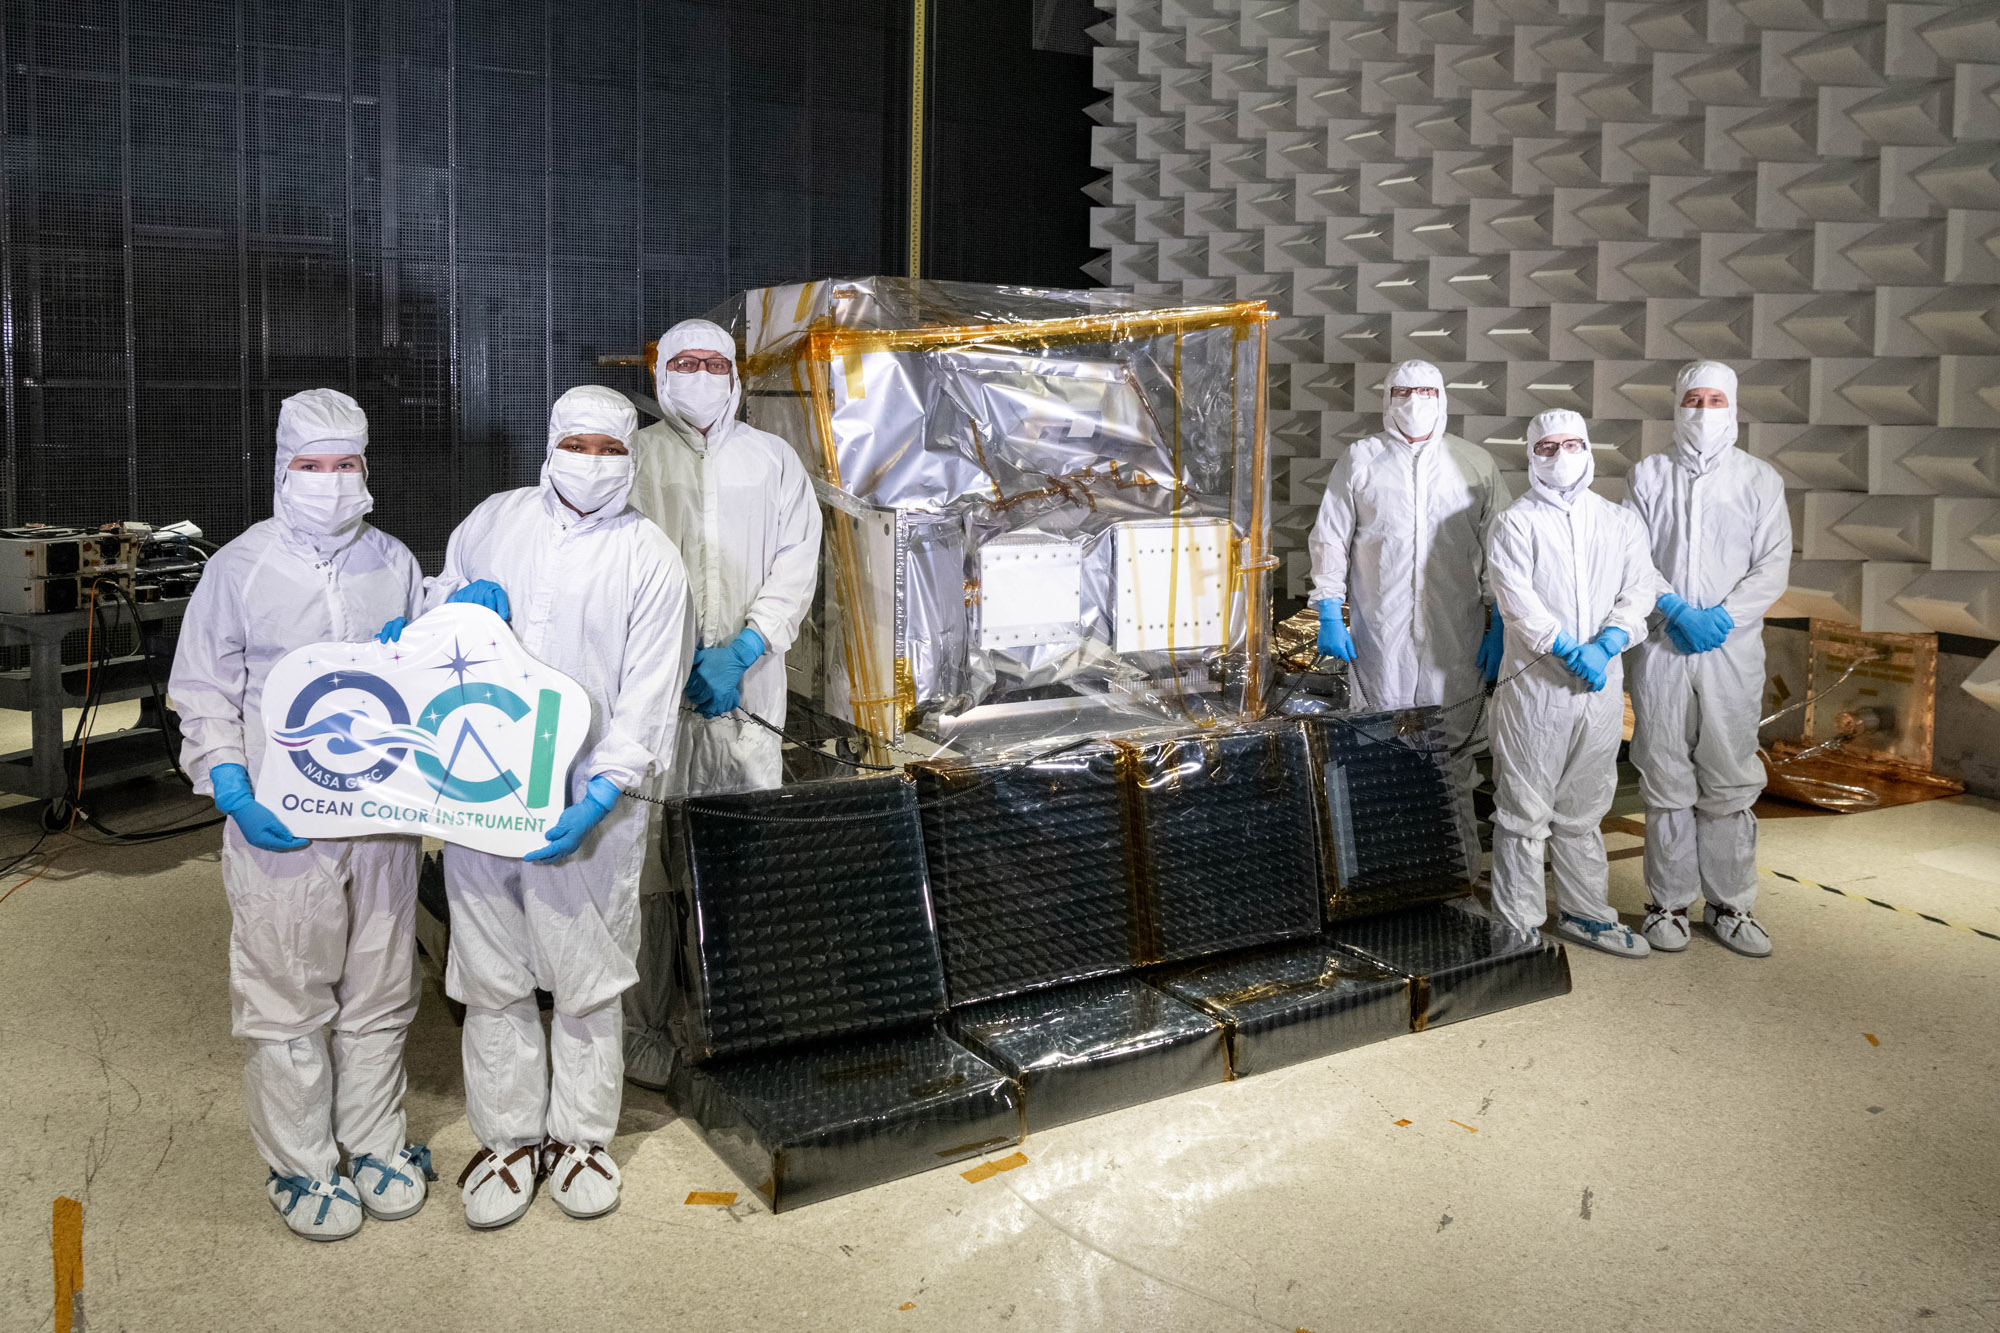
The Ocean Color Instrument Electro-Magnetic Interference (EMI) Team pose in the EMI cleanroom at Goddard Space Flight Center. Credit: Mellos, Katherine
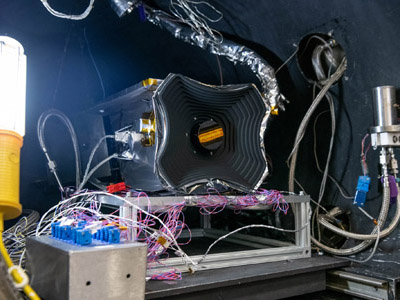
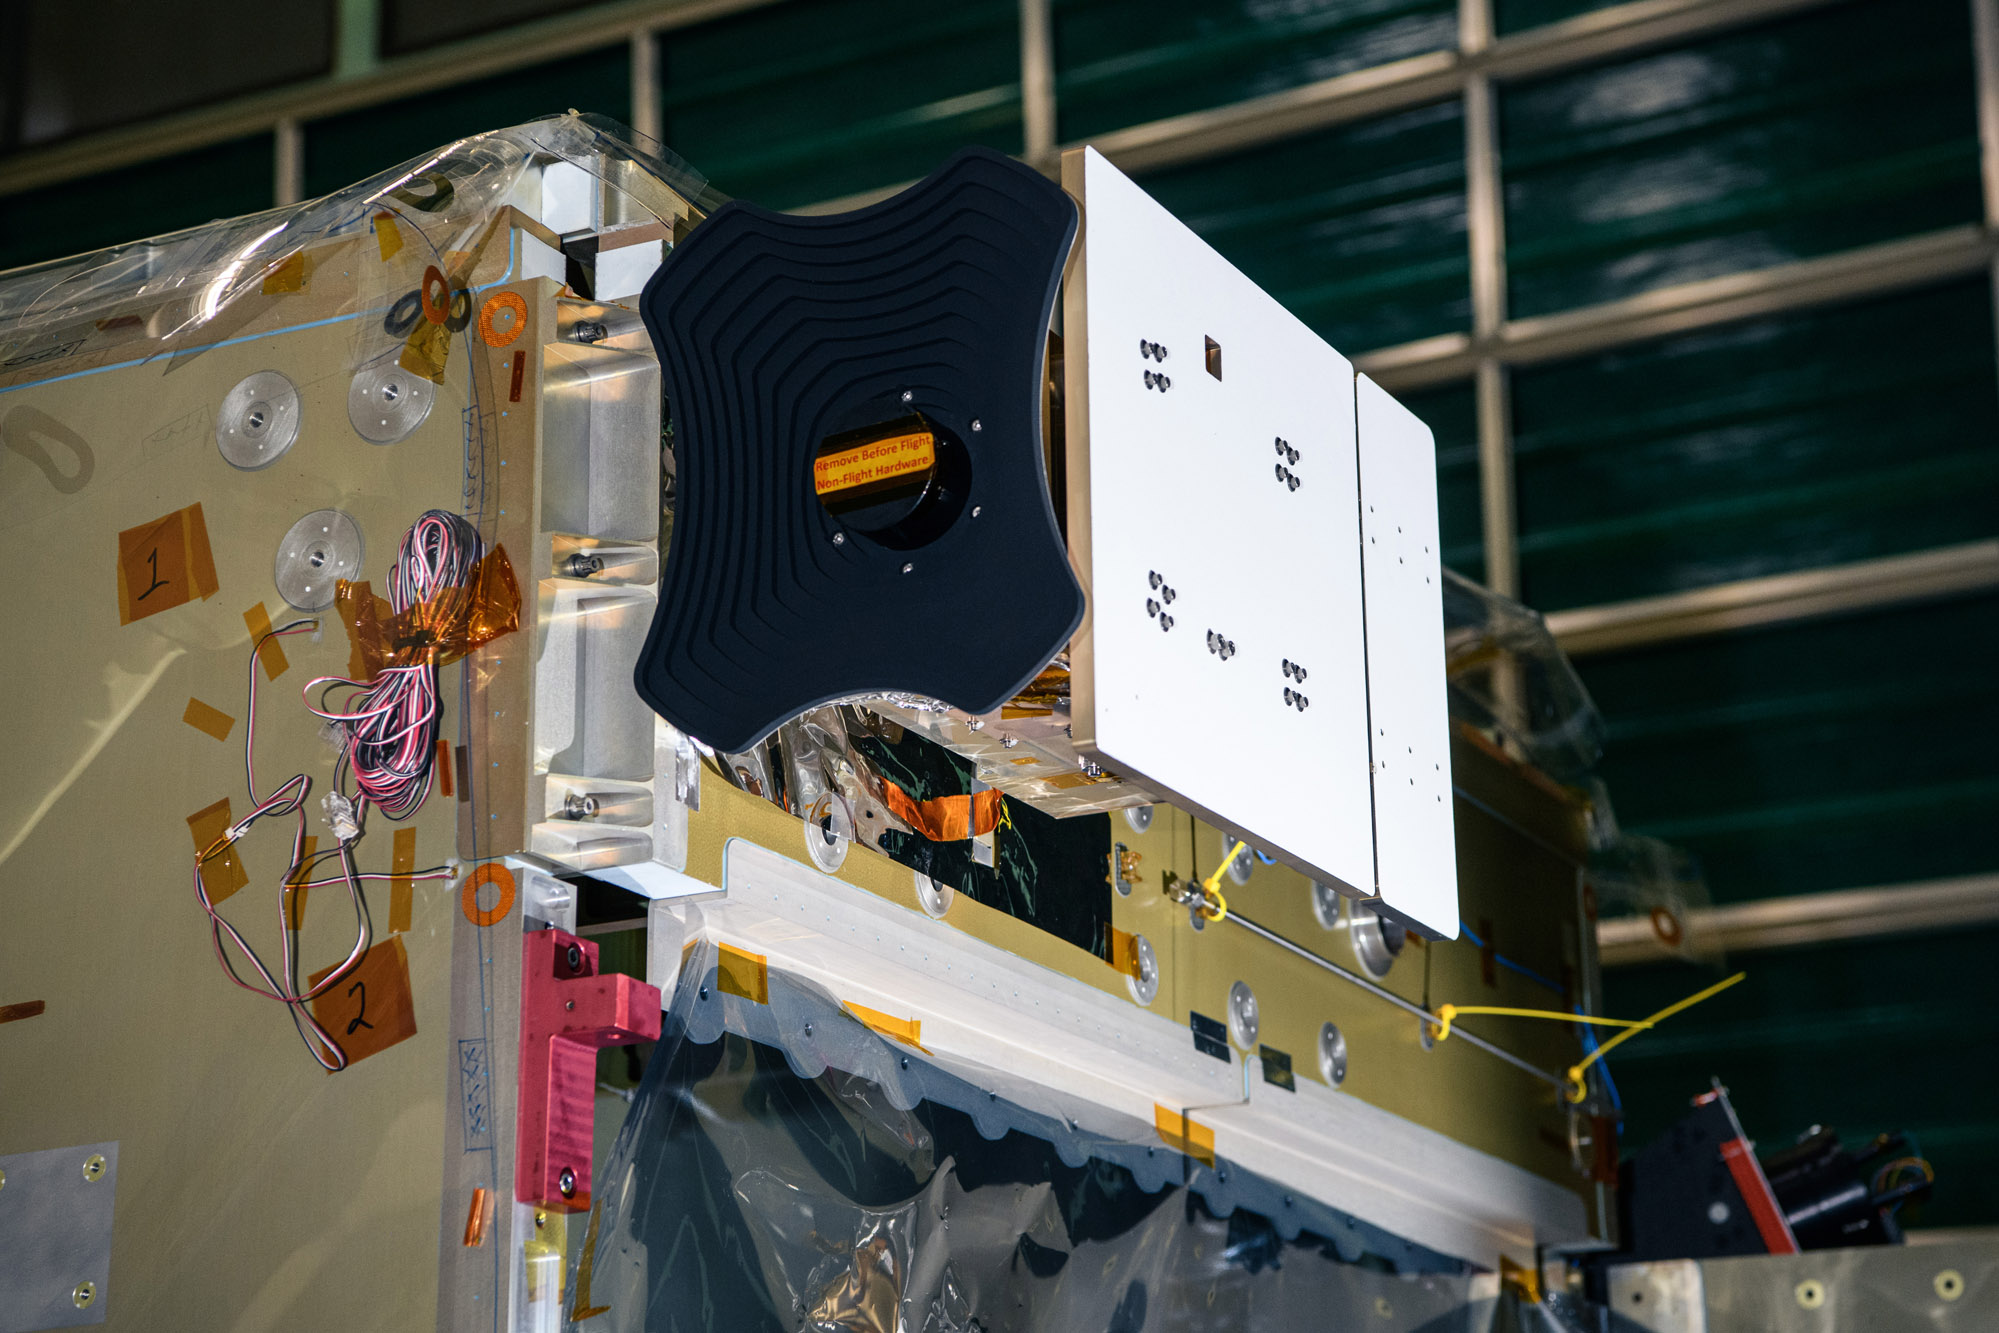
The Ocean Color Instrument is prepared for testing in the Electro-Magnetic Interference (EMI) chamber showing the Rotating Telescope side of the instrument. Credit: Mellos, Katherine
The Ocean Color Instrument is prepared for testing in the Electro-Magnetic Interference (EMI) chamber. Credit: Mellos, Katherine
The Ocean Color Instrument Earth Shade (ES) is removed from a thermal chamber after successful testing. Credit: Mellos, Katherine
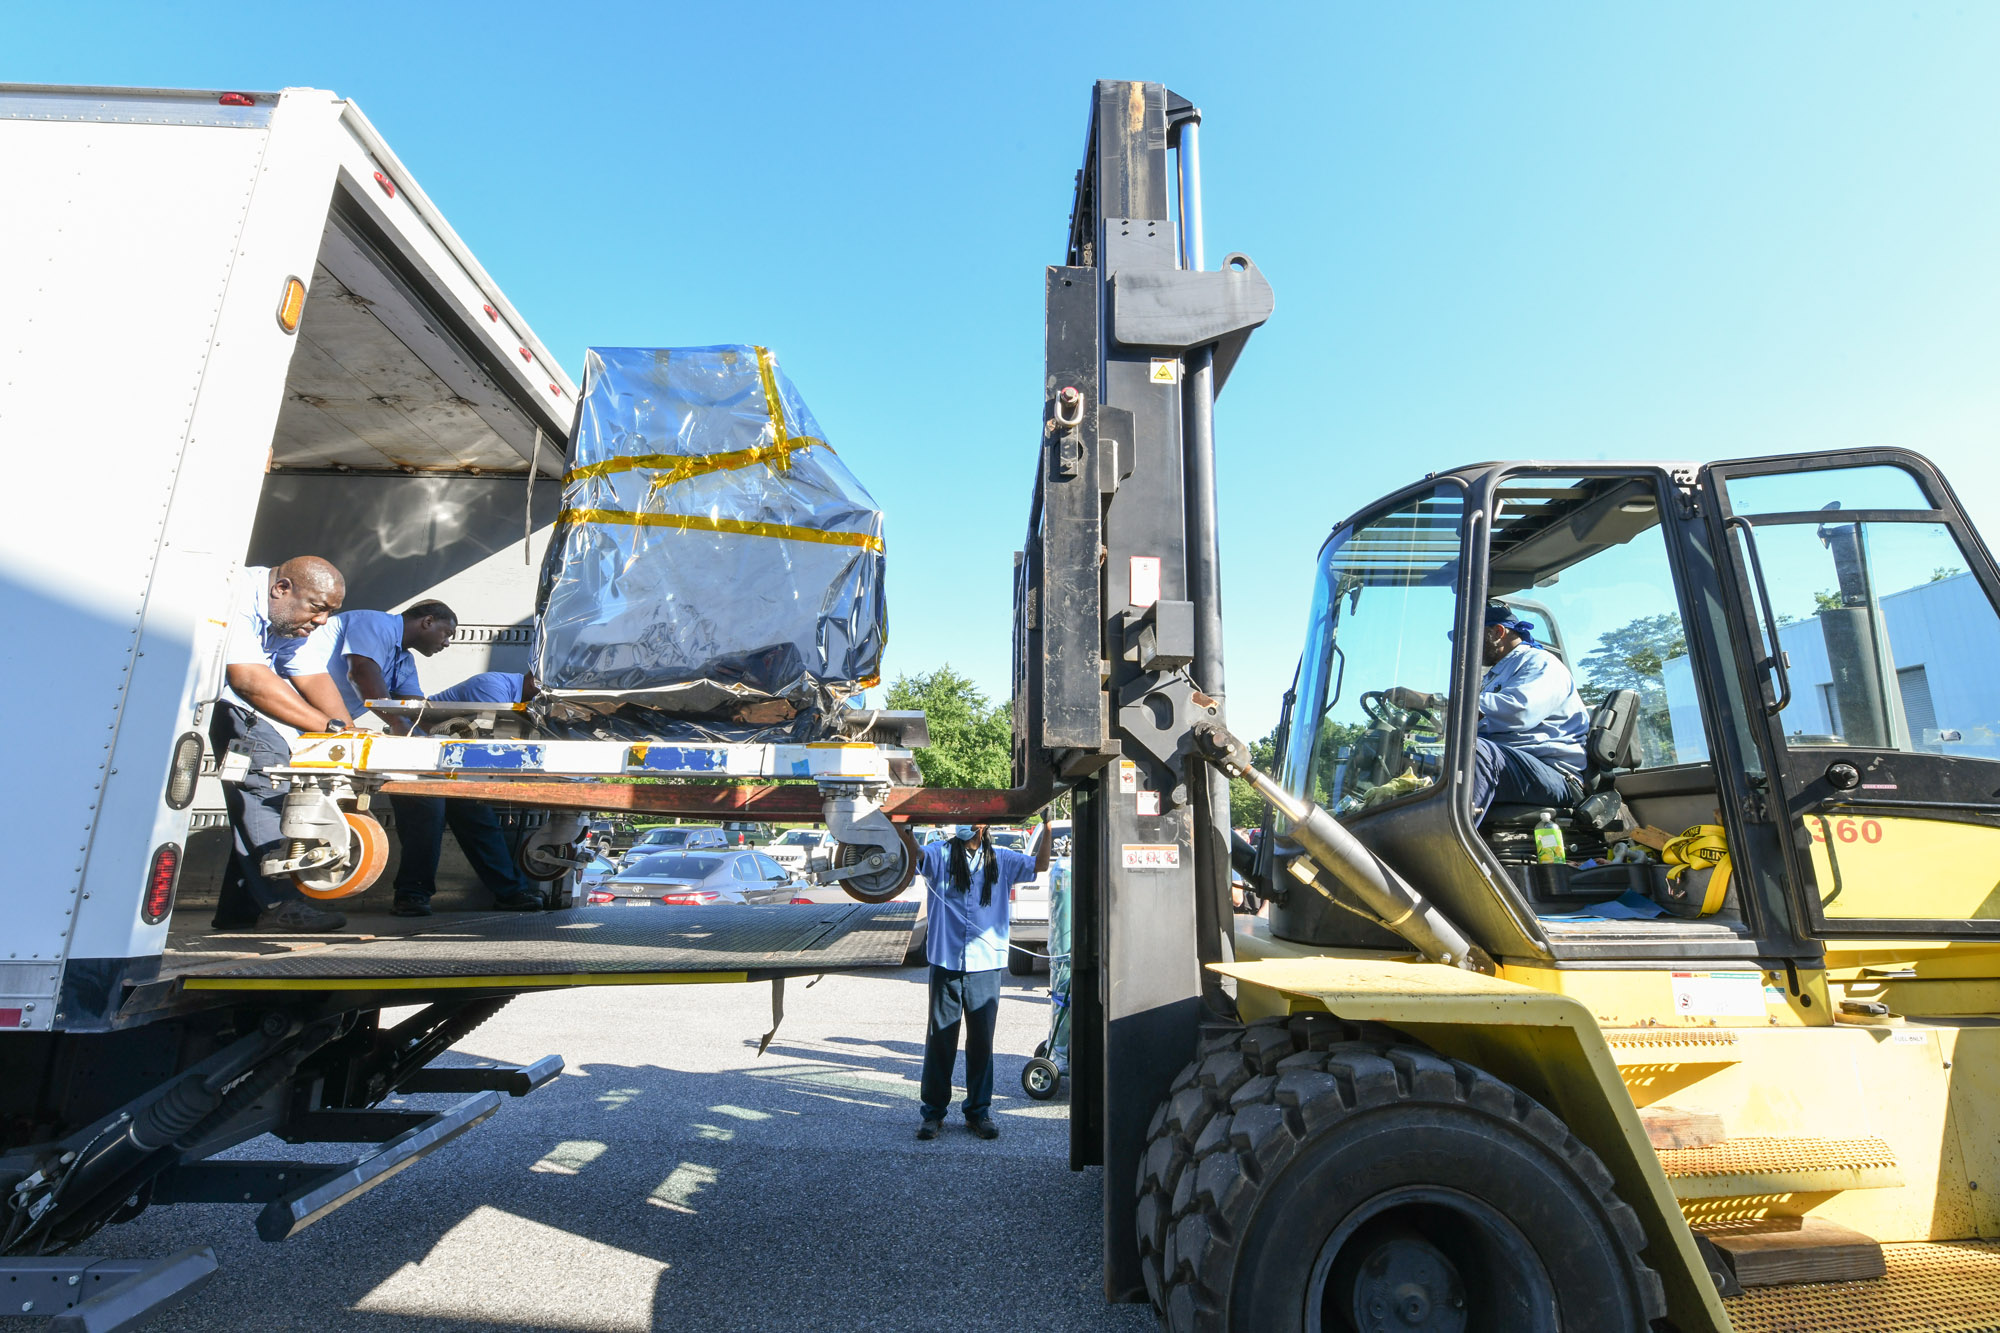
The GSFC Trax team lifts the Ocean Color Instrument on a forklift into a truck to transport to the integration and testing facility for envirnomental testing. Credit: Stover, Desiree
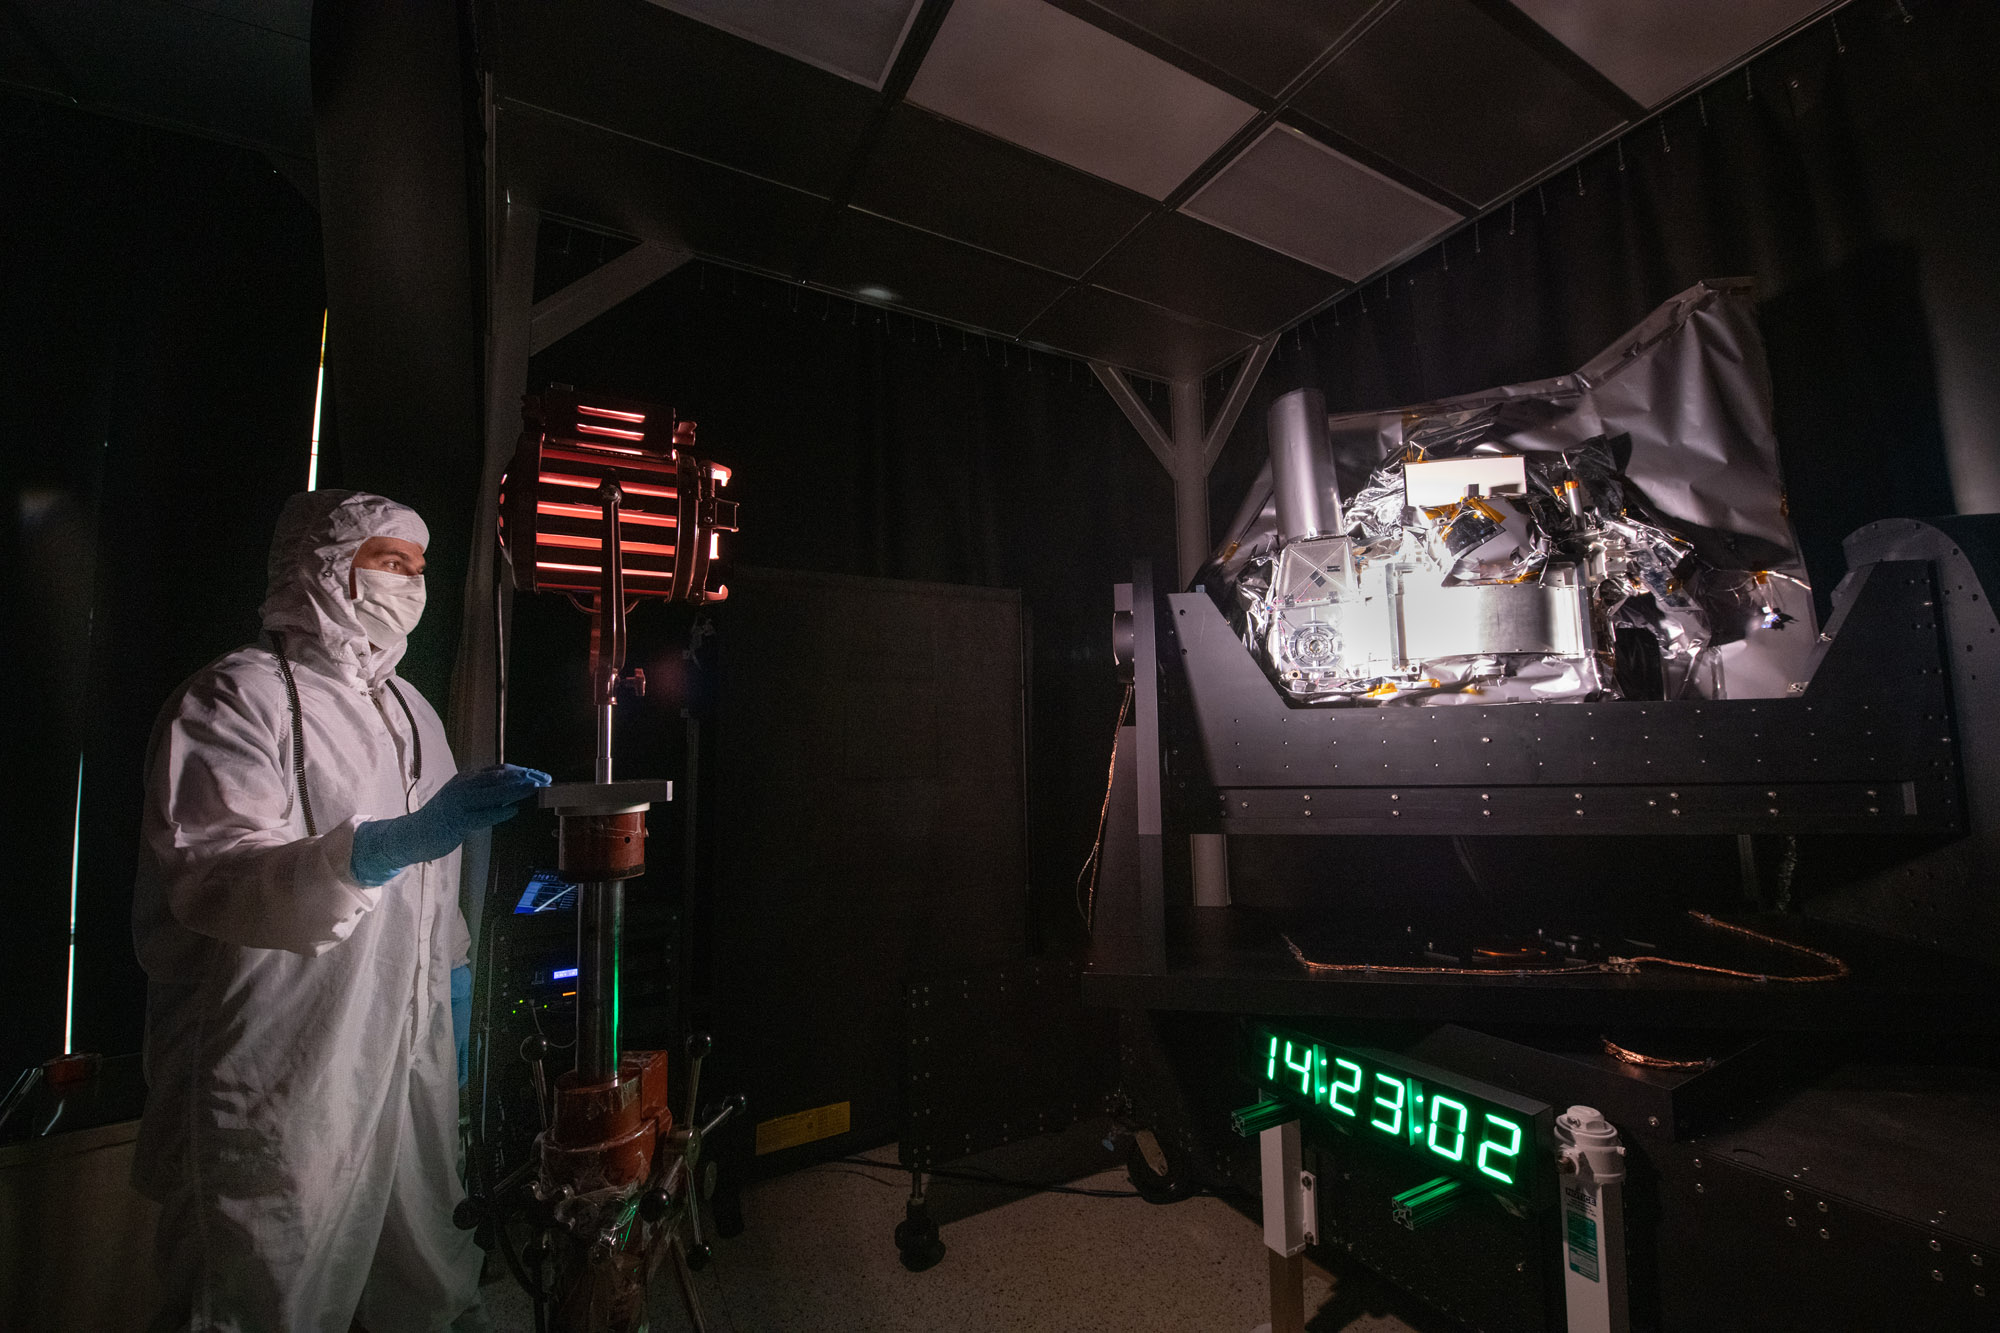
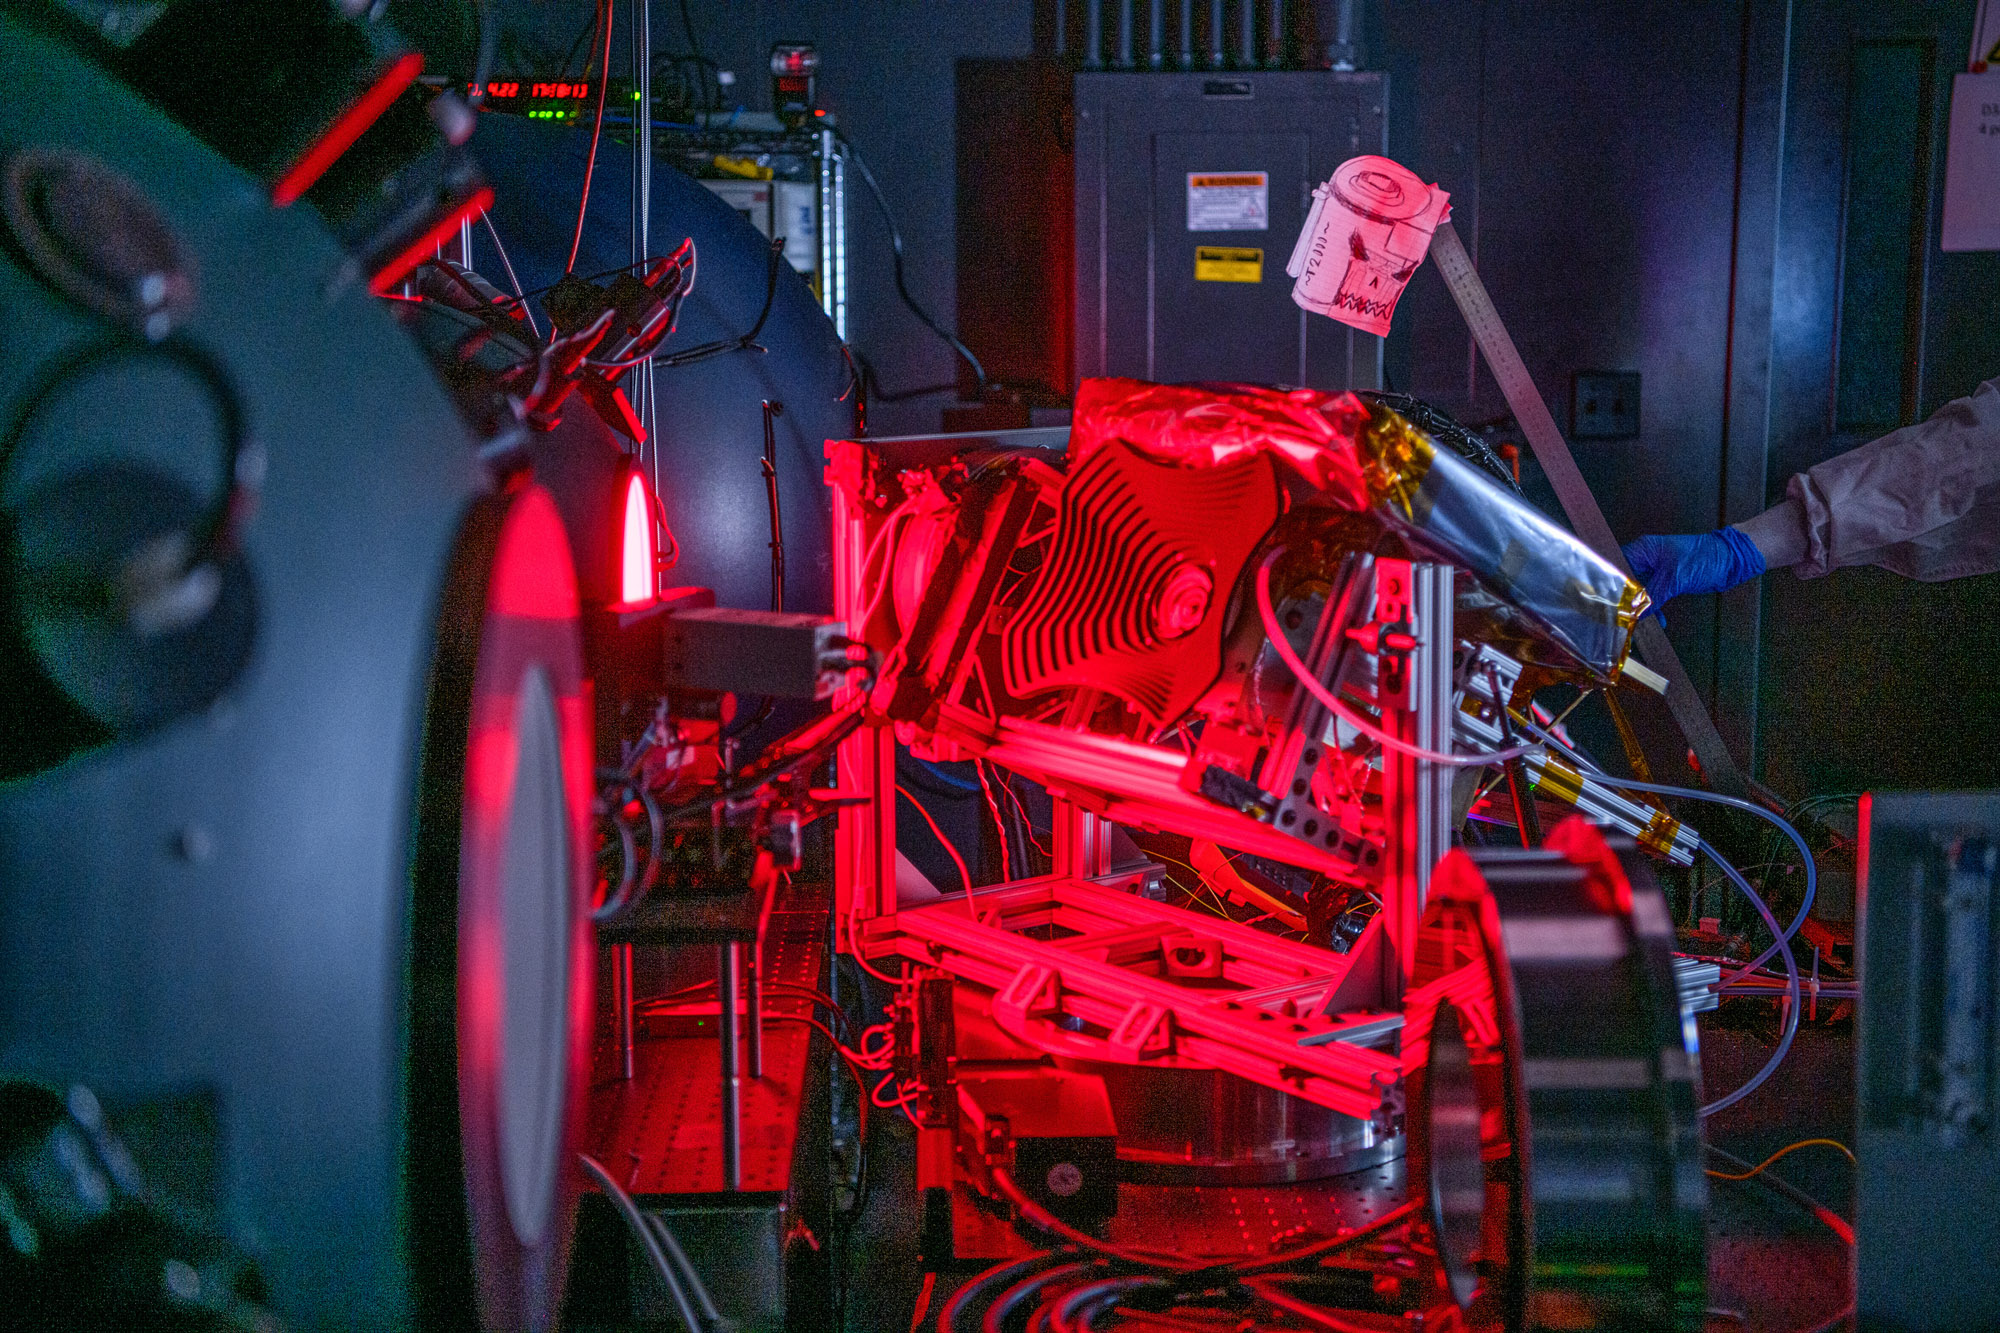
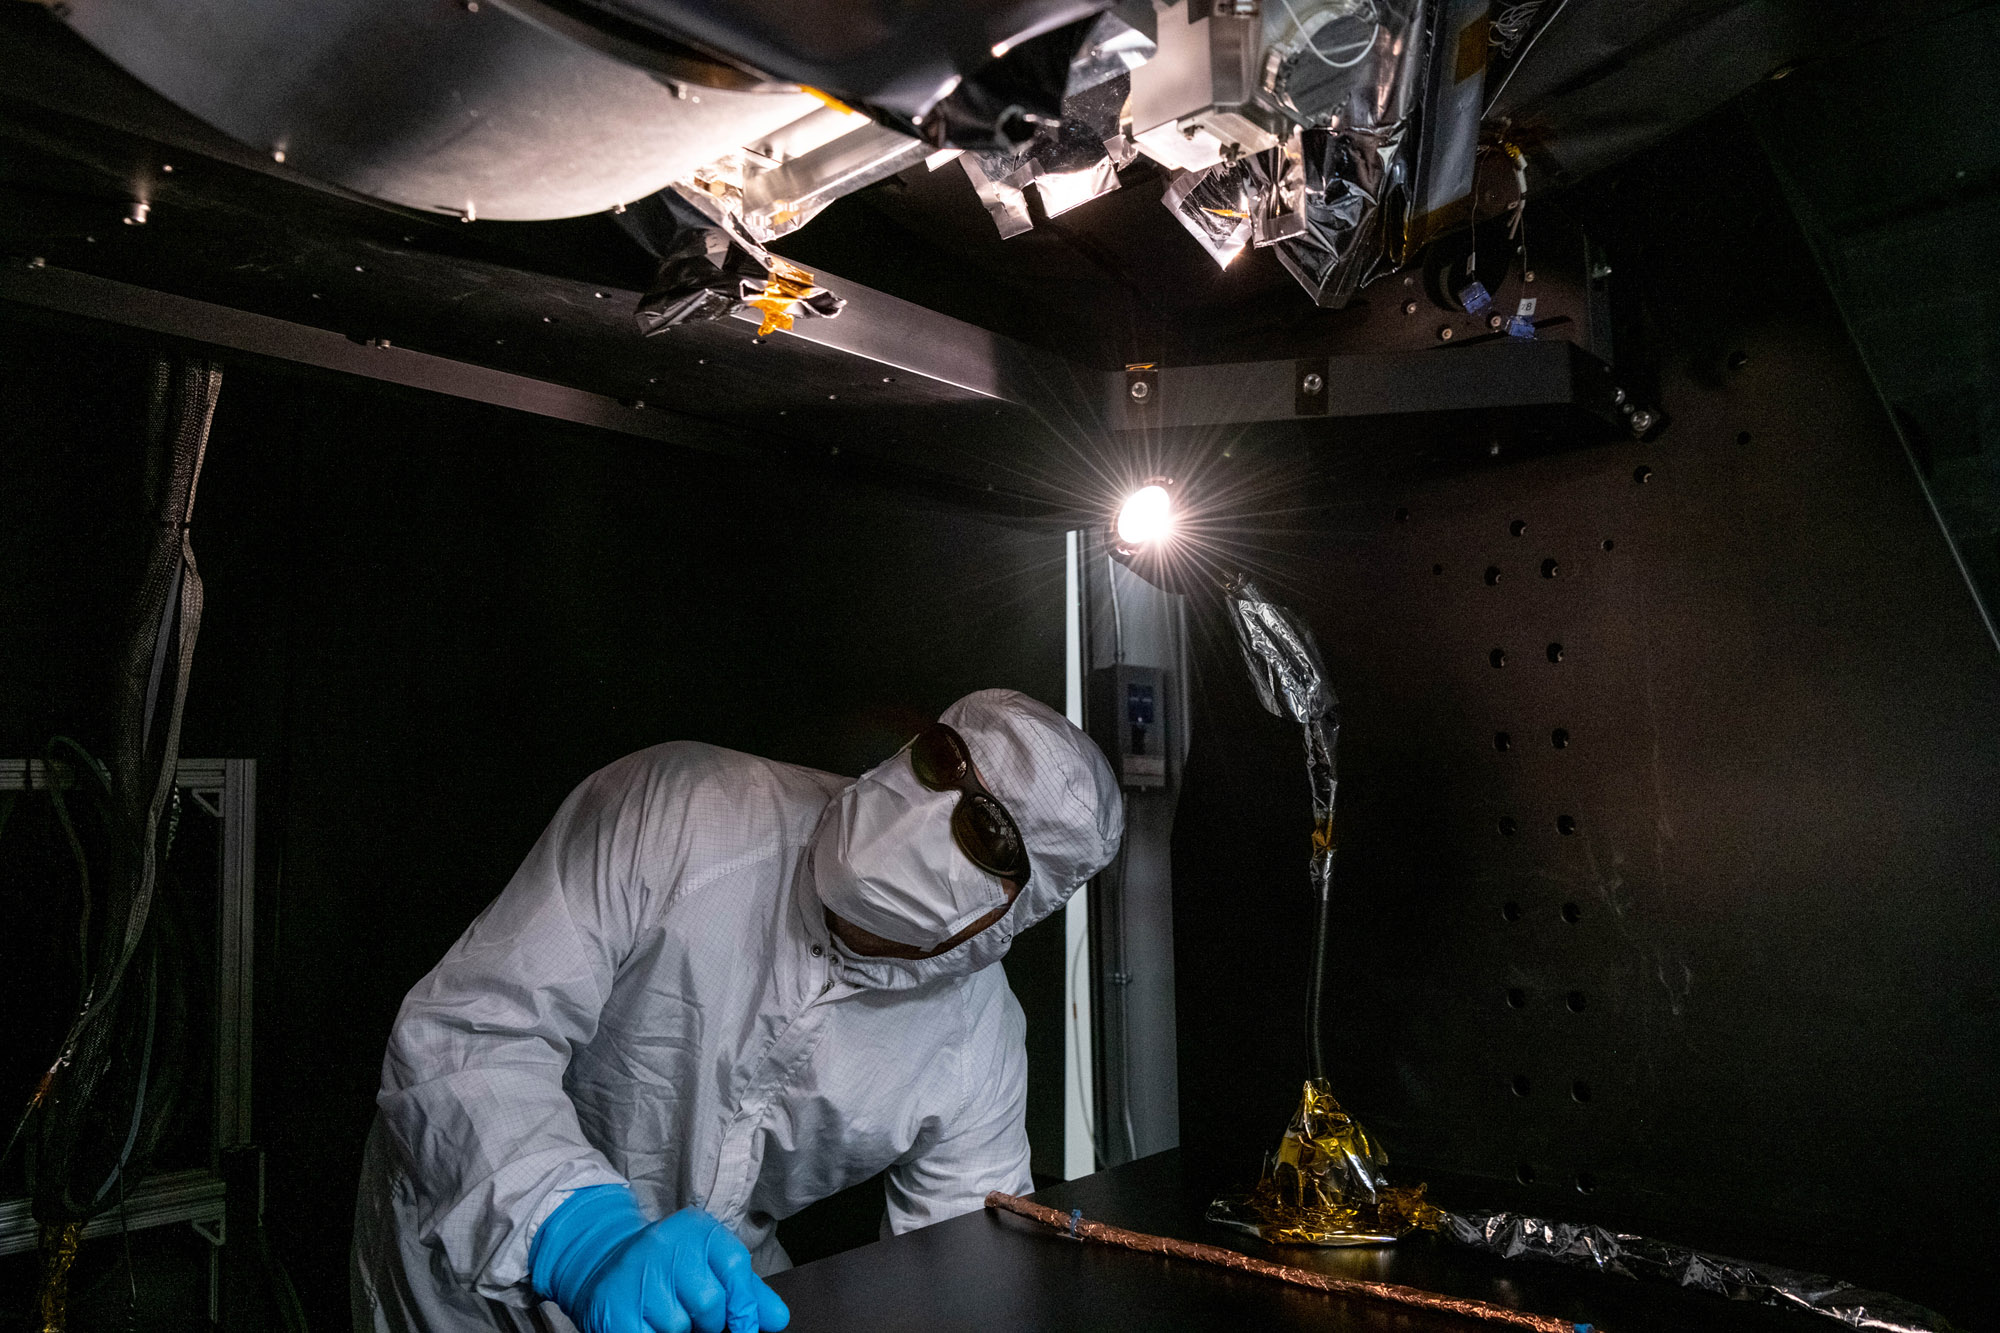
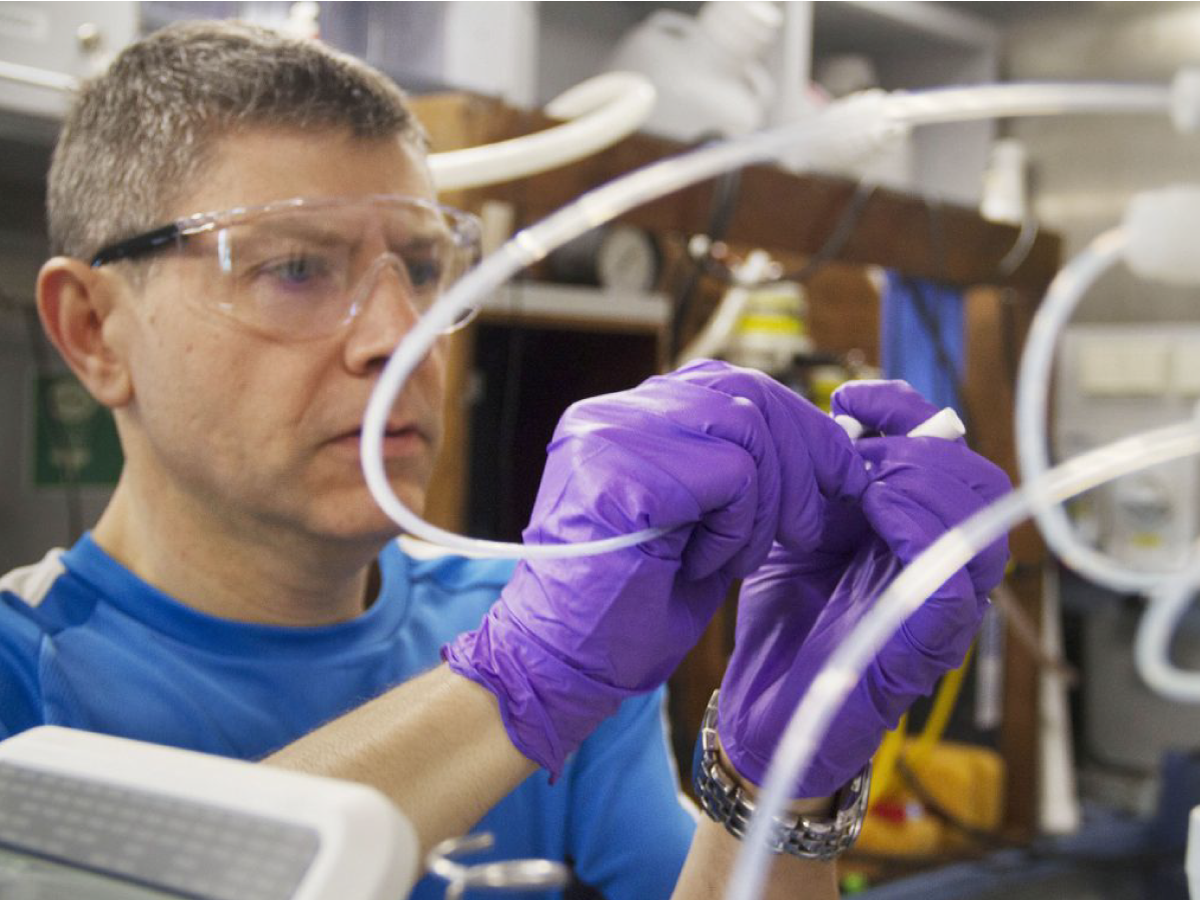
Systems engineer, Joseph Knuble, adjusts the intensity of the studio lamp during the Ocean Color Instrument stray light testing. Credit: Stover, Desiree
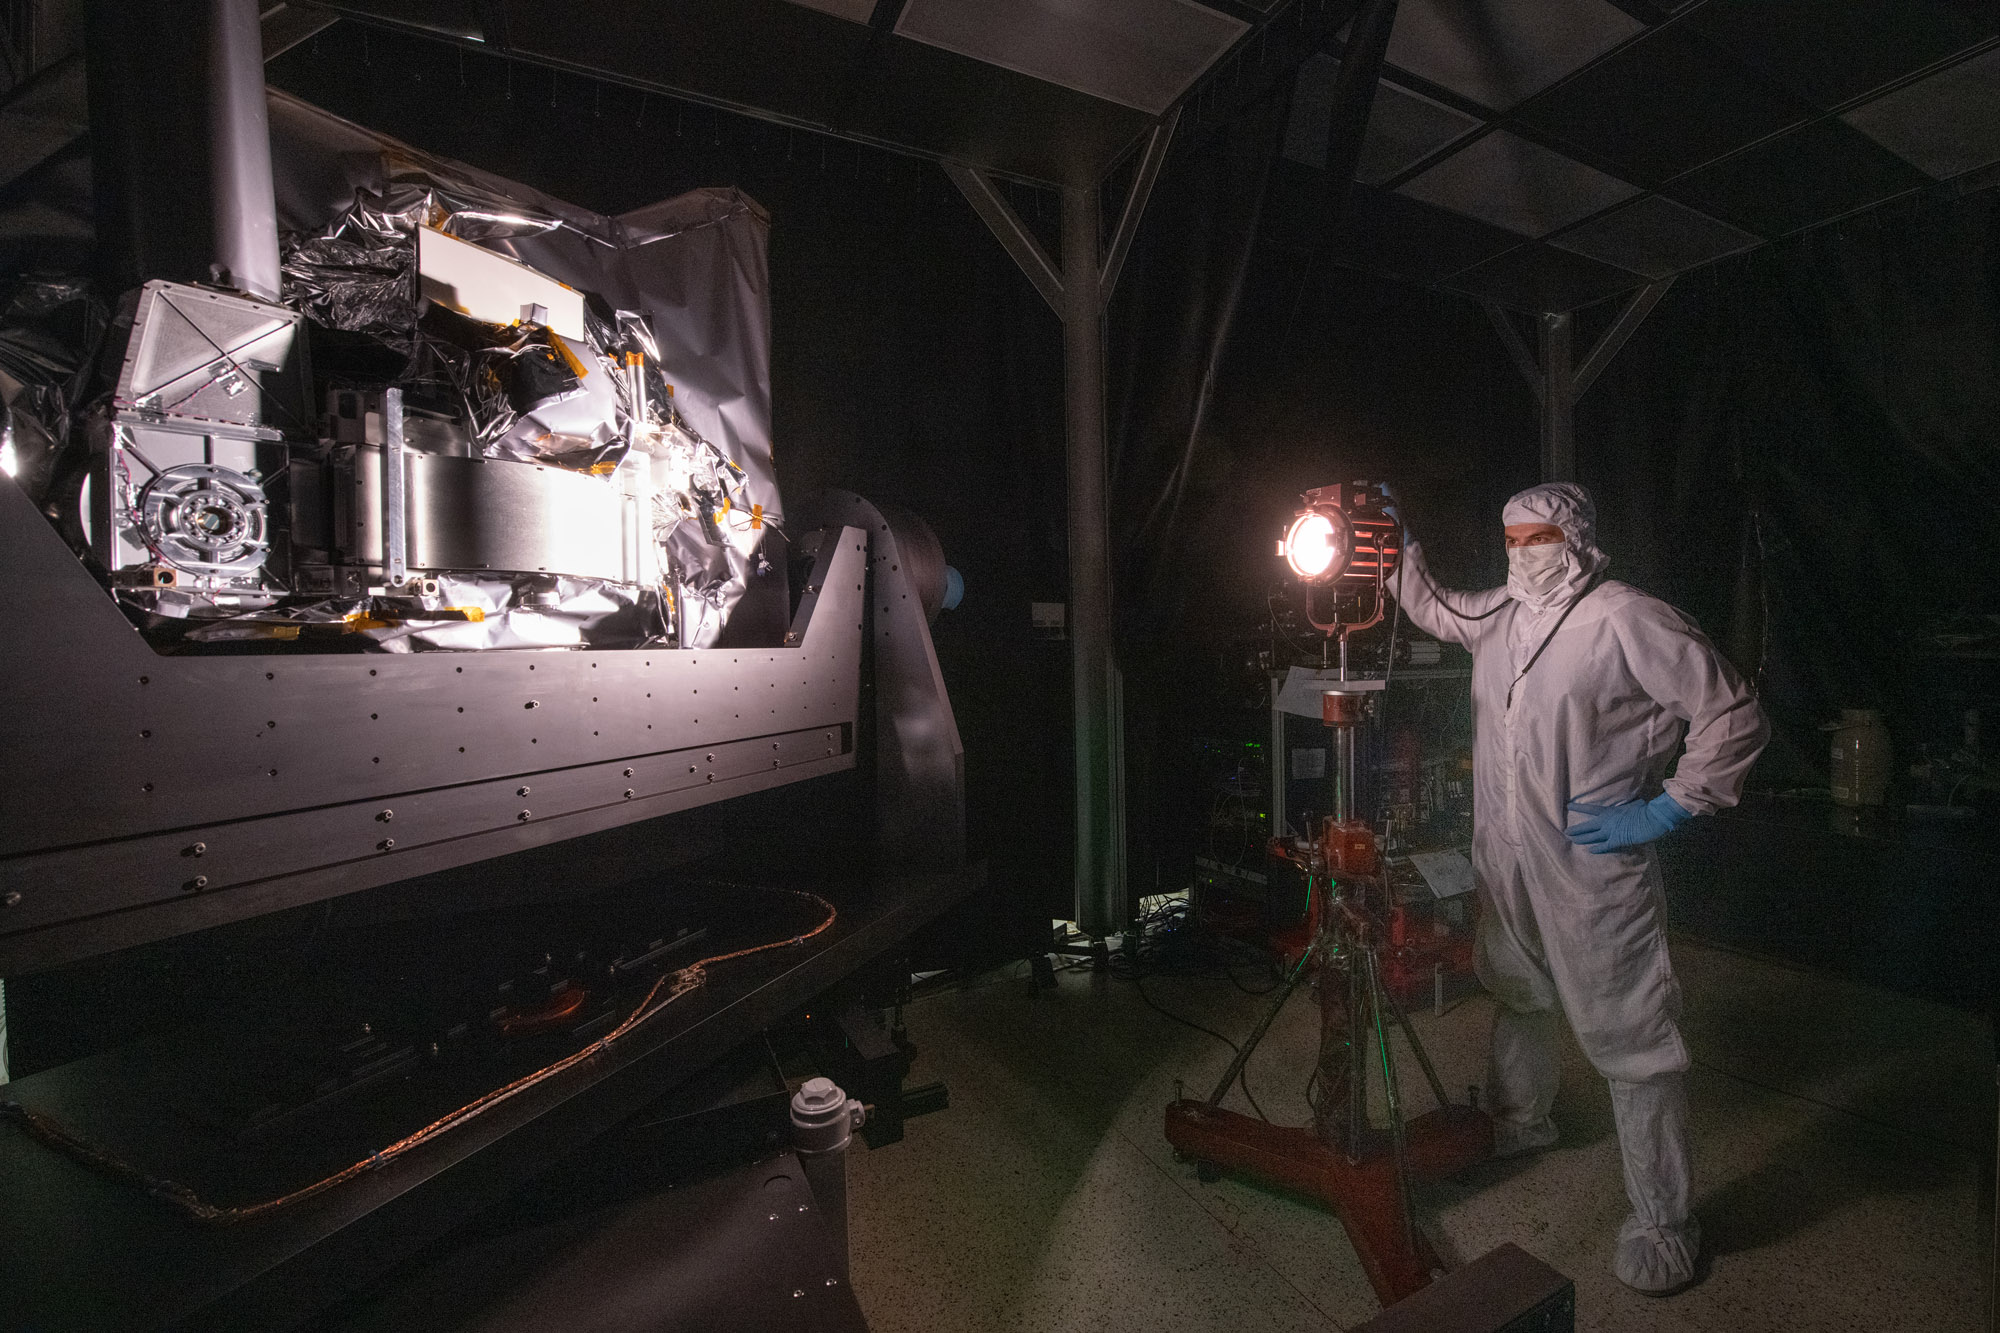
Systems engineer, Joseph Knuble, adjusts the intensity of the studio lamp during the Ocean Color Instrument stray light testing. Credit: Stover, Desiree
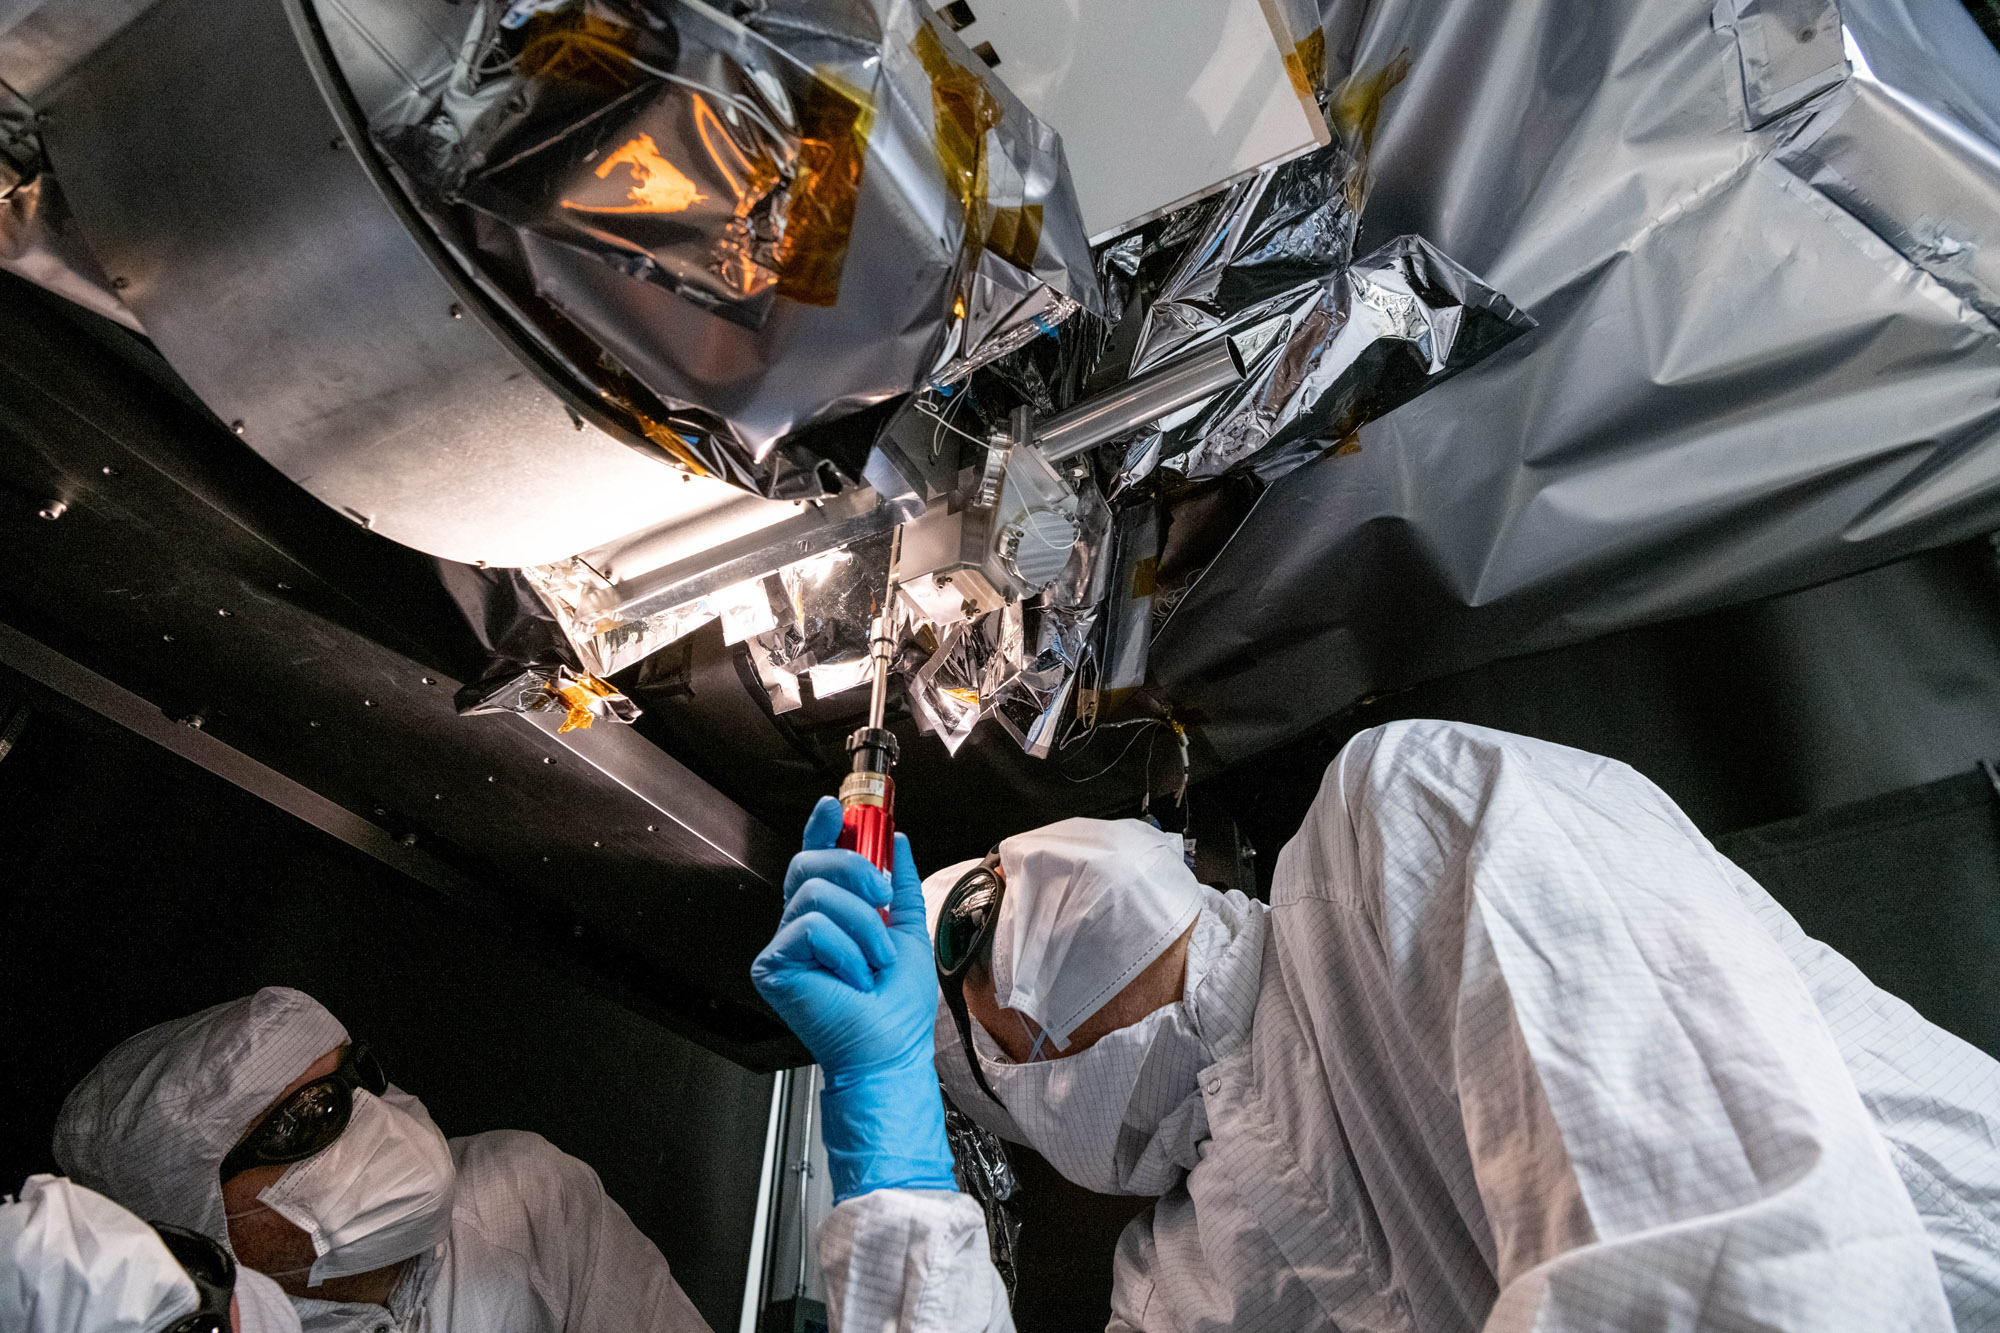
Mechanical technician, Thomas Huber, integrates the Short Wave Infrared (SWIR) Pulse Calibration Assembly (SPCA) fold mirror assembly to the Ocean Color Instrument. Credit: Mellos, Katherine
Manufacturing engineer, Roman Nilov, supervises the integration of the Short Wave Infrared (SWIR) Pulse Calibration Assembly (SPCA) fold mirror assembly to the Ocean Color Instrument. Credit: Mellos, Katherine
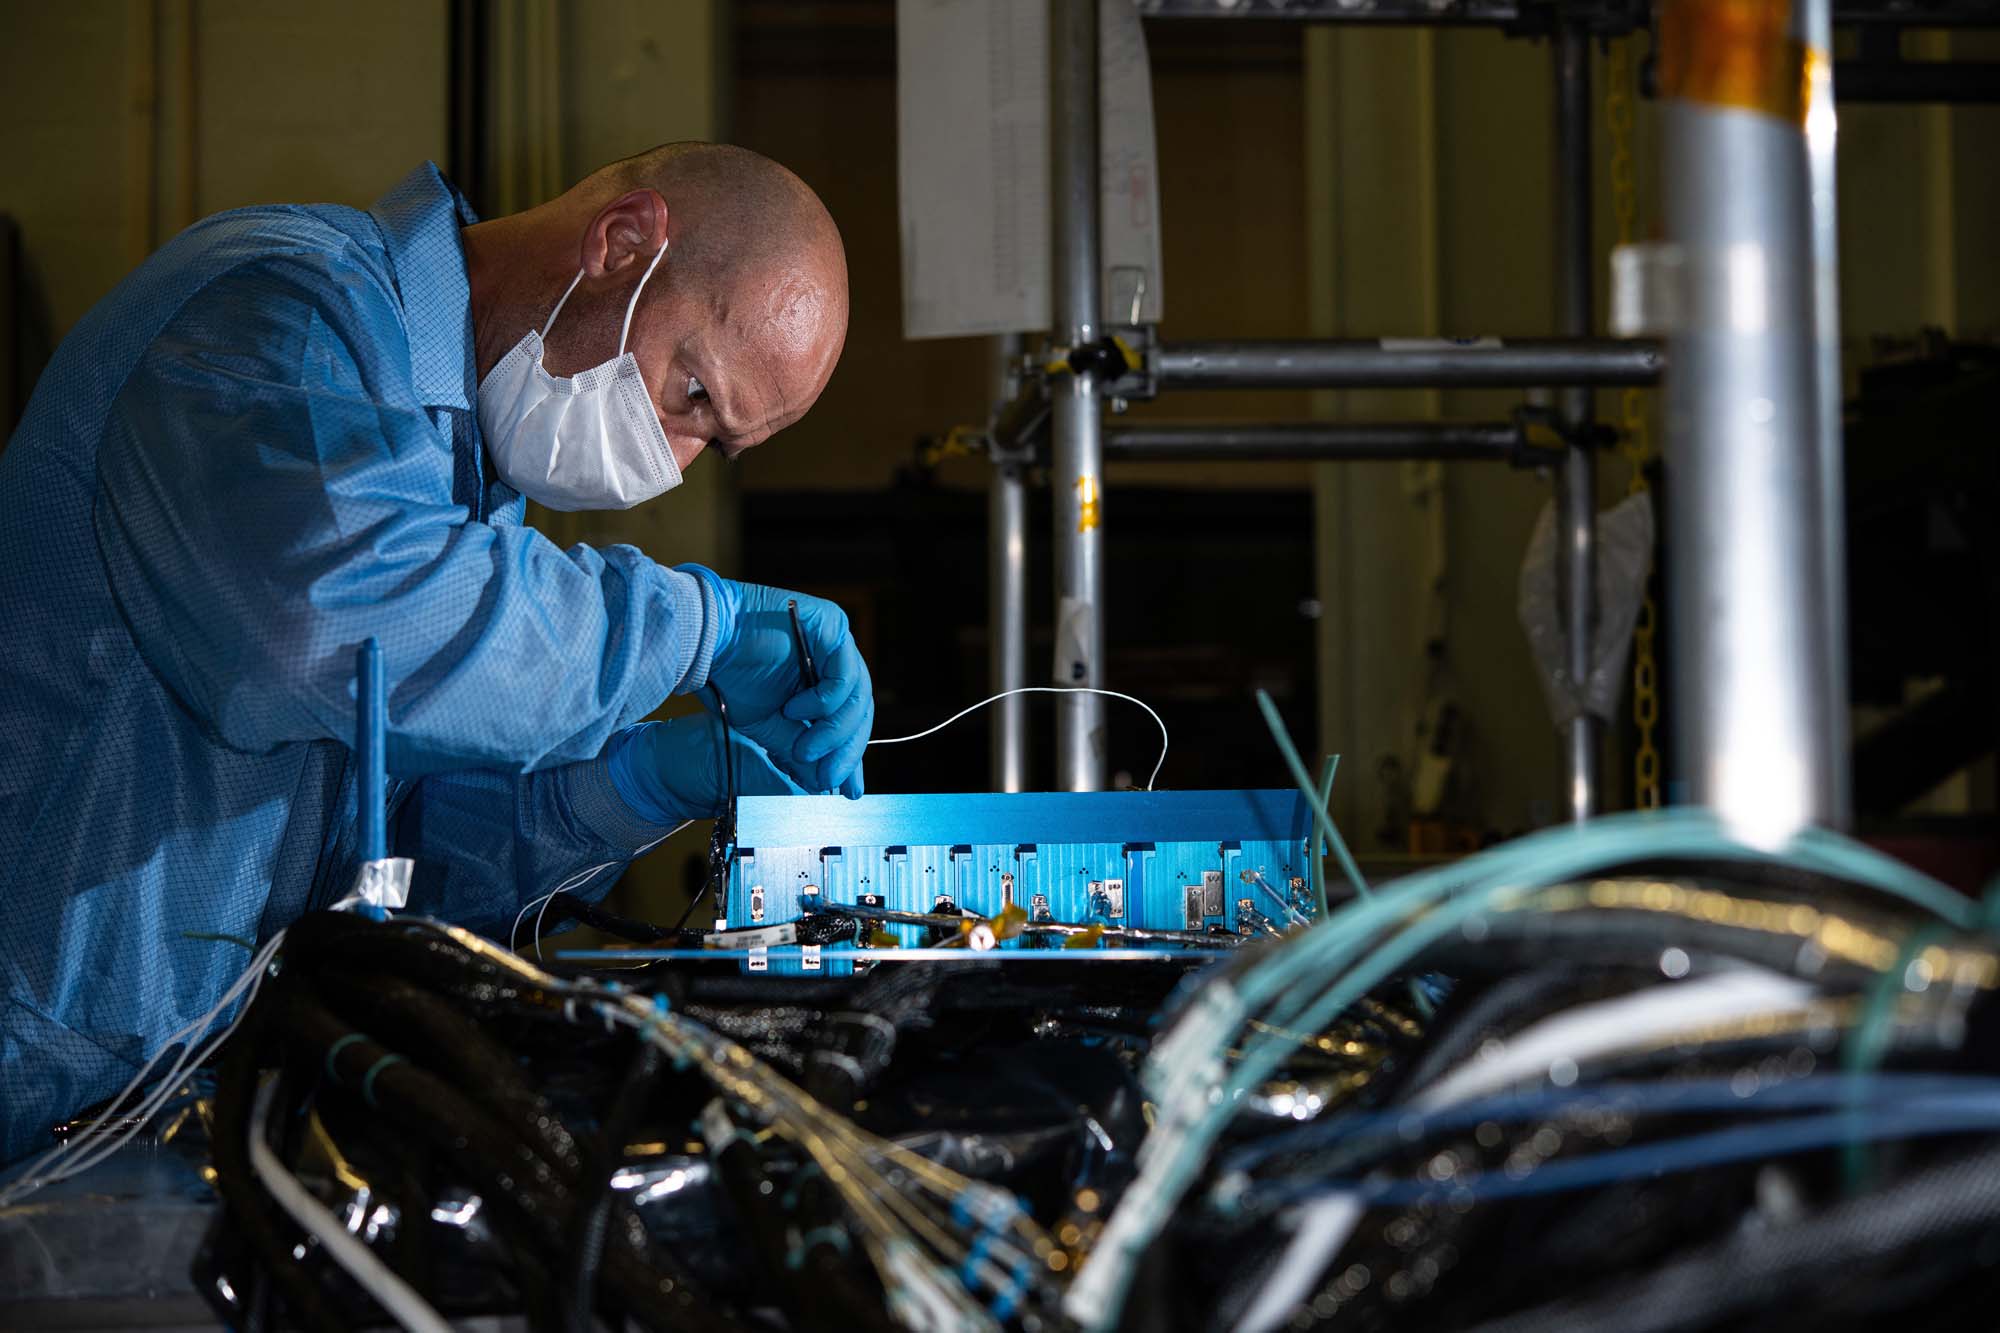
Inspecting Ocean Color Instrument Star Tracker command and data handling unit. Credit: Henry, Dennis (Denny)
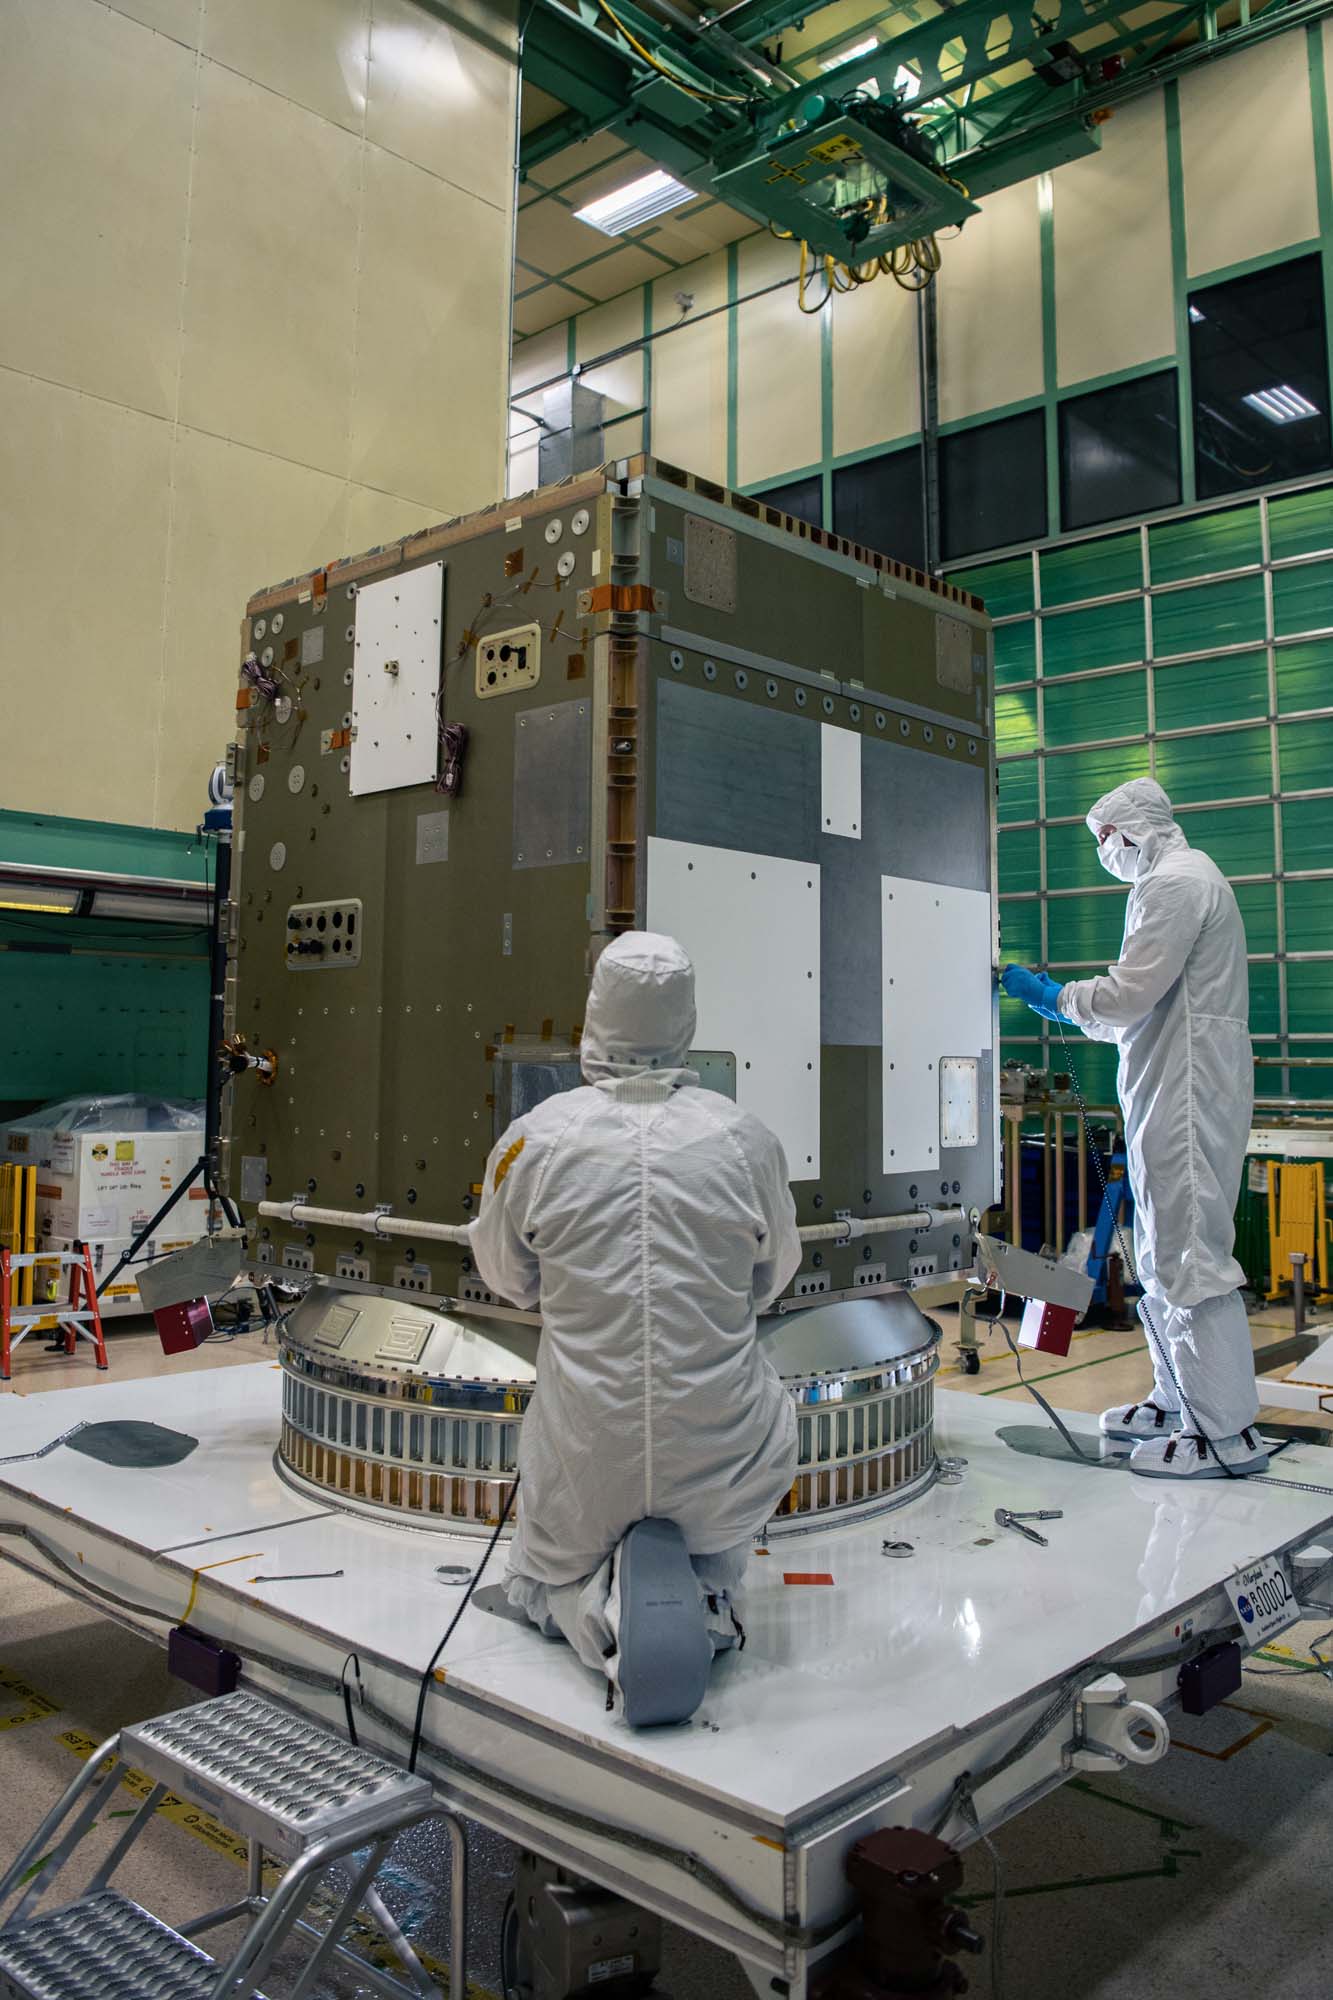
The Flight Ocean Color Instrument is installed onto the Ground Support Equipment Application for Tilt or Rotation (GAToR) Credit: Stover, Desiree
Mechanical Technicians Daniel Dizon and Joseph Eddy transport the Ocean Color Instrument Earth Shade into the thermal vacuum chamber. Credit: Mellos, Katherine
Mechanical Technicians Daniel Dizon and Joseph Eddy install the Ocean Color Instrument Earth Shade into the thermal vacuum chamber. Credit: Mellos, Katherine
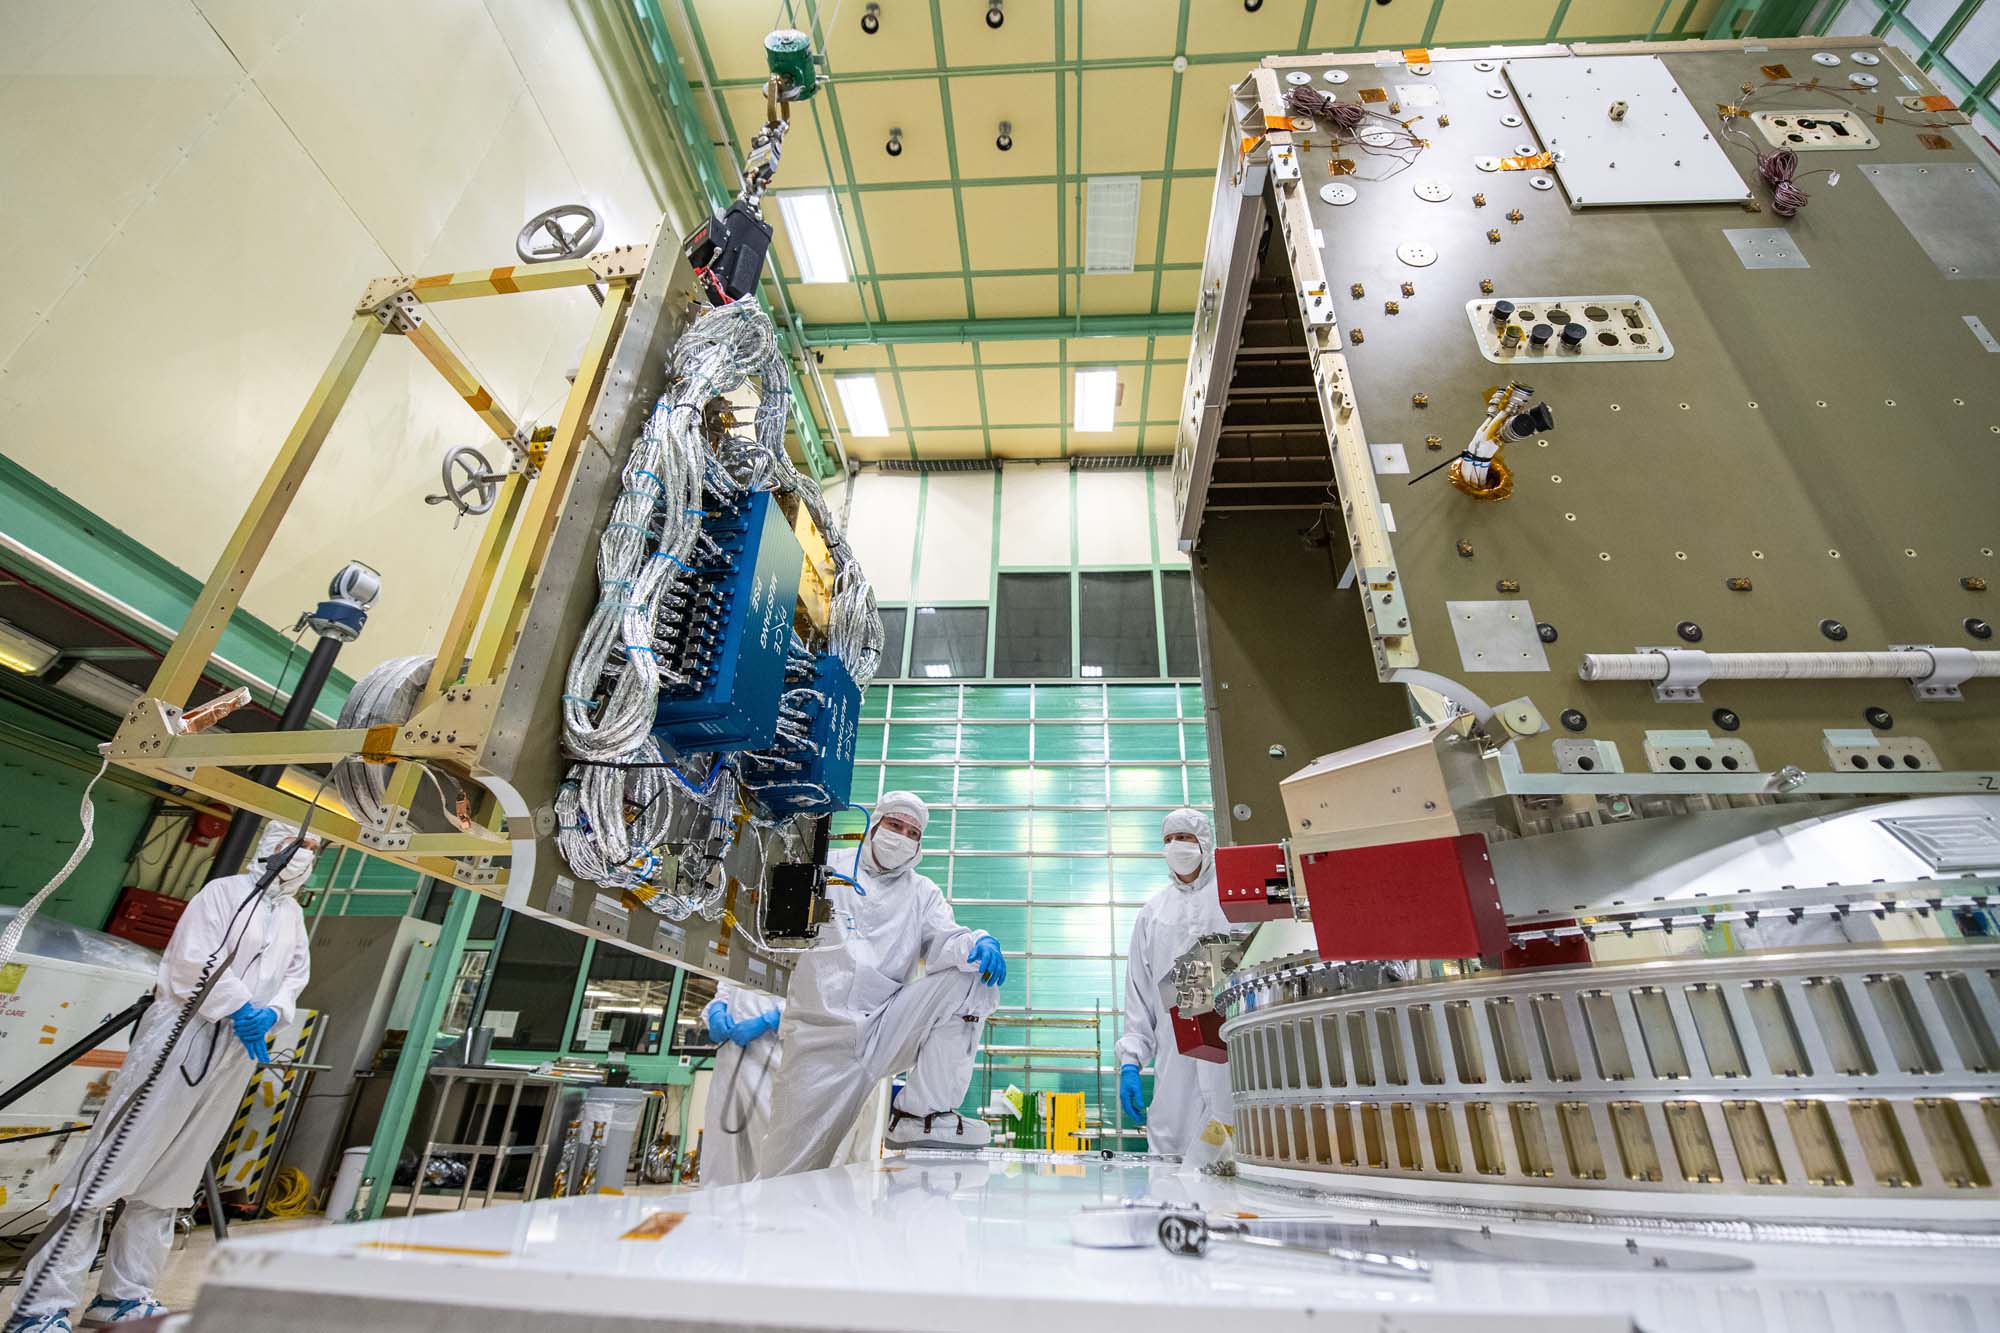
Mechanical technician Joseph Eddy and mechcanical engineer Peter Steigner install the Ocean Color Instrument Radiator Support Structure (RSS) struts to the Instrument Deck Structure (IDS). Credit: Stover, Desiree
Mechanical Technician, John Poulsen, installs flight hardware during the Ocean Color Instrument post Optical Module (OM) integration to the Flight Instrument Deck Structure (IDS). Credit: Mellos, Katherine
Mechanical Engineer Paul Dizon and Mechanical Technician Daniel Dizon with the Ocean Color Instrument. Credit: Stover, Desiree
Mechanical technician Andrew Scharmann aligns the Ocean Color Instrument Focal Plane Assemblies (FPAs). Credit: Stover, Desiree
Mechanical technician Andrew Scharmann stabilizes harnesses while Daniel Dizon rotates the Ocean Color Instrument Optical Module for additional integration activities as mechanical engineer Michael Mulloney observes. Credit: Stover, Desiree
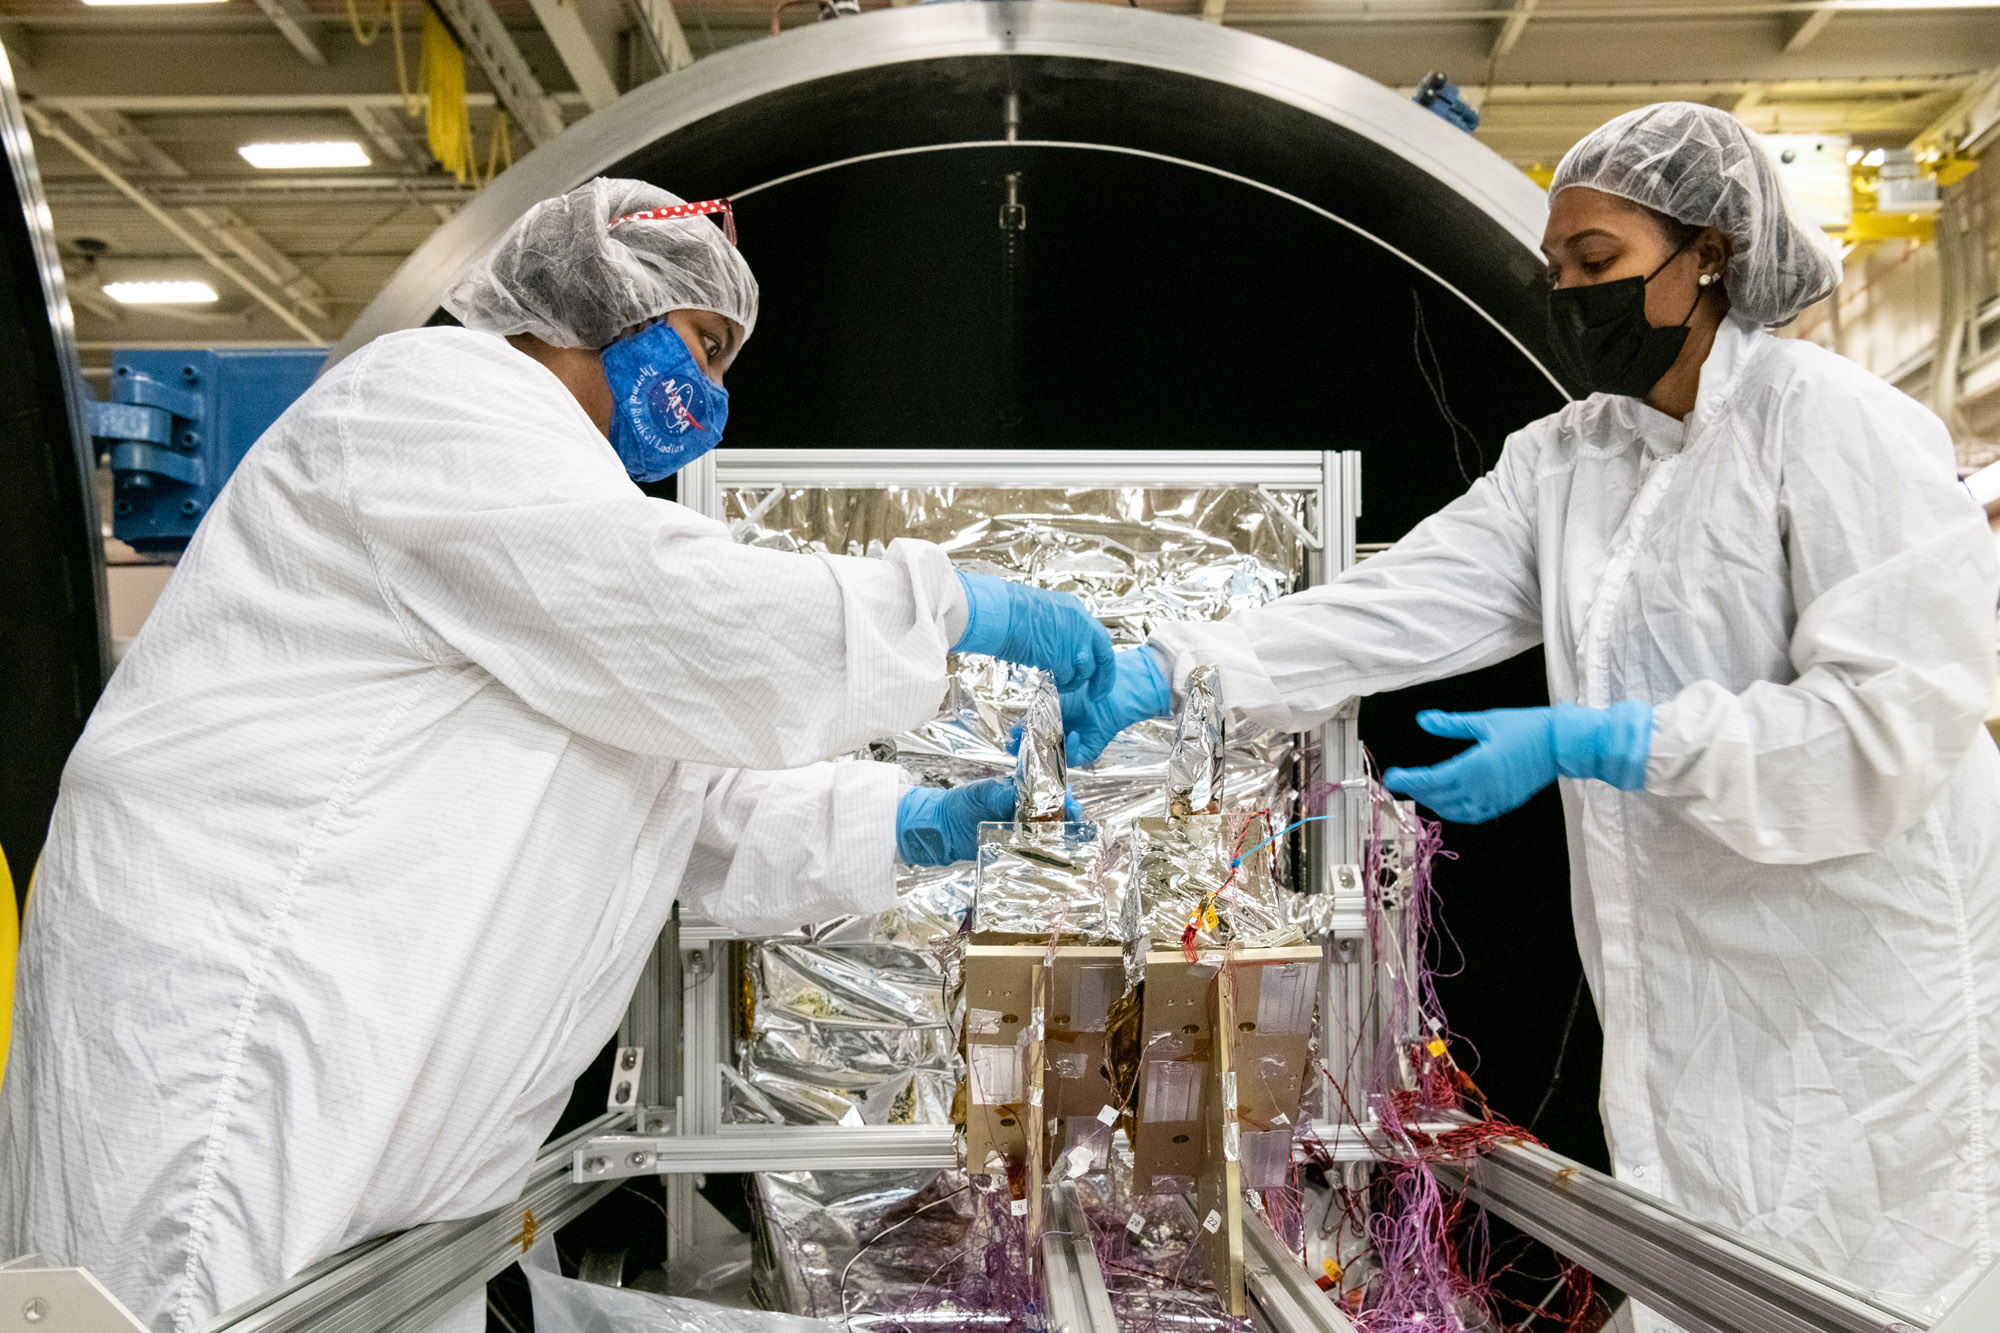
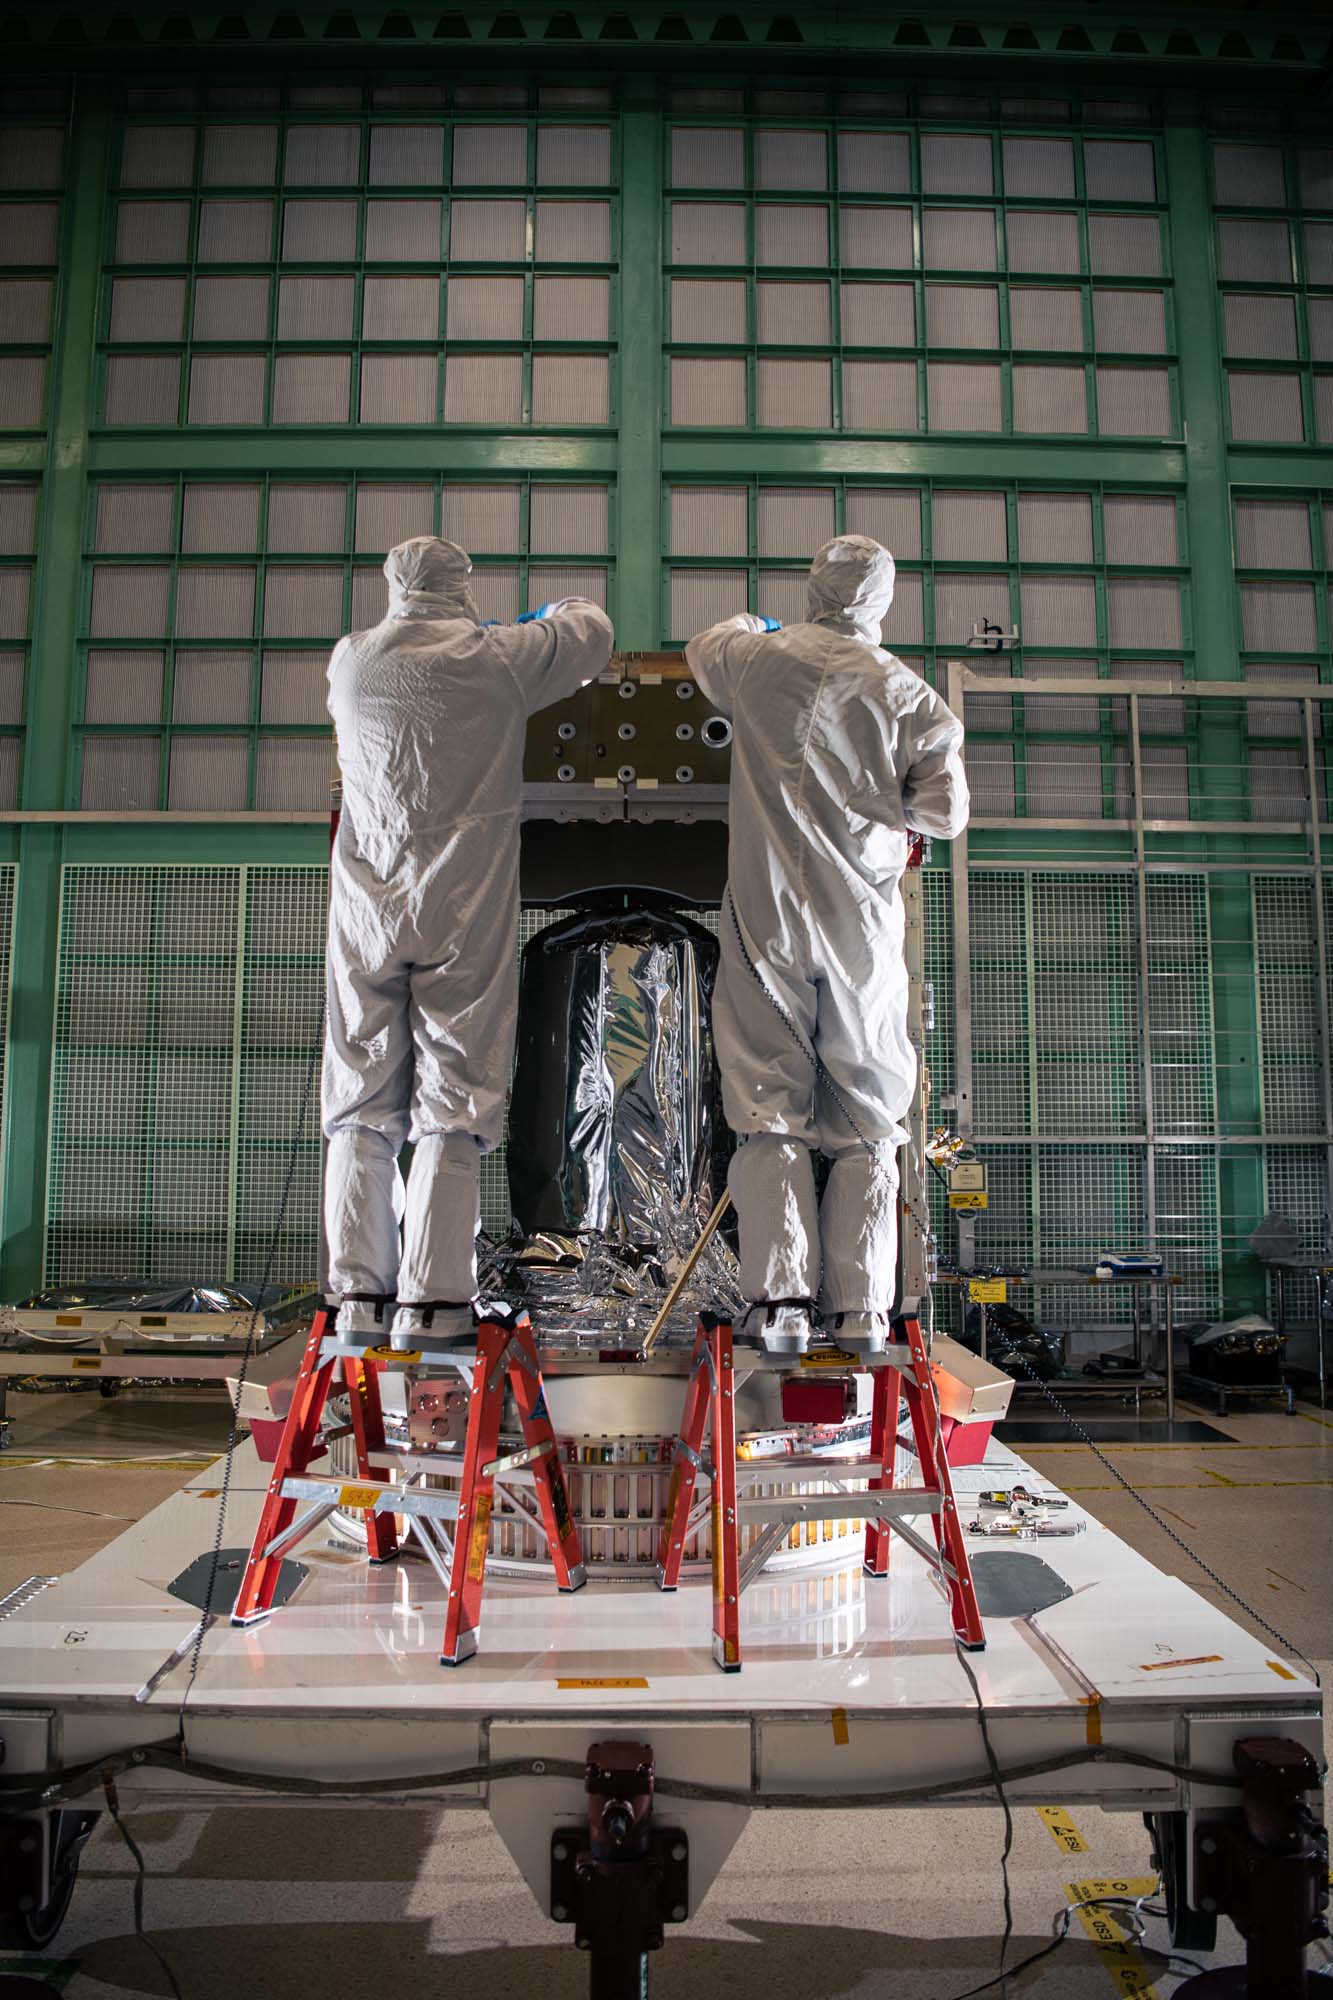
Paula Cain and Aldine Joseph-Pierre apply thermal blanketing to the Ocean Color Instrument Loop Heat Pipes (LHP) prior to thermal vacuum testing. Credit: Mellos, Katherine
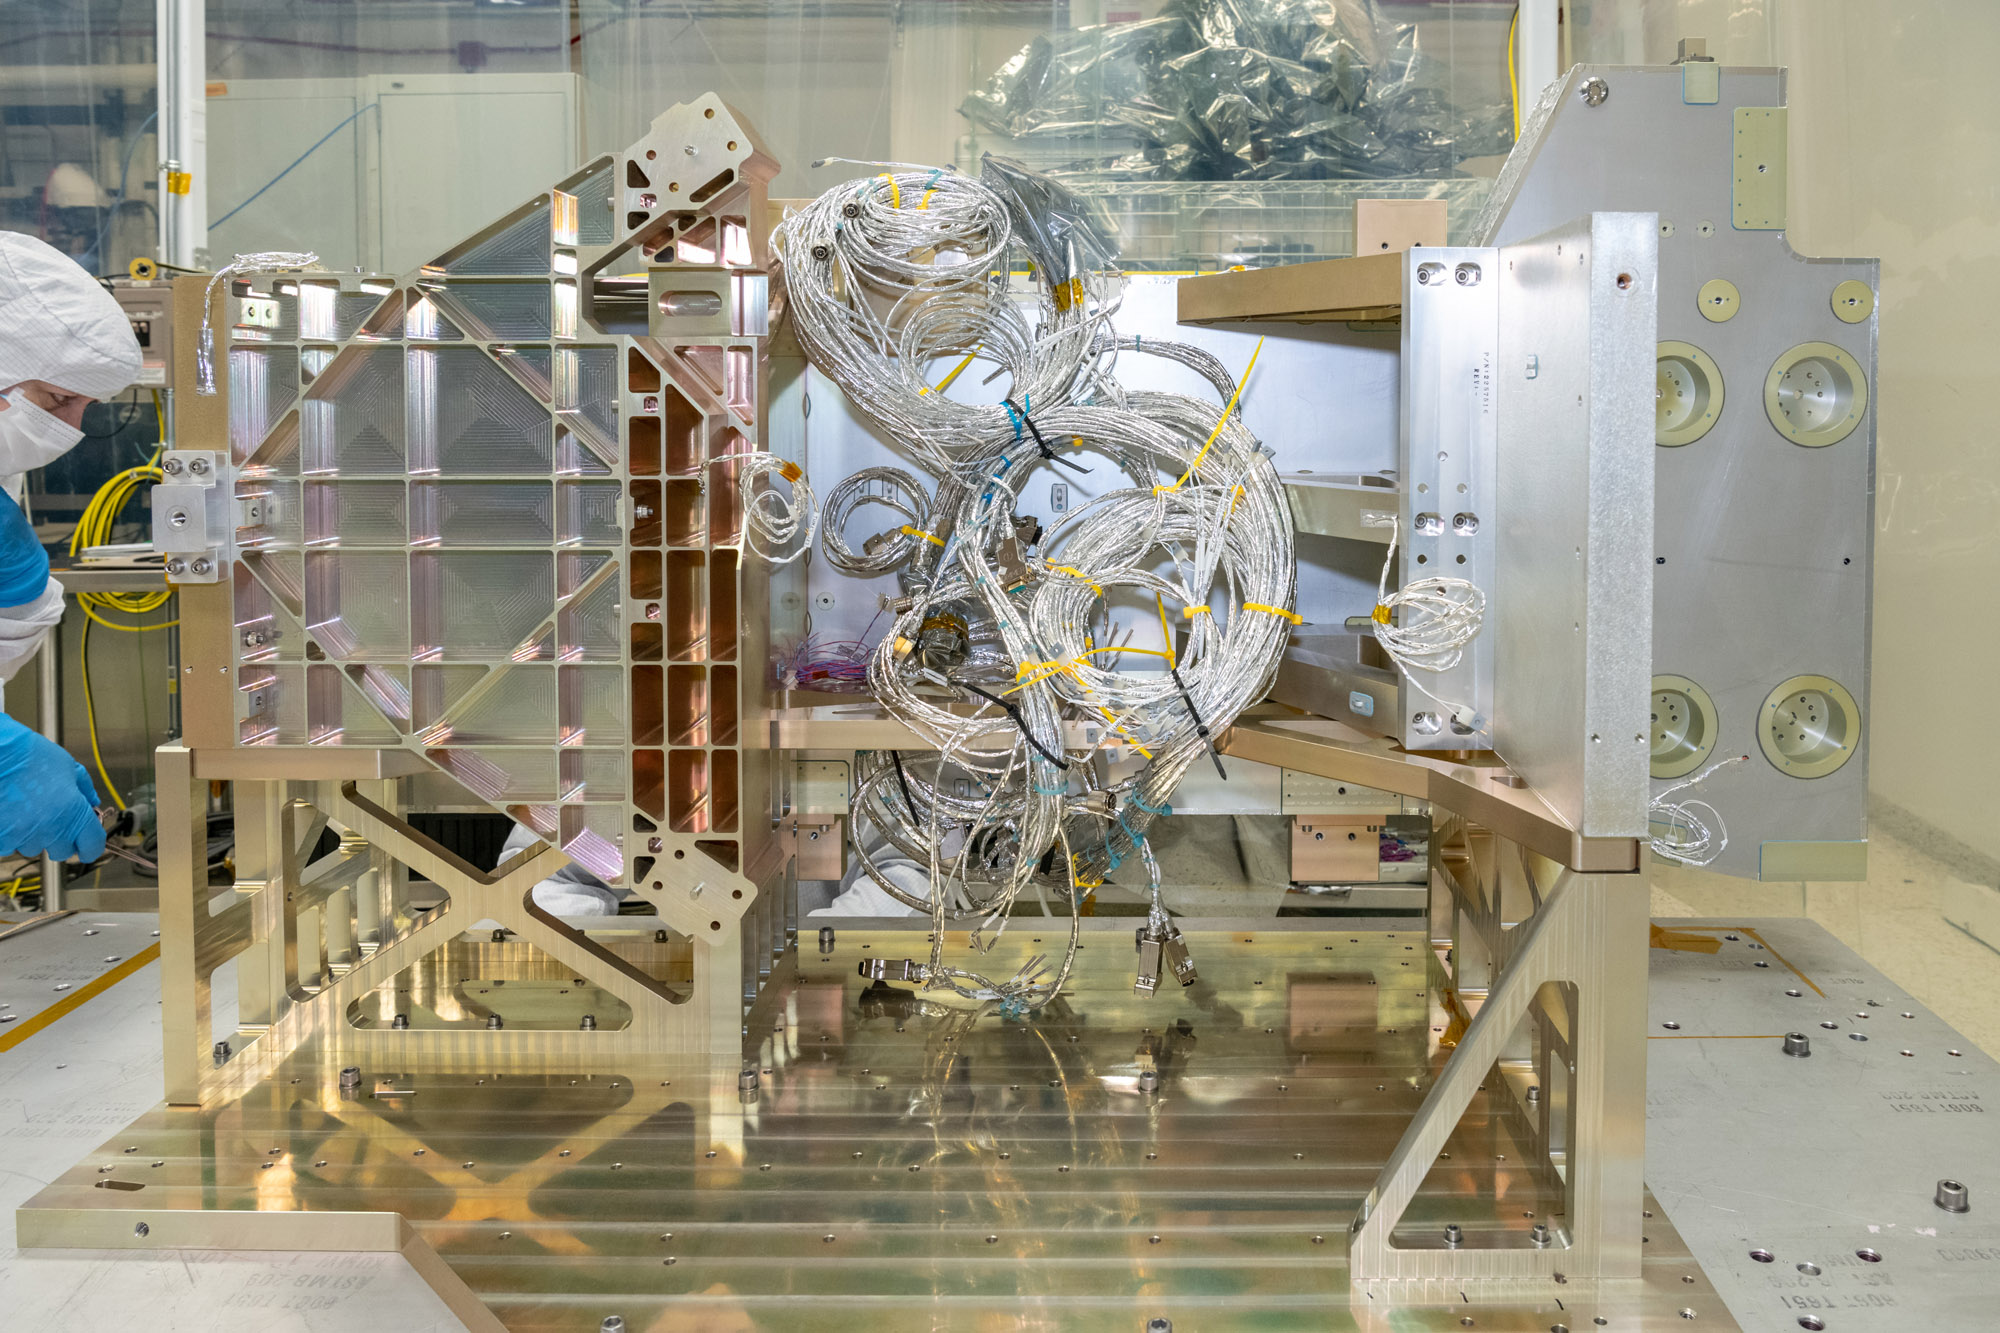
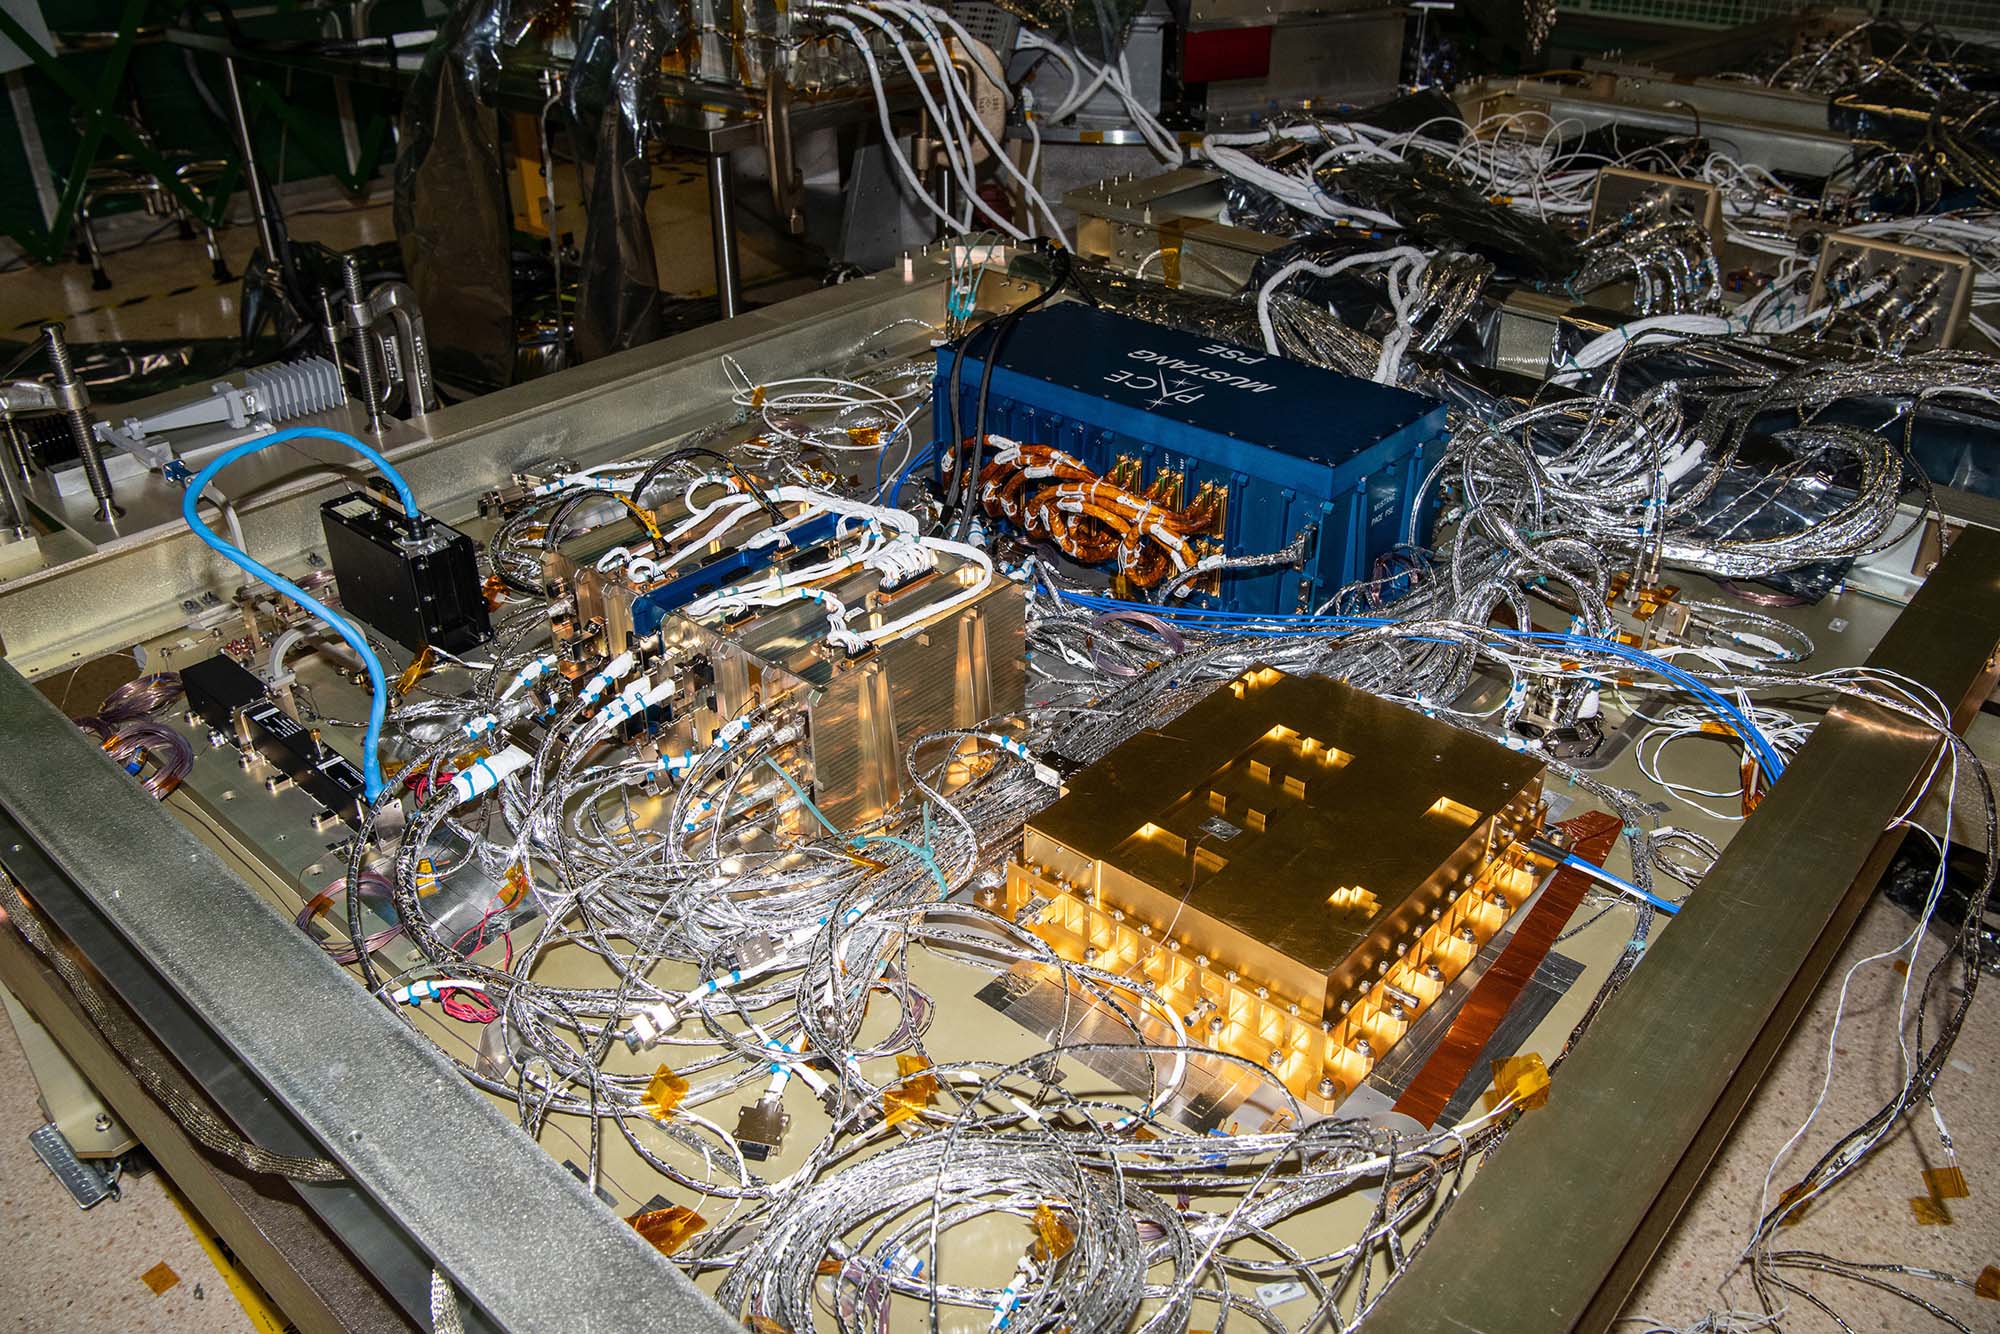
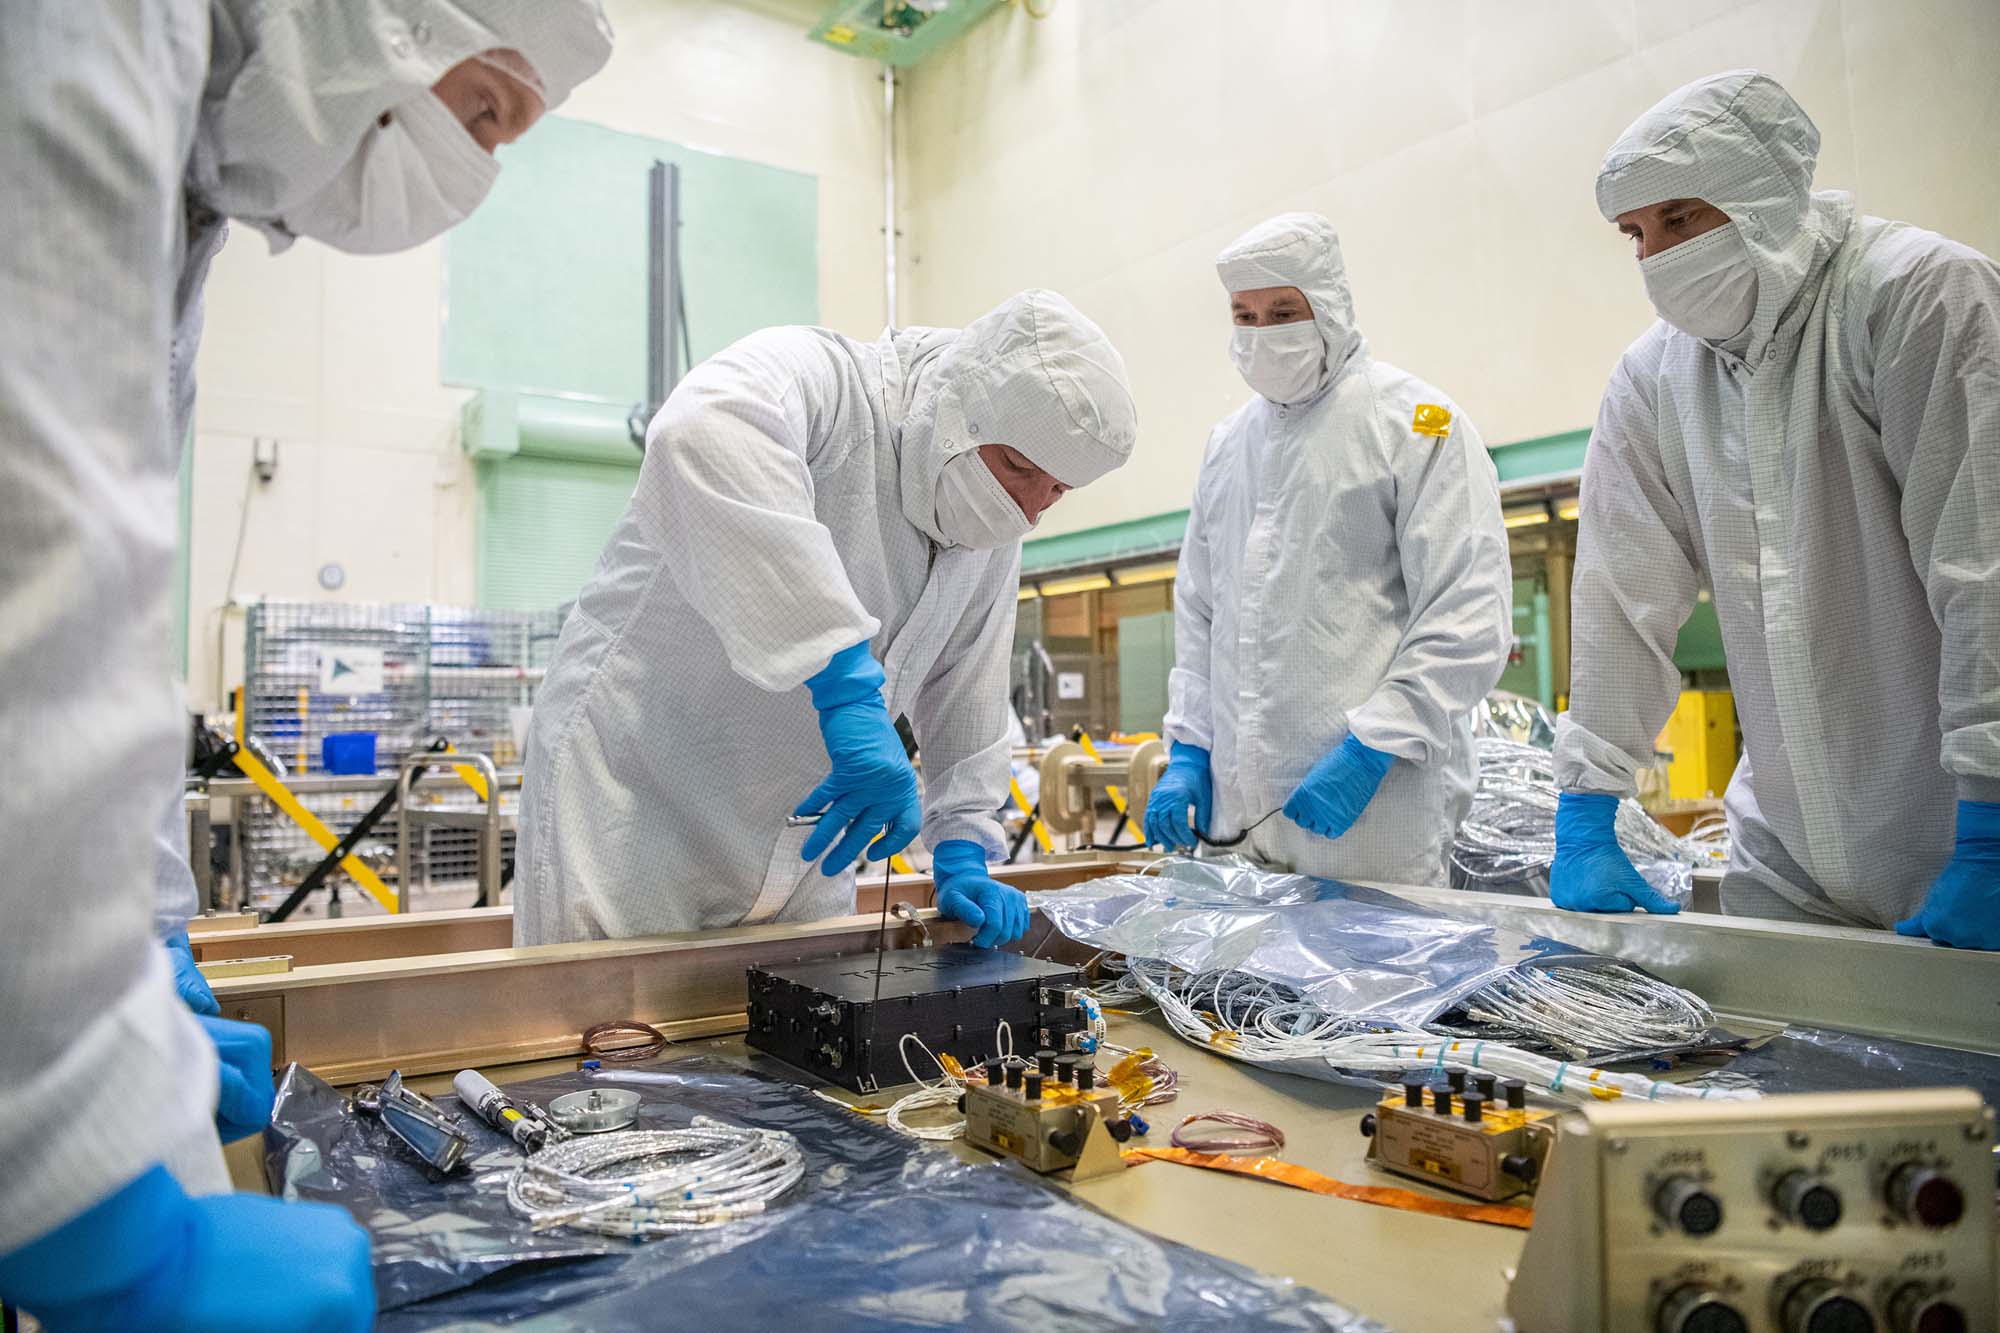
Electrical harnesses are installed and prepped for electronic box integrations on the Ocean Color Instrument's Instrument Deck Structure (IDS). Credit: Mellos, Katherine
Mechanical technician Daniel Dizon stabilizes the Ocean Color Instrument Optical Module after a rotation for additional integration activities as mechanical engineer Michael Mulloney observes. Credit: Mellos, Katherine
Mechanical technicians reorient the Ocean Color Instrument Optical Module on the rotation fixture for additional hardware integration. Credit: Mellos, Katherine
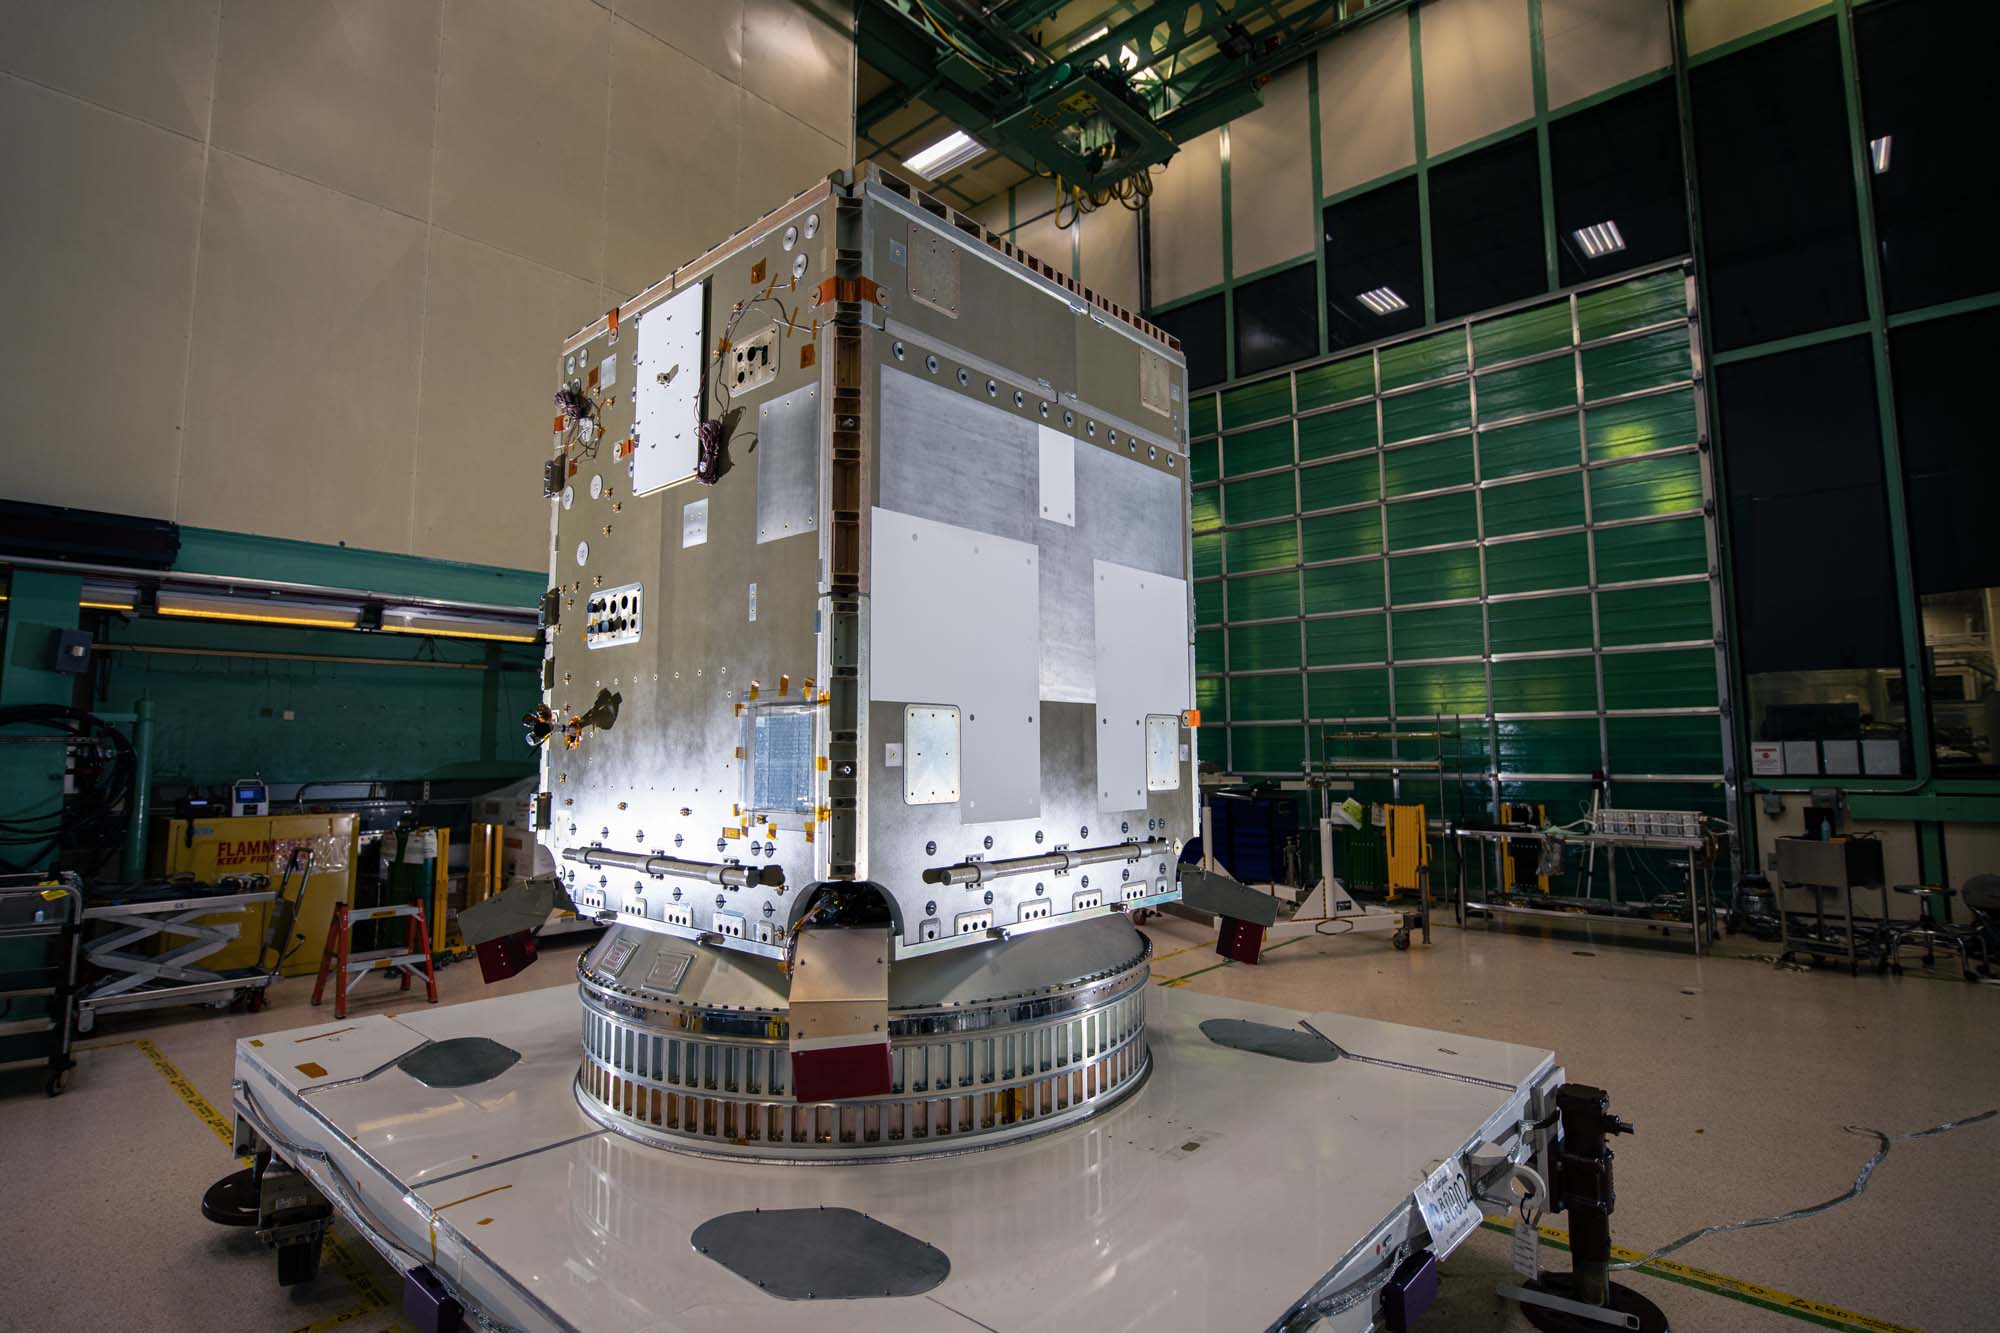
The Ocean Color Instrument Optical Module (OM) at Goddard Space Flight Center. Credit: Stover, Desiree
Members of the Ocean Color Instrument Main Optics Sub Bench (MOSB) integration team pose with the hardware prior to its integration onto the Main Optics Bench (MOB). Credit: Stover, Desiree
Mechanical technician Joseph Eddy guides the Ocean Color Instrument Main Optics Bench (MOB) to the LISARD turnover fixture overseen by quality engineer George Brooks. Credit: Stover, Desiree
Blanket technicians discuss thermal templates on the Ocean Color Instrument Instrument Deck Structure (IDS) at Goddard Space Flight Center. Credit: Mellos, Katherine
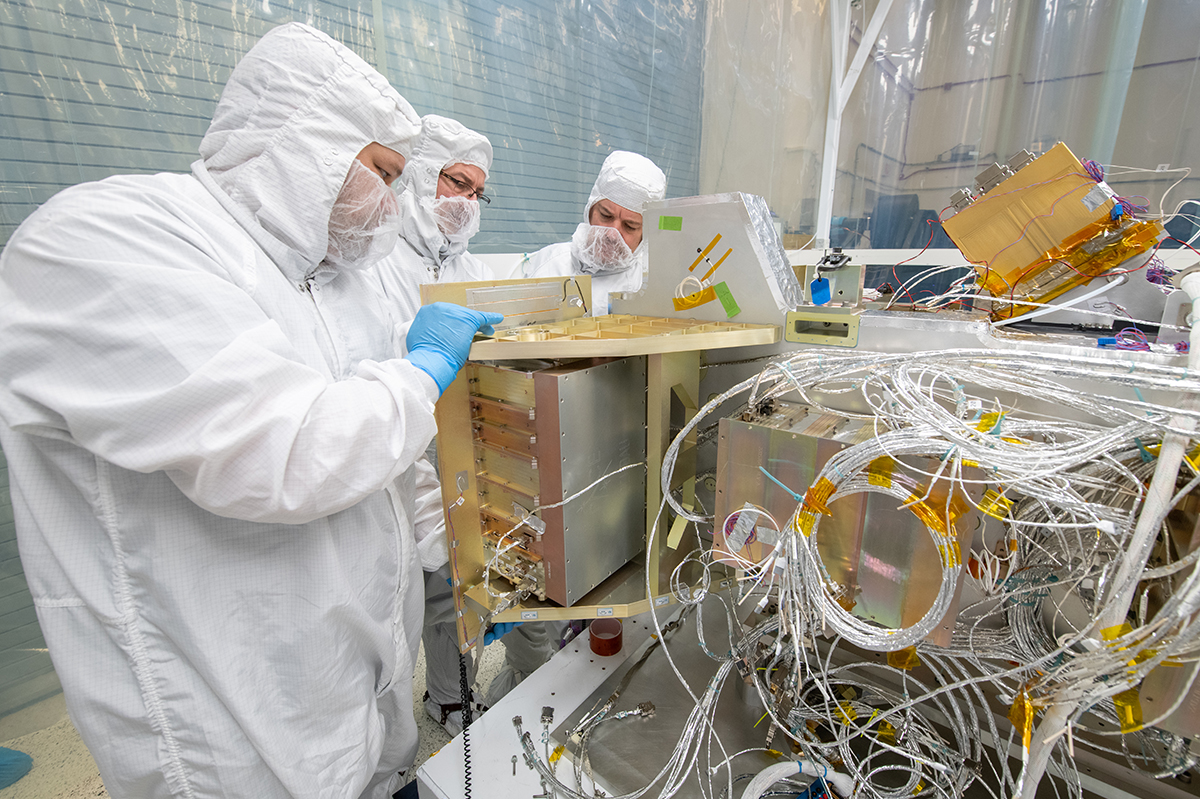
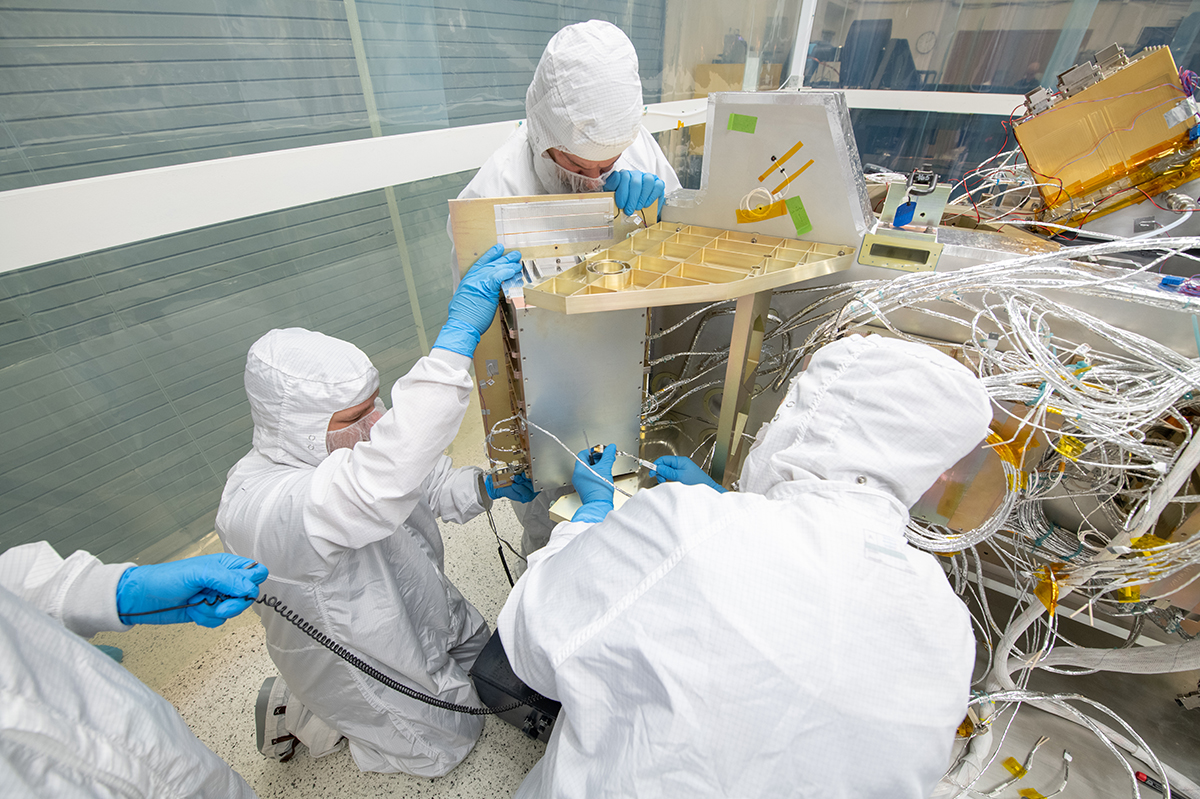
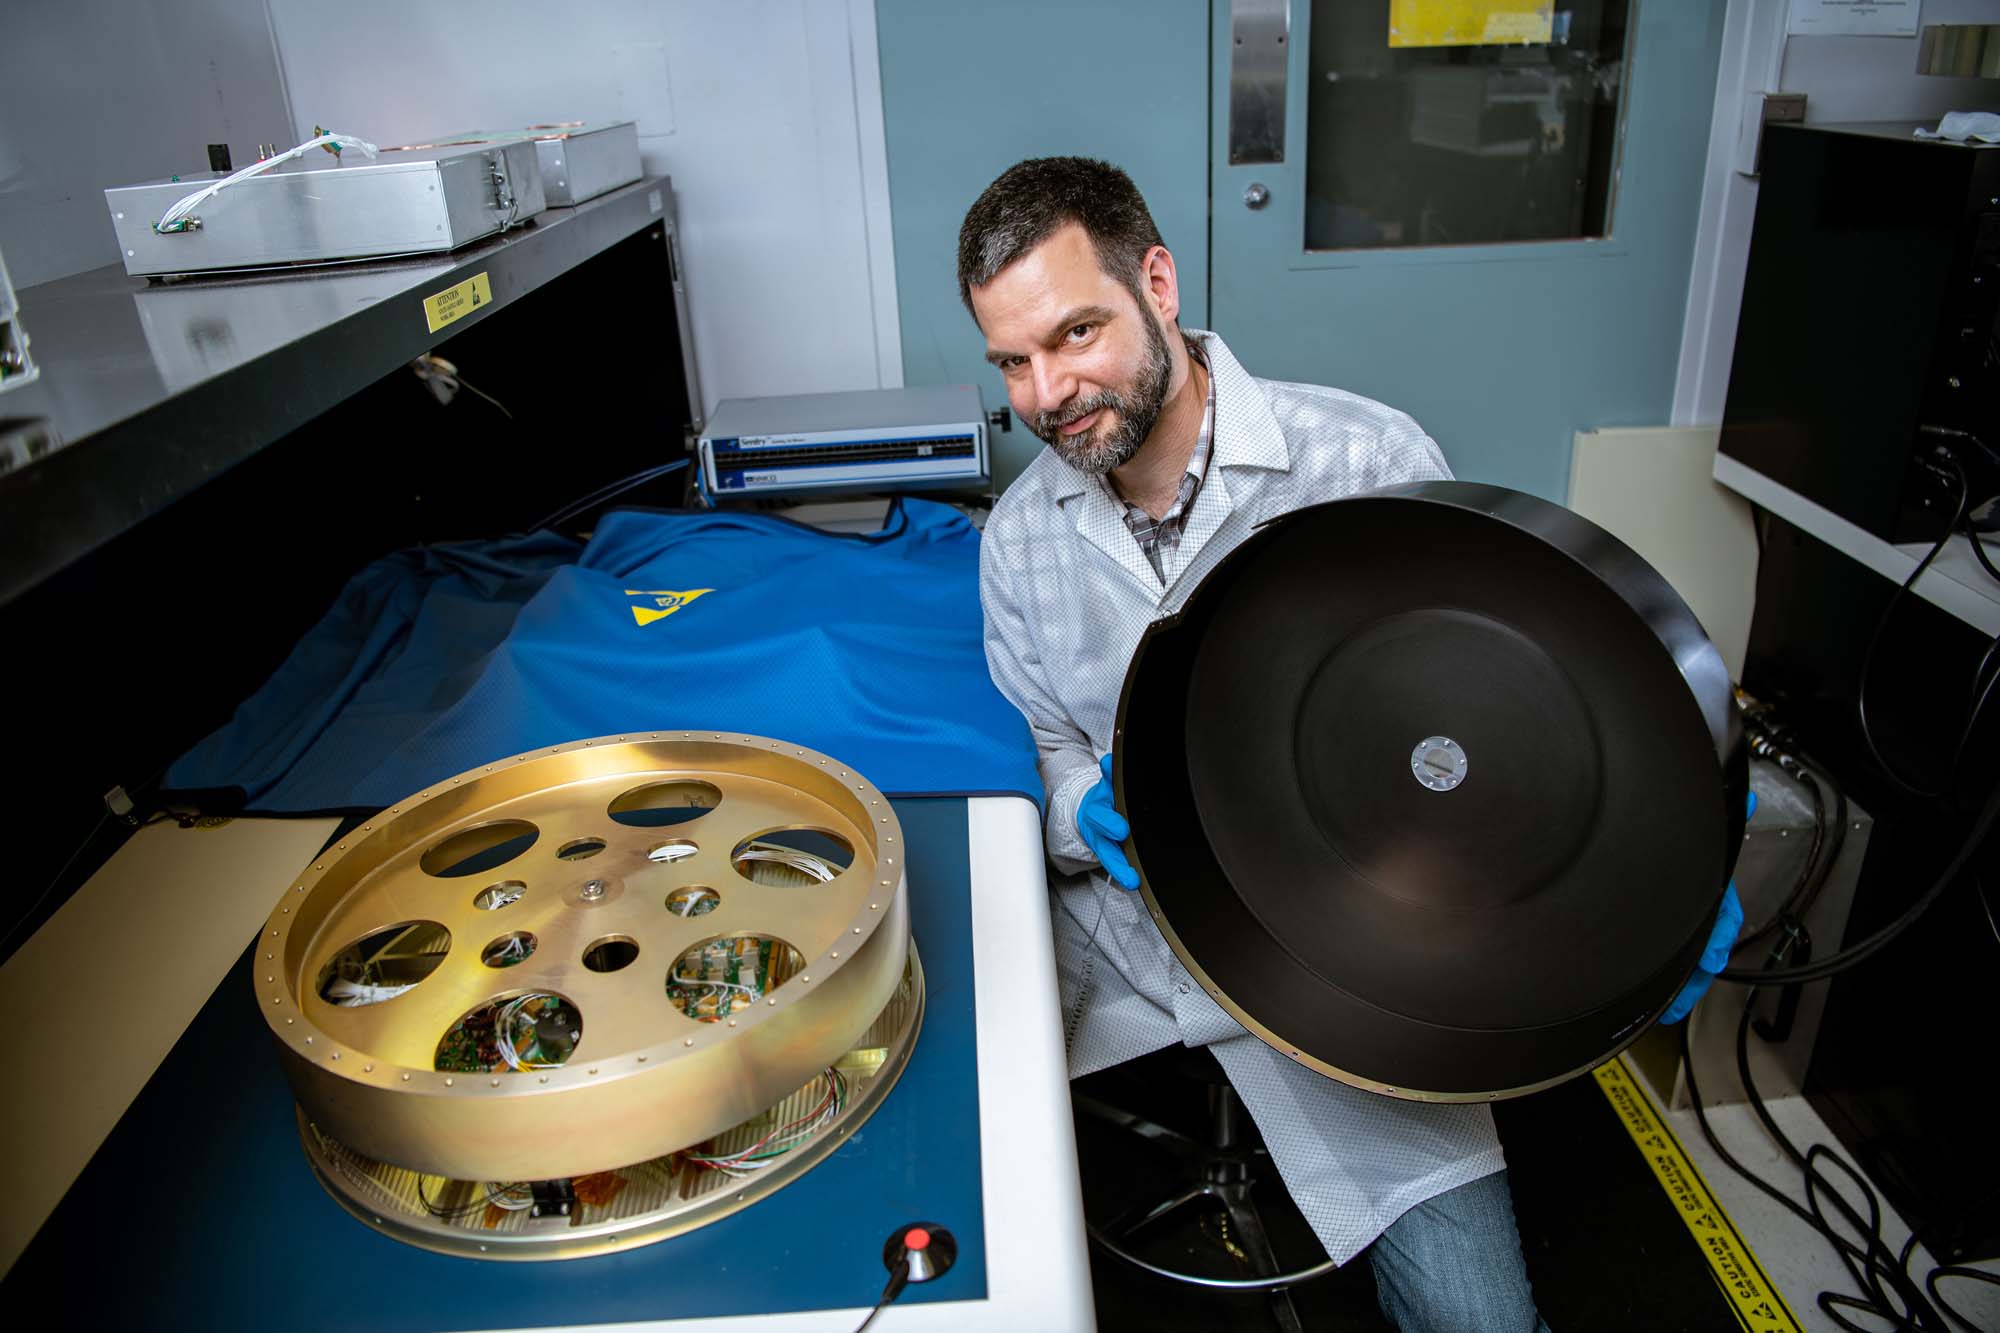
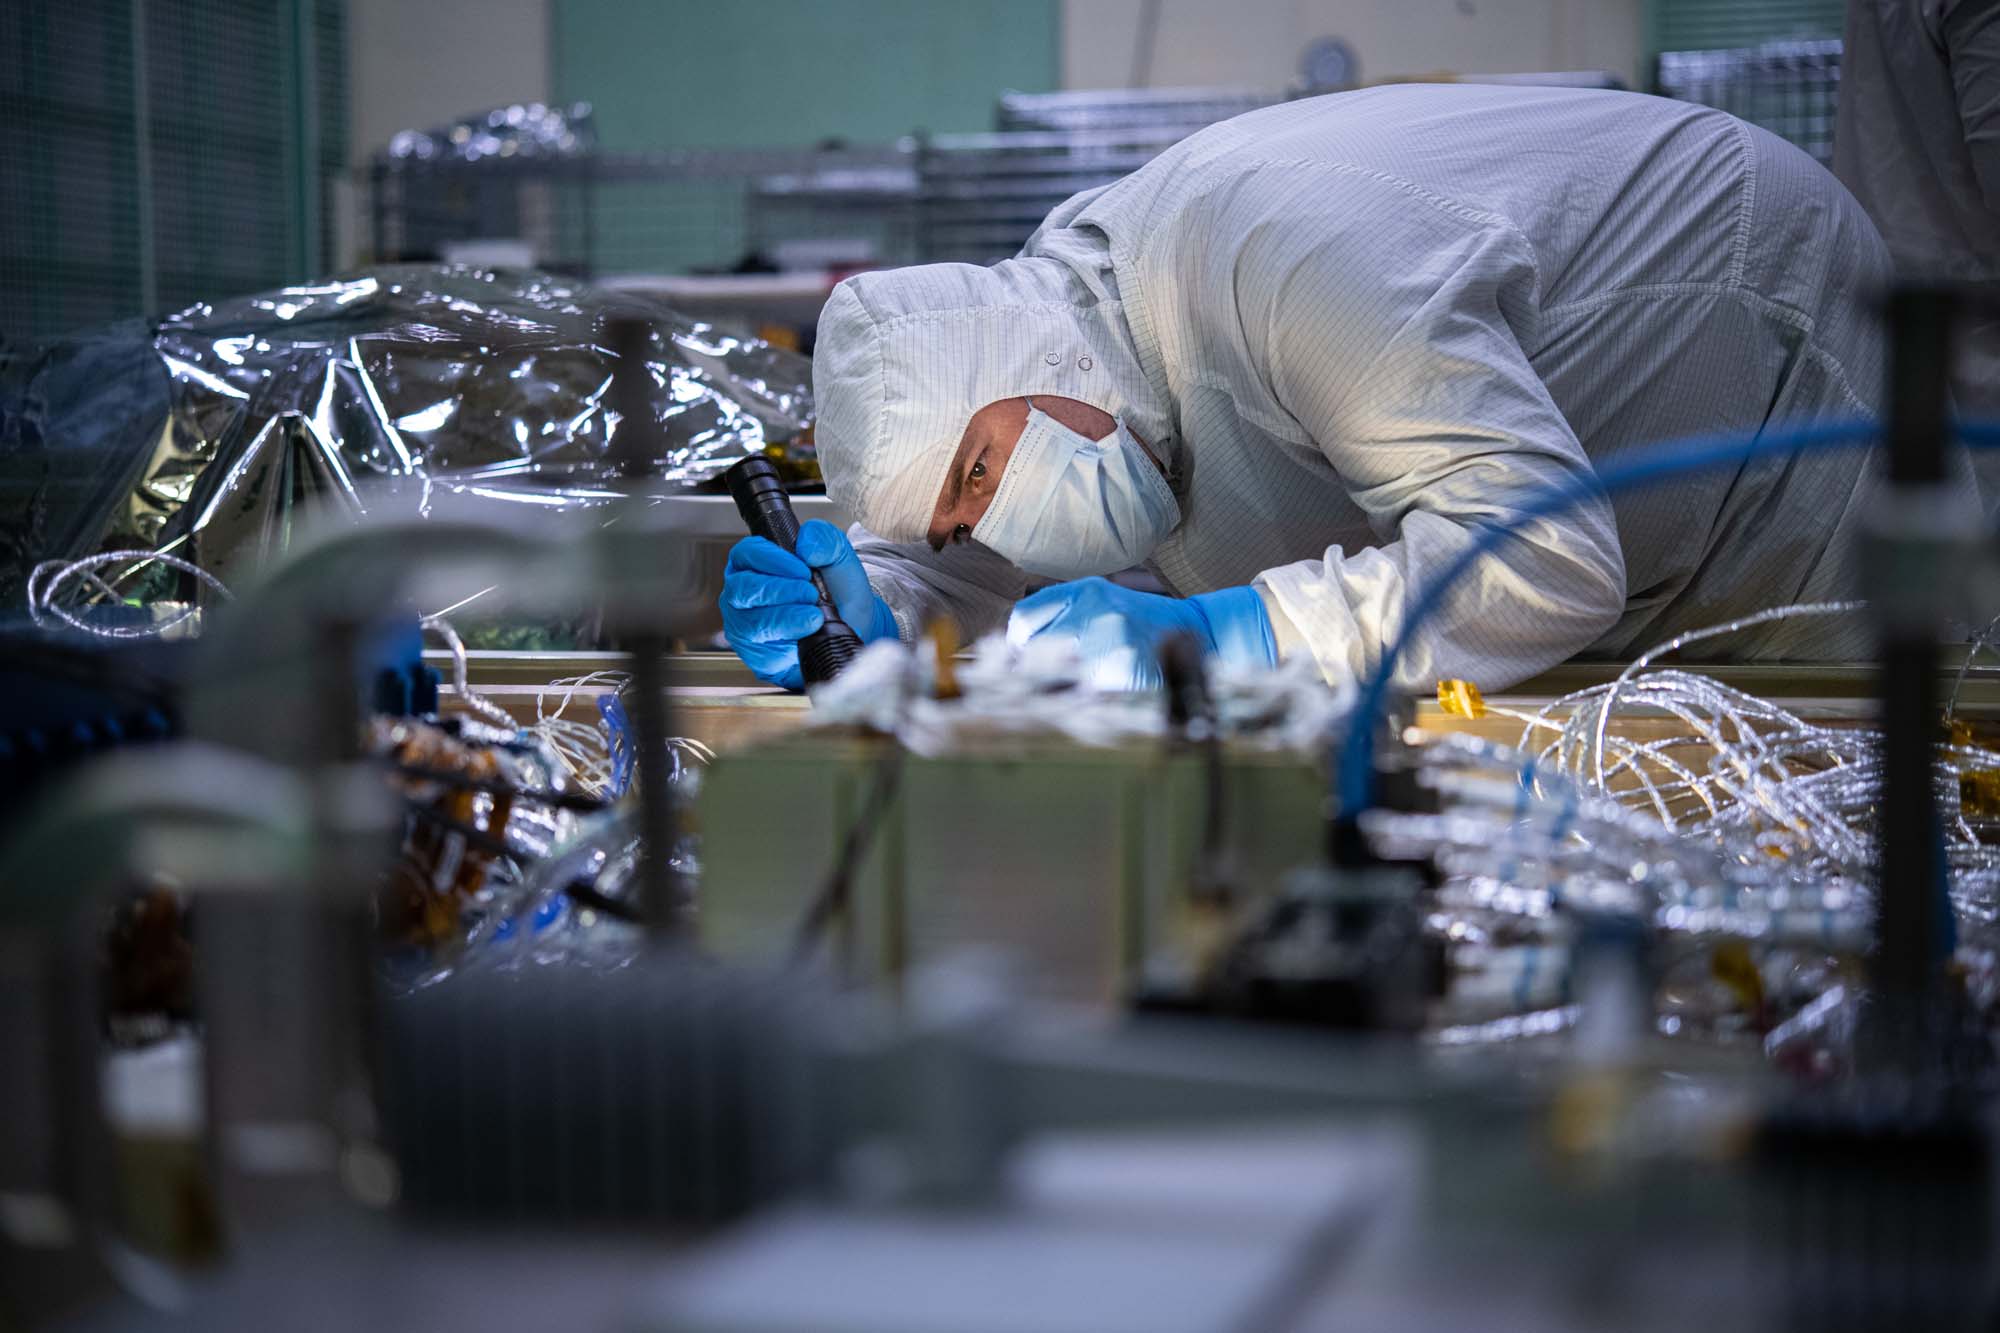
Optical engineer, David Kubalak, inspects the Ocean Color Instrument Main Optics Sub Bench (MOSB) interior optics prior to covers are installed. Credit: Stover, Desiree
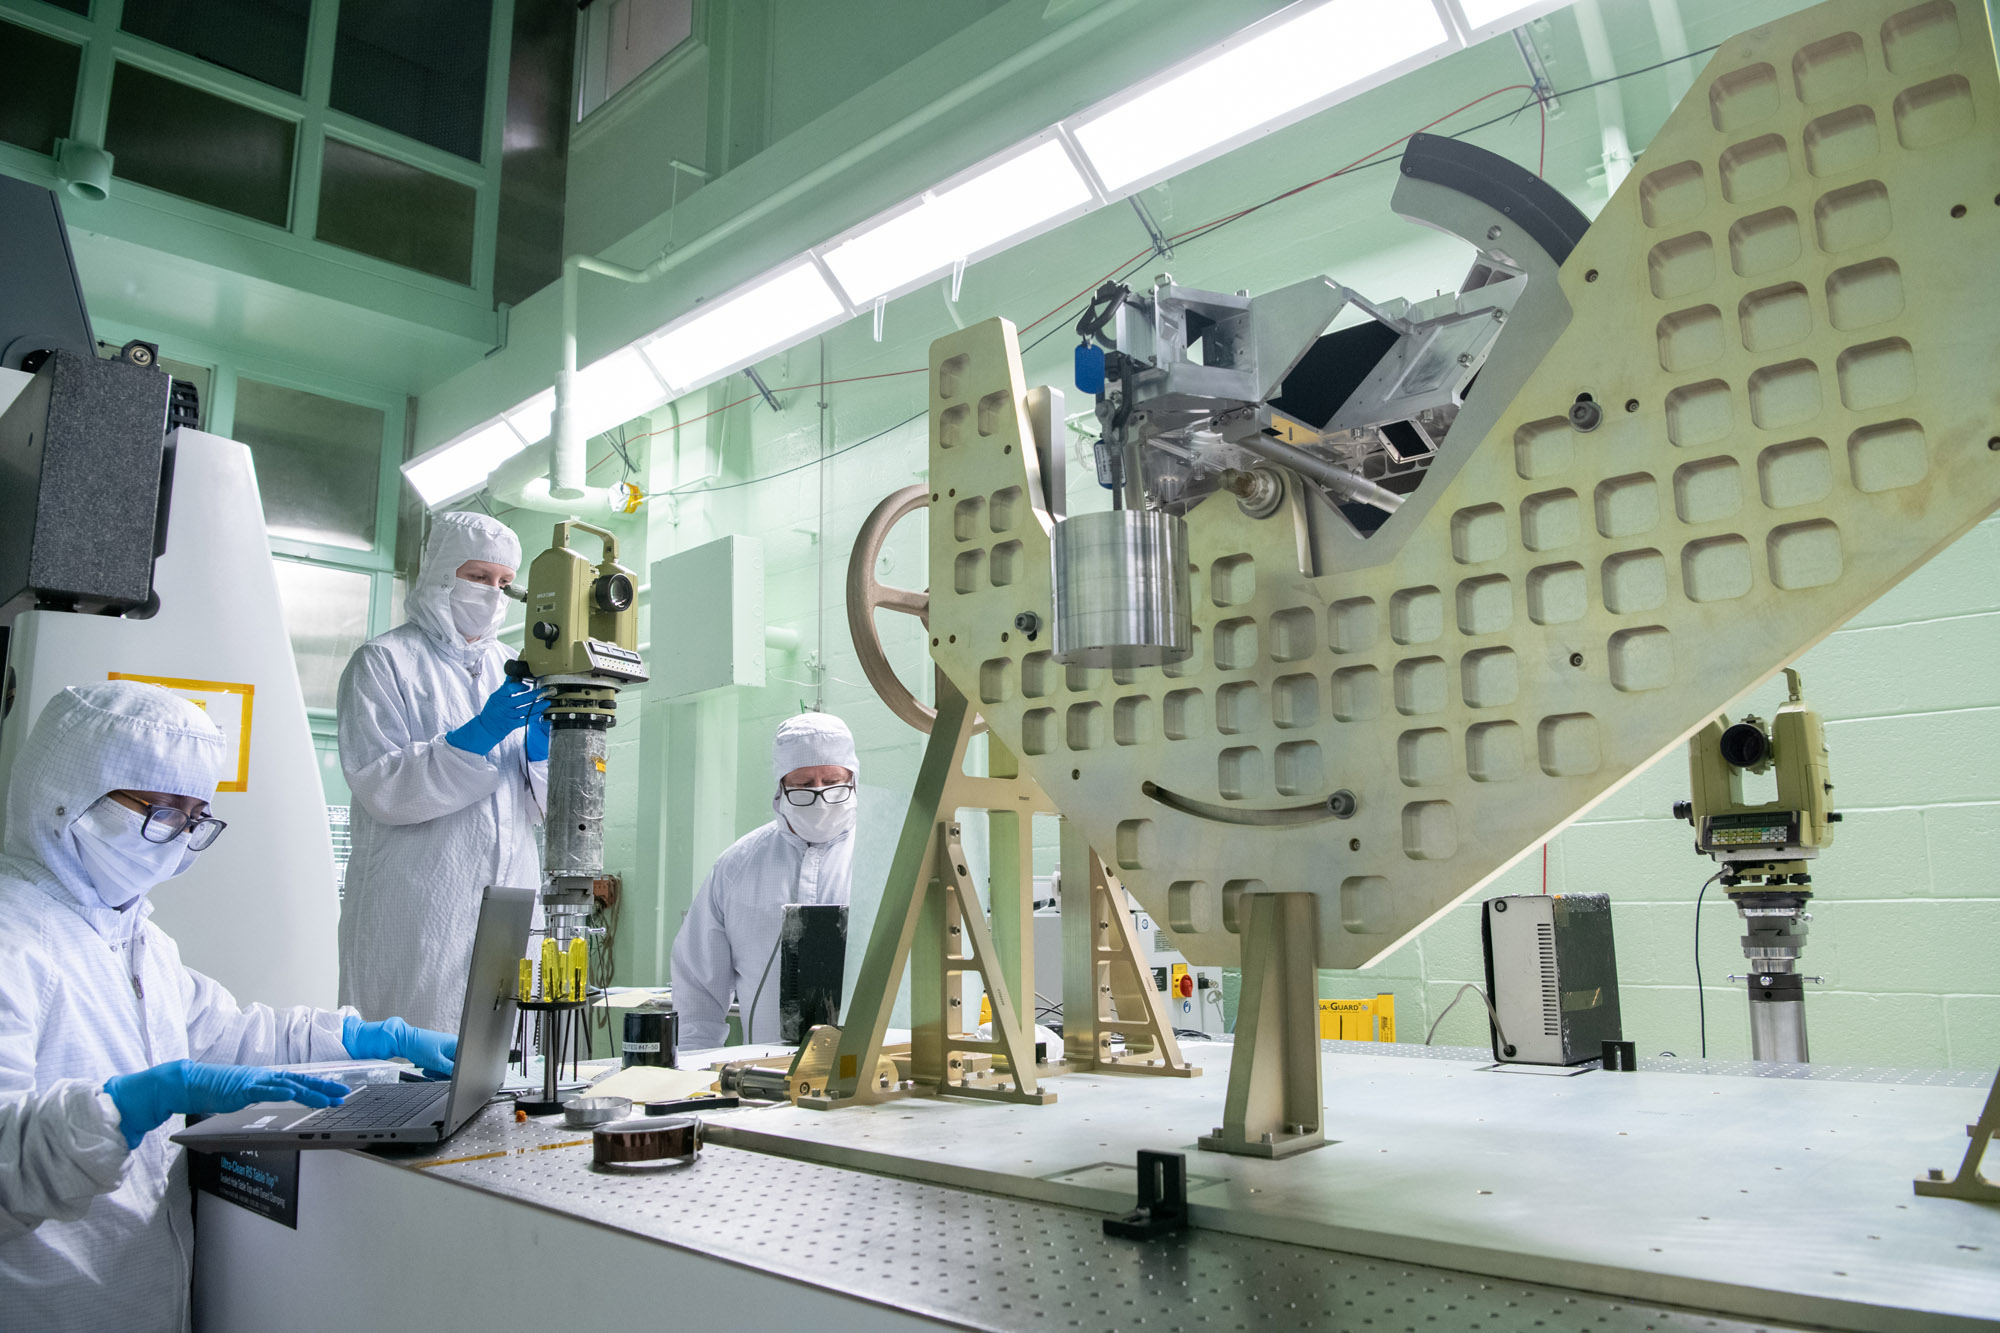
The Ocean Color Instrument Optical Alignment team poses for a group photo after successful alignment of the flight Main Optics Bench and Rotating Telescope assembly. Credit: Guinto, Michael
Aerospace Engineer, Daniel Senai, inspects the completed Ocean Color Instrument Solar Calibration Assembly (SCA) Life Test Unit mechanism. Credit: Henry, Dennis (Denny)
The optical alignment team performs gravity sag measurements on the Ocean Color Instrument Main Optics Sub Bench (MOSB). Credit: Stover, Desiree
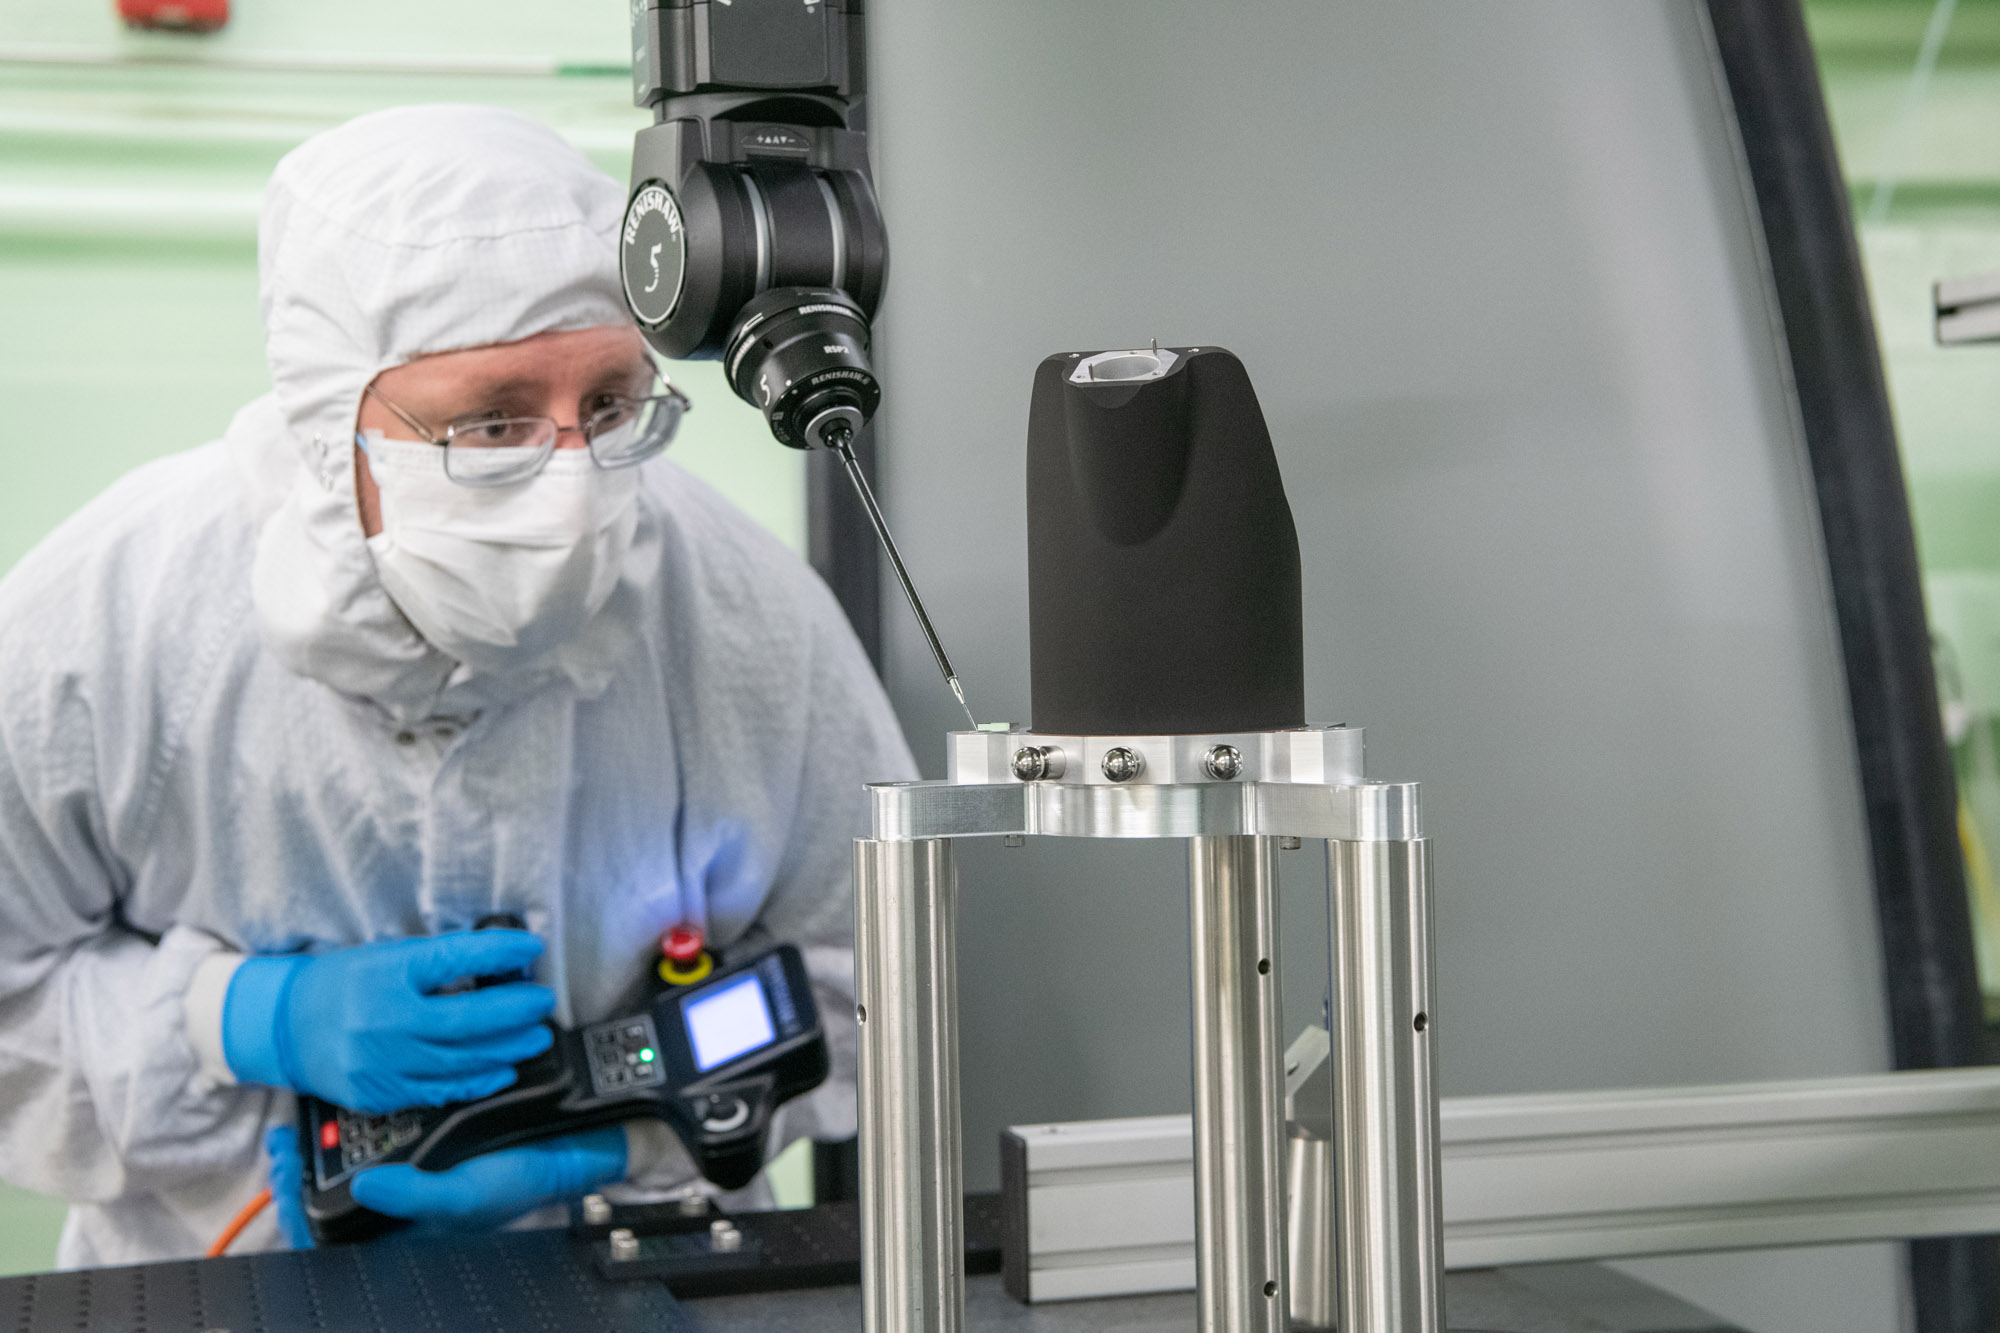
Optical technician Timothy Hahn measures the Ocean Color Instrument Collimator Slit Bracket on the Coordinate Measurement Machine (CMM). Credit: Stover, Desiree
Technicians mechanically integrate the Shortwave Infrared (SWIR) Detector Assembly into the Ocean Color Instrument Engineering Test Unit. Credit: Stover, Desiree
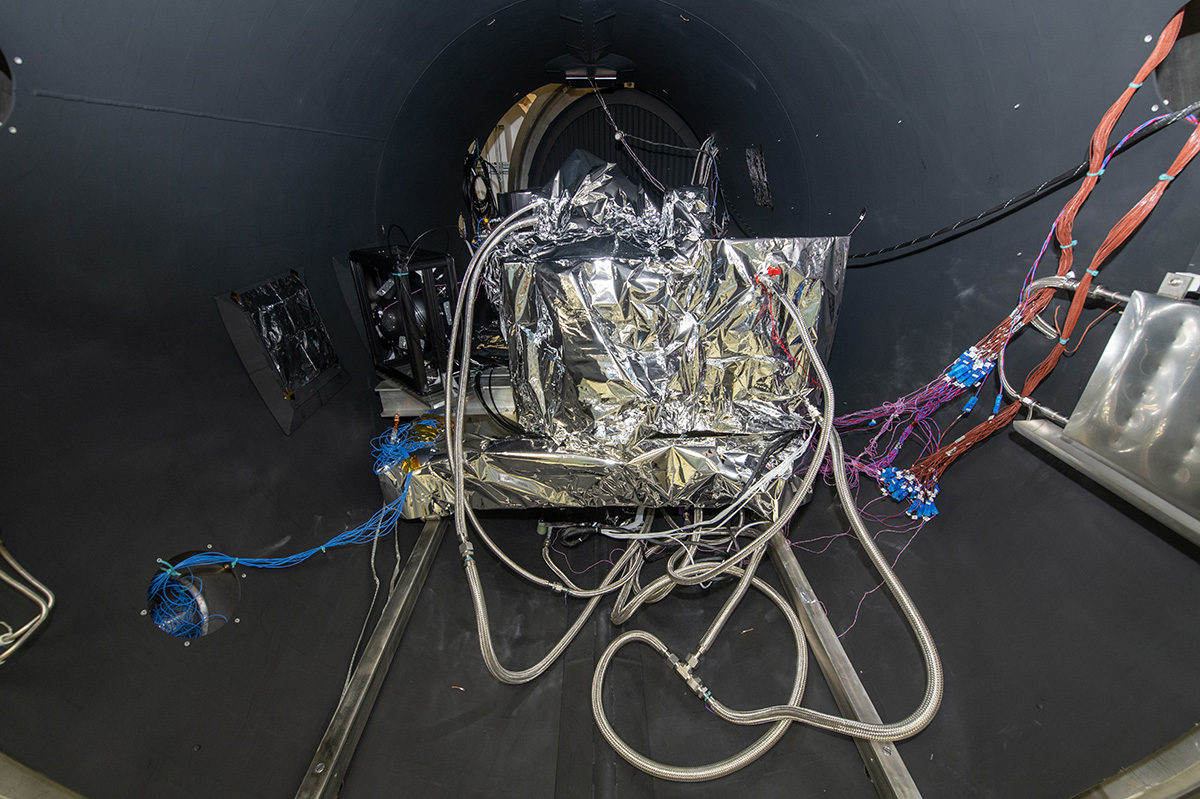
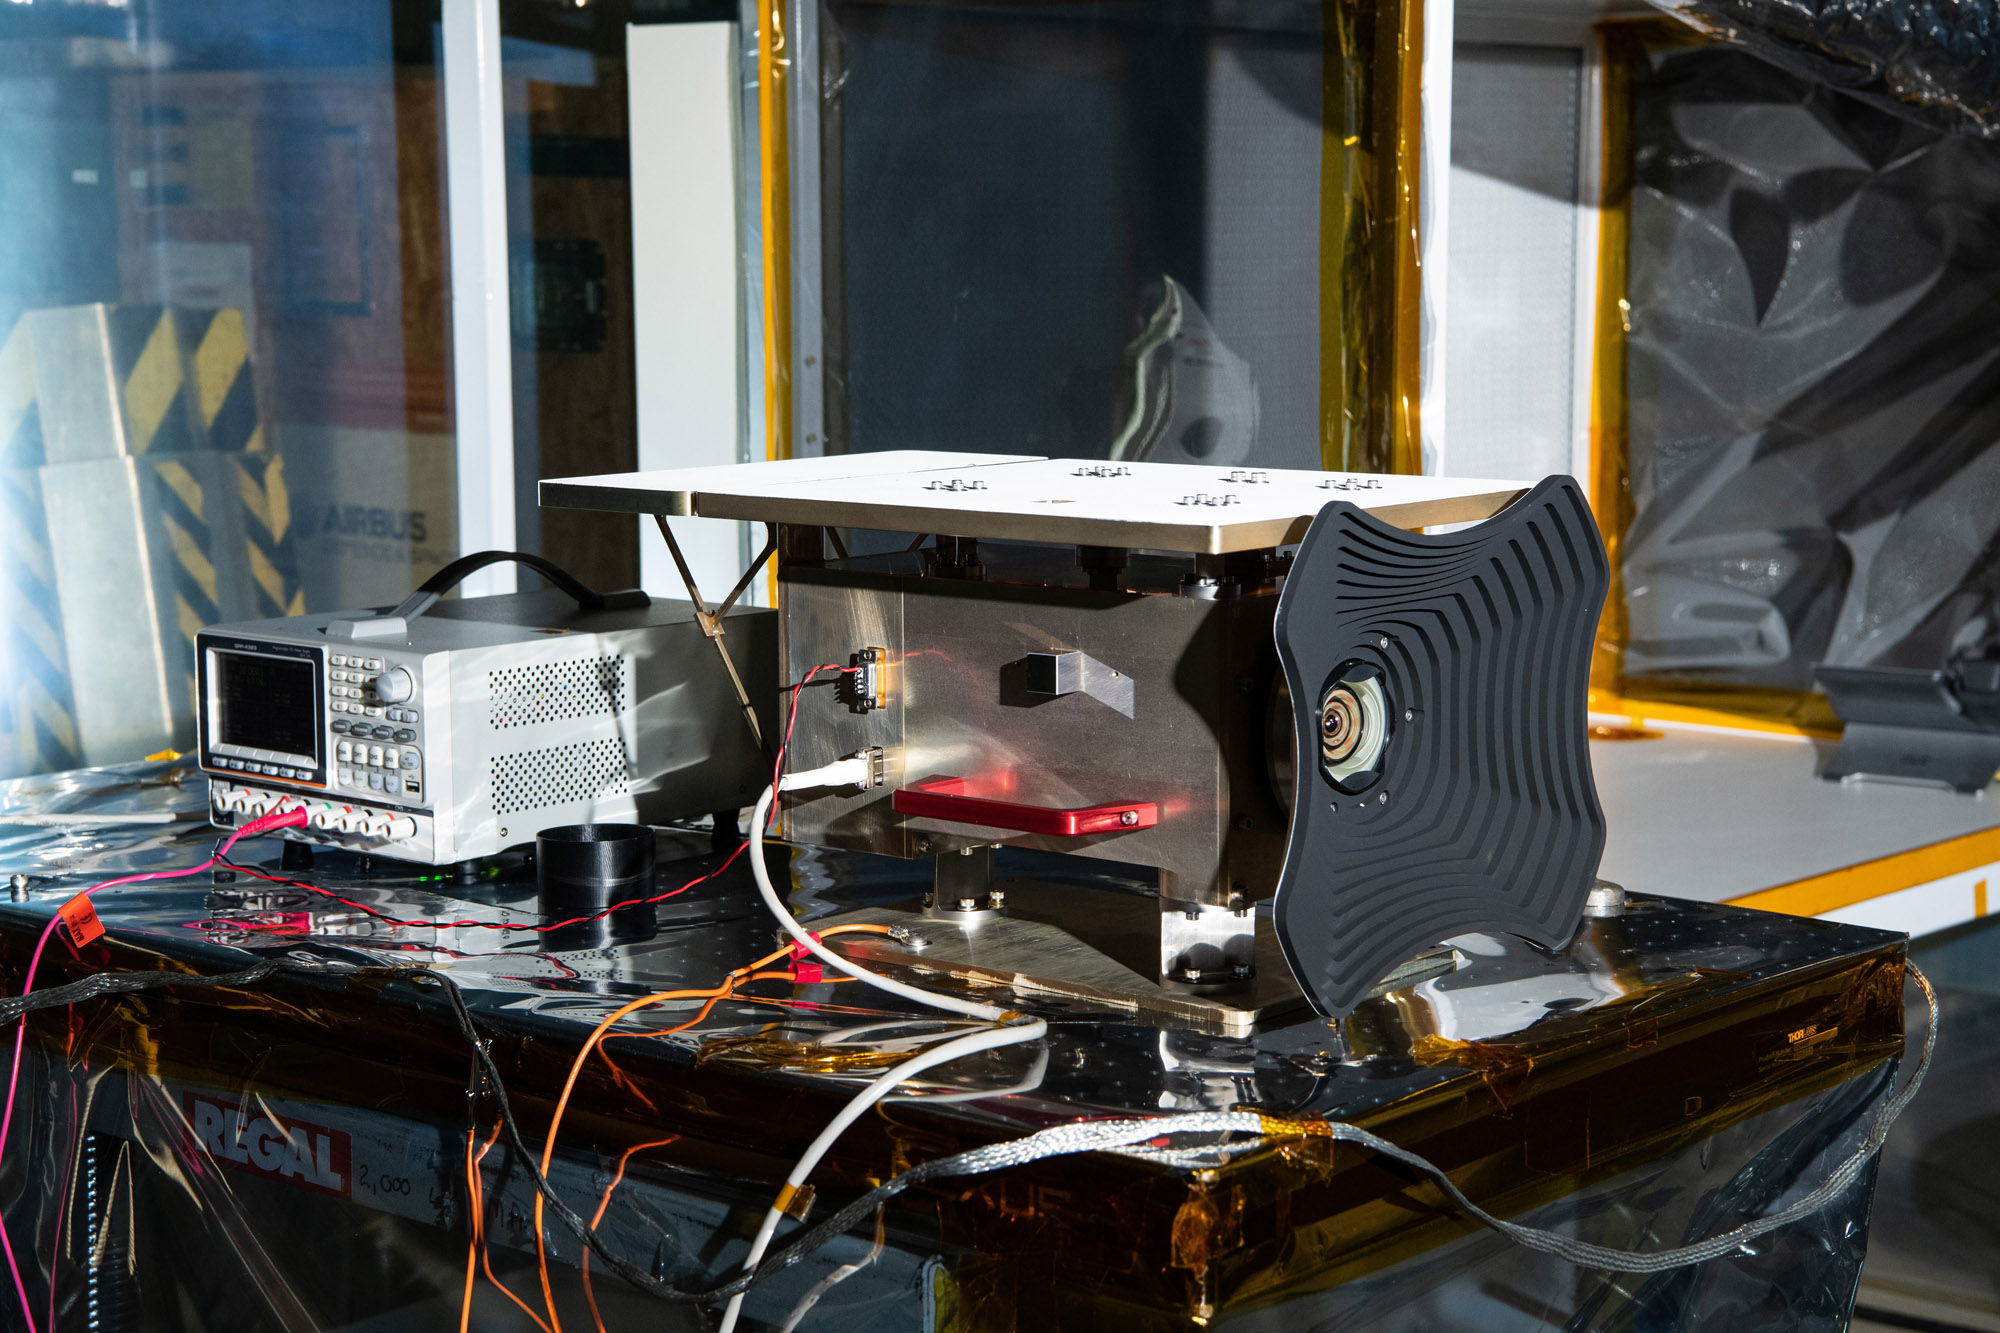
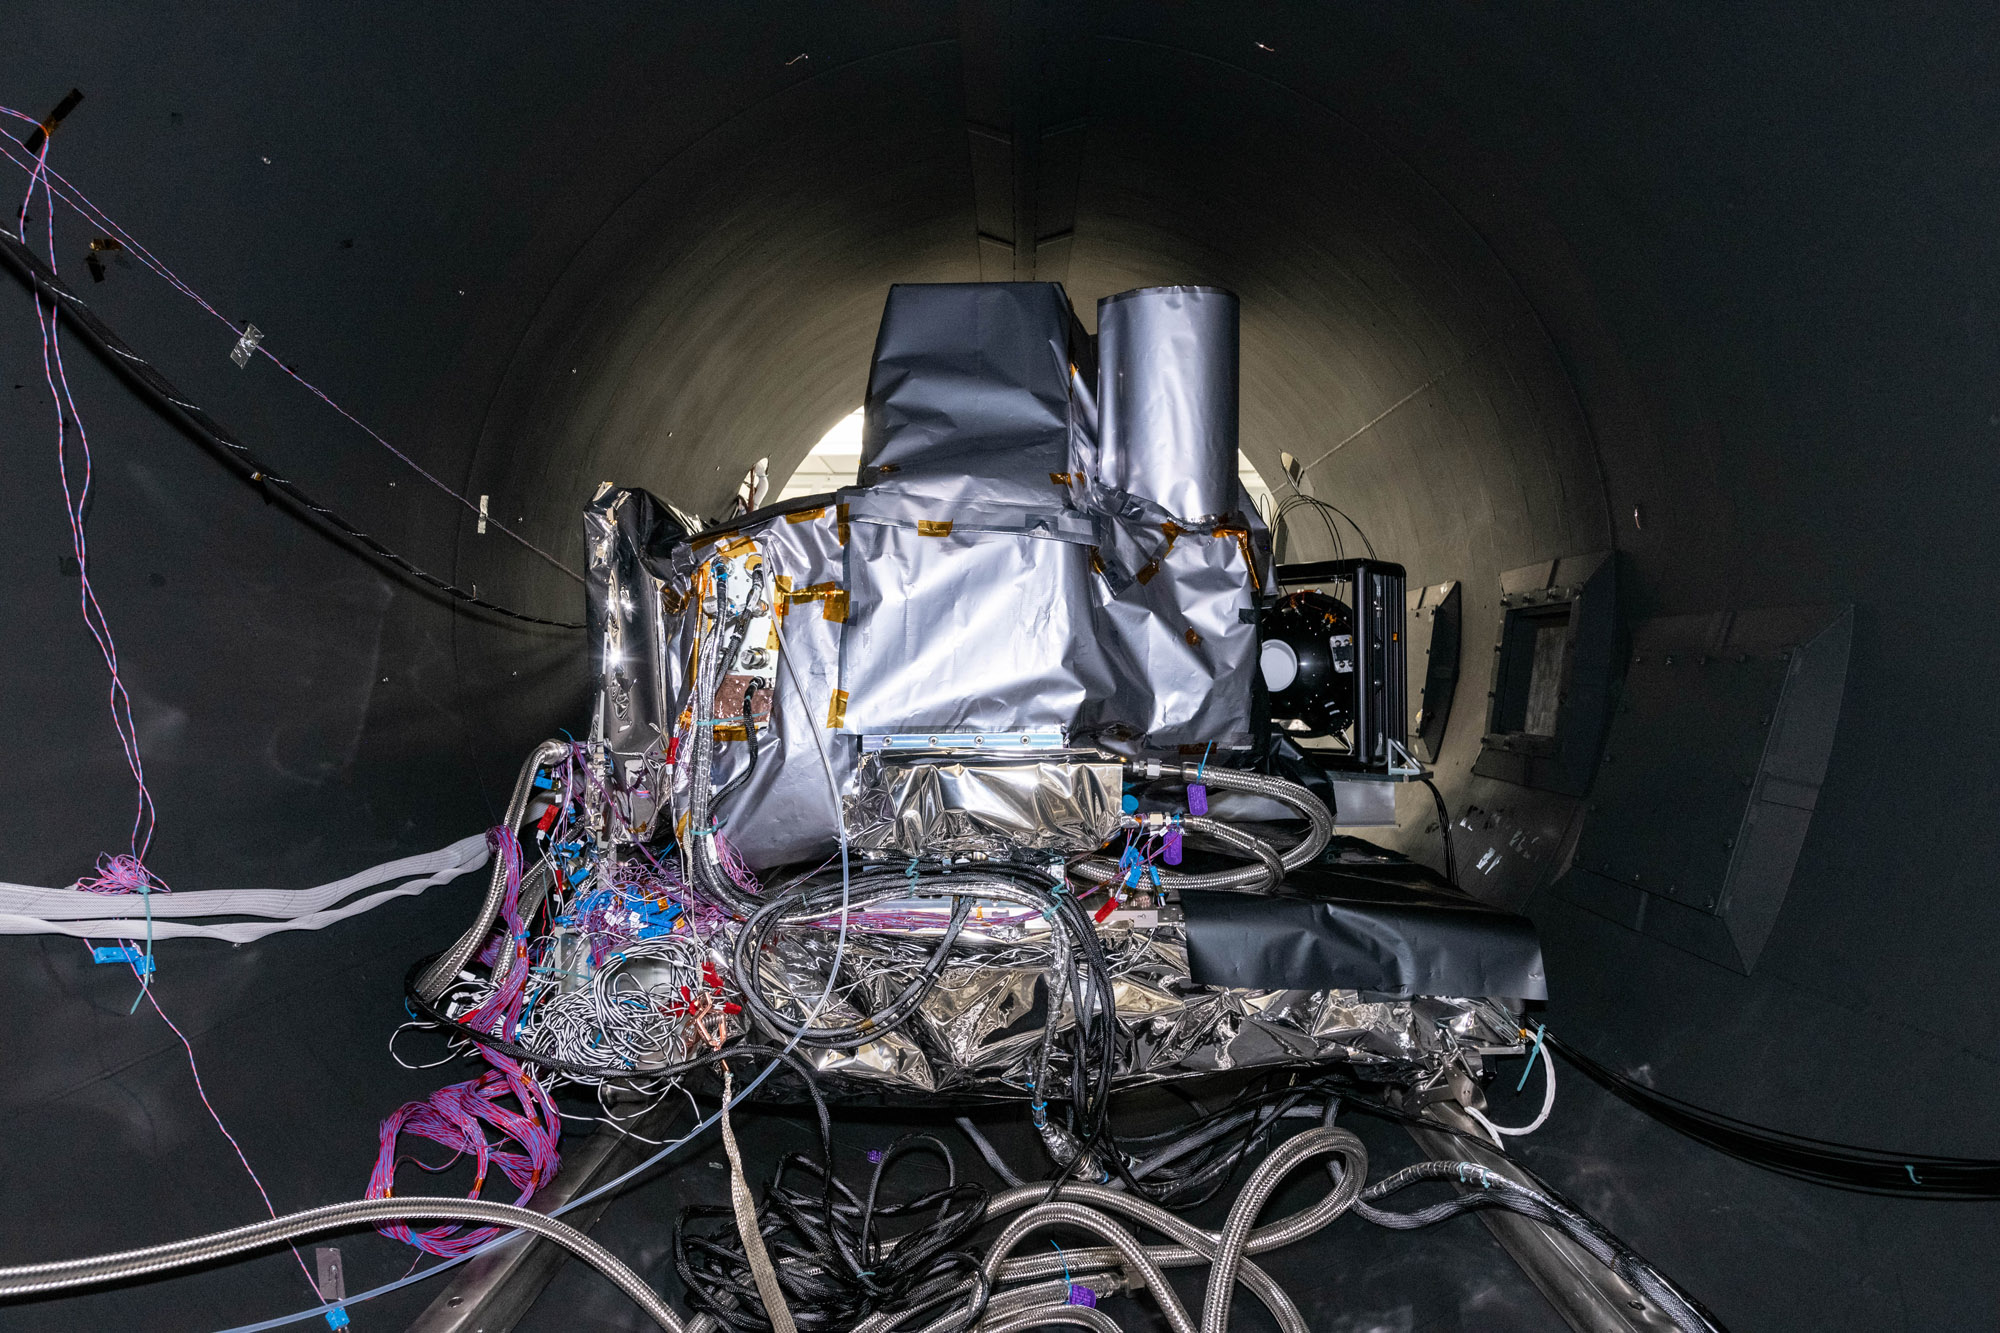
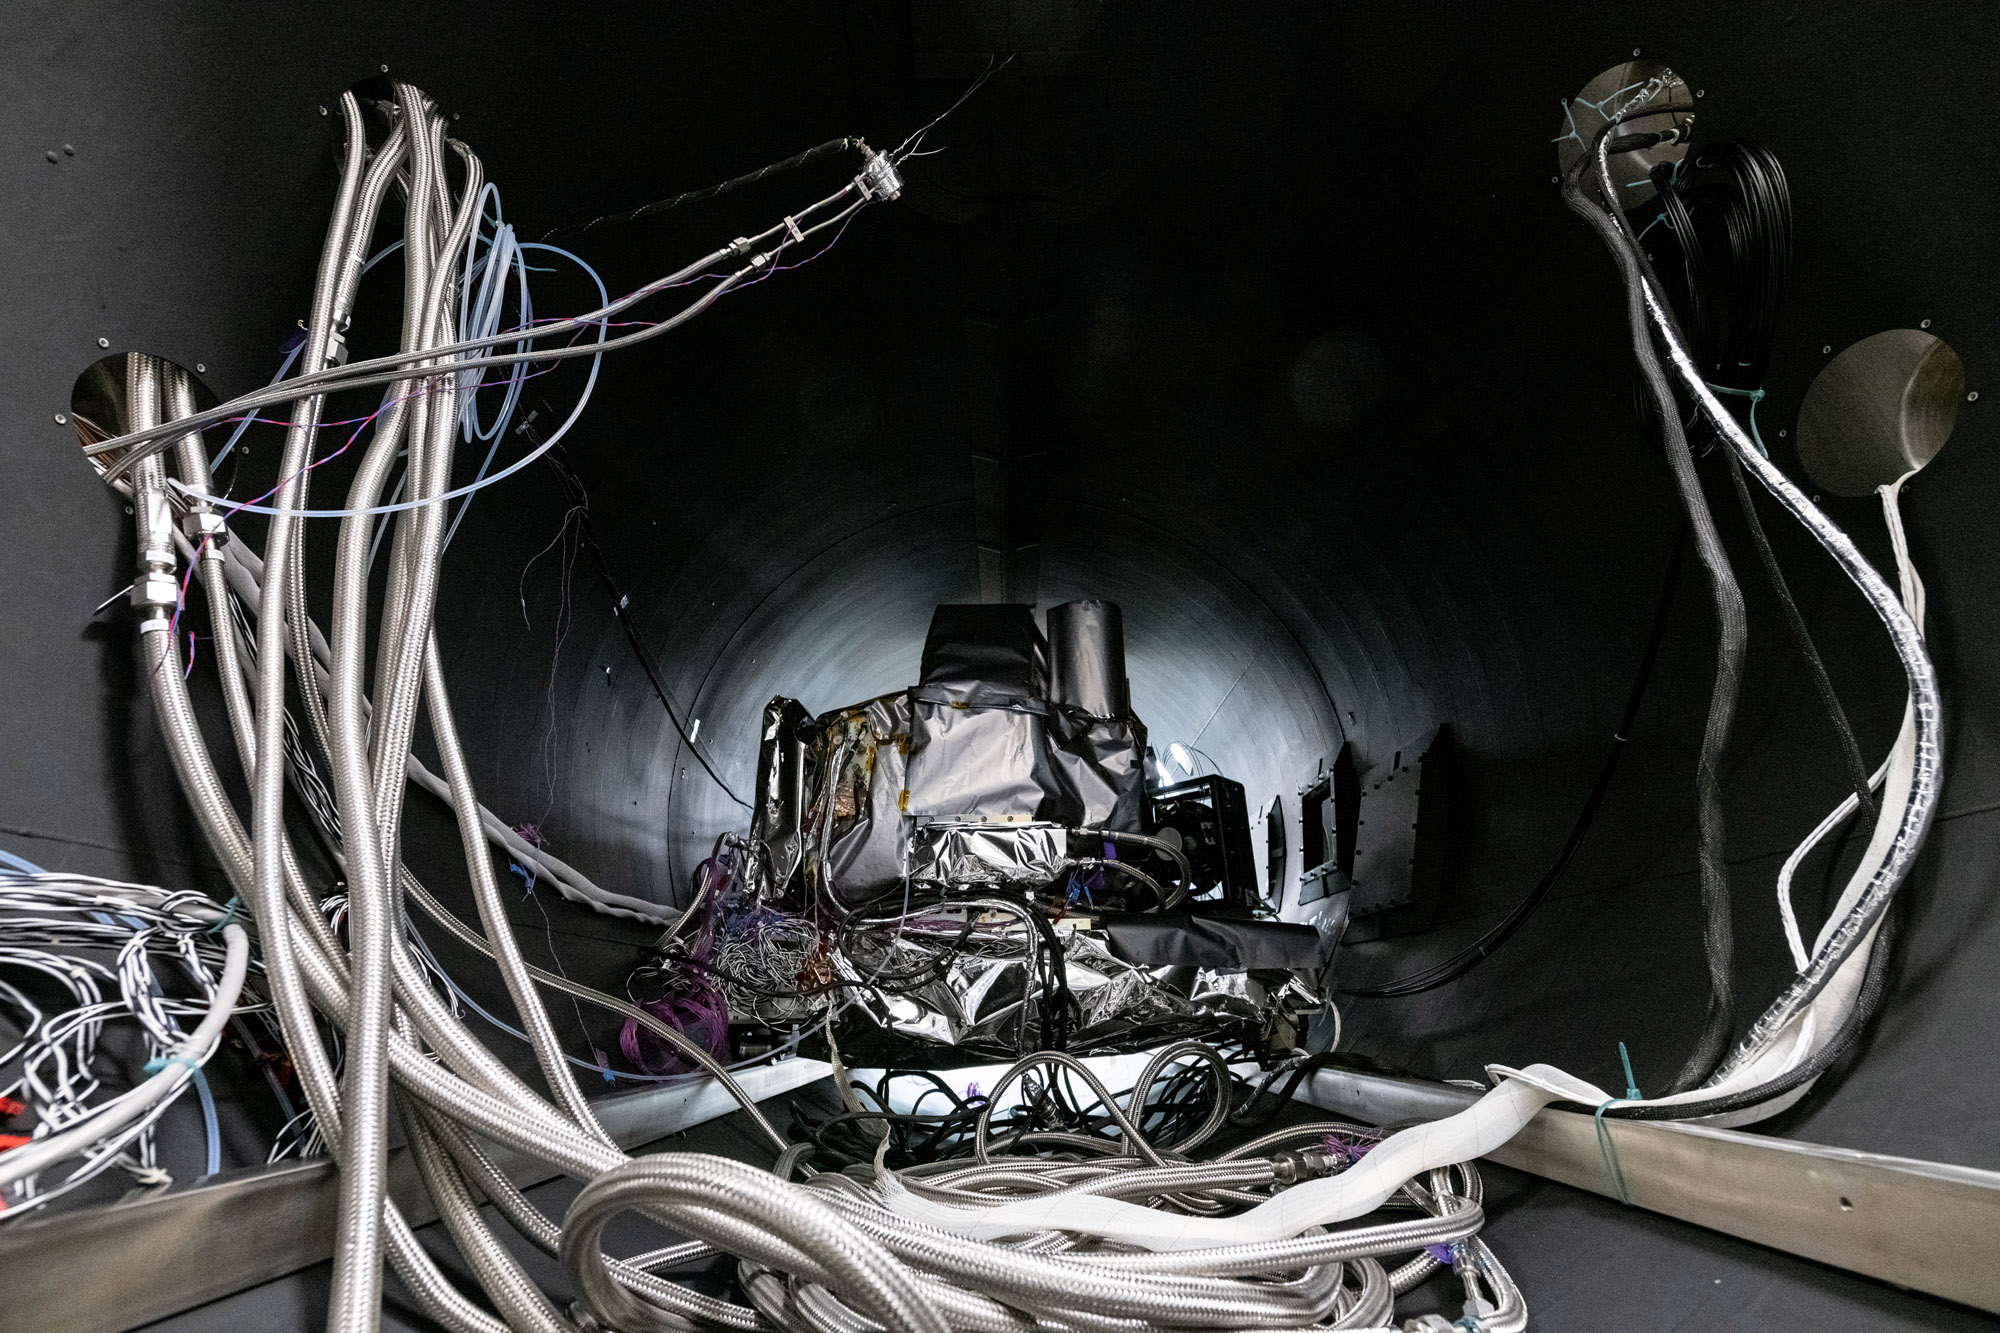
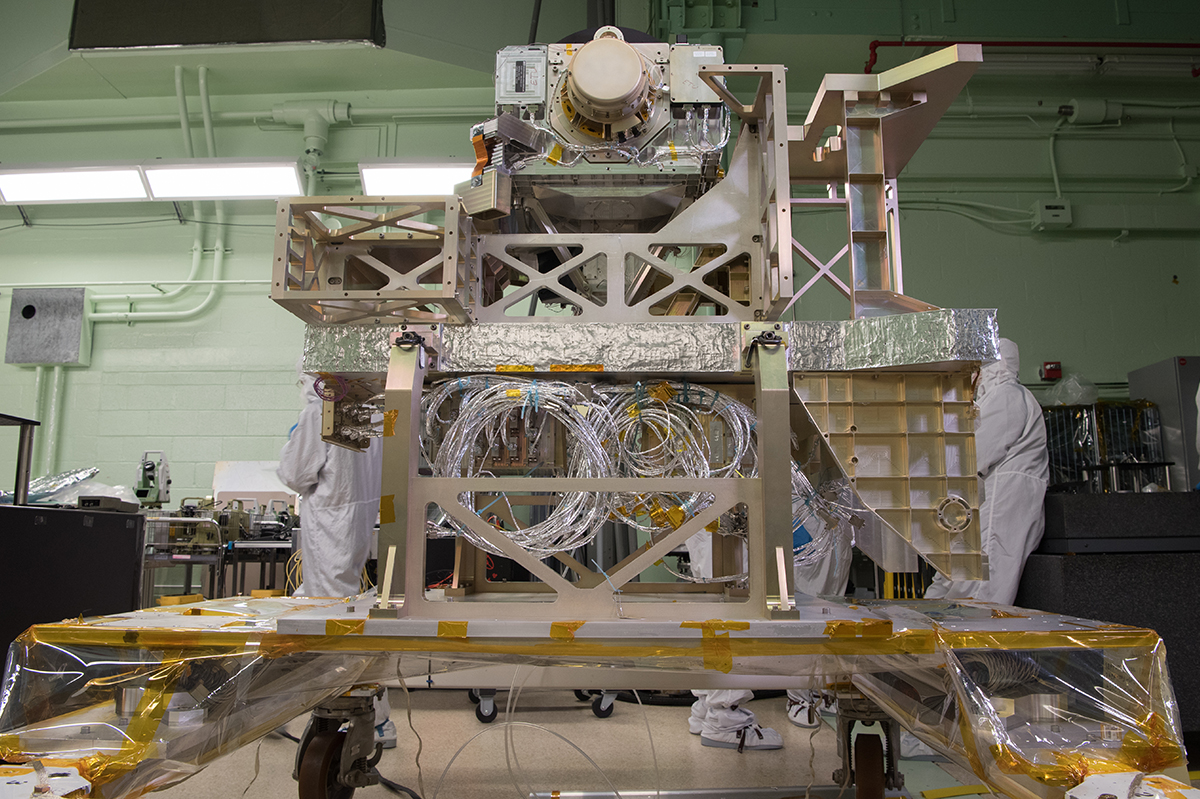
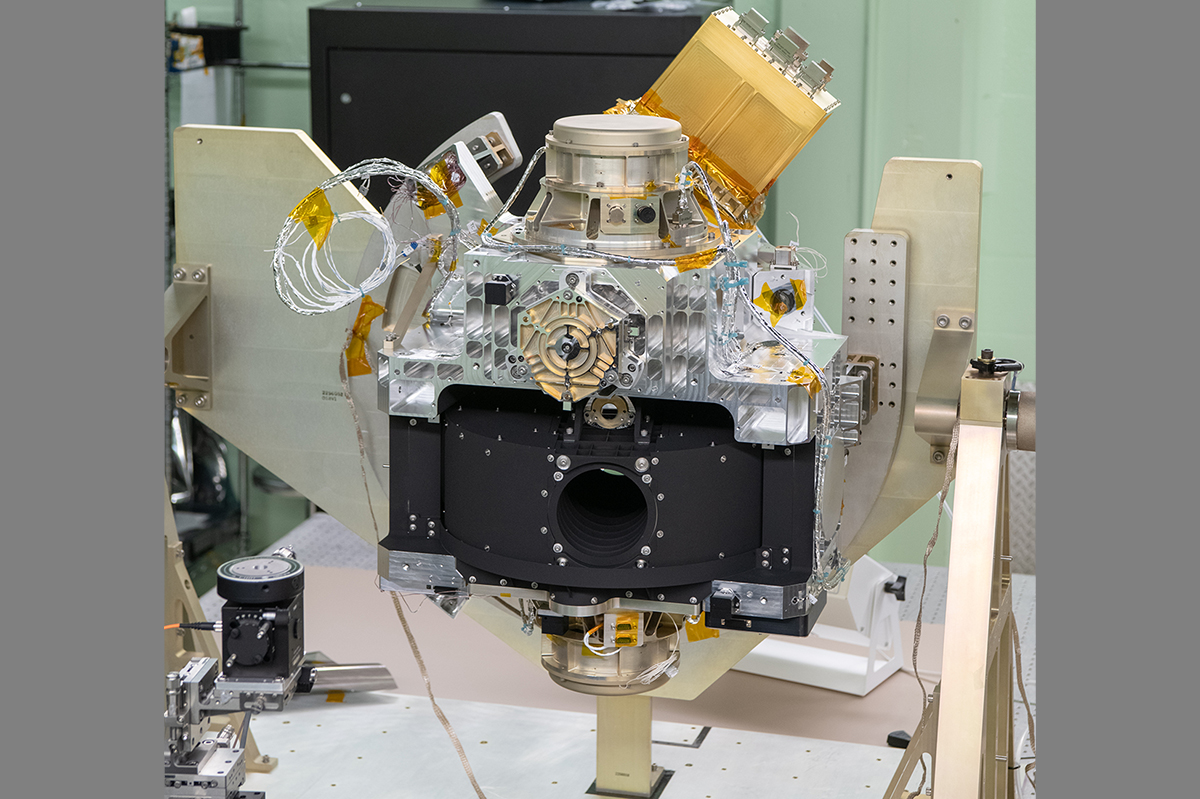
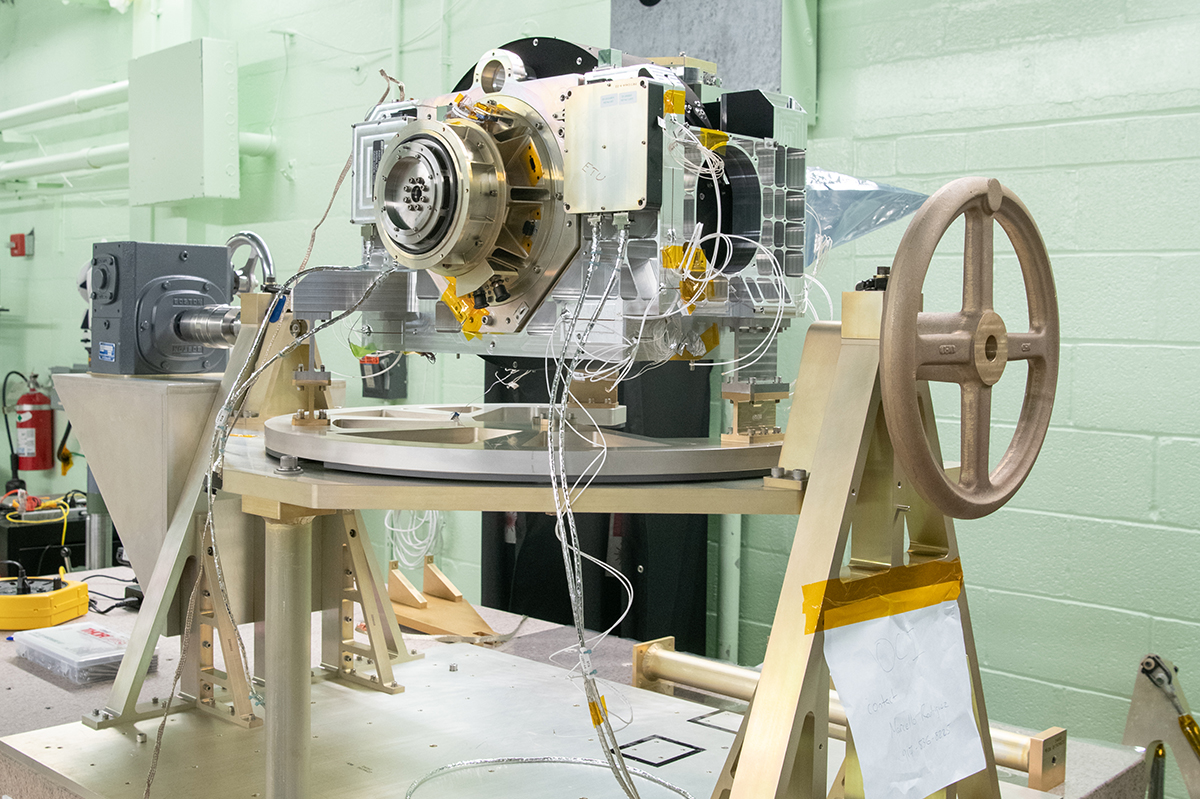
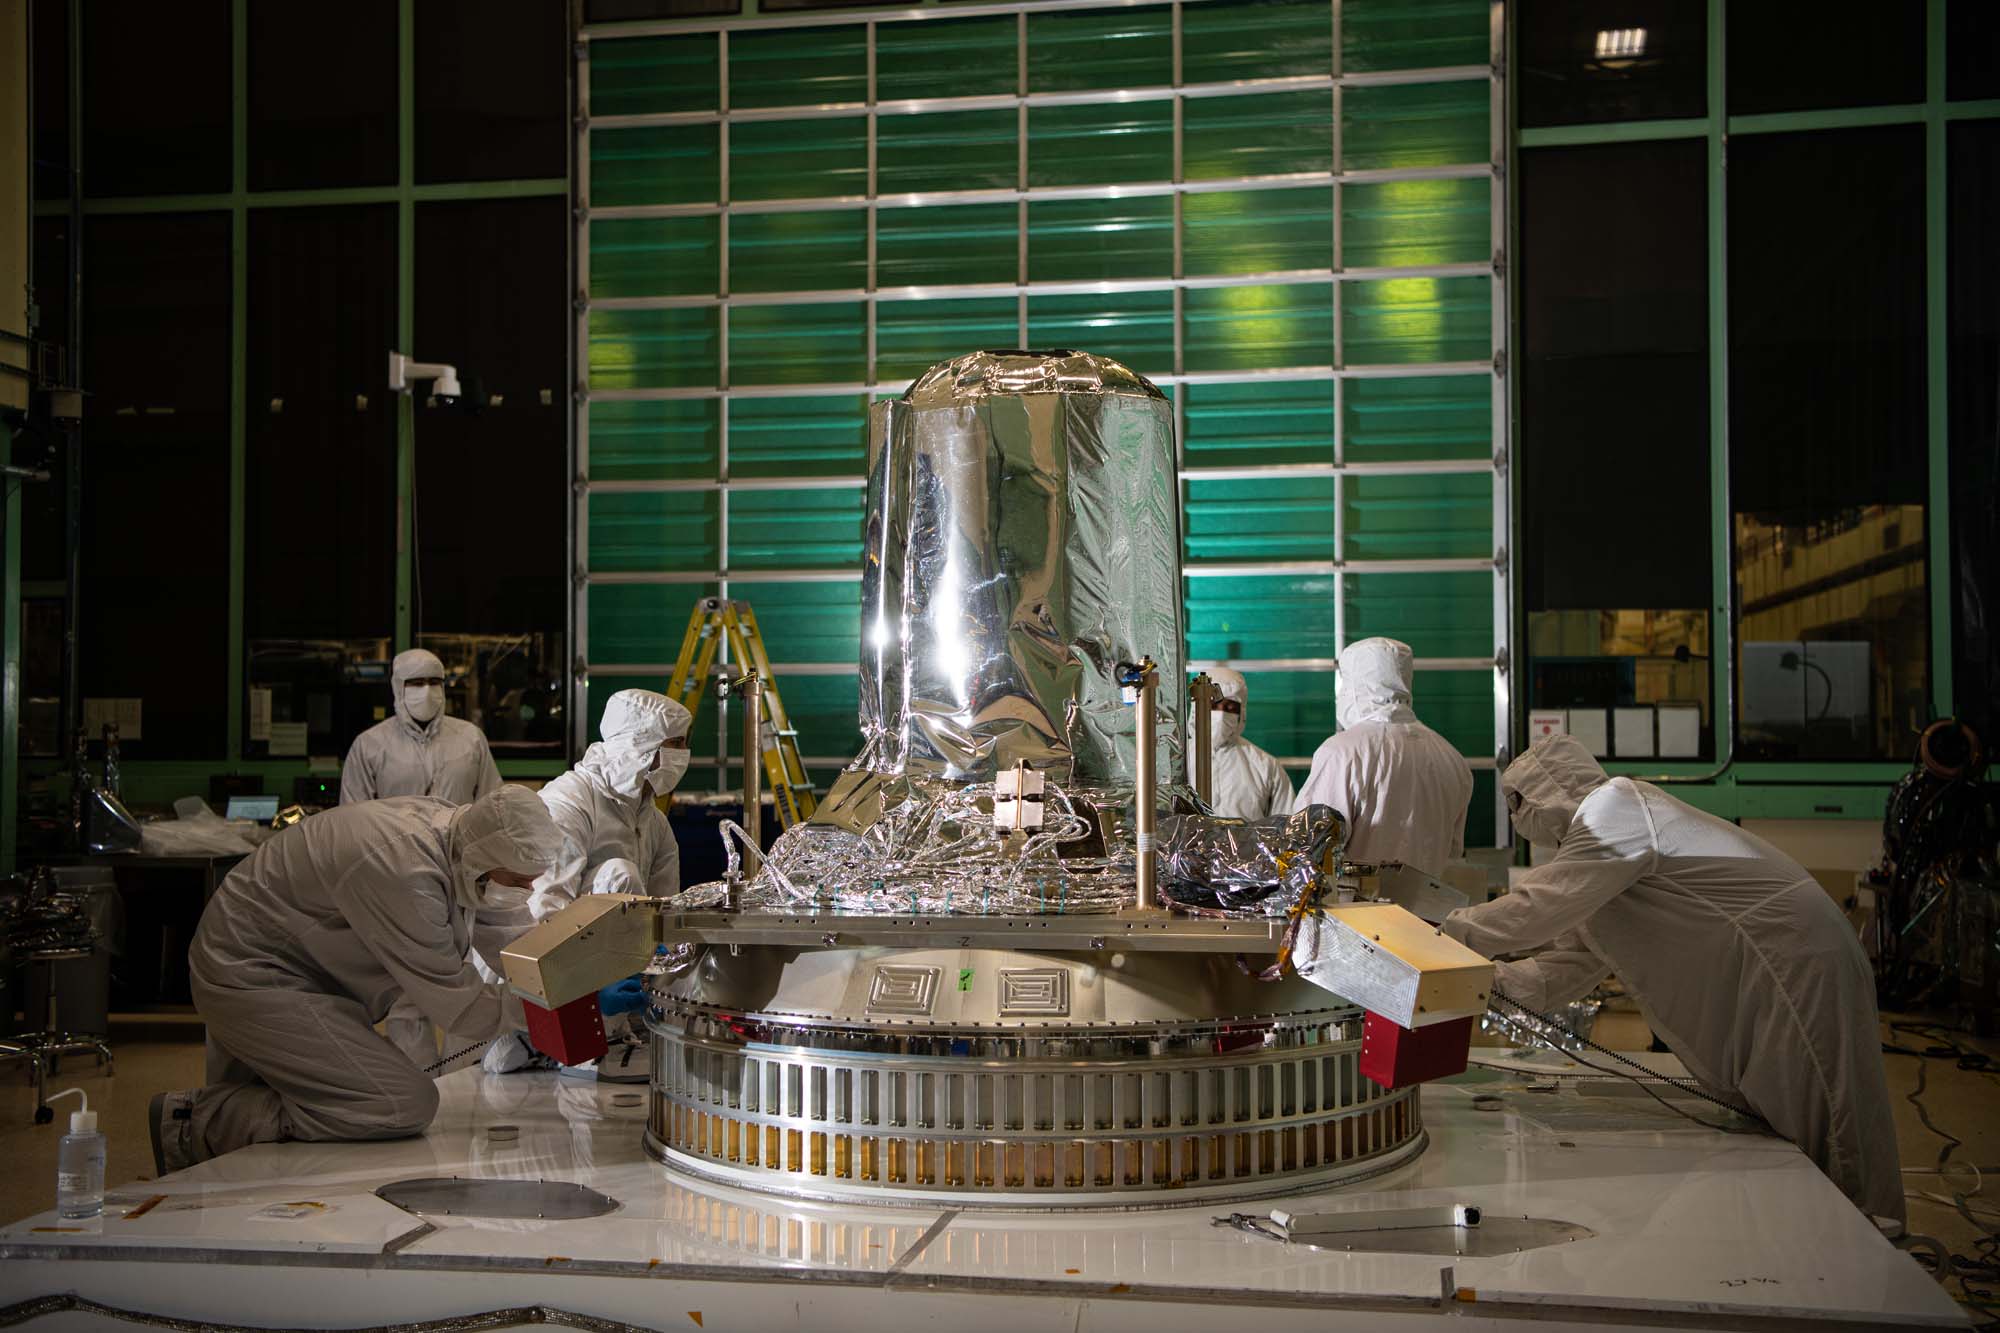
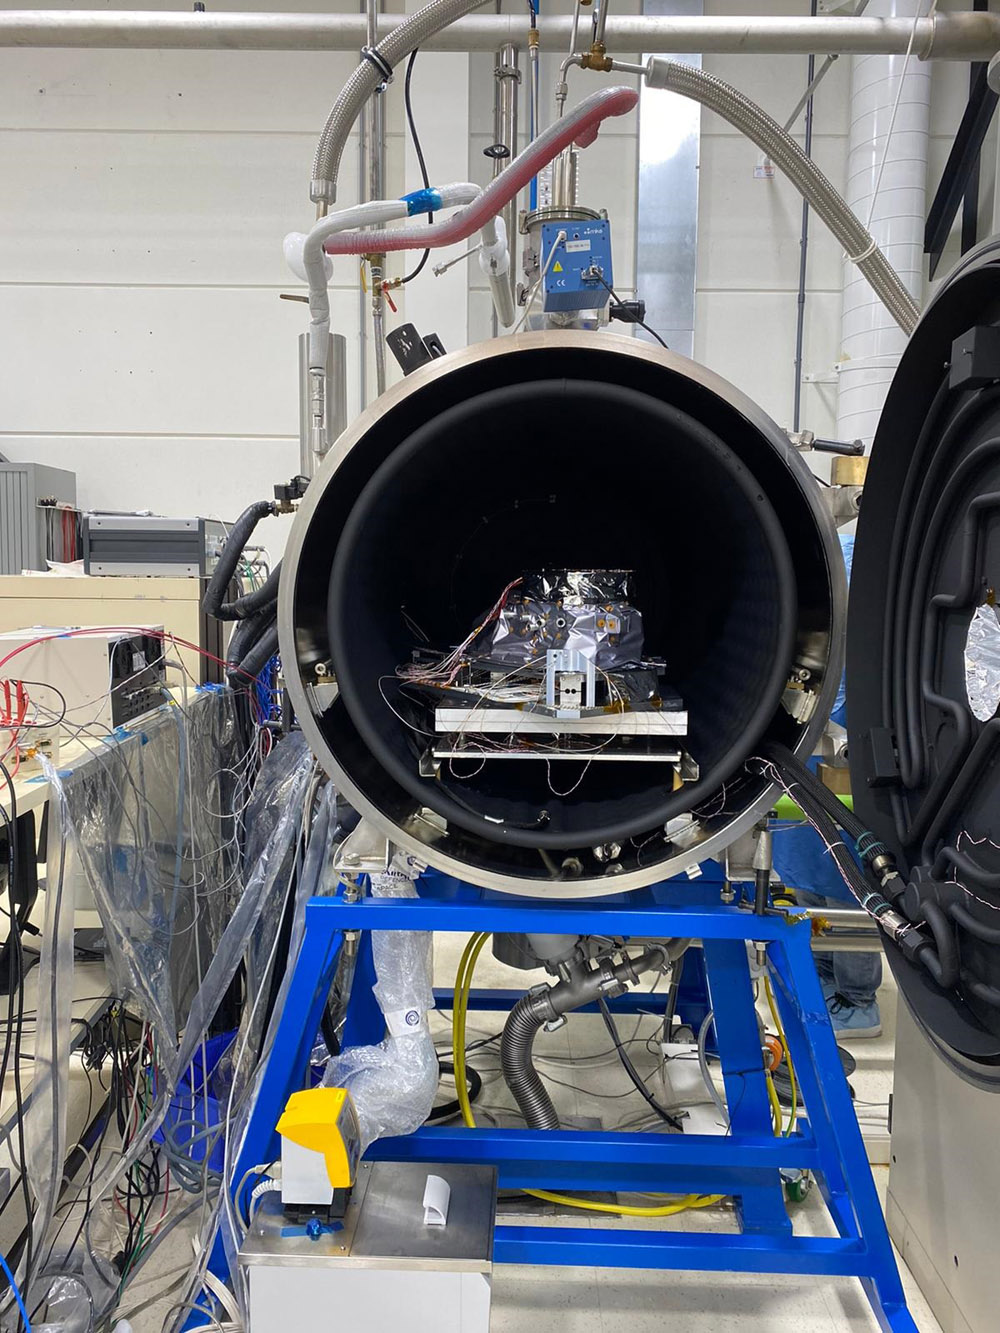
The OCI ETU rolls into the TVAC chamber. Lines are for electrical connections, temperature sensors, accelerometers, and liquid nitrogen, whic is used for cooling down the radiators.
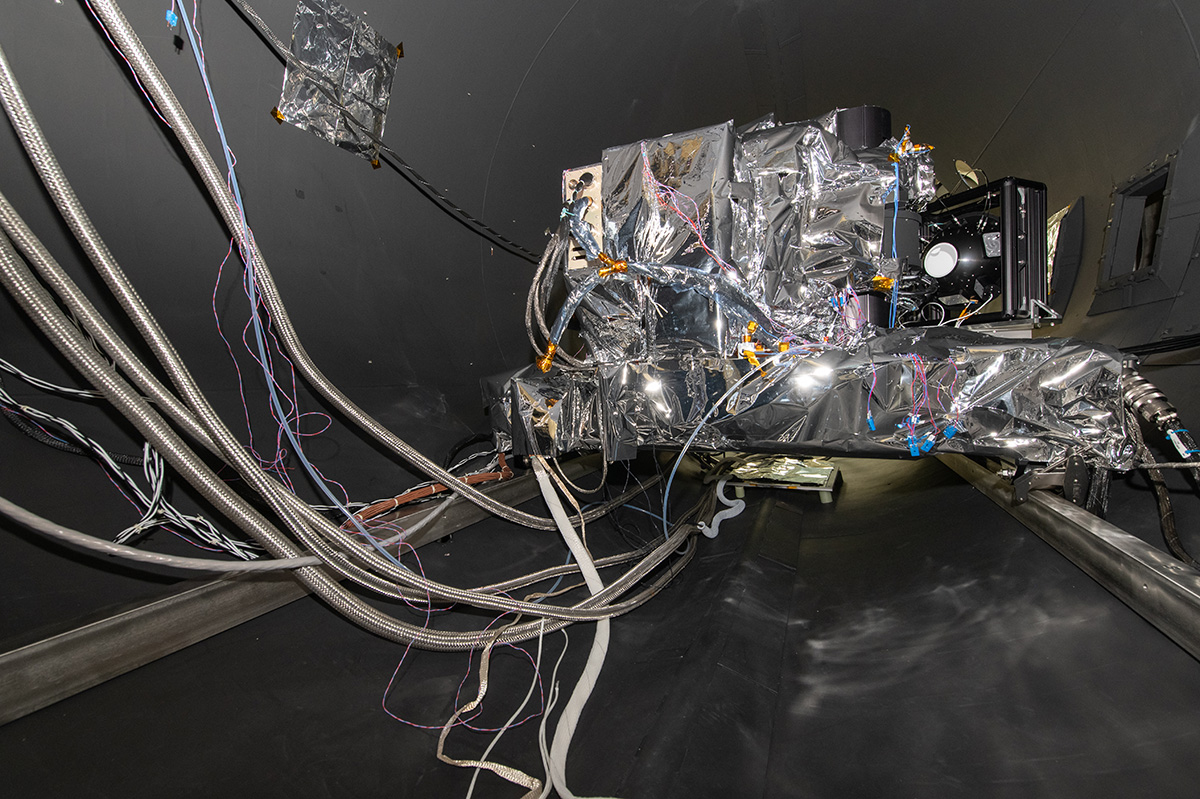
The OCI ETU rolls into the TVAC chamber. Lines are for electrical connections, temperature sensors, accelerometers, and liquid nitrogen, whic is used for cooling down the radiators.
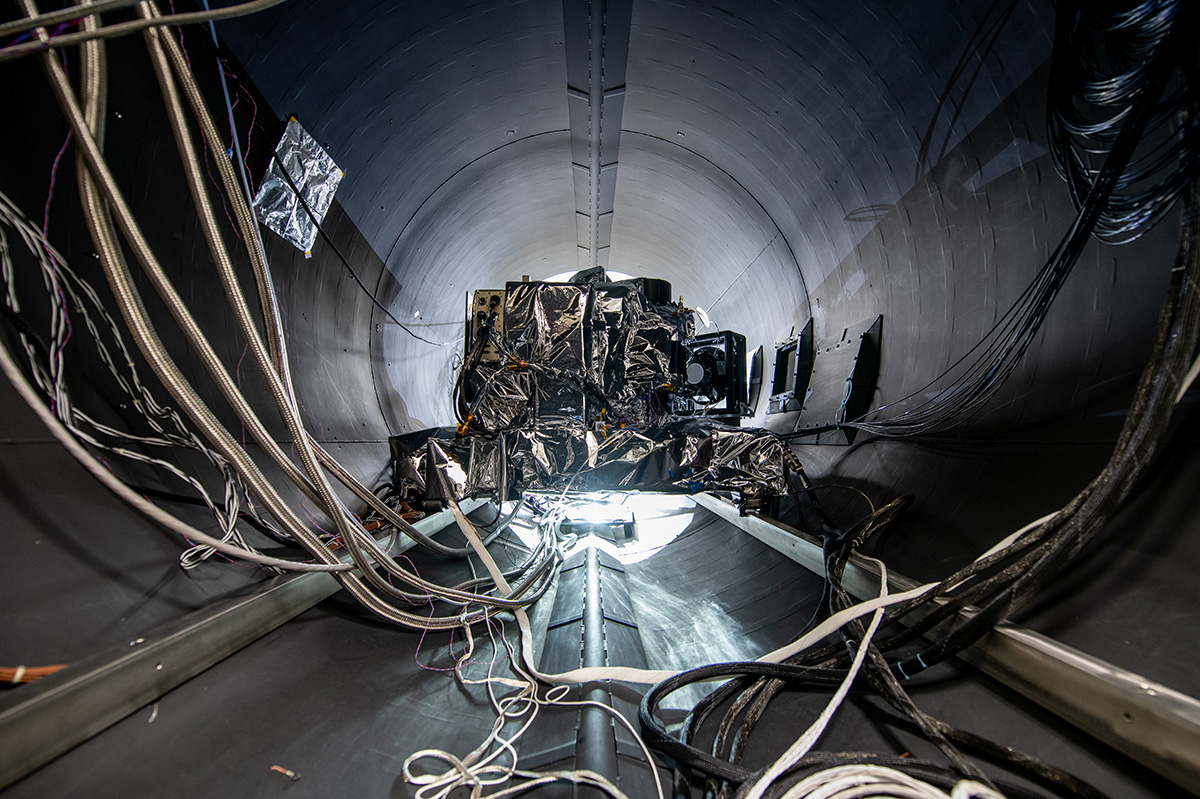
The OCI ETU rolls into the TVAC chamber. Lines are for electrical connections, temperature sensors, accelerometers, and liquid nitrogen, whic is used for cooling down the radiators.
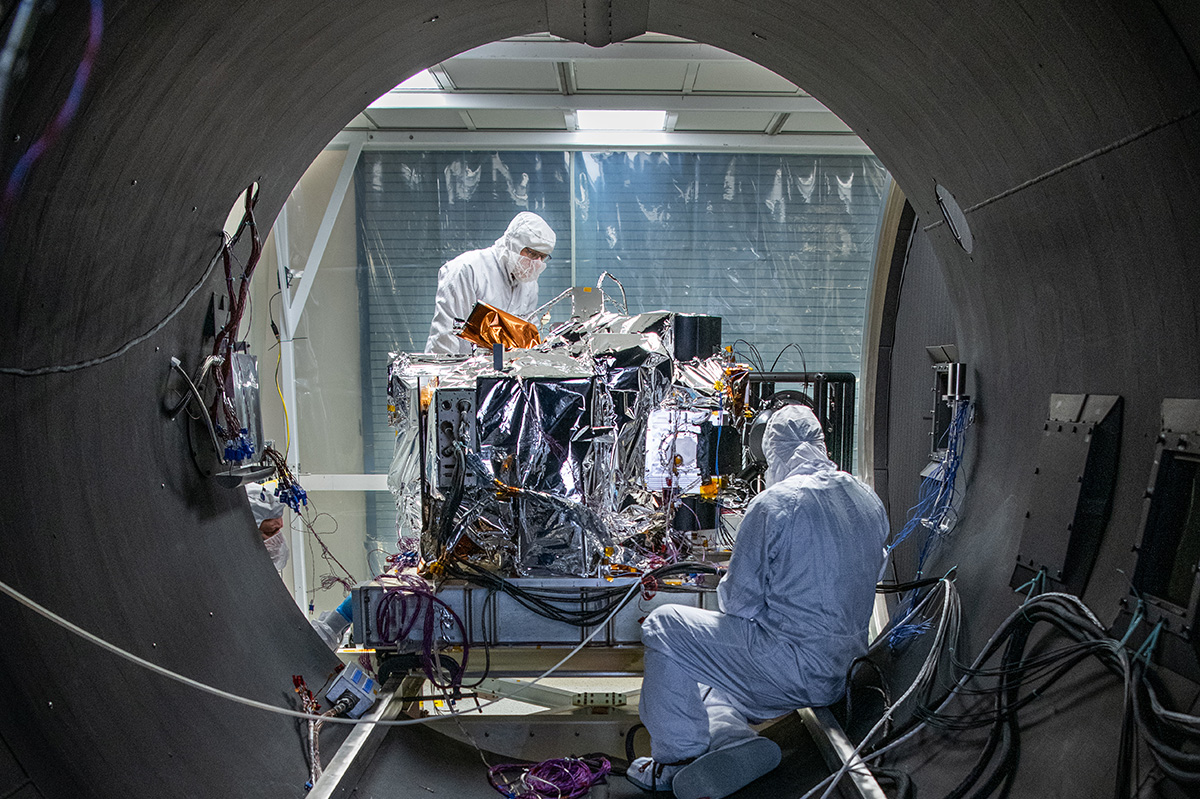
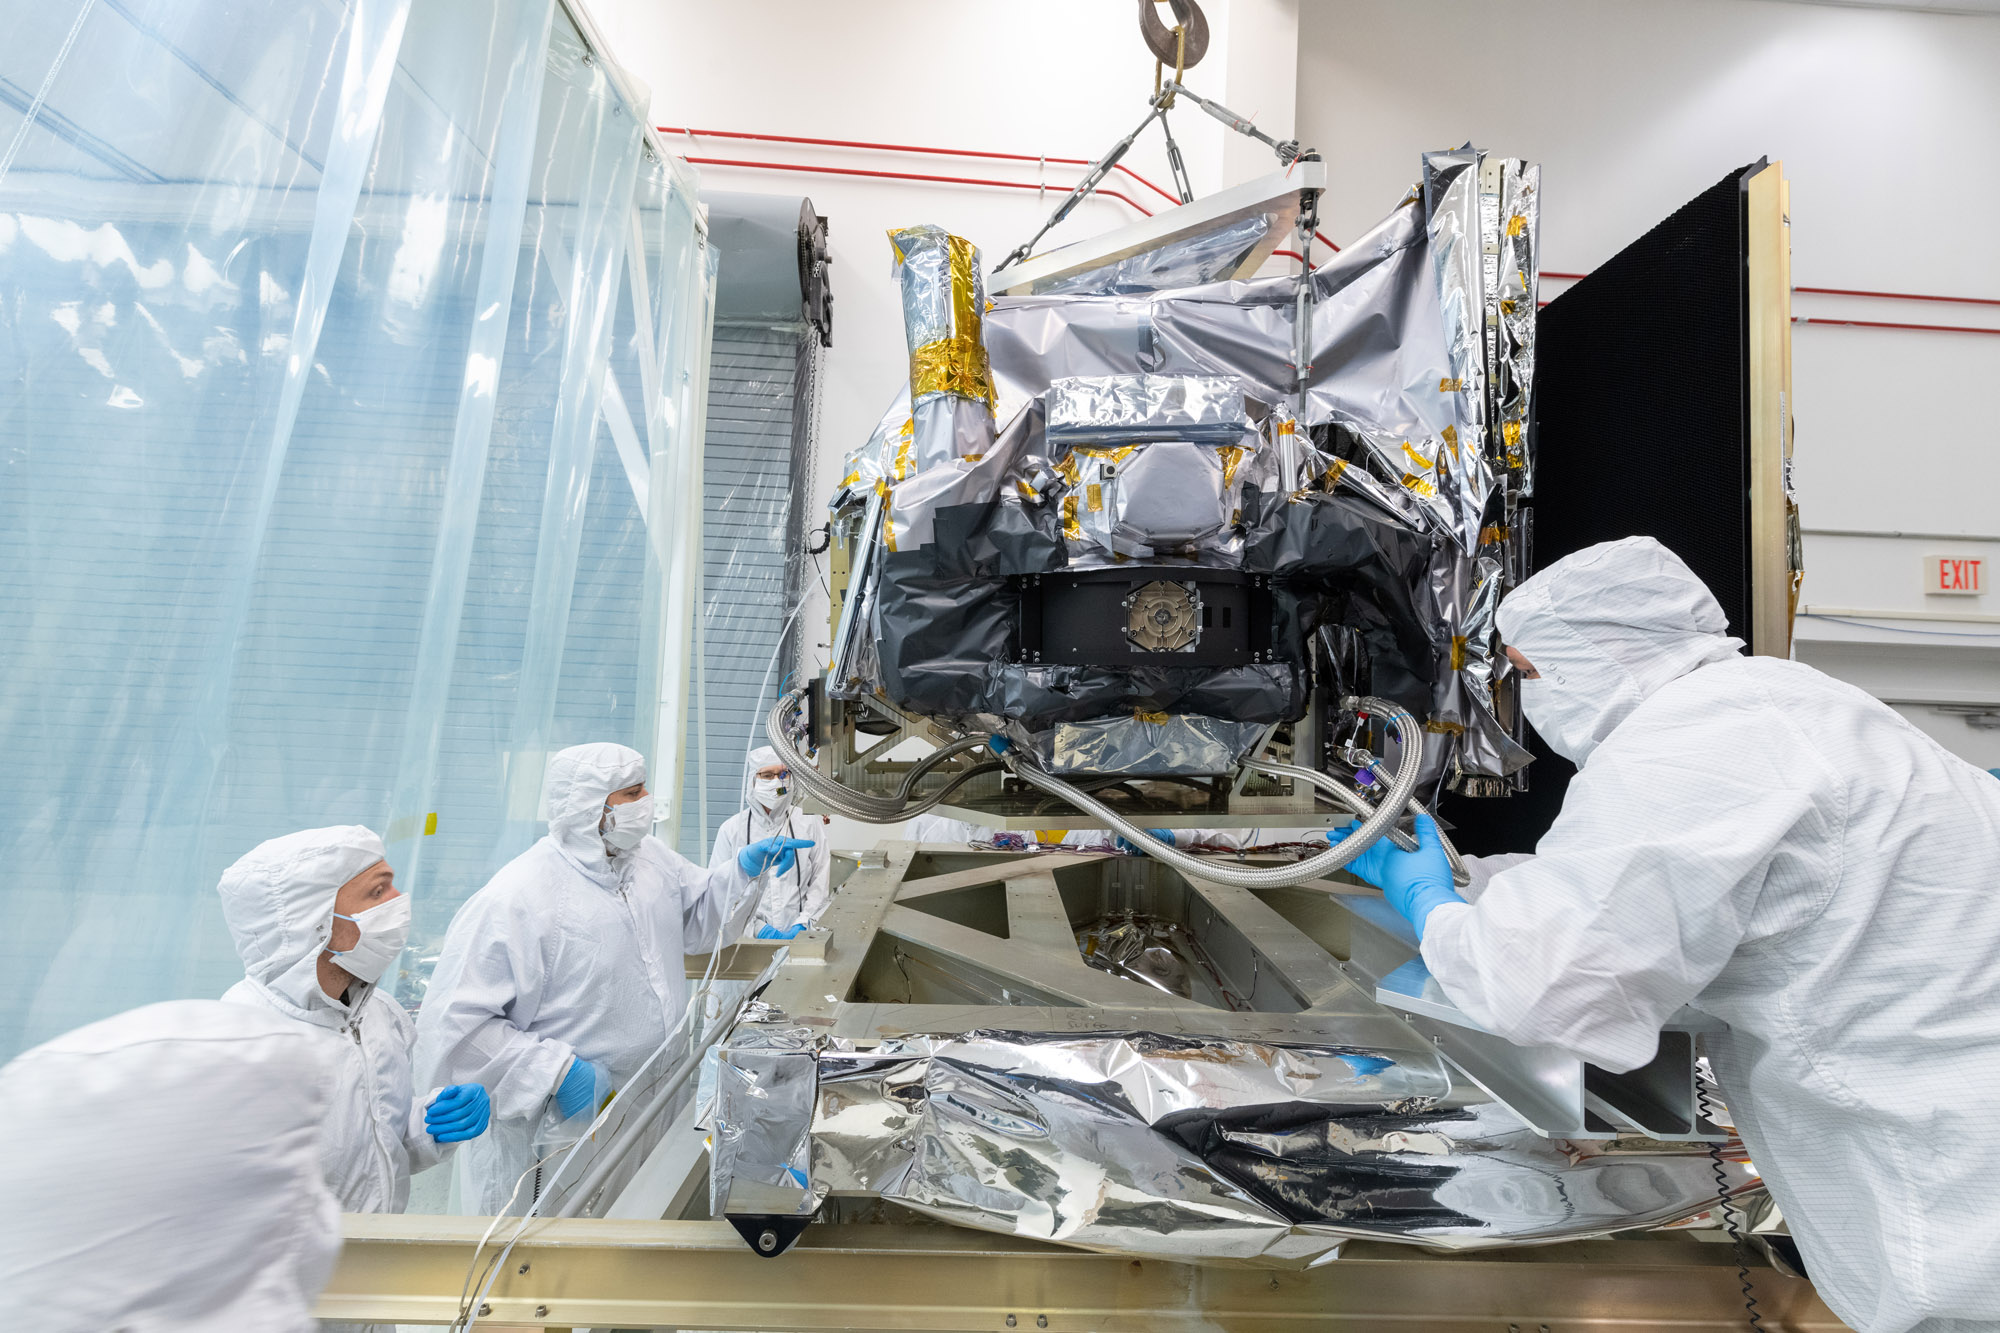
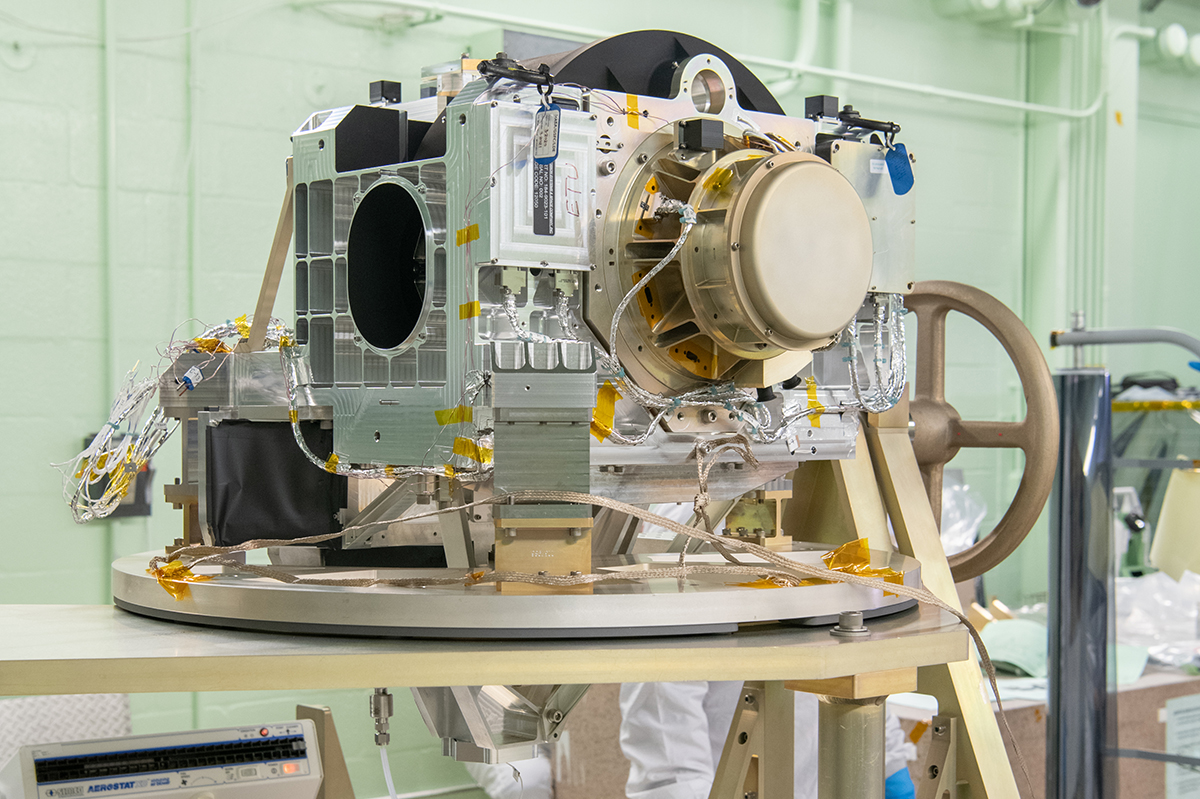
Preparing the OCI ETU and TVAC Cart to enter the TVAC chamber.
Preparing the OCI ETU and TVAC Cart to enter the TVAC chamber.
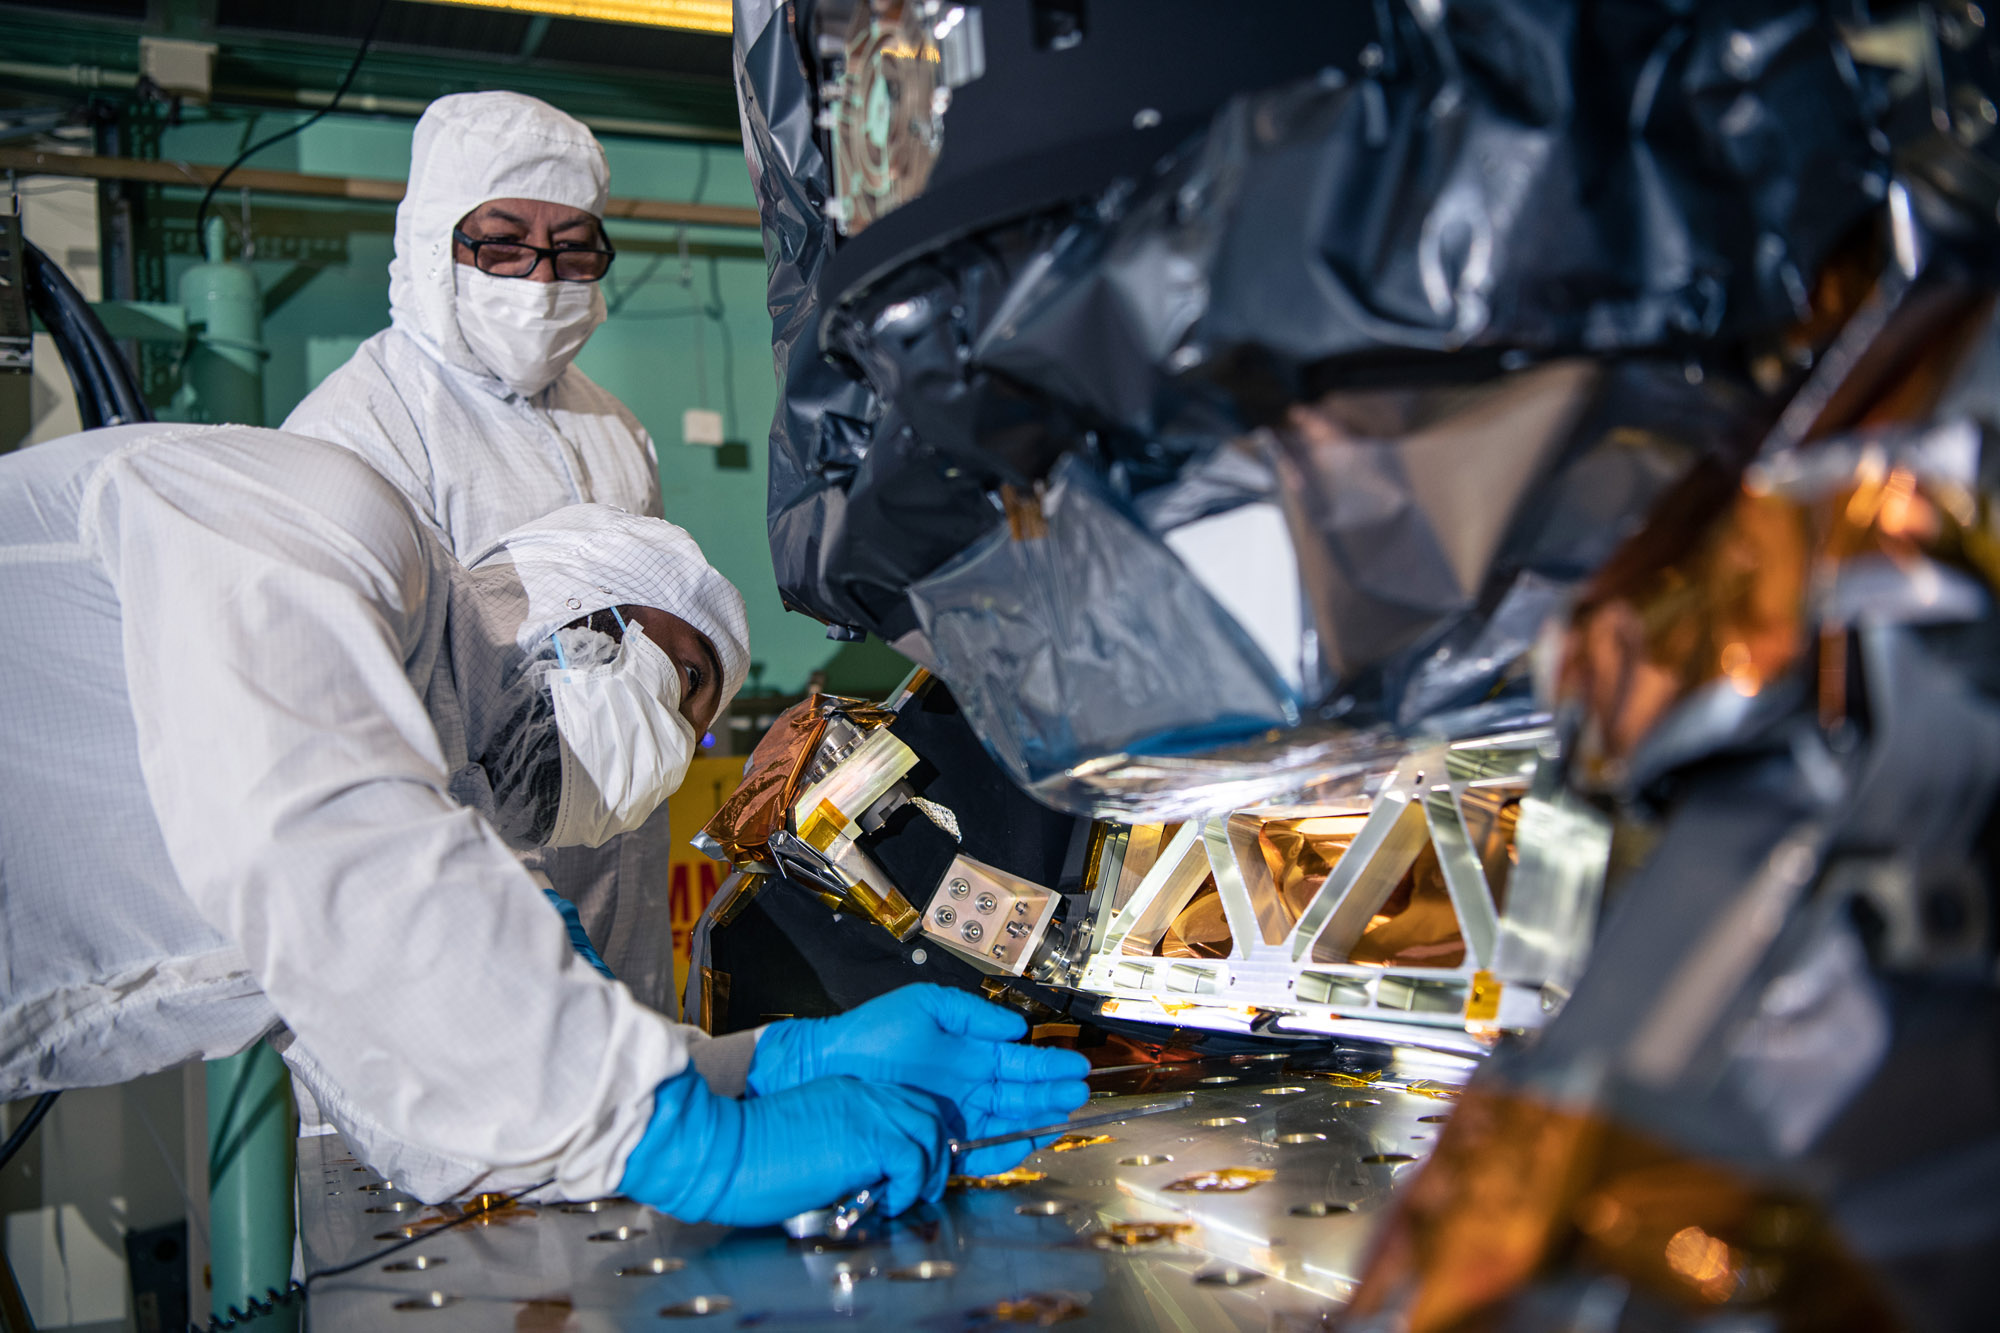
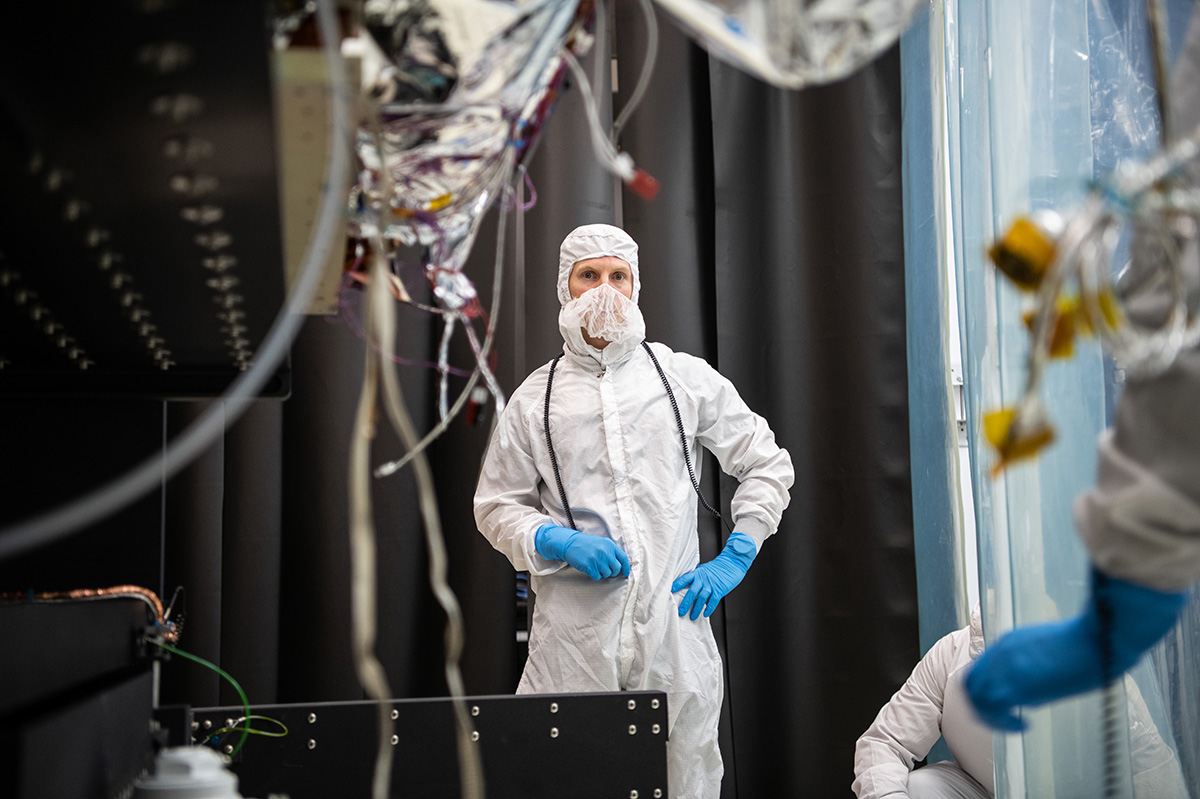
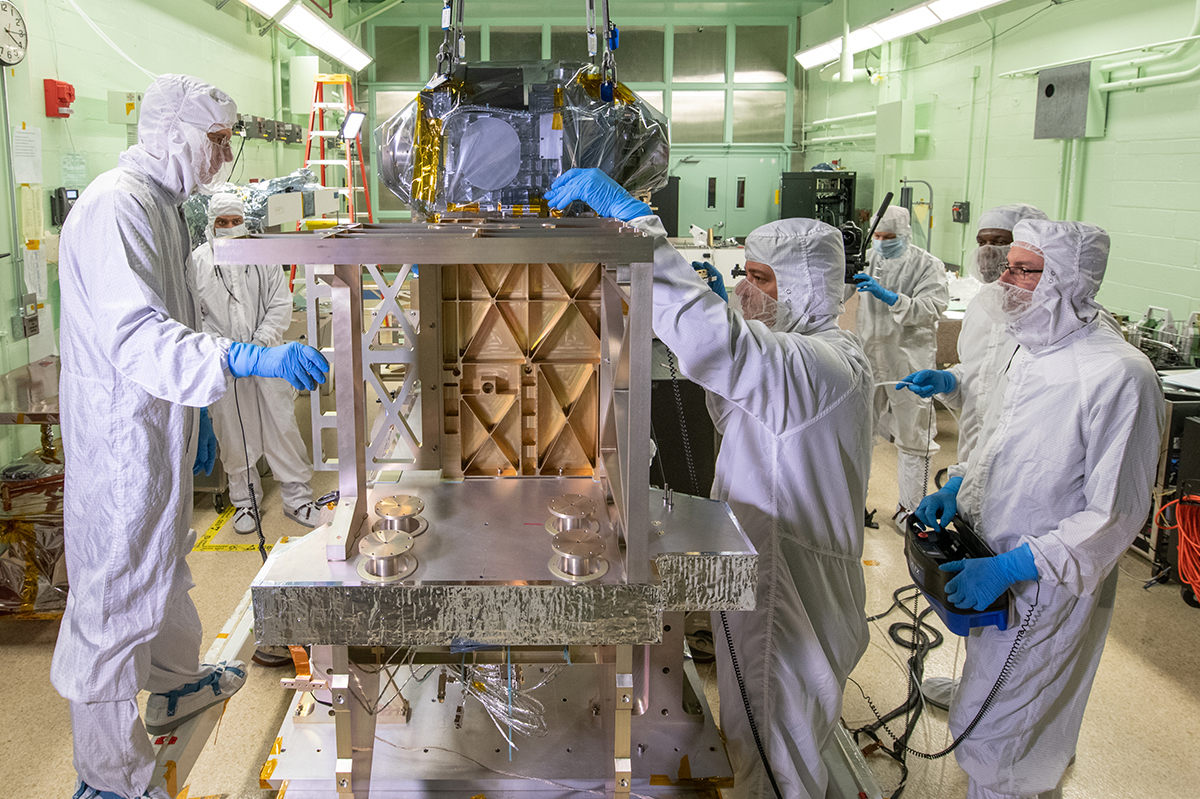
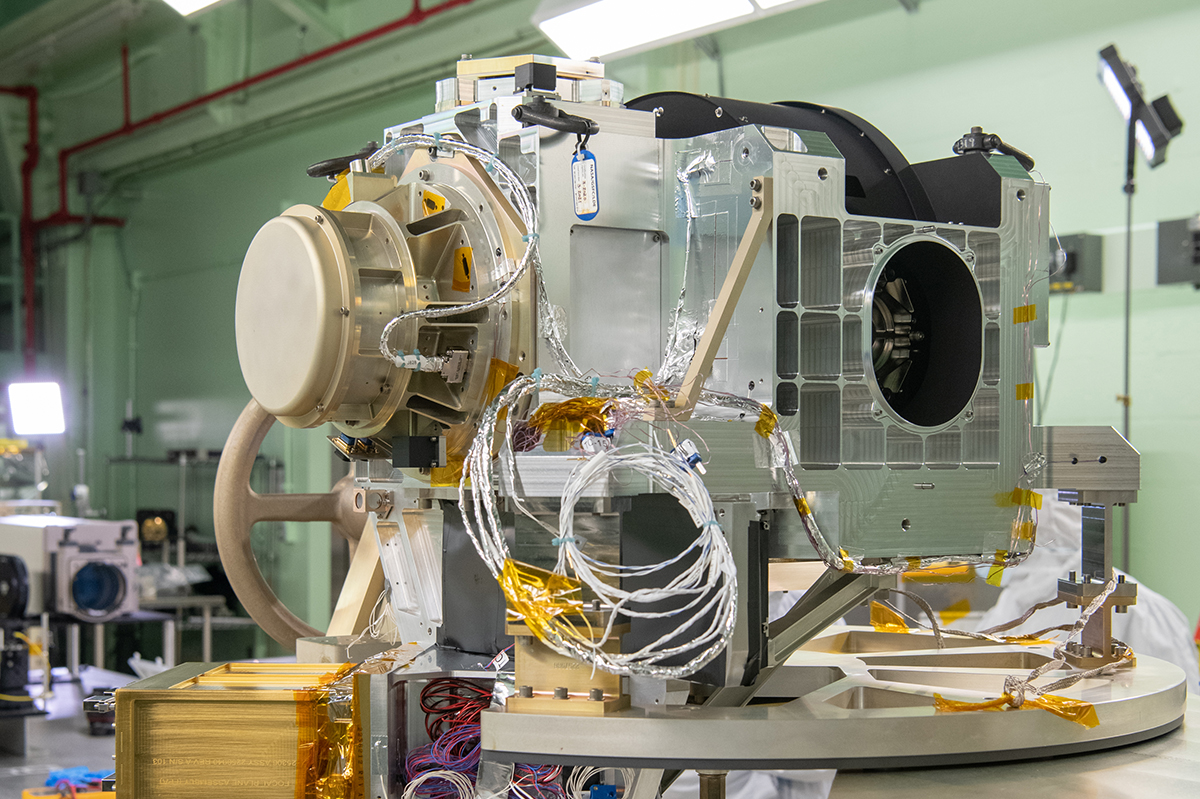
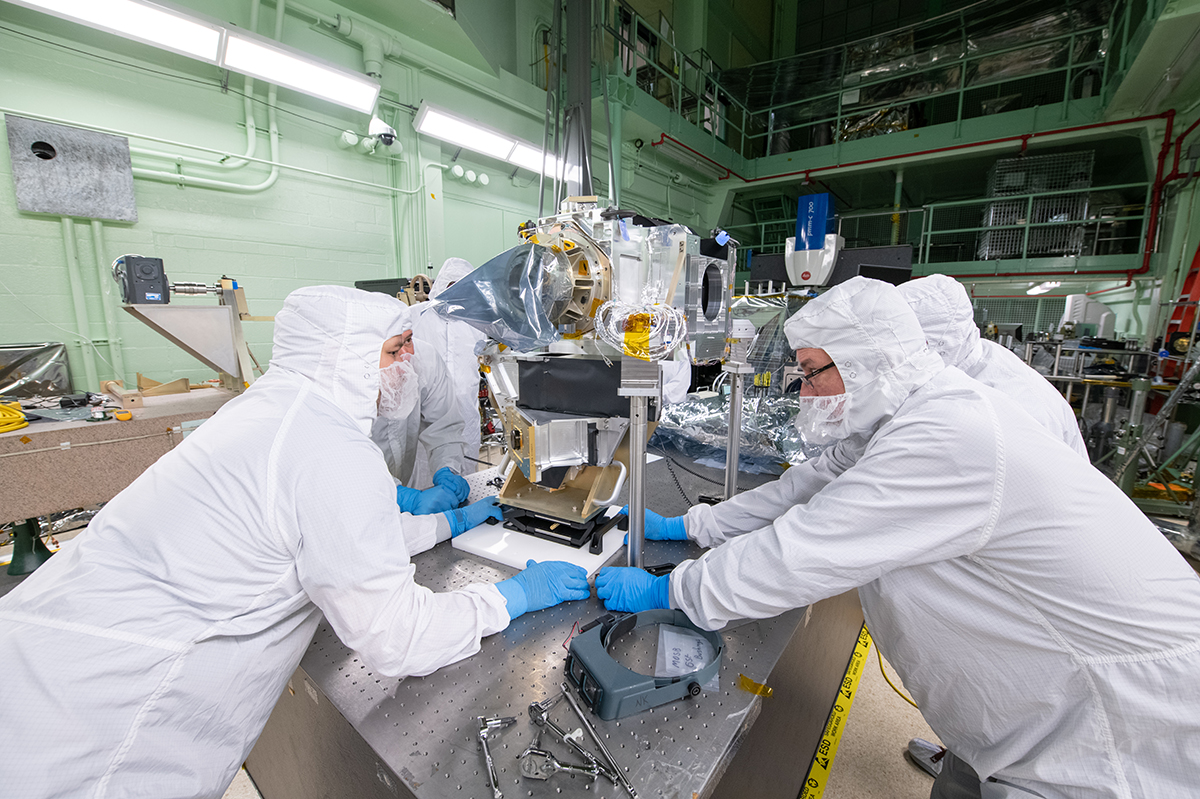
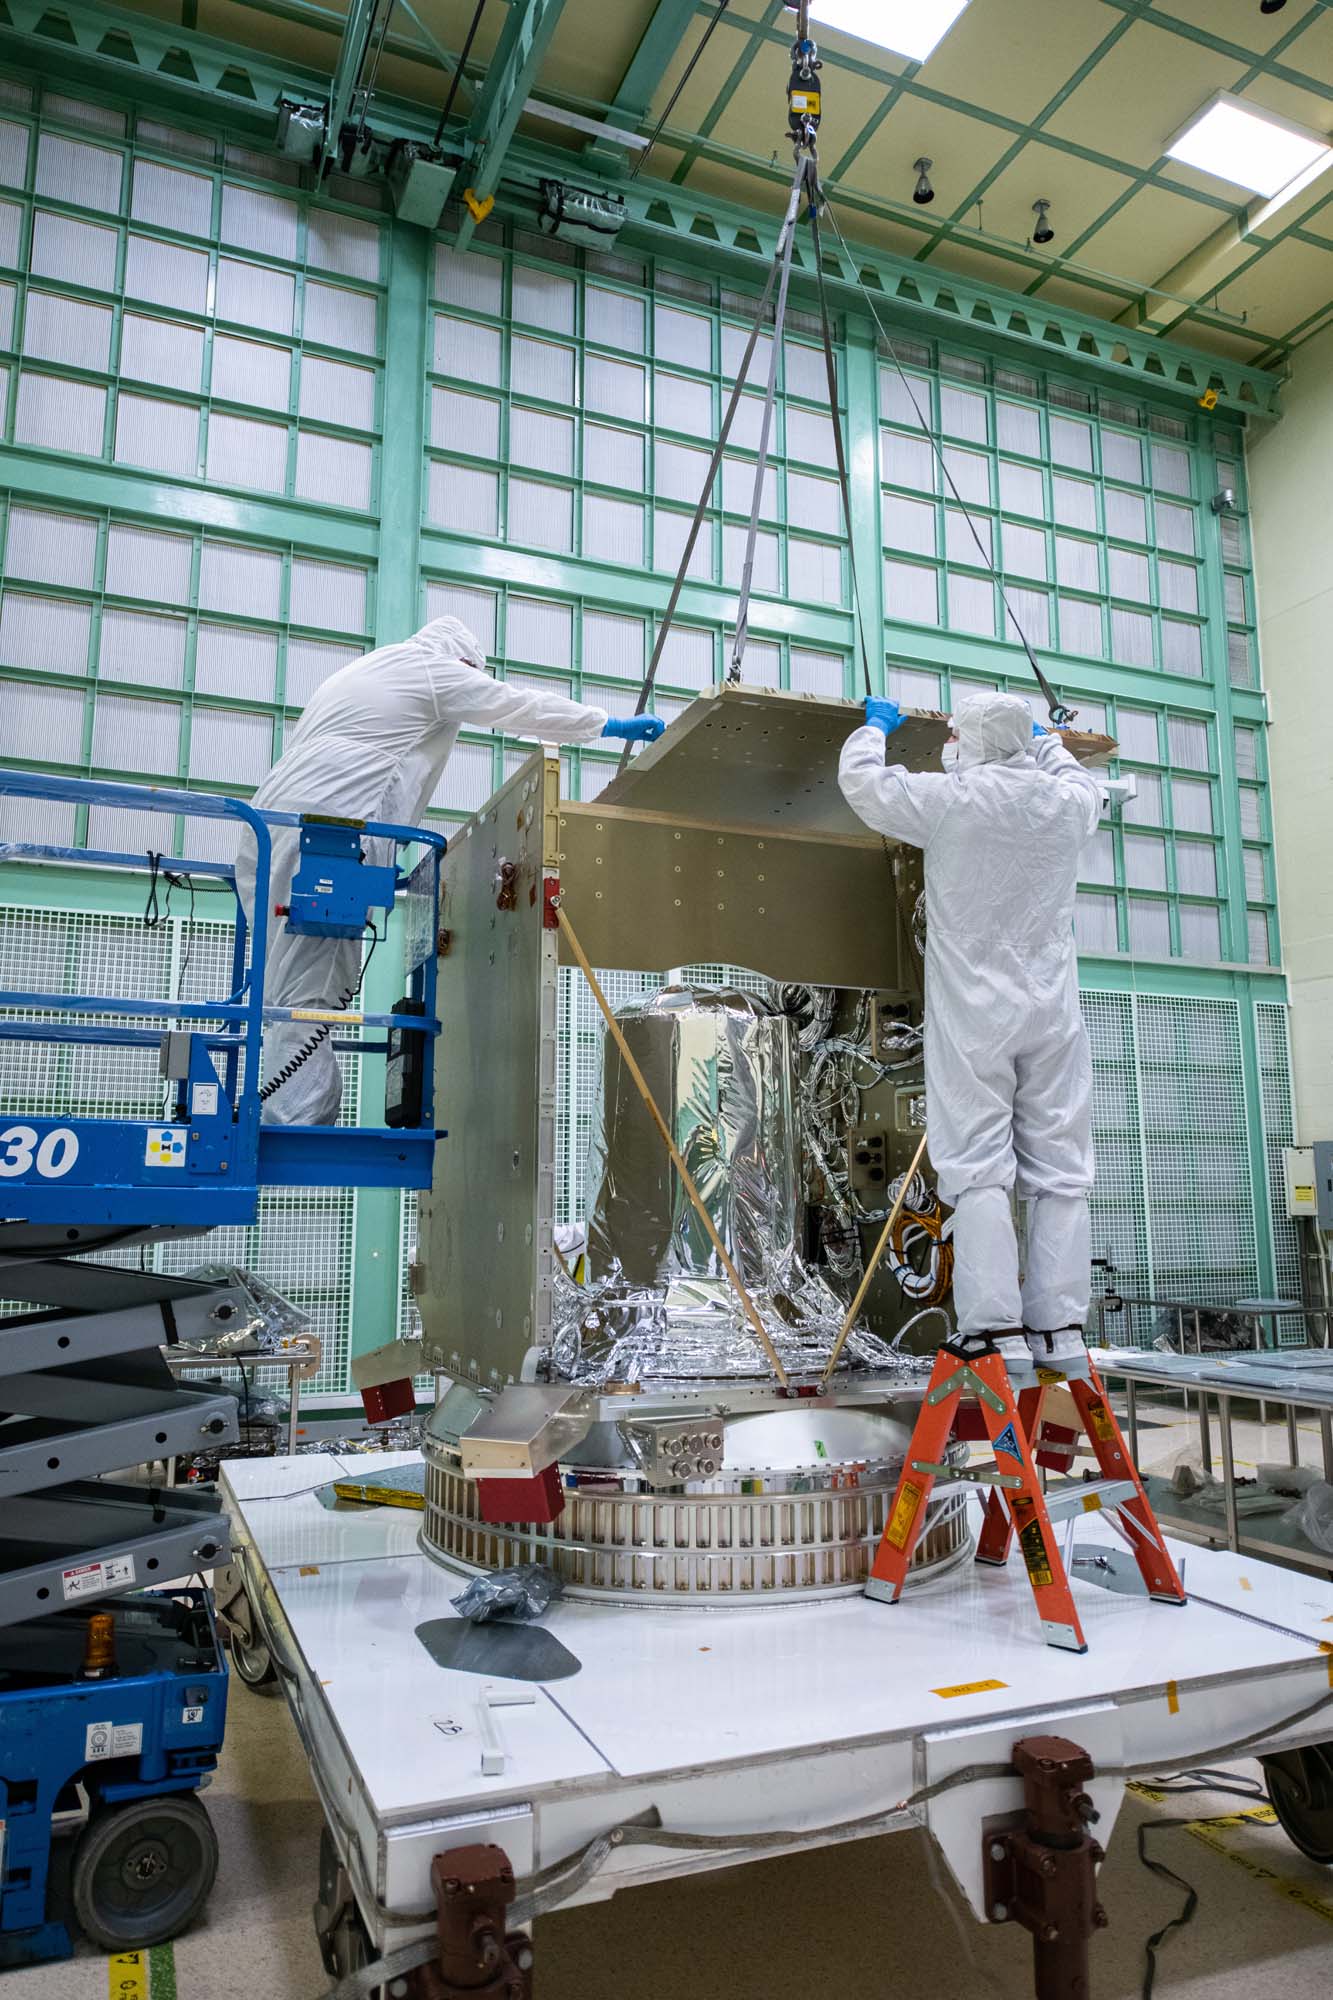
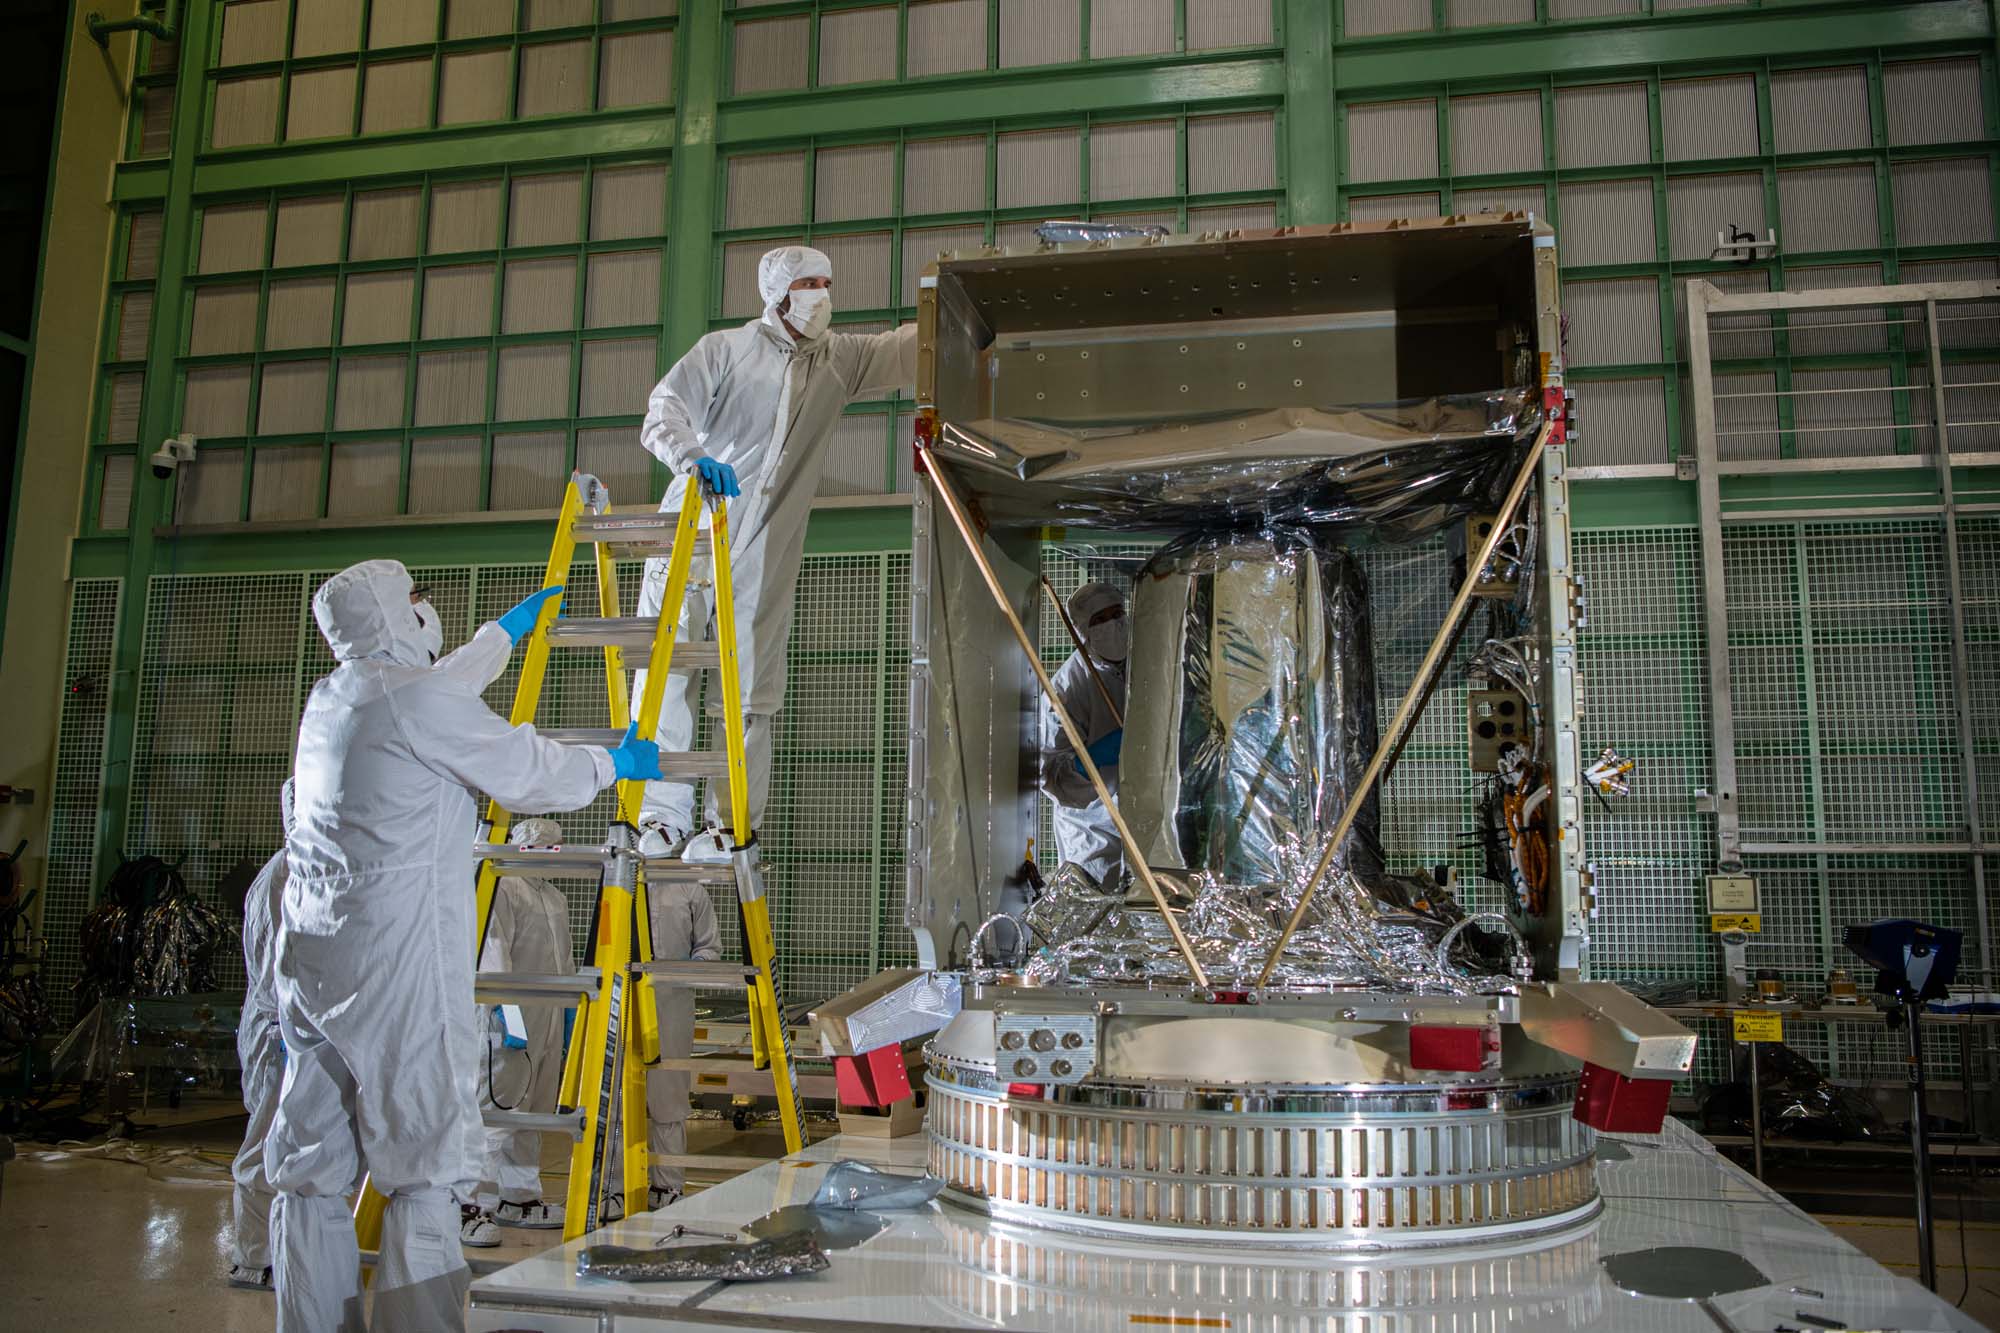
Lead Mechanical Engineer Mitch Zavala observes OCI ETU integration activities.
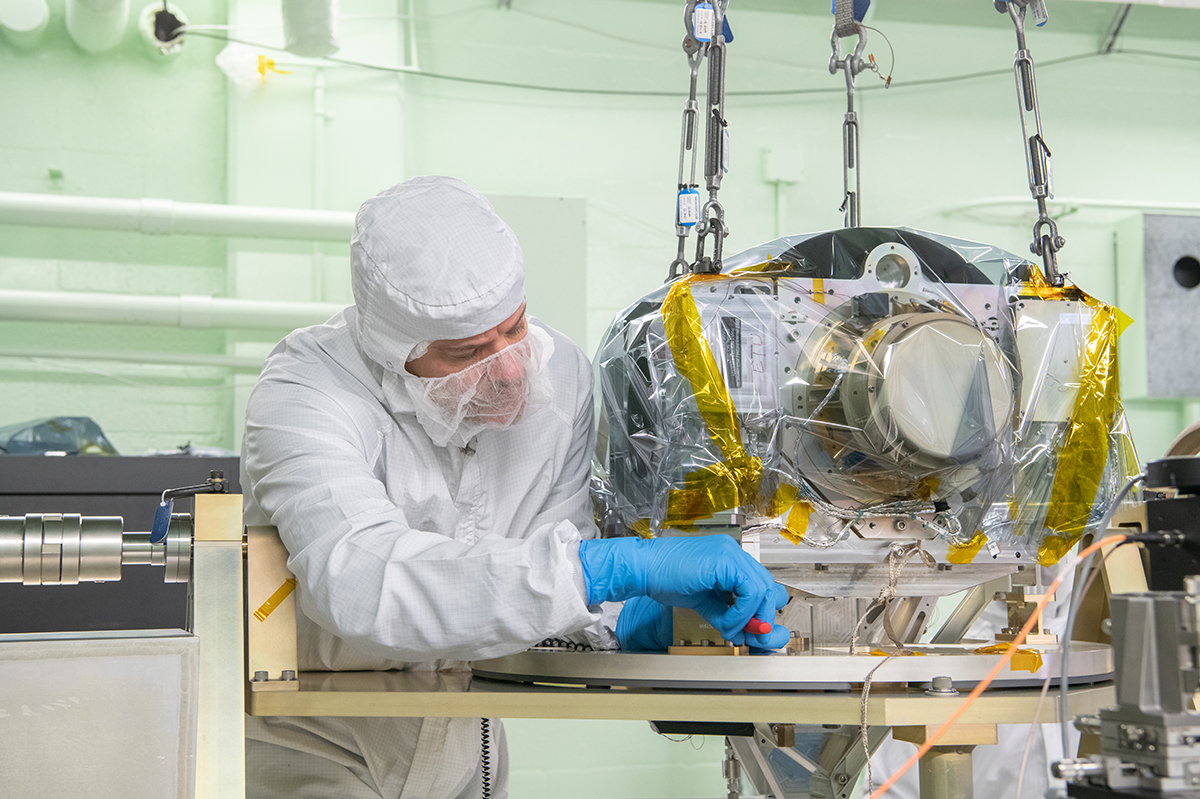
Quality Assurance (QA) Engineer Brad Weideman witnesses the OCI ETU hardware installation.
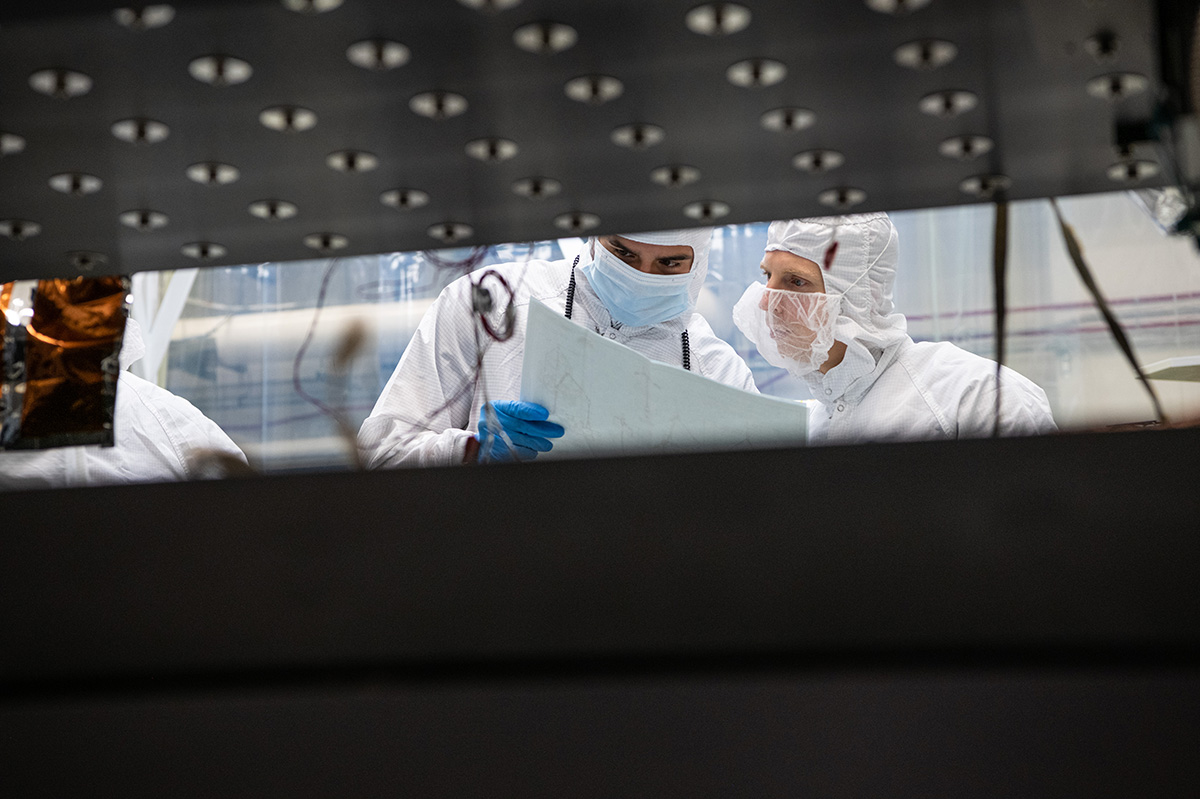
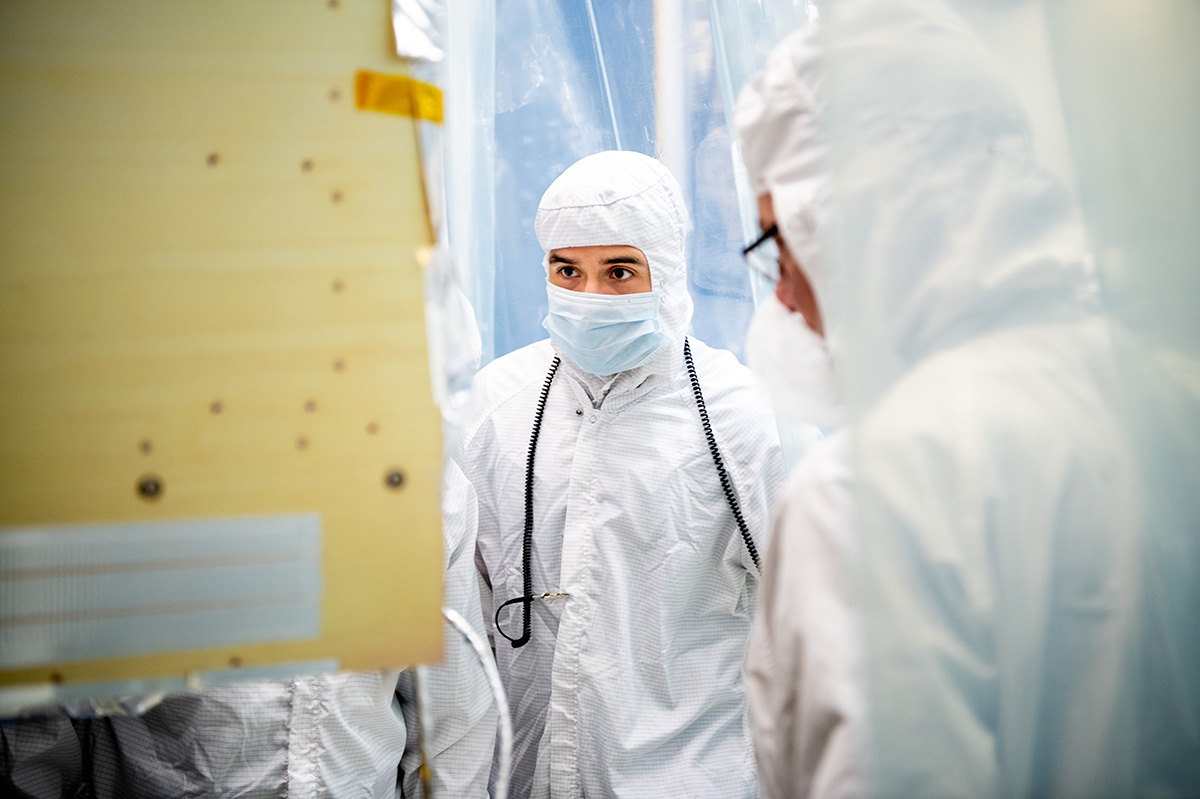
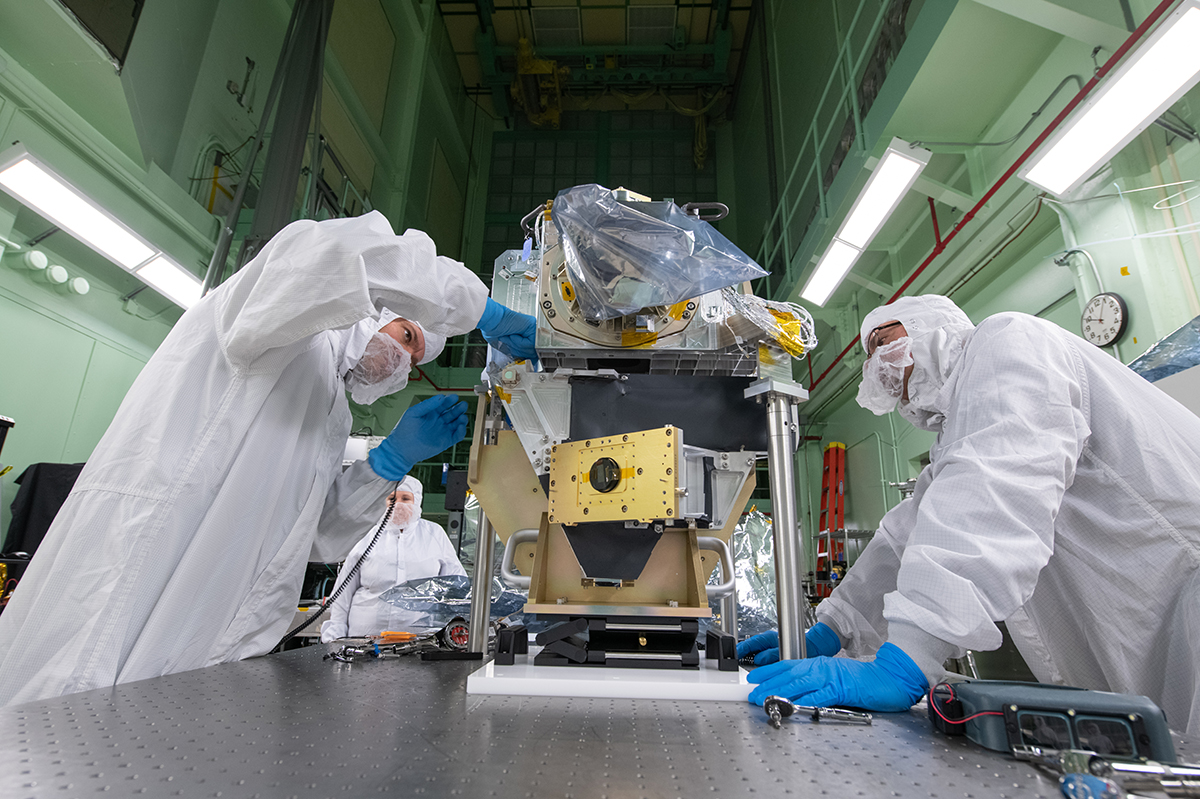
A mechanical engineer reviews integration documentation with the QA Engineer.
NASA engineers prepare for crane lifting of the OCI ETU.
De-integrating the OCI ETU in preparation for lifting to the Thermal Vacuum (TVAC) Cart.
Crane lifting the OCI ETU from the GAToR to the TVAC Cart.
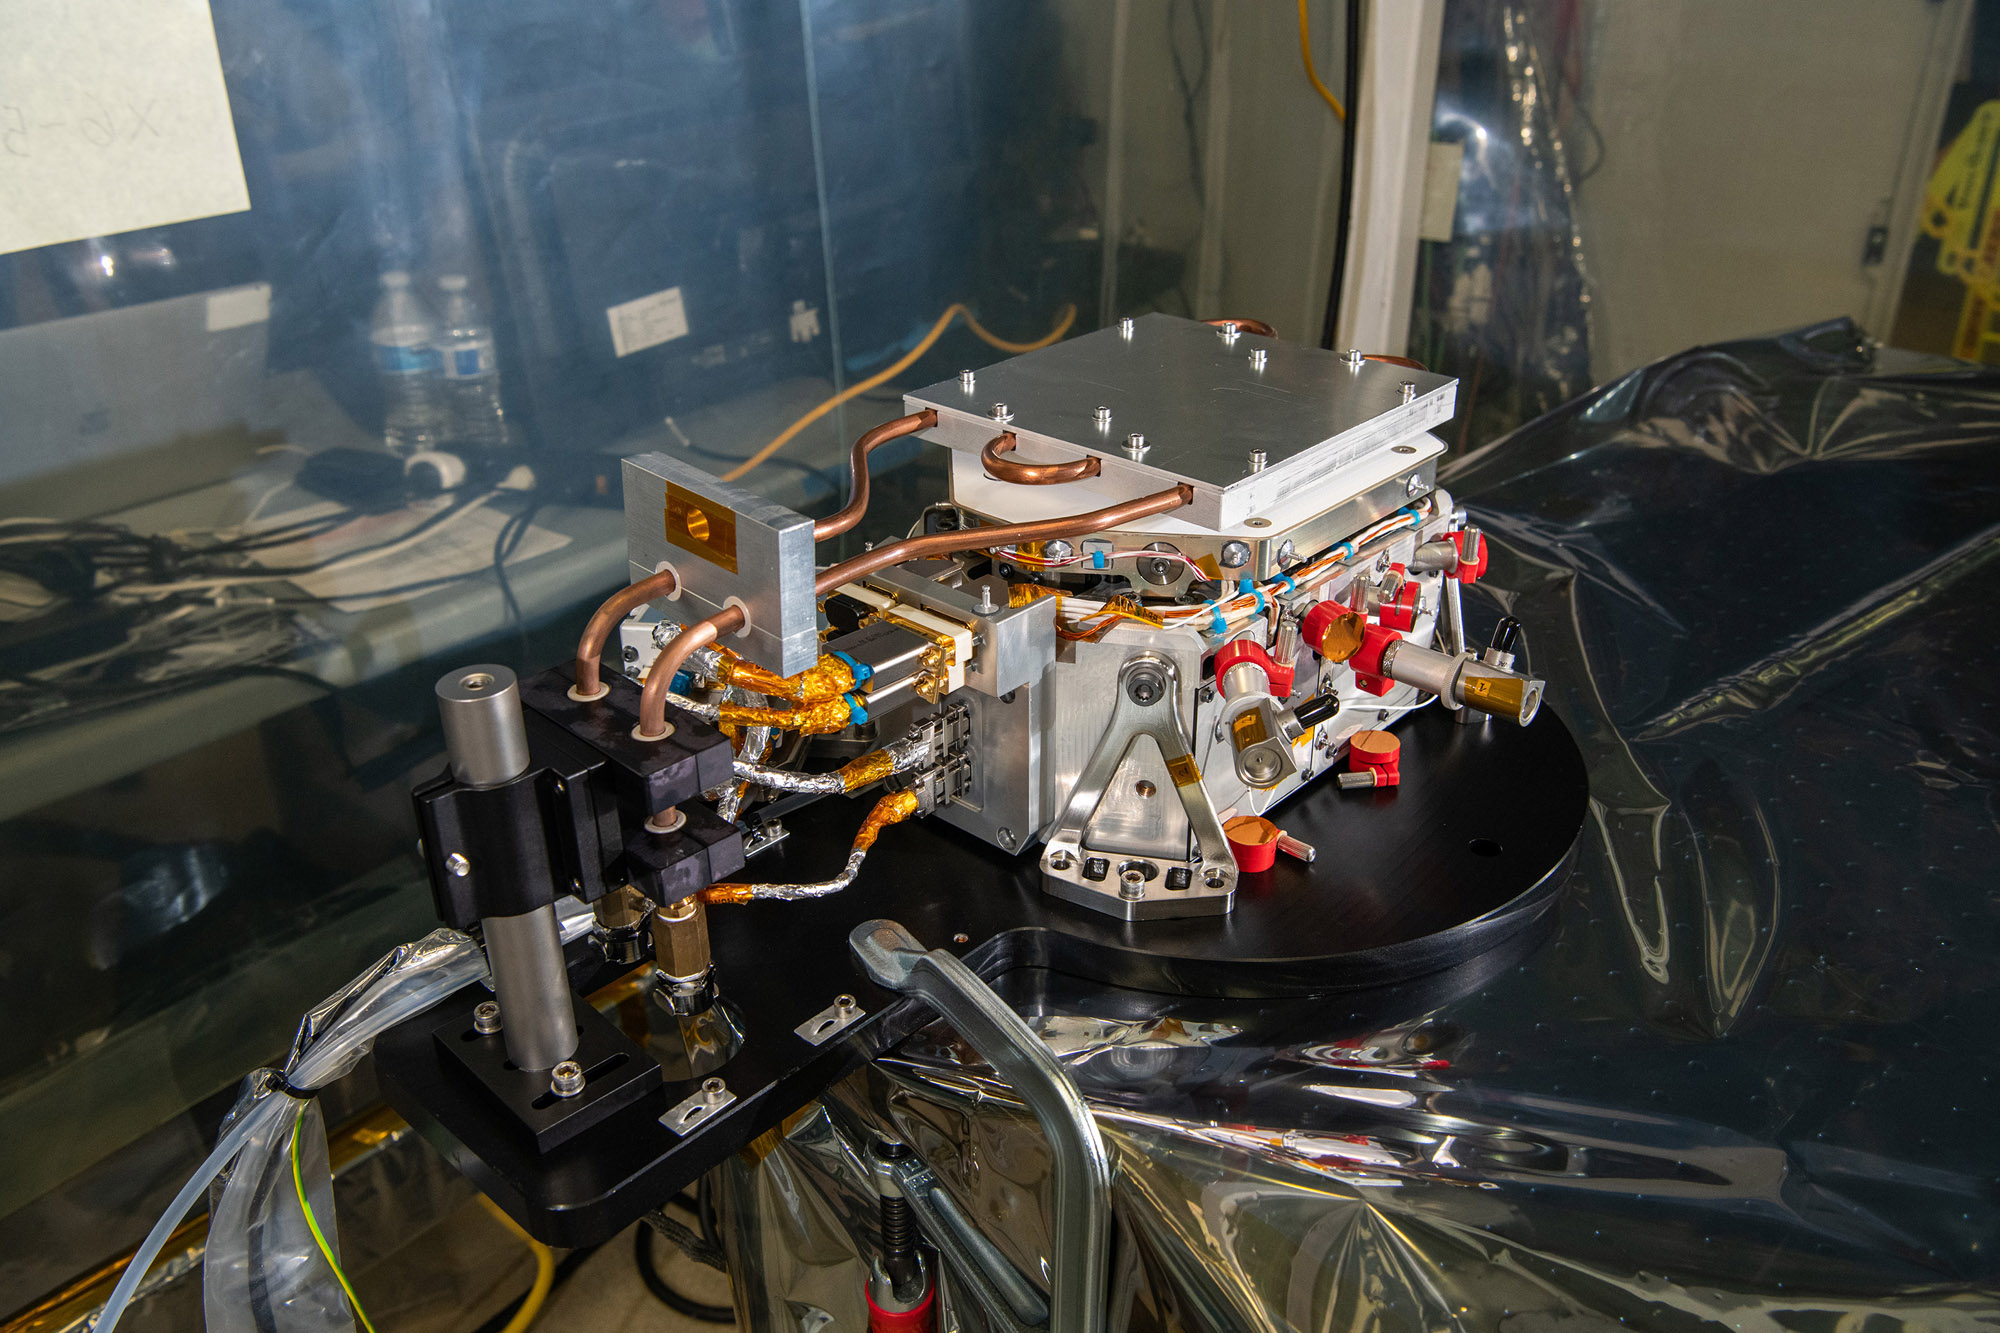
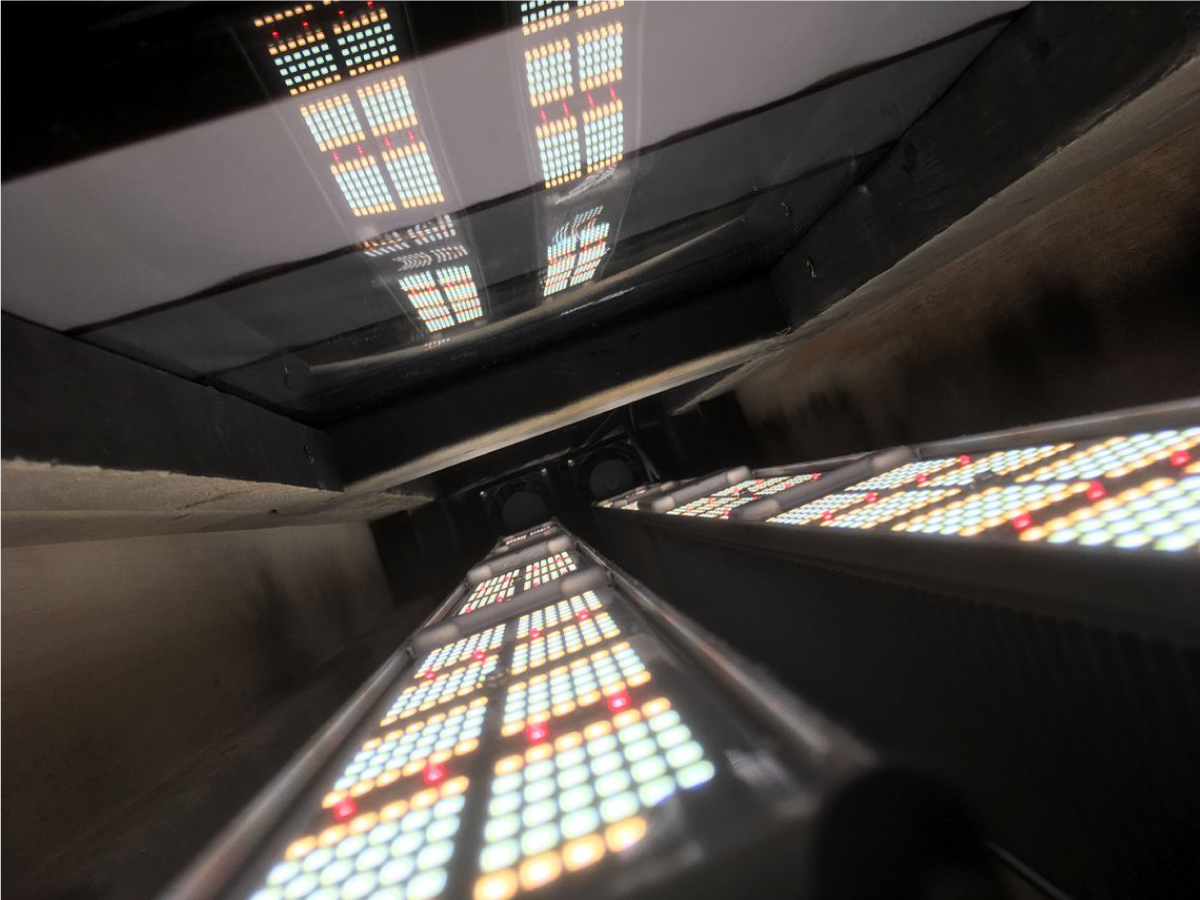
The OCI ETU with the spinning telescope scanning the calibrated light source.
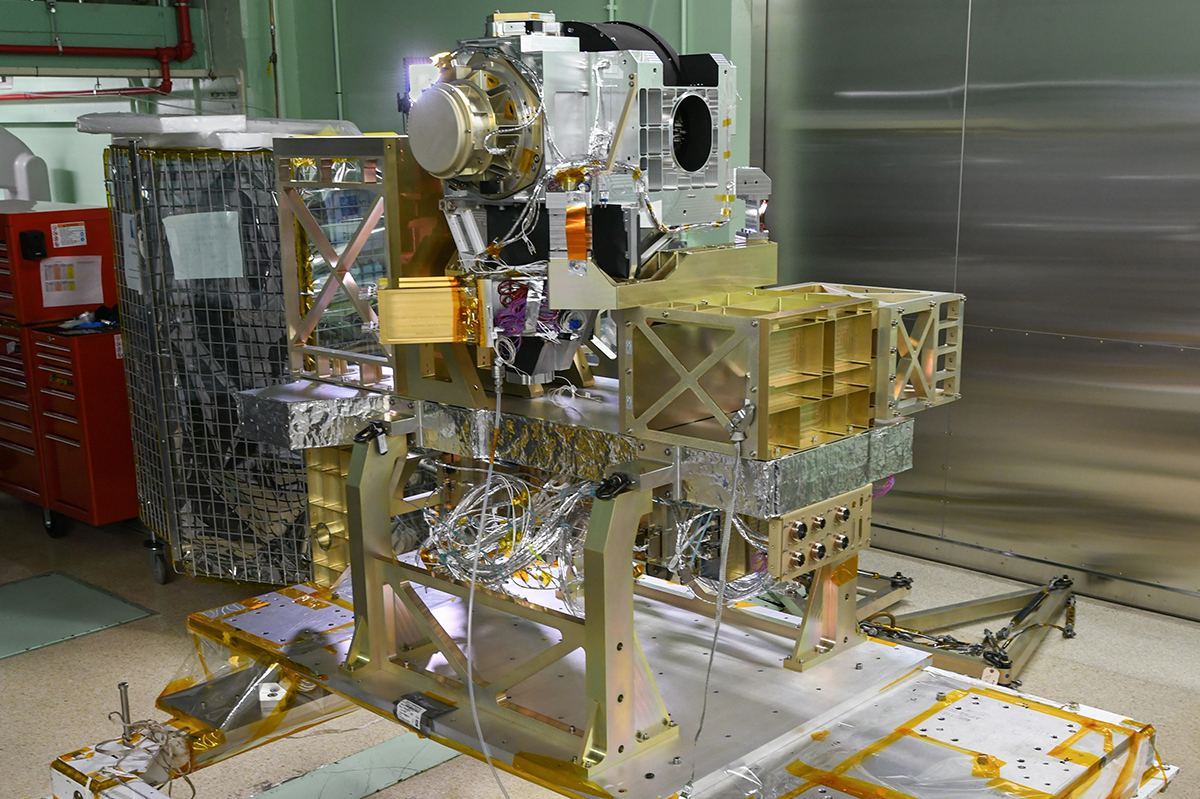
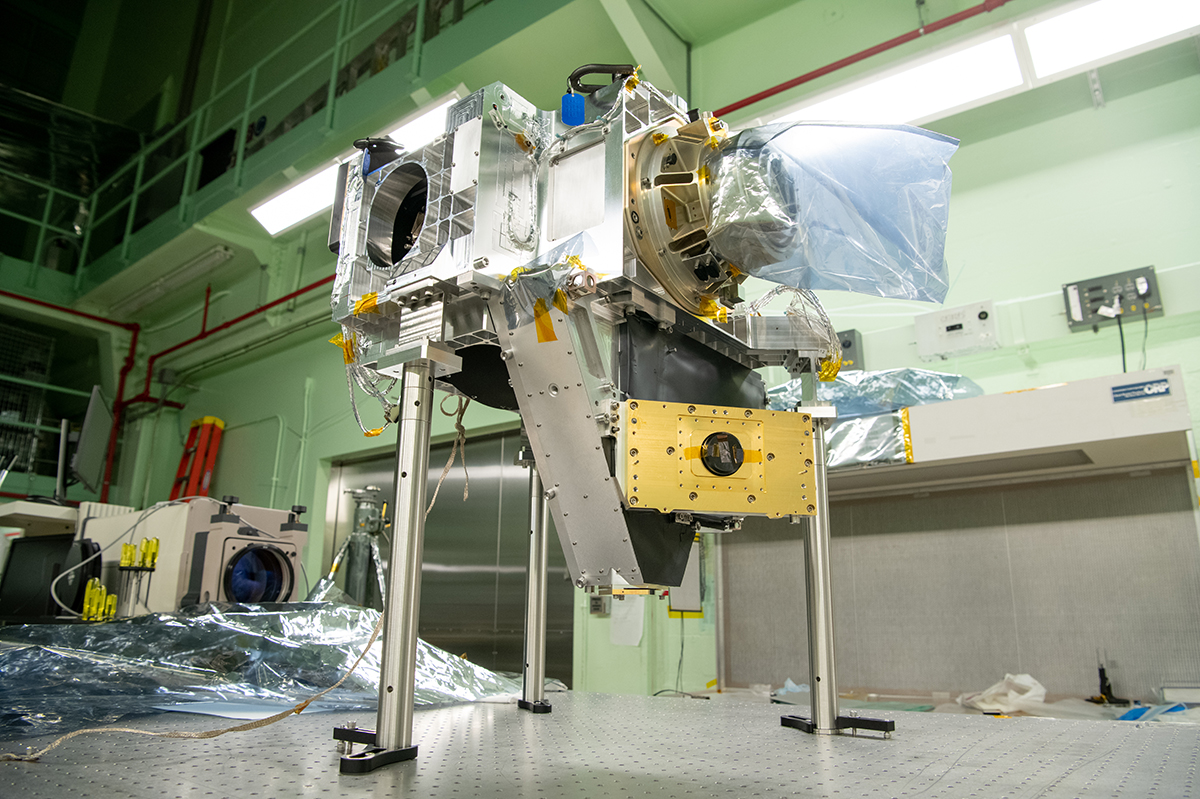
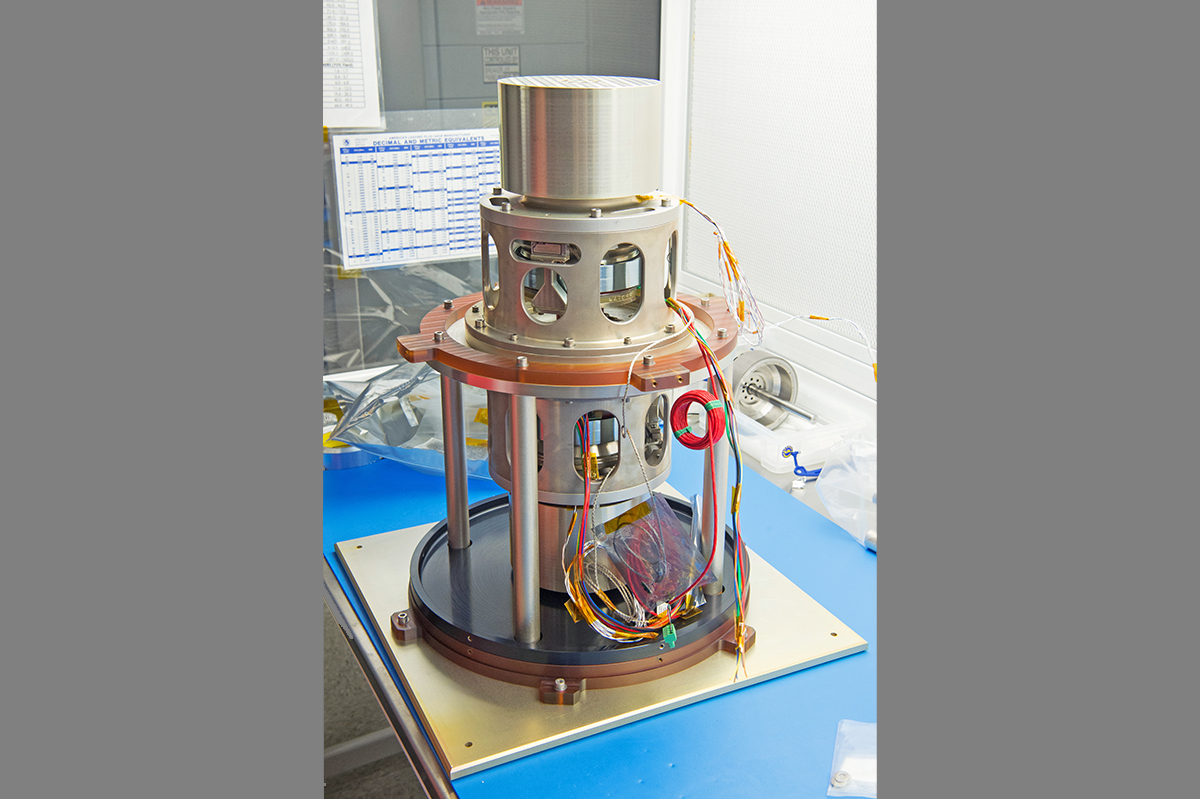
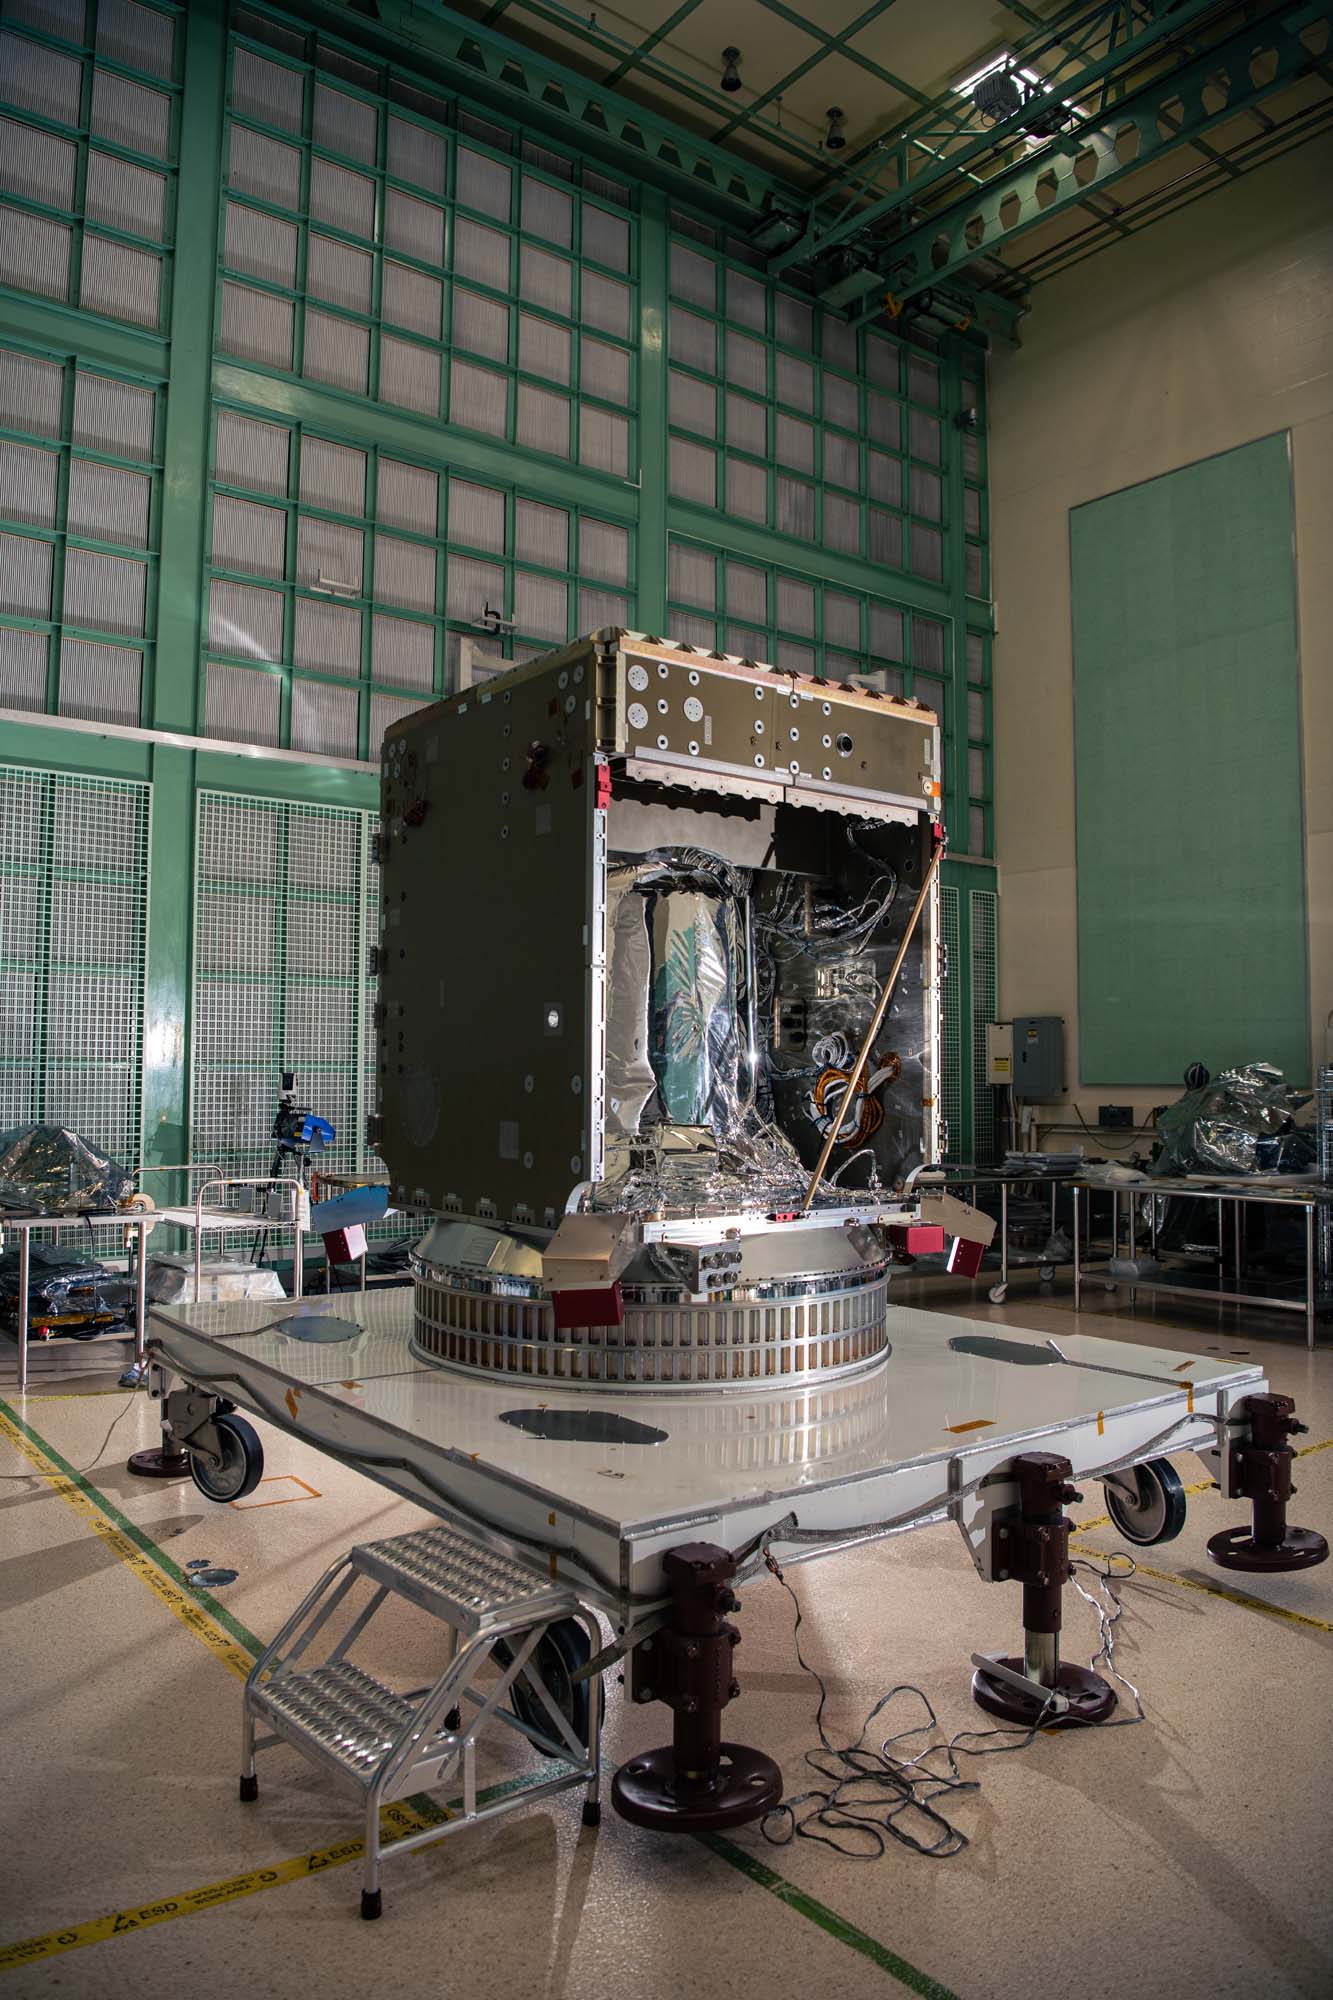
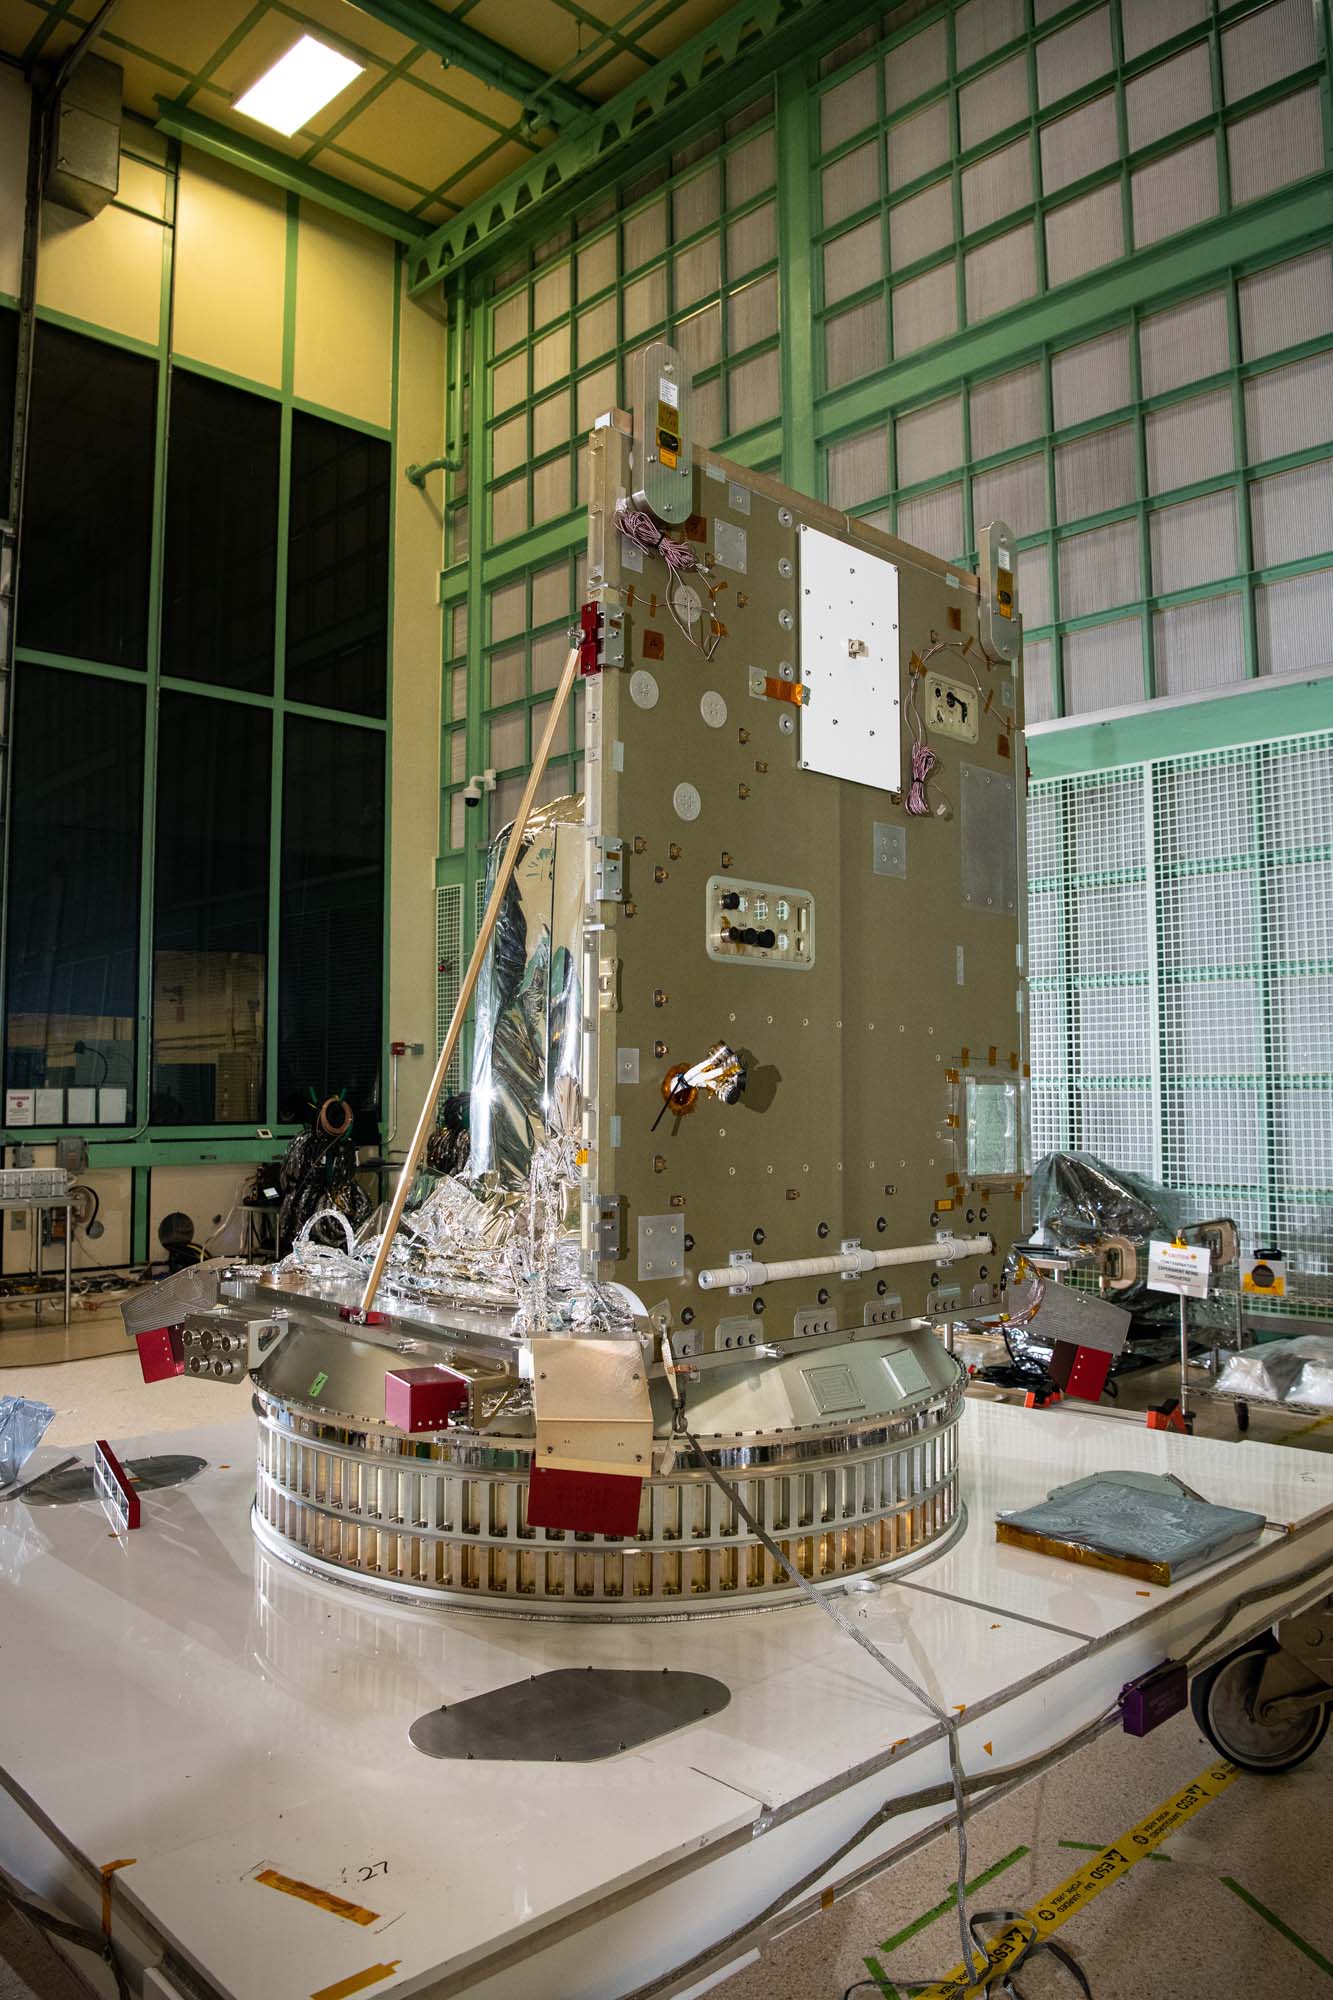
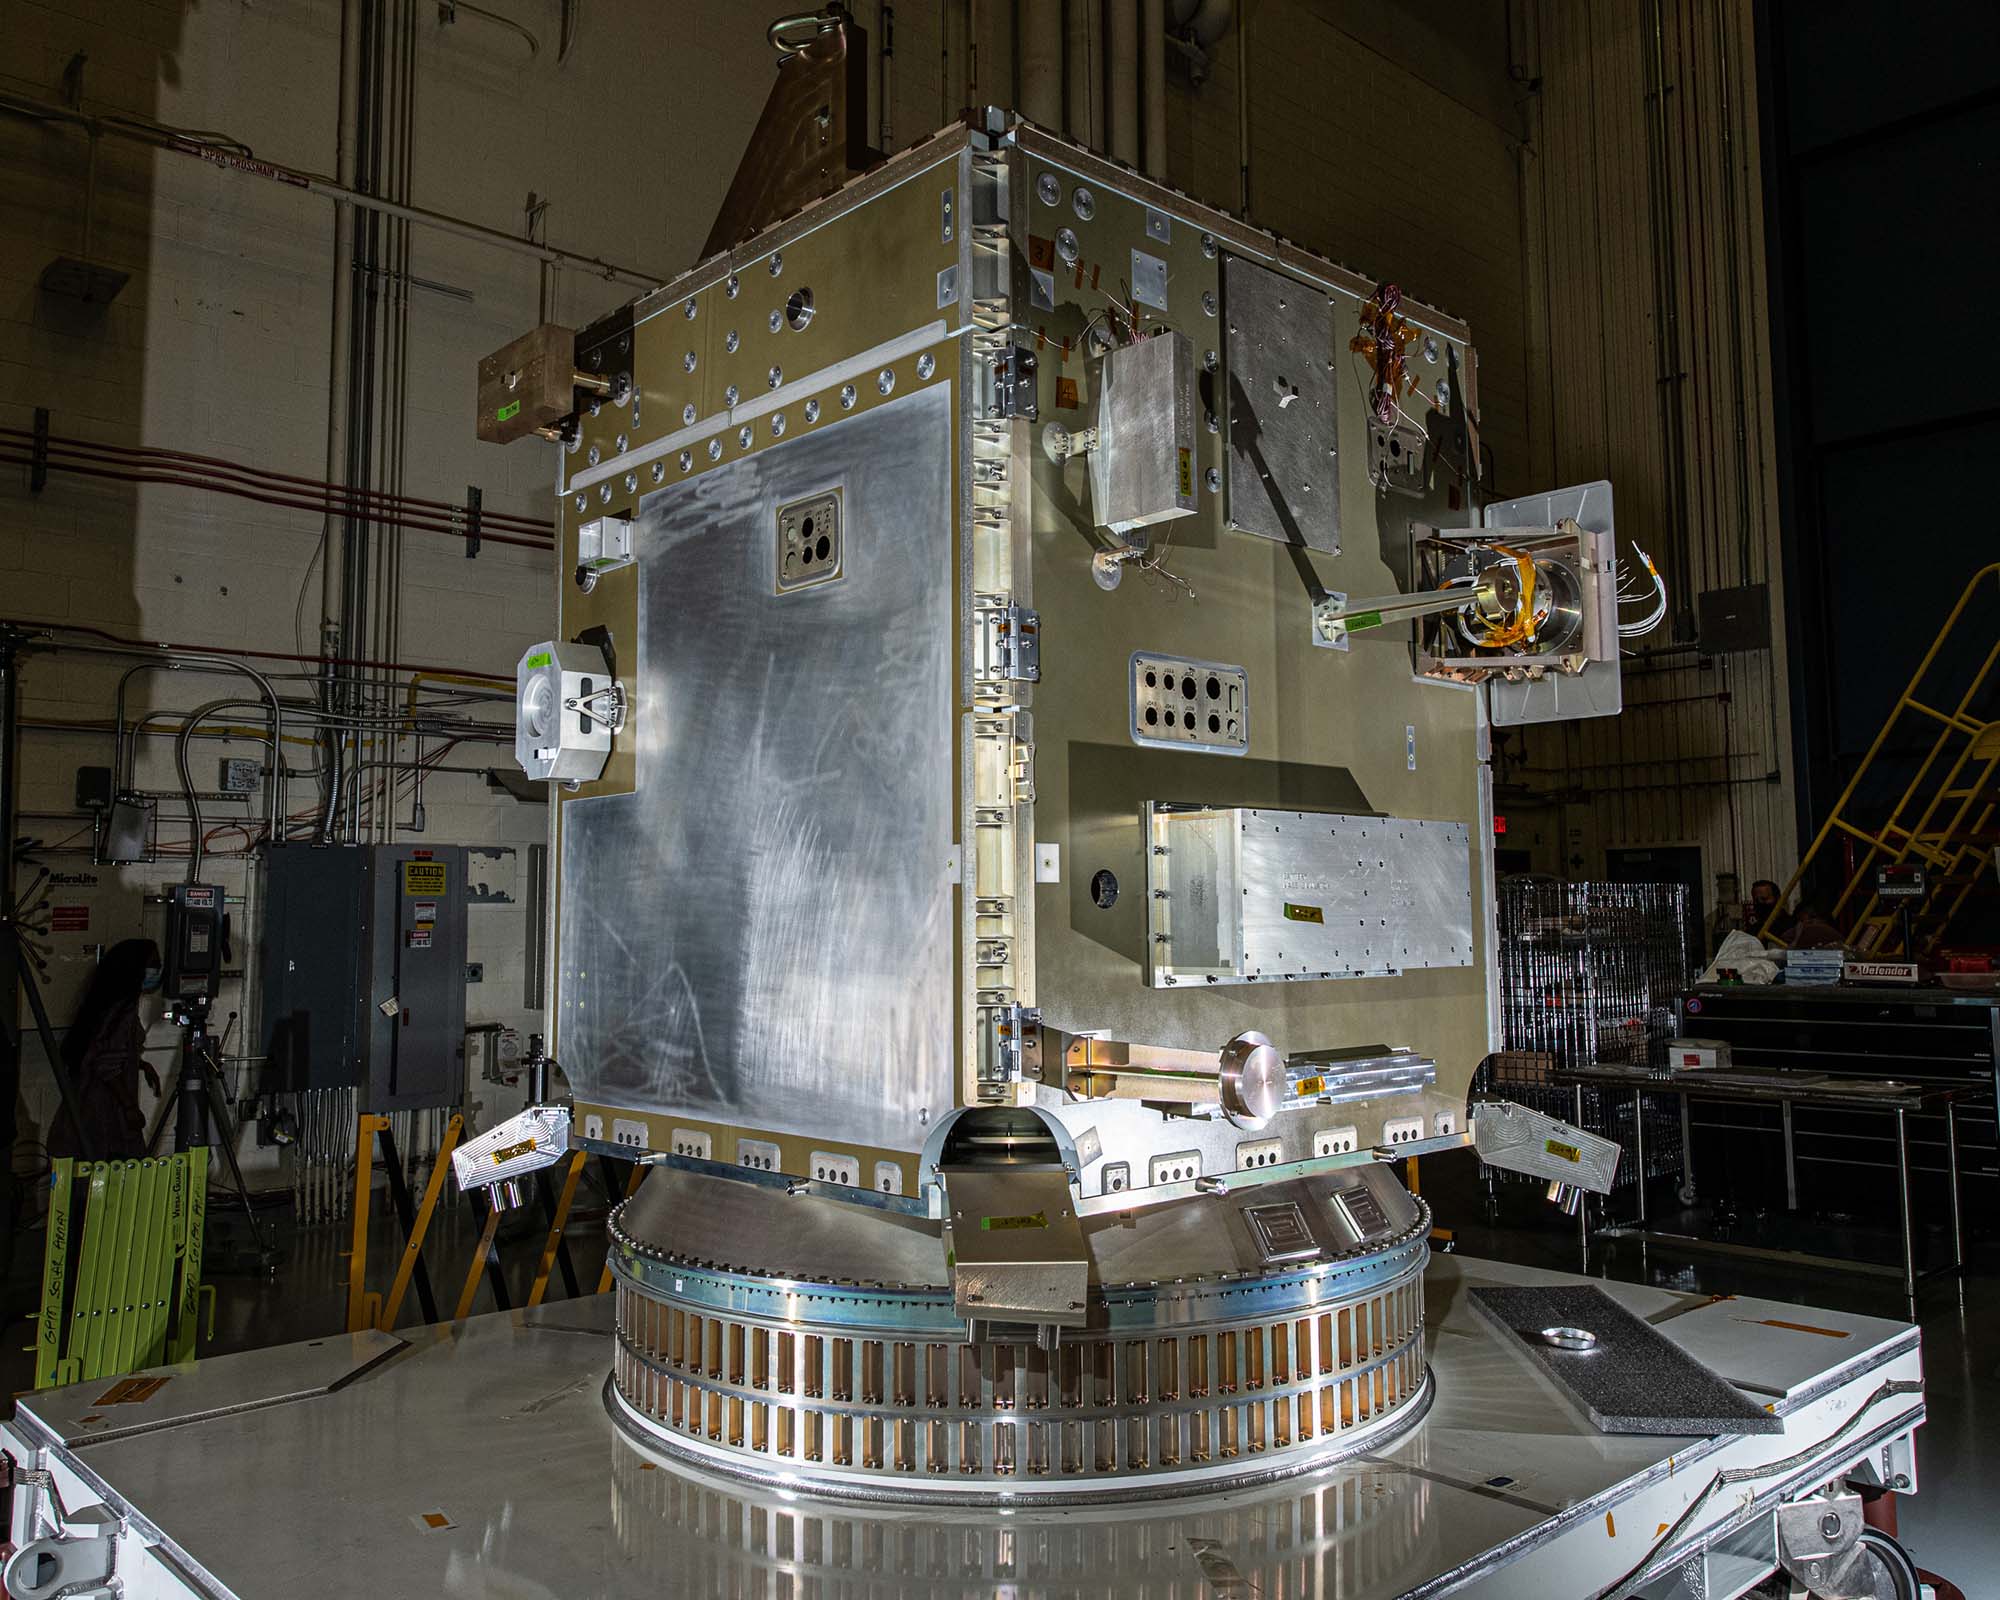
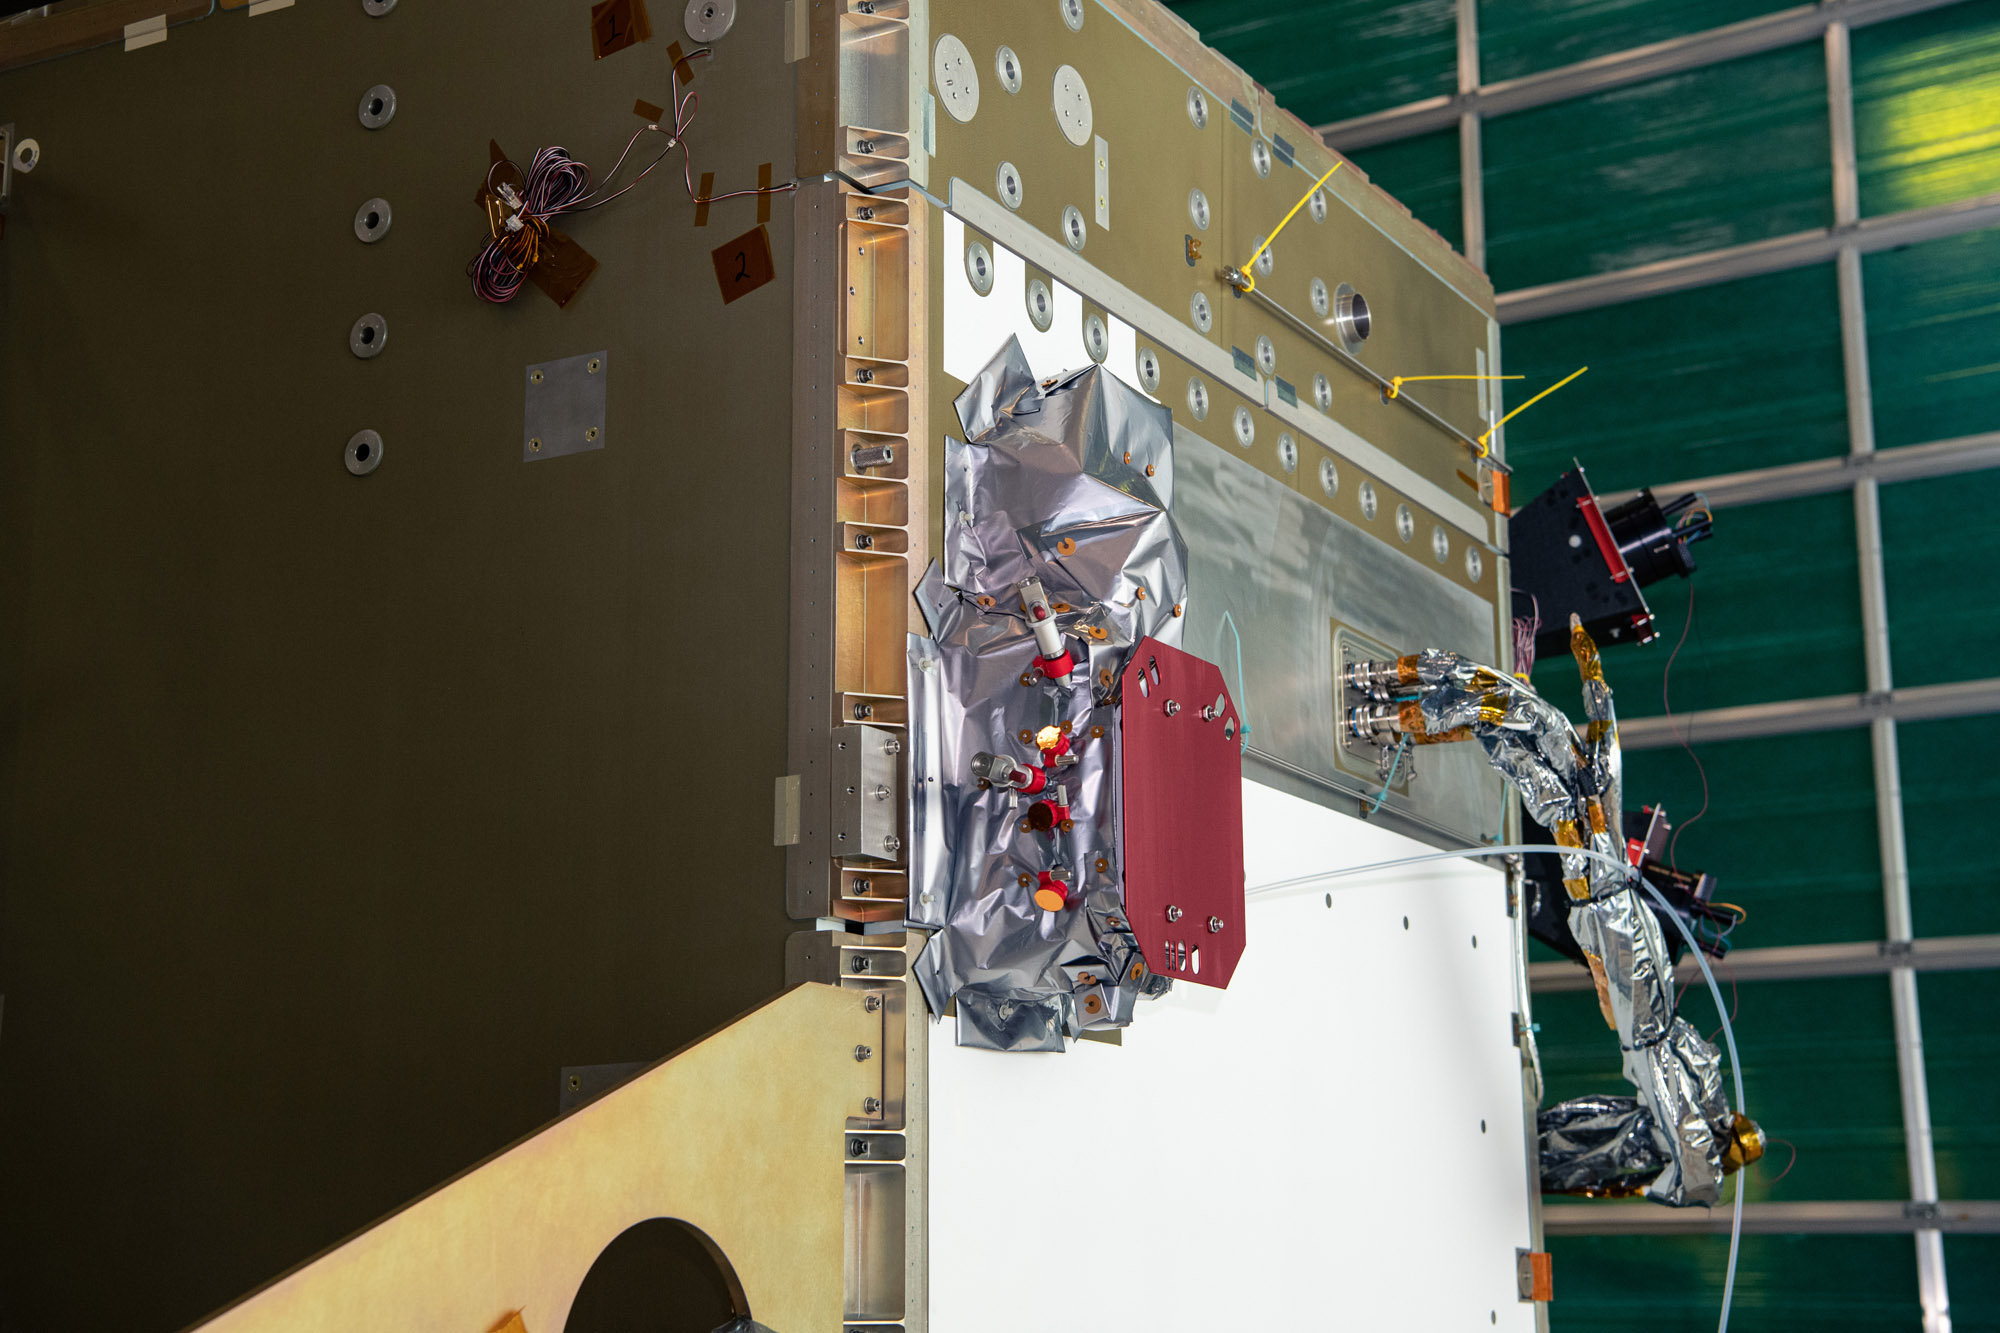
Beauty photo of the ETU OCI installed on the GSE Application for Tilt or Rotation (GAToR).
De-integration of the OCI ETU from the Transport Dolly.
Crane lift of the OCI ETU onto the Calibration and GSE.
Mechanical installation of the Data Acquisition Unit (DAU) electronics box onto the OCI ETU.
Mechanical installation of the DAU electronics box onto the OCI ETU.
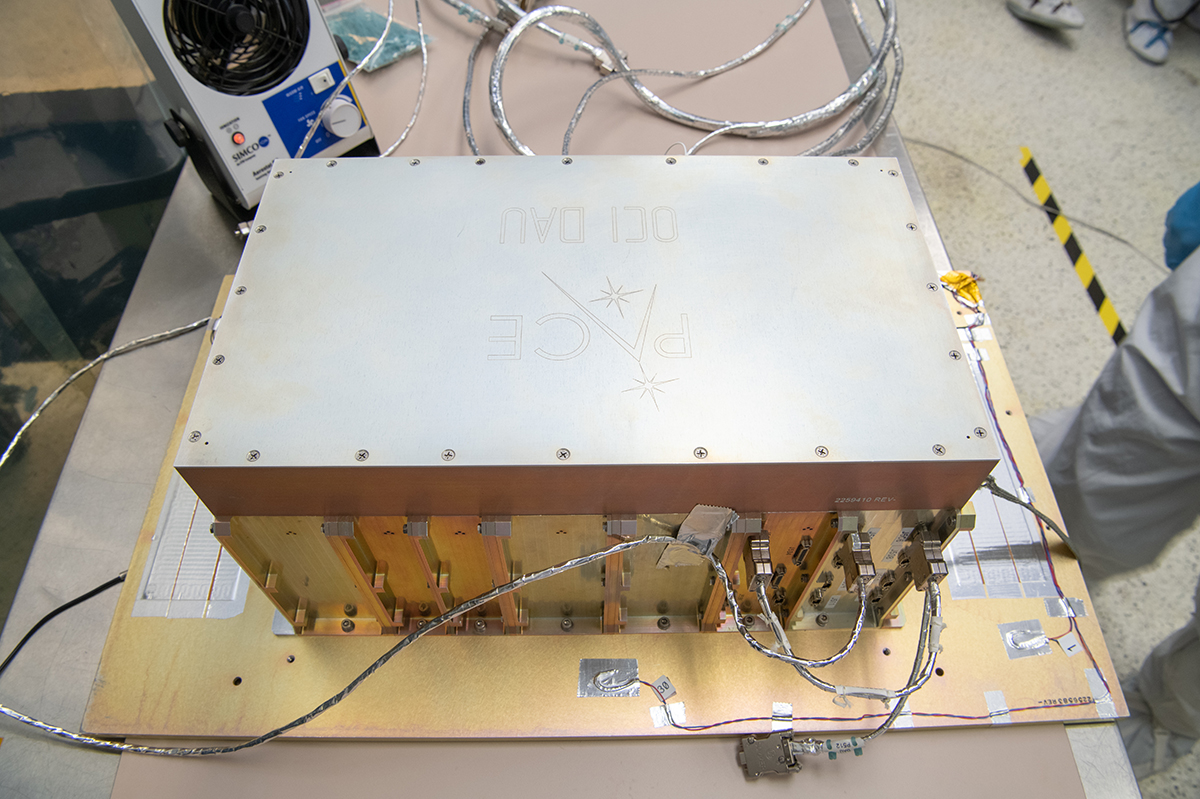
Mechanical installation of the DAU electronics box to the mock-up ETU radiator.
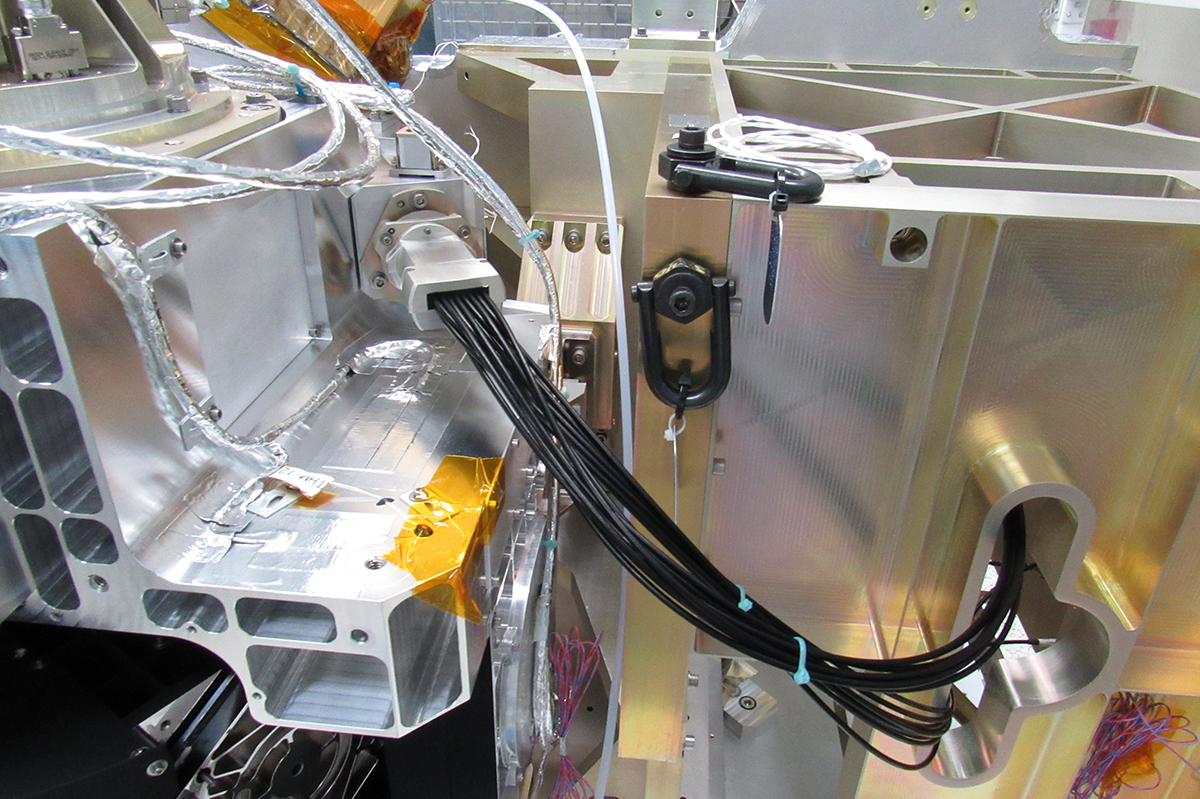
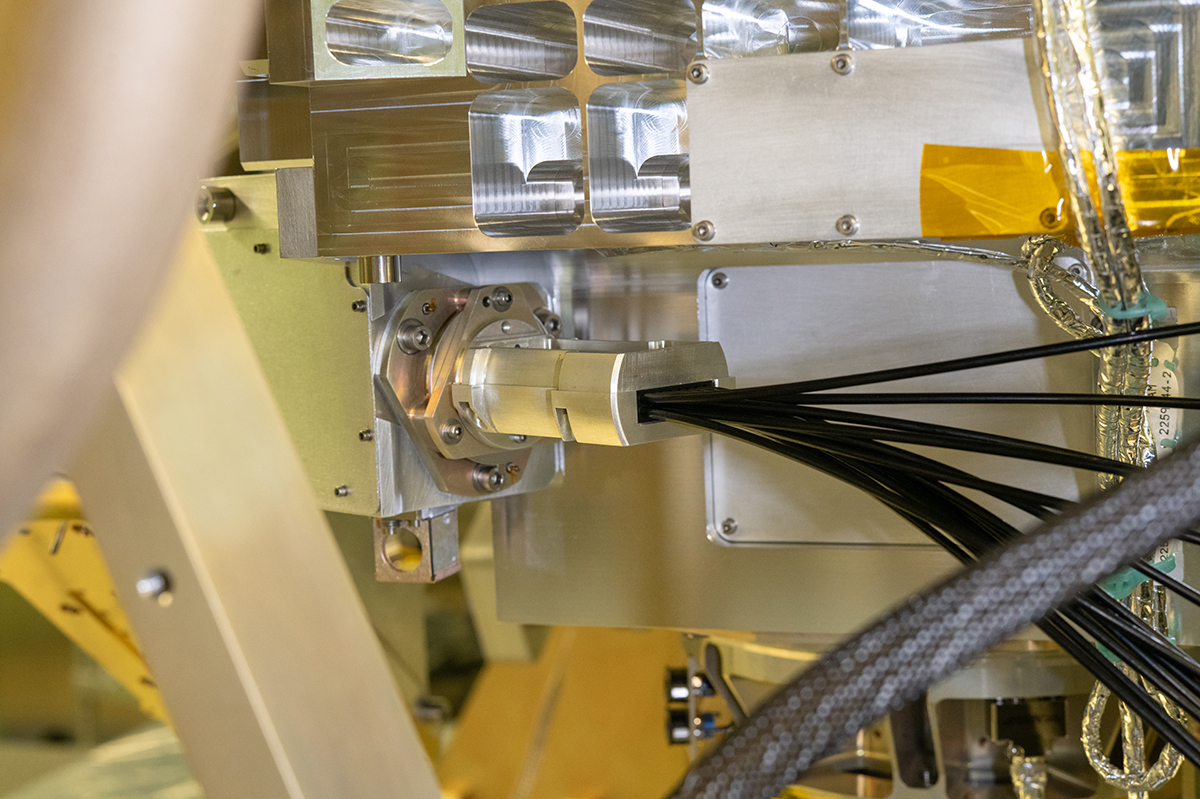
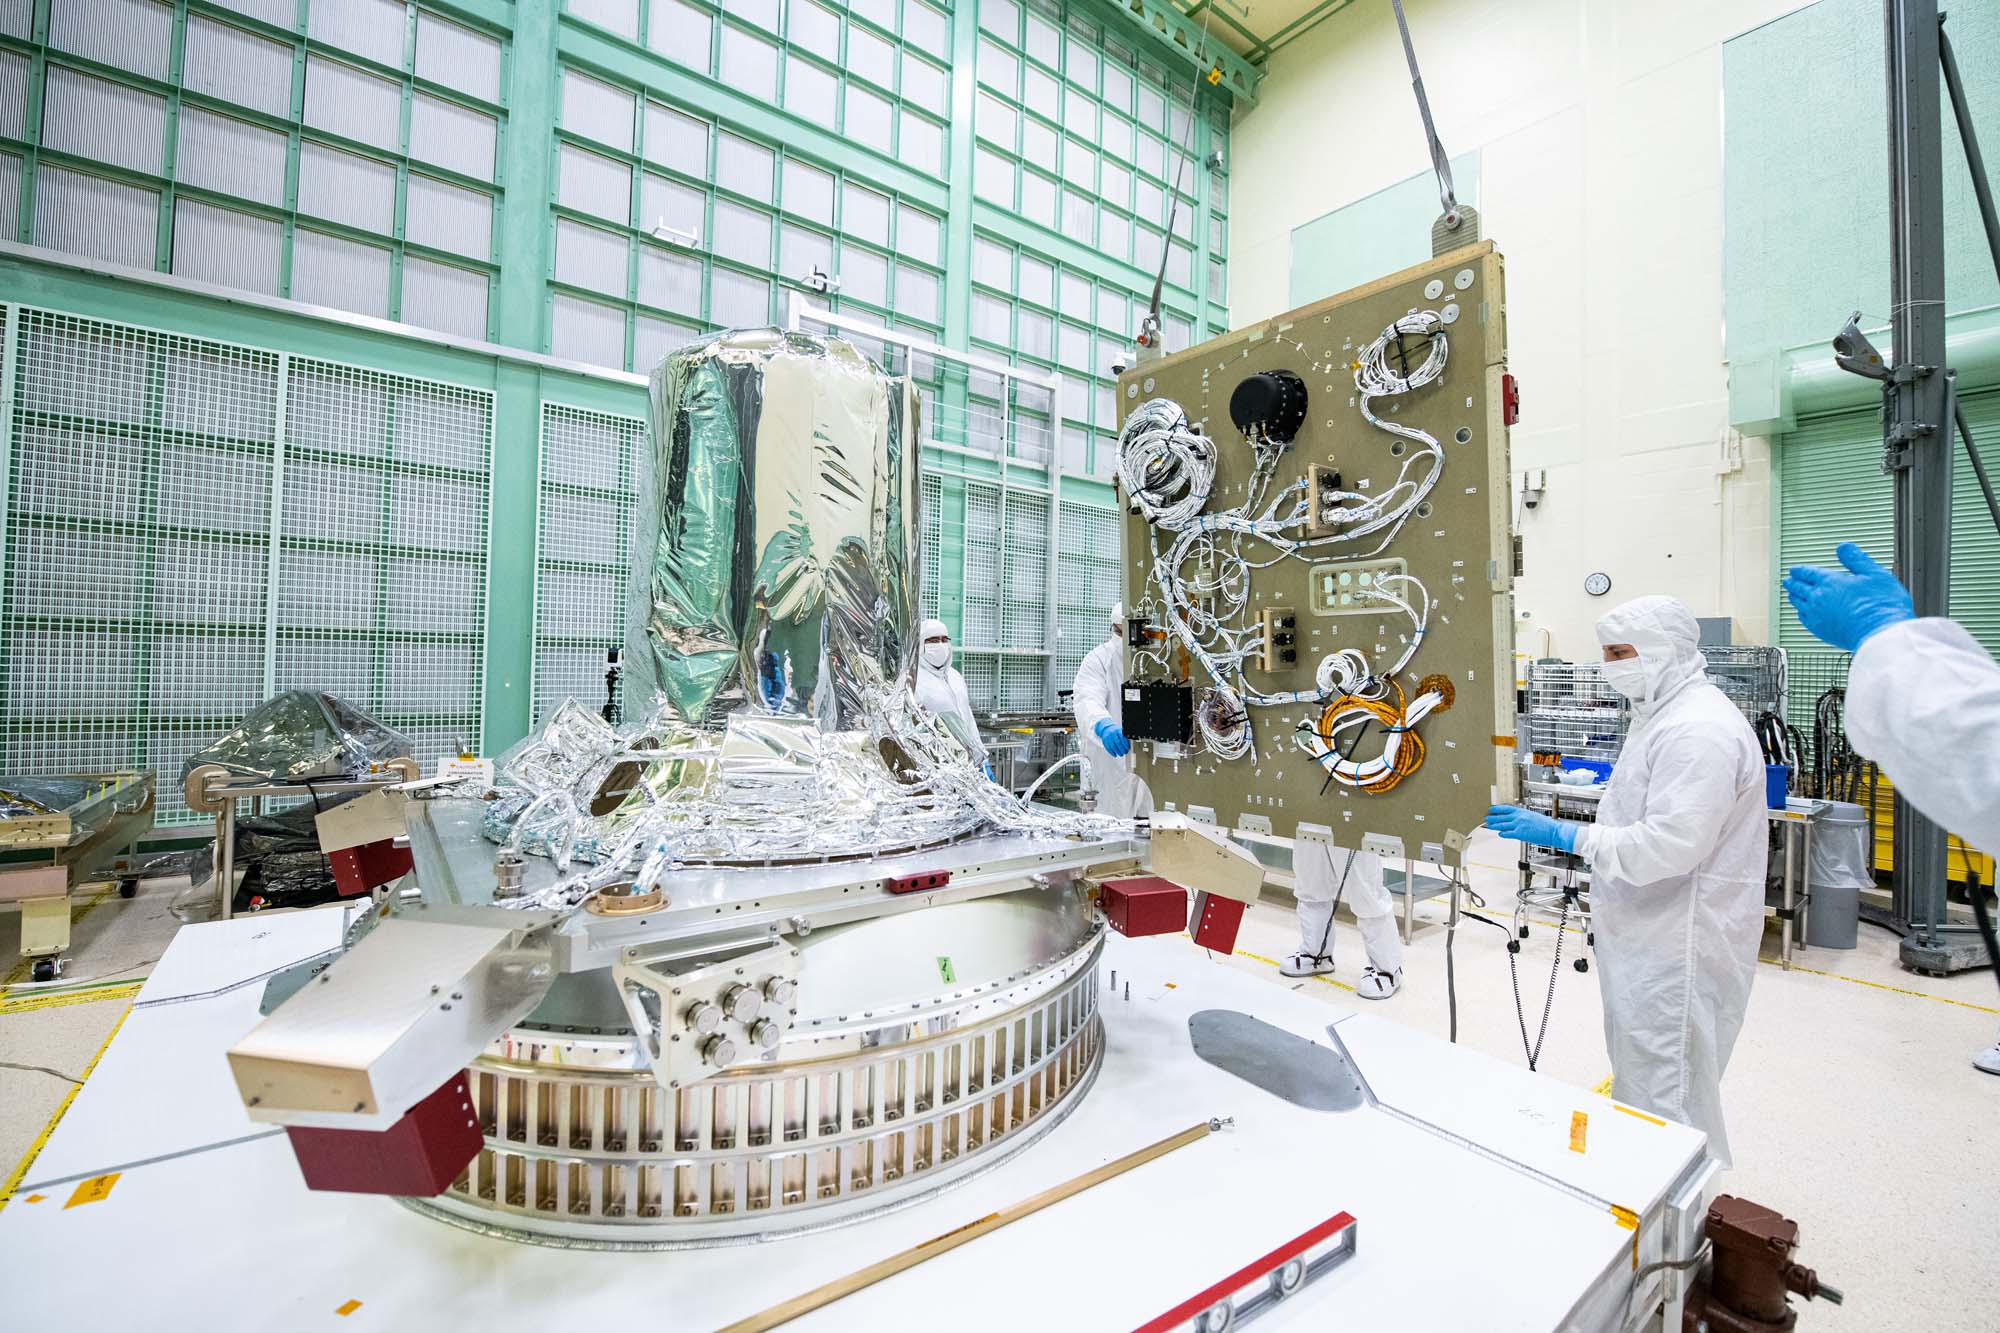
MLA and Fiber Bundle linking the OCI OM to the SWIR Detection Assembly (SDA).
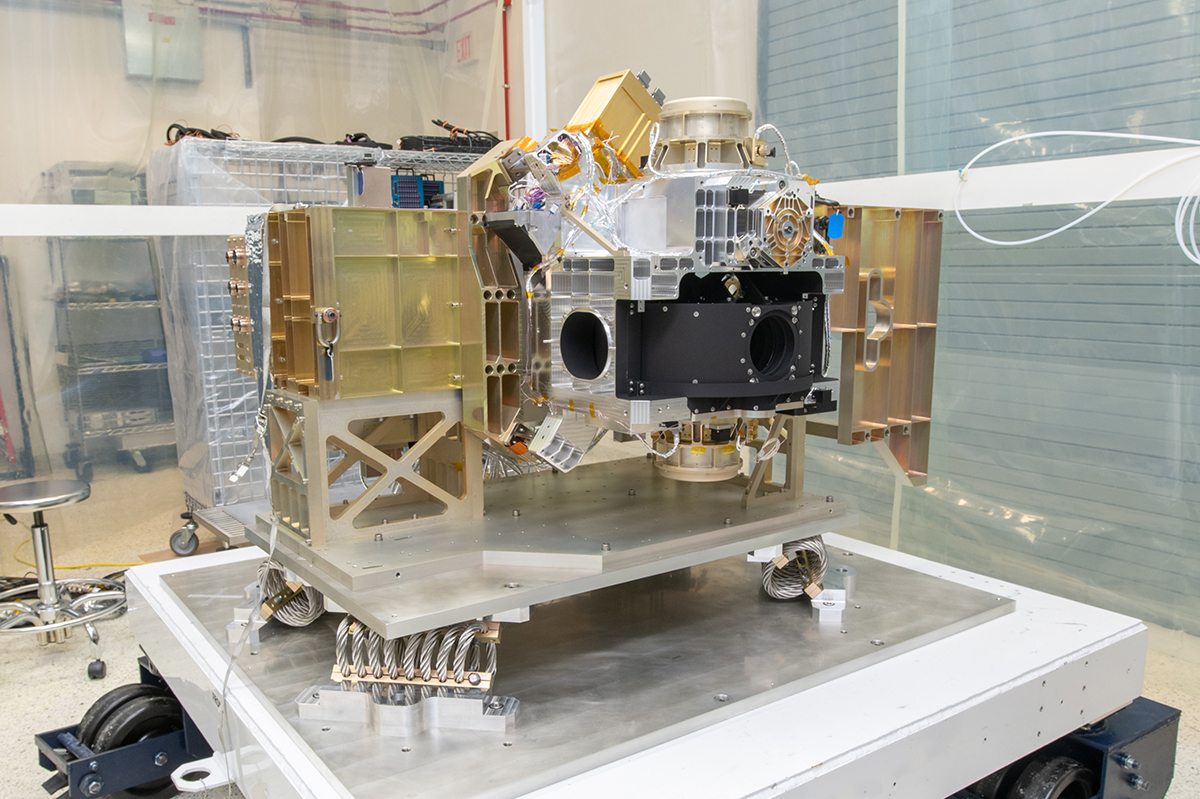
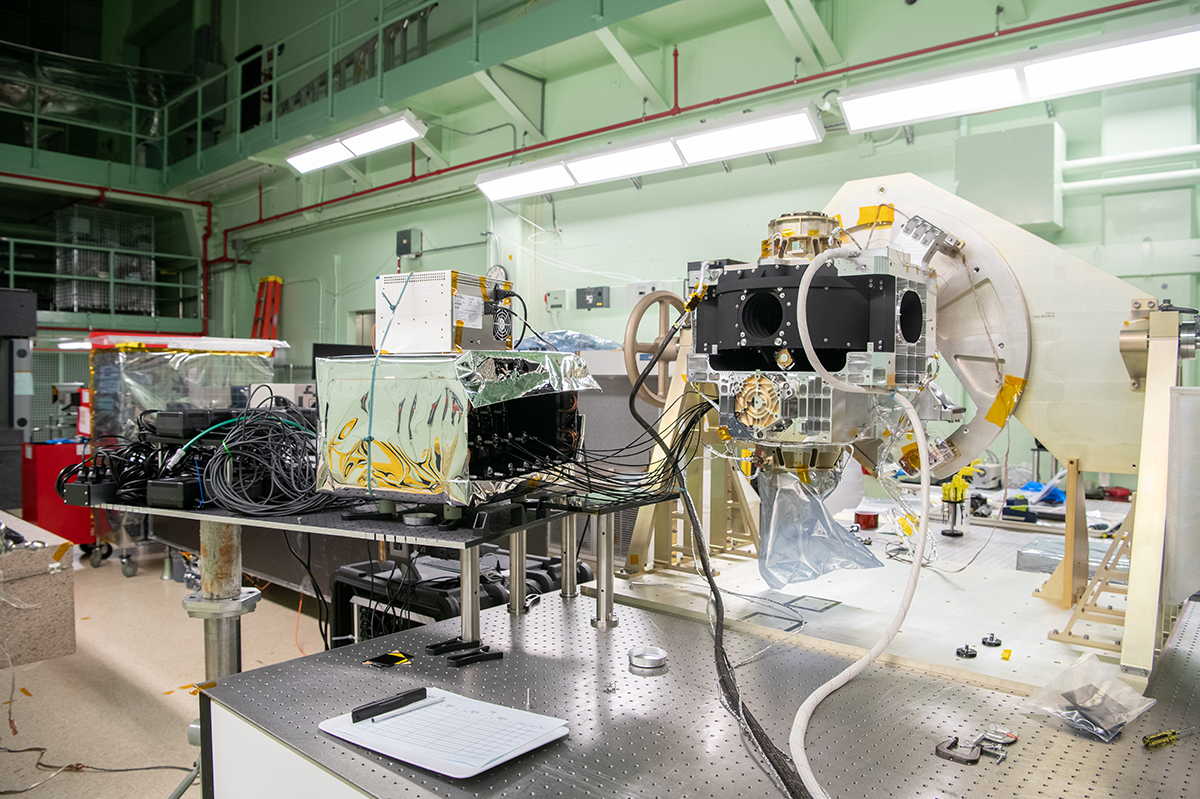
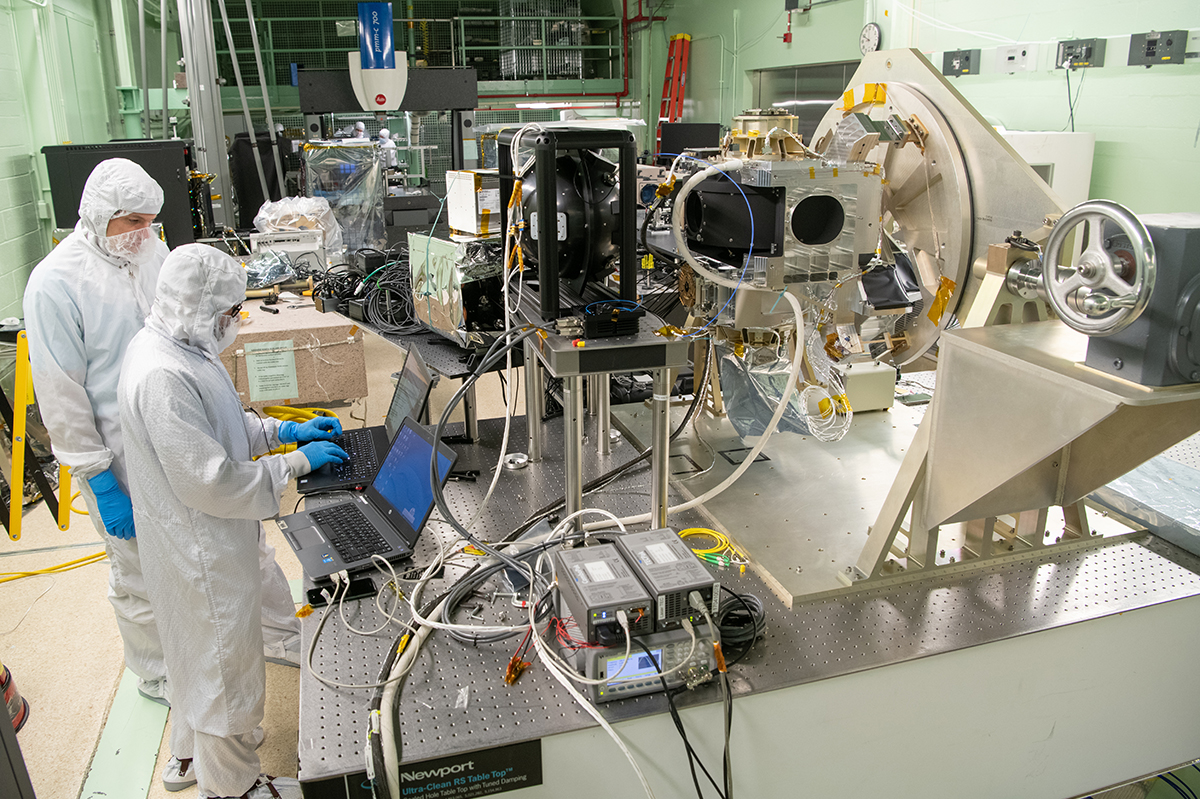
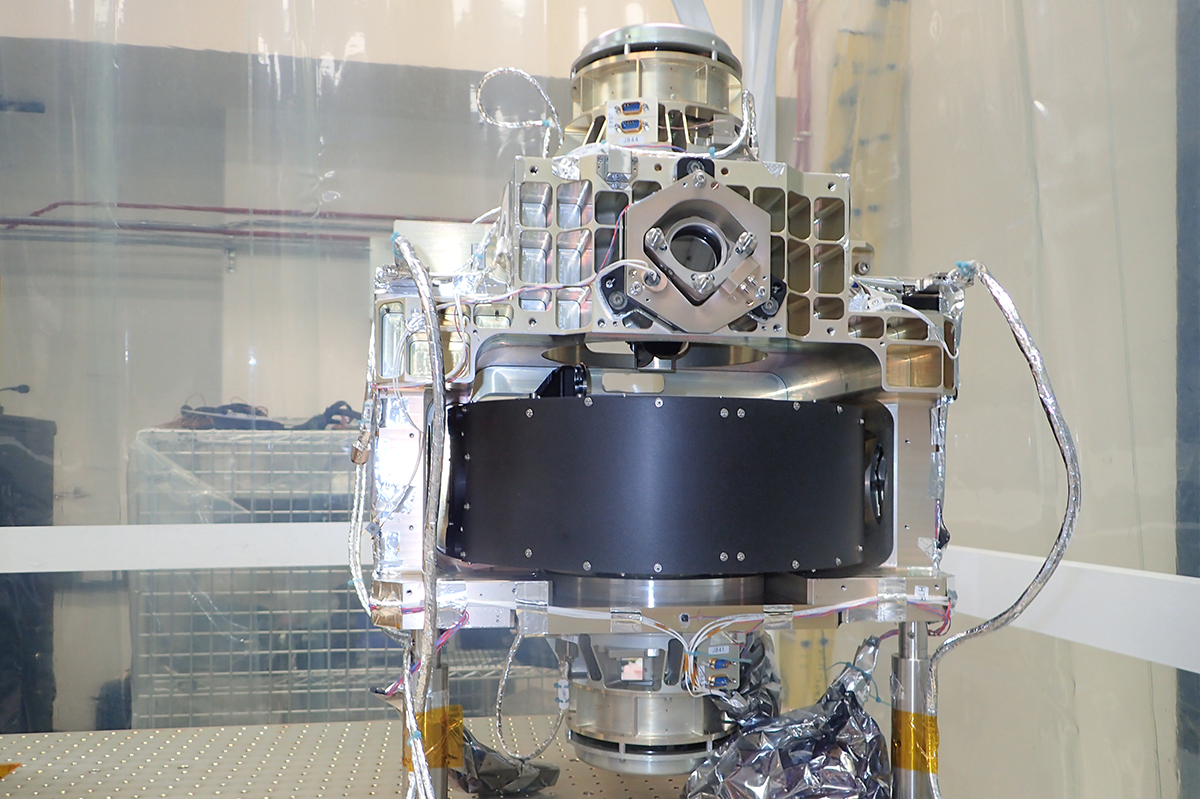
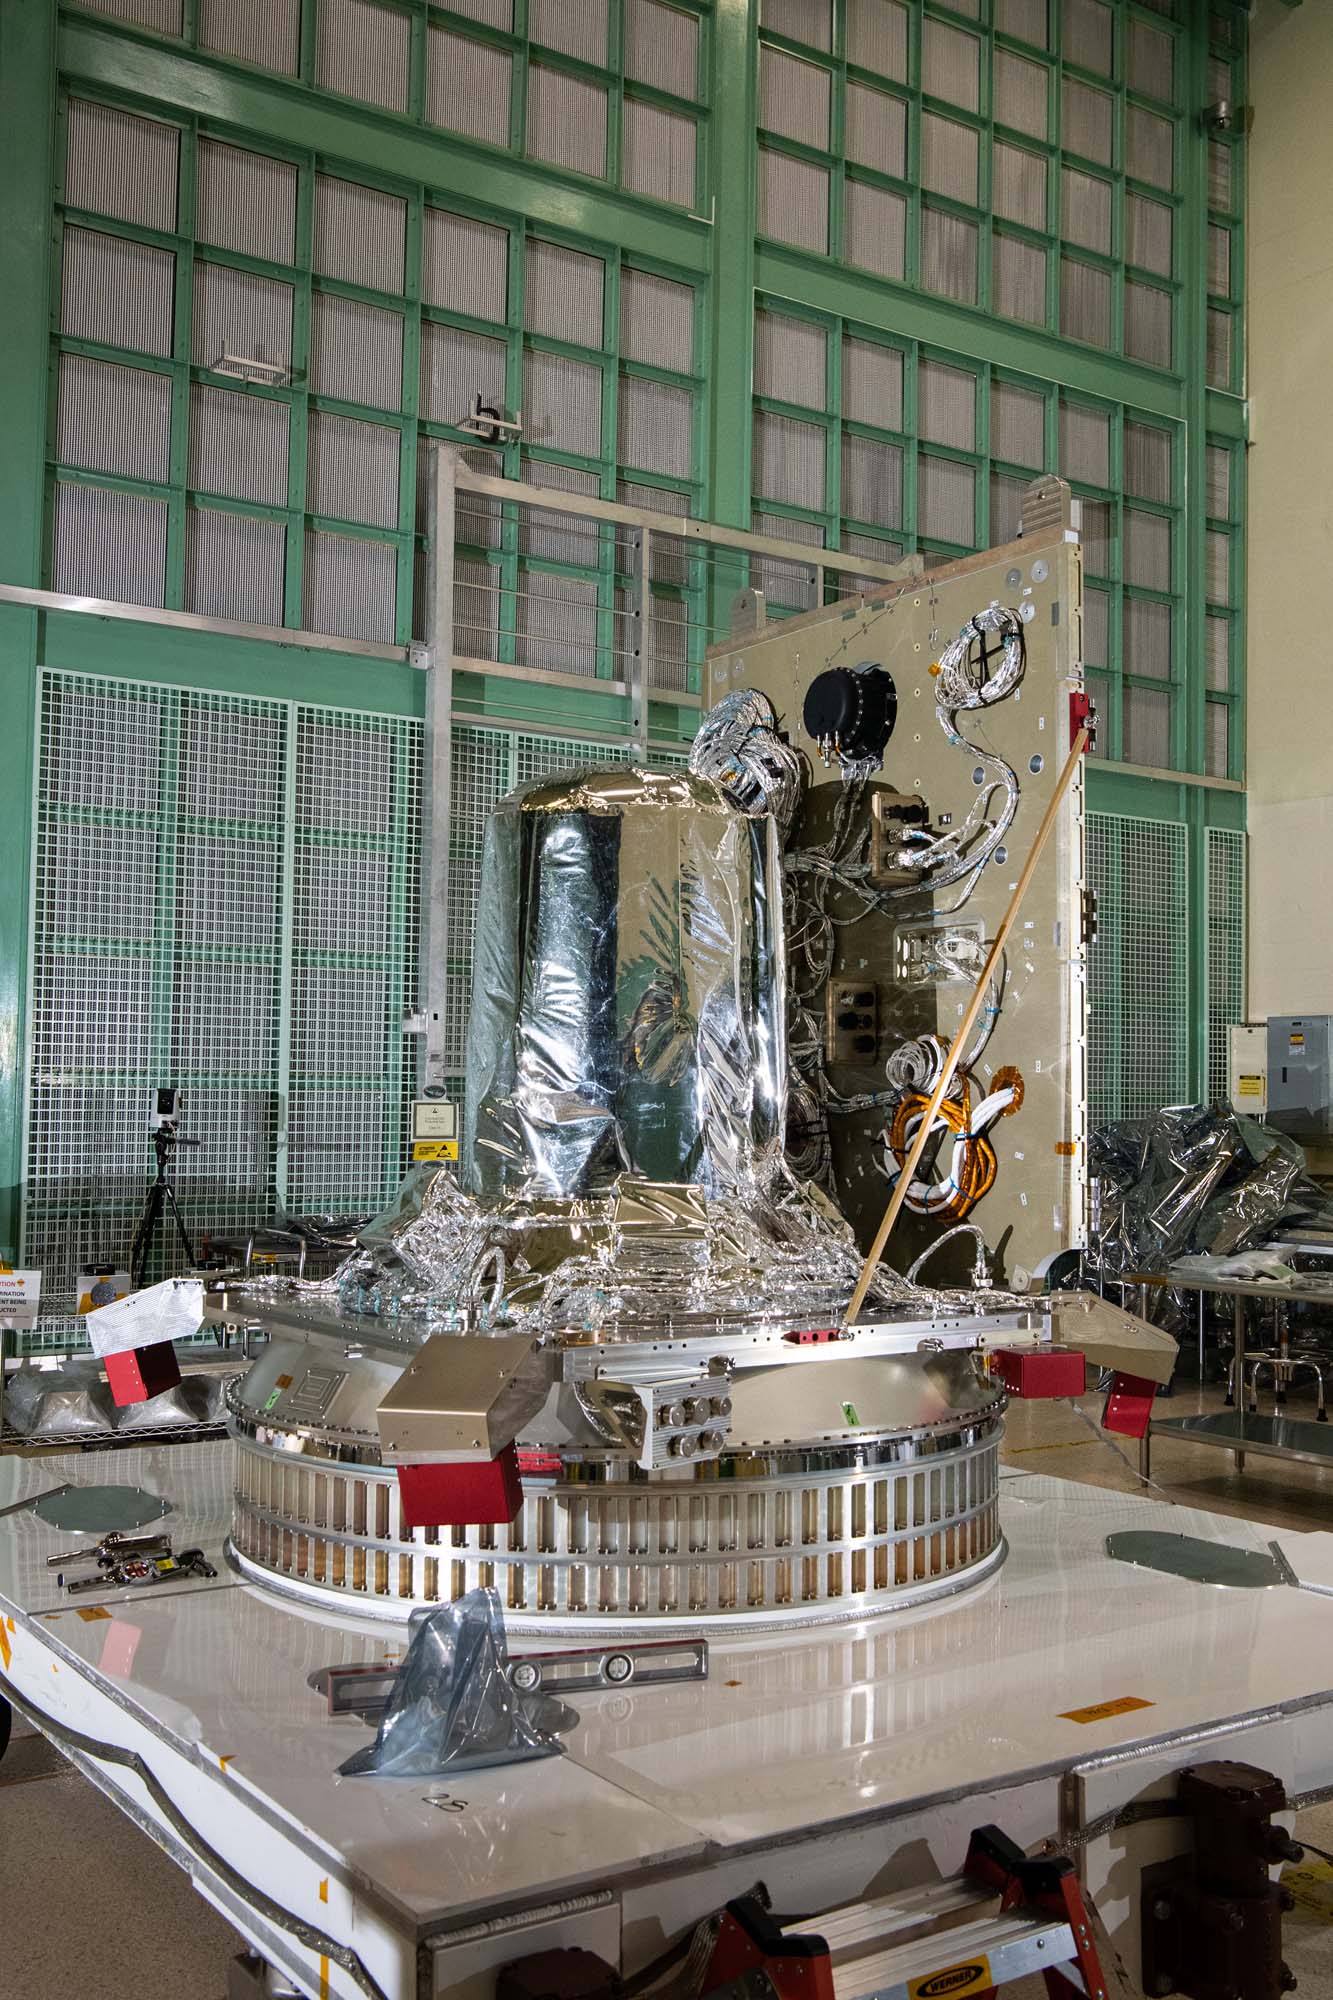
The OCI ETU with the OM installed and ready for Integration & Testing (I&T).
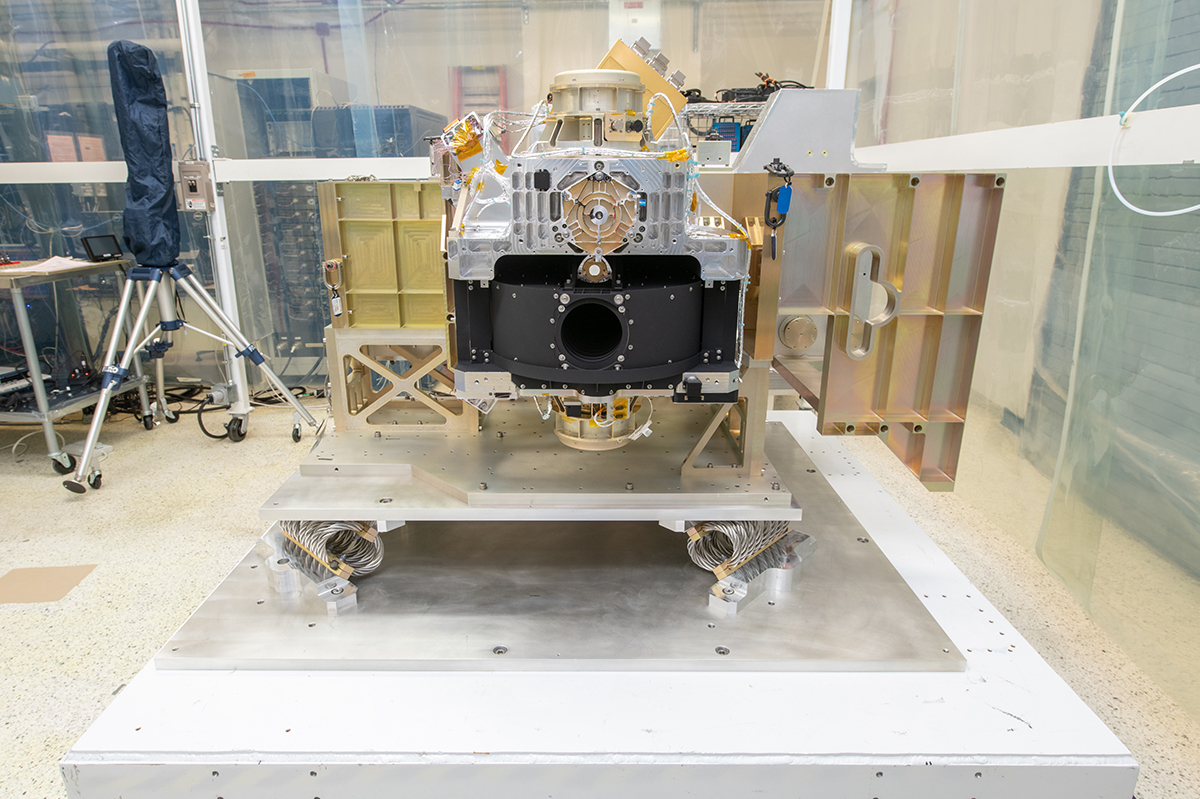
The OCI ETU with the OM installed and ready for I&T.
The OCI ETU with the OM installed and ready for I&T.
The OCI ETU with the OM installed and ready for I&T.
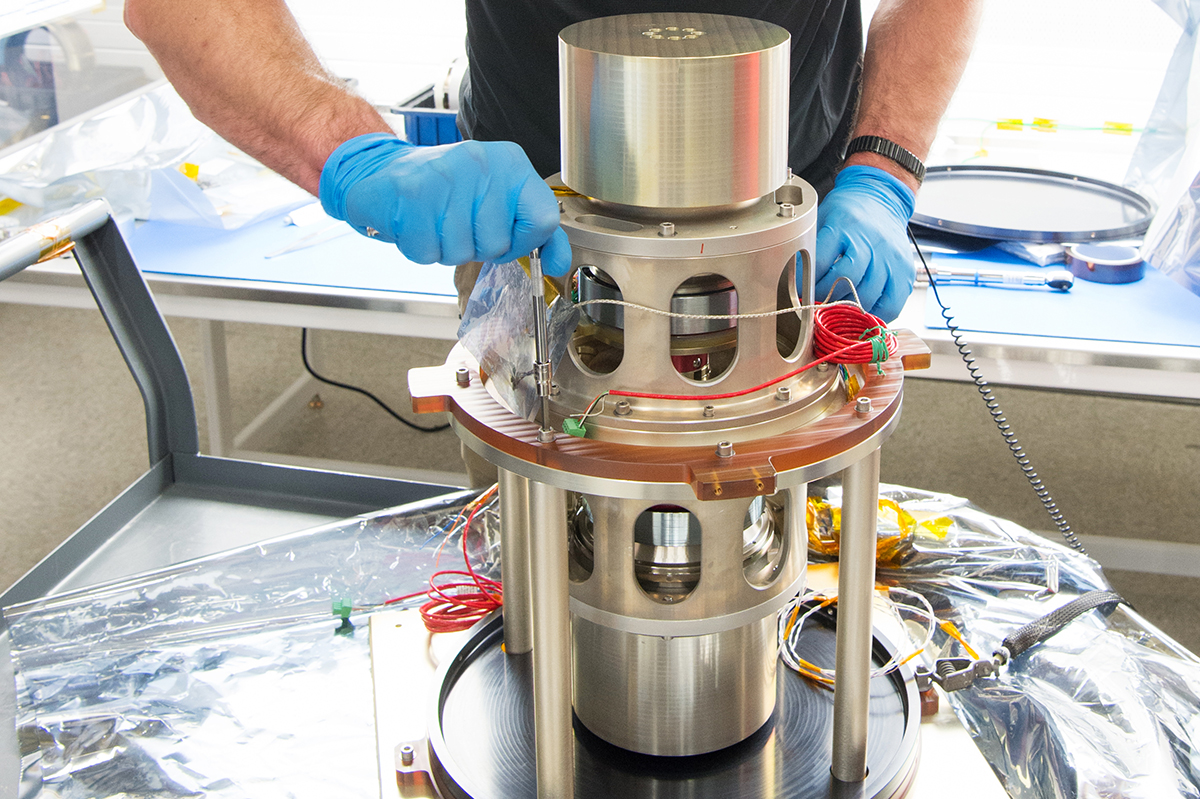
NASA technicians perform a flatness check between the OM and ETU Primary Structure.
Flatness check between the OM and ETU Primary Structure.
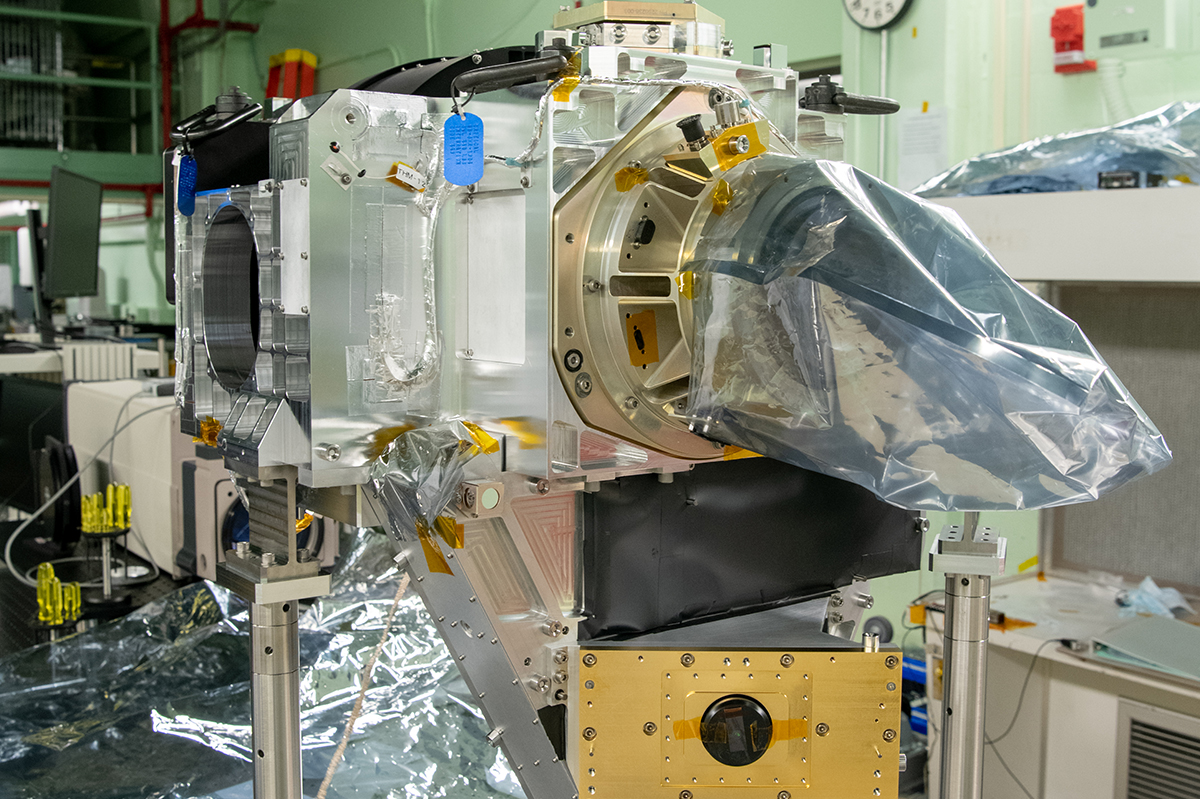
The fully integrated OM on the OCI ETU.
NASA technicians perform a flatness check between the OM and ETU Primary Structure.
The fully-integrated OM on the ETU.
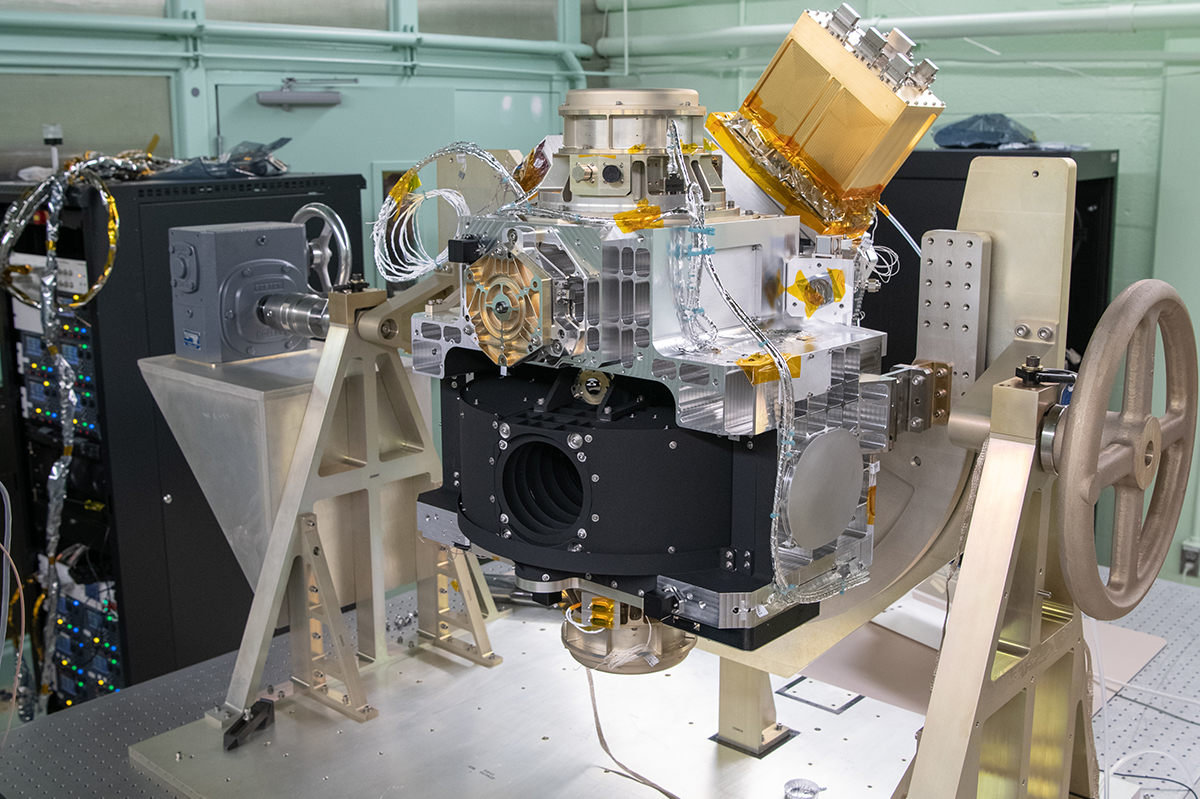
The OCI ETU OM (with Red-Channel FPA installed) oriented for optical testing.
The OCI ETU OM (with Red-Channel FPA installed) oriented for optical testing.
The OCI ETU MOB attached to the Lisard GSE prior to installation of MOSB.
The OM on Lisard GSE. Lift shackles are installed in preparation for an upcoming crane lift.
Unbolting the OCI ETU OM from the Lisard GSE in preparation for a crane lift move to the Instrument Structure. Protective contamination bagging is installed.
The OM is installed to the OCI ETU Primary Structure.
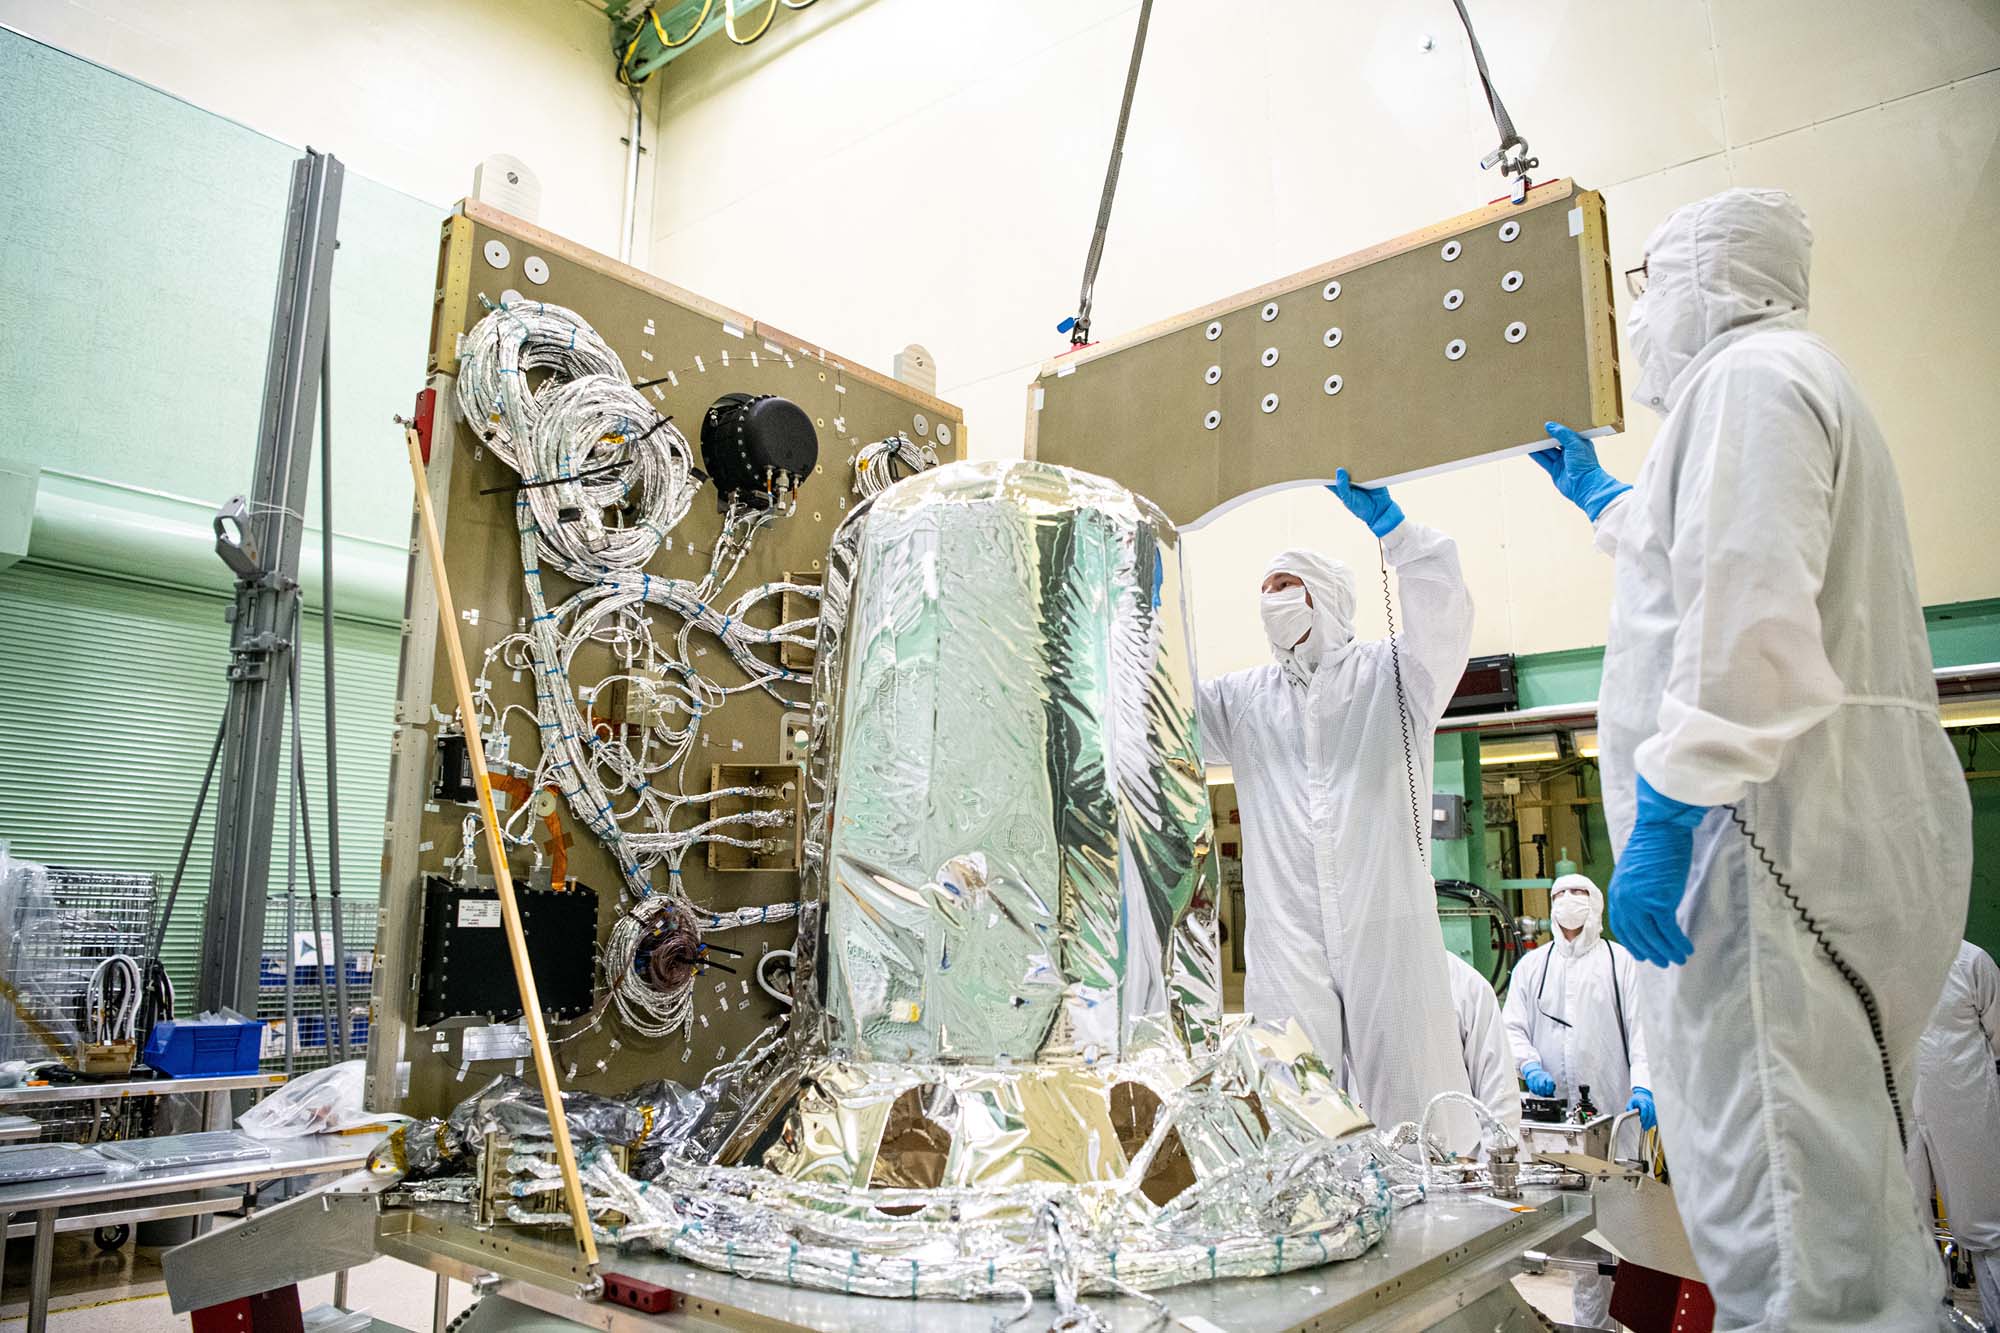
Crane lift of the ETU OM onto the OCI Primary Structure. (In order to protect the OM from potential particulate contamination and humidity, the OM is bagged and purged.)
Crane lift of the ETU OM onto the OCI Primary Structure.
Crane lift of the ETU OM onto the OCI Primary Structure.
The FPA installed on the ETU OM of the OCI.
Installation of the Focal Plane Assembly (FPA) on the ETU OM of the OCI.
The FPA installed on the ETU OM of the OCI.
Installation of the FPA on the ETU OM of the OCI.
MicroLens Array (MLA) and Fiber Optic Bundle attached to the OCI Optical Module (OM) during alignment and testing.
Alignment of the MLA and Fiber Optic Bundle to the OCI OM. The OM is located in the middle of the optical table.
Joe Thomas and Alejandro Rodriguez Perez perform alignment of the MLA and Fiber Optics Bundle to the OCI OM.
The MOSB installed onto the ETU MOB.
The MOSB installed onto the ETU MOB.
Integration of the populated ETU MOSB onto the ETU MOB.
Integration of the populated ETU MOSB onto the ETU MOB.
The OCI ETU MOB attached to the Lisard GSE prior to installation of the MOSB.
The MOB attached to the Lisard Ground Support Equipment (GSE), prior to installation of the Main Optics Sub-Bench (MOSB).
Ocean Color Instrument (OCI) ETU FlatSat End-to-End Electrical System Test - LTU Electrical Integration.
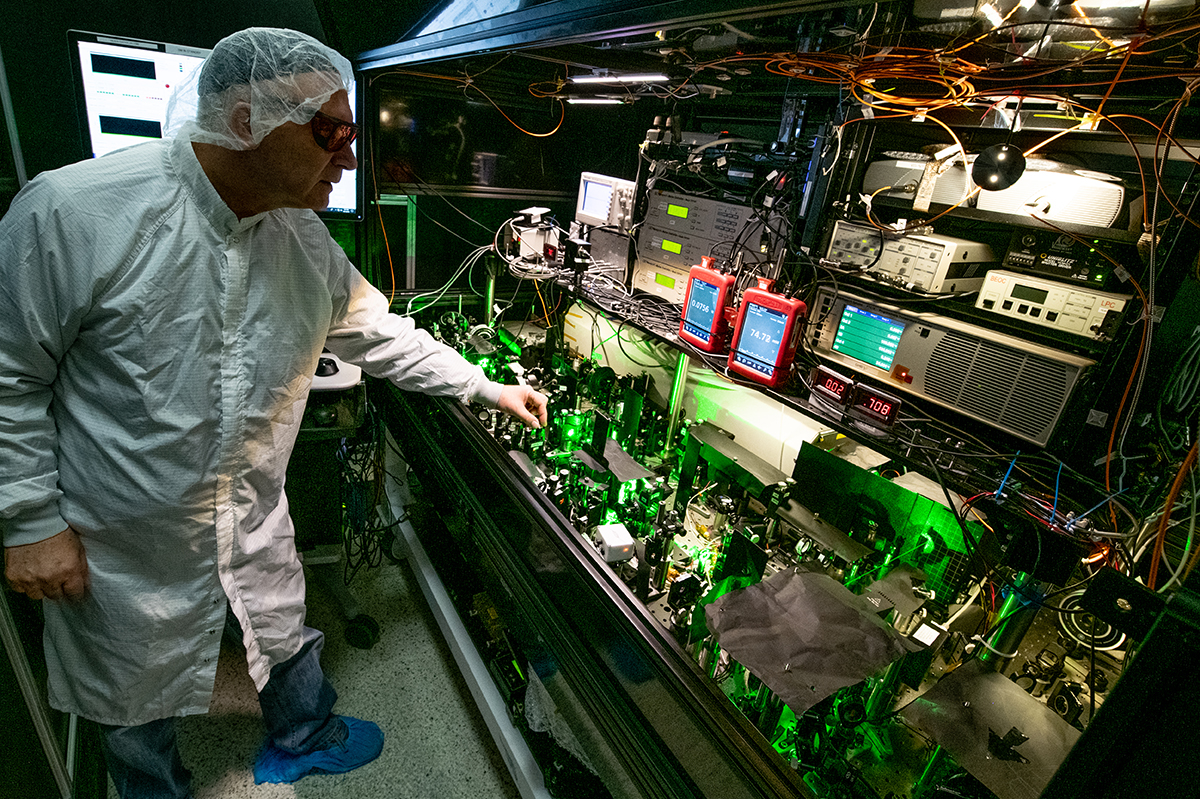
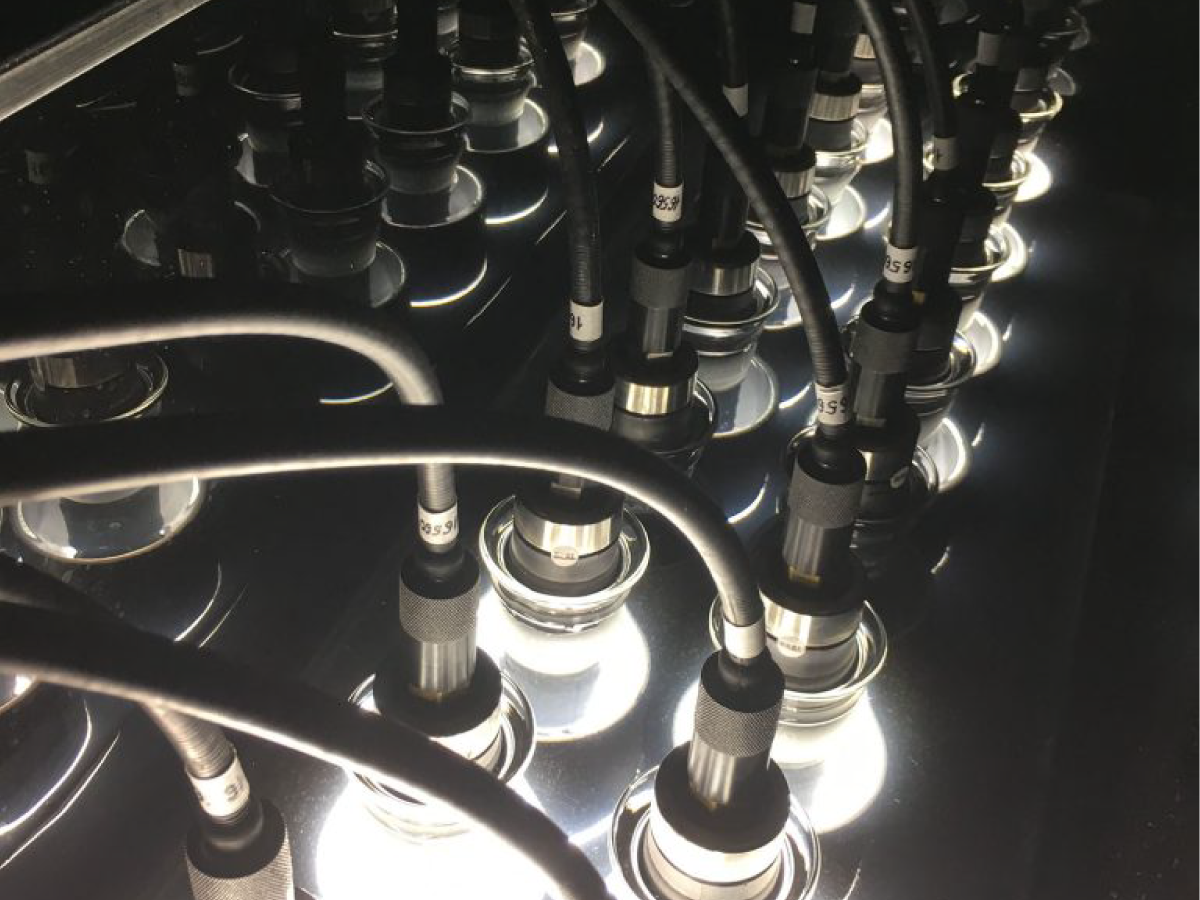
Andrei Sushkov operating the OLAF-2 Goddard Laser for Absolute Measure of Radiance source bench (green light coming from the primary source class-4 laser).
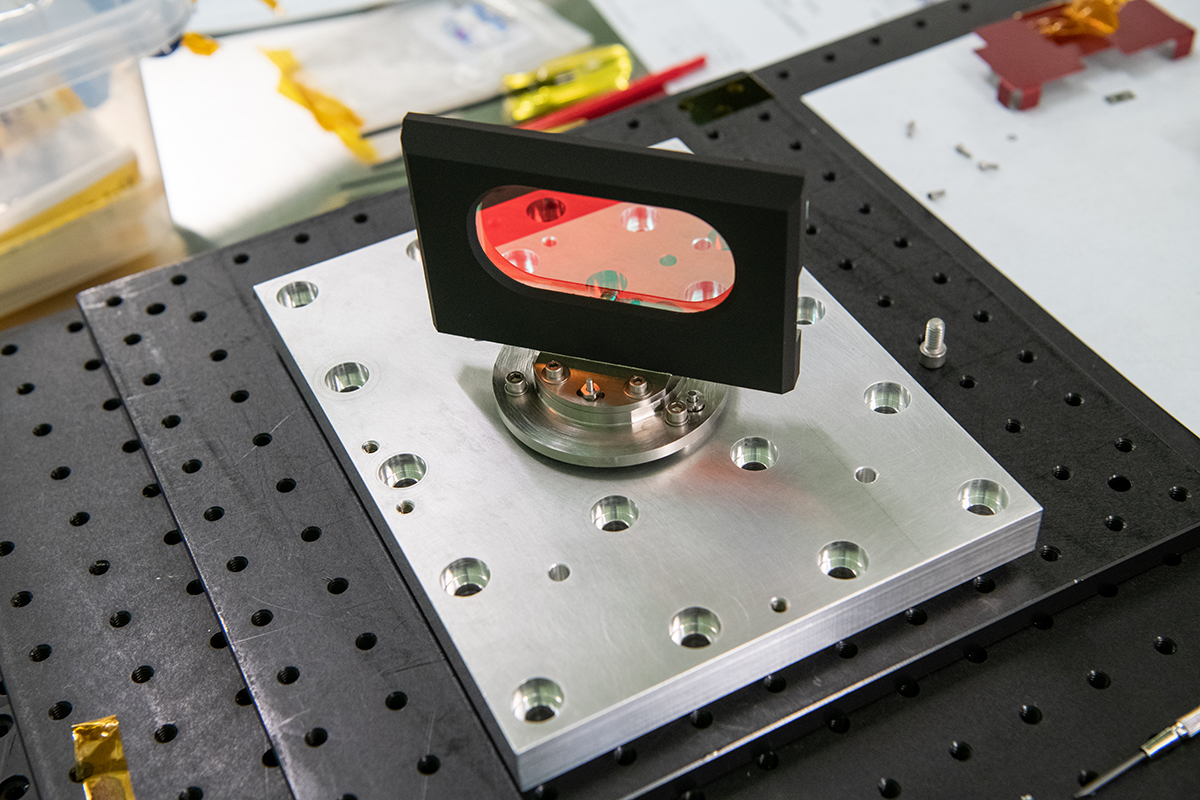
Ultraviolet Visible Risk Mitigation Unit Dichroic Assembly.
Installation of the ETU HAM mechanism into the Main Optical Bench (MOB) structure.
Installation of the ETU Rotating Telescope mechanism into the main optical bench structure.
Alignment of the HAM mechanism in the MOB structure.
Assembly of the BOLT stack-up frame support structure.
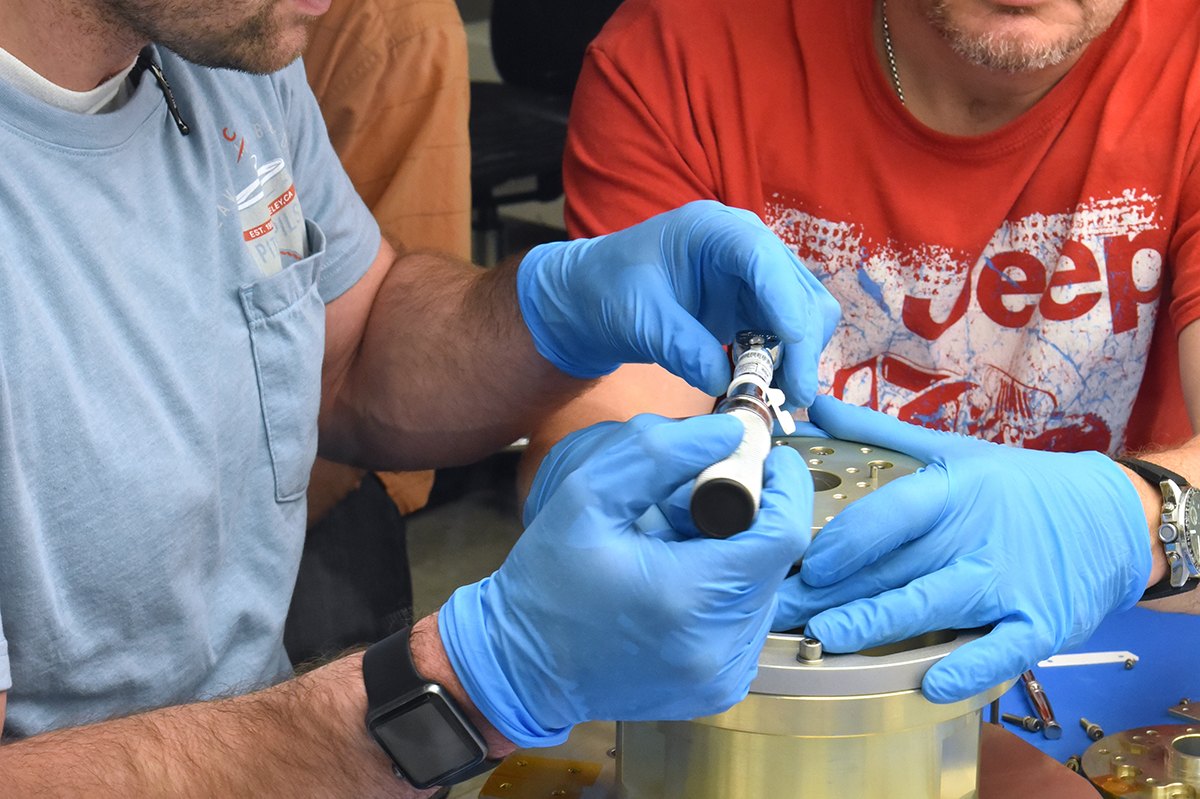
A NASA technician installs an optic reference cube to the HAM mechanism in order to perform alignment measurements.
Installation of an optical cover to prevent any debris from contaminating the HAM mechanism optics.
A NASA technician assembles the Half-Angle Mirror (HAM) mechanism in preparation for balancing activities.
NASA technician, Wes Fincher, installs a temporary vibration sensor to prepare the ETU Rotating Telescope Assembly for dynamic spin evaluation.
Assembly of the BOLT unit stack-up prior to harness routing.
Assembly of the BOLT stack-up.
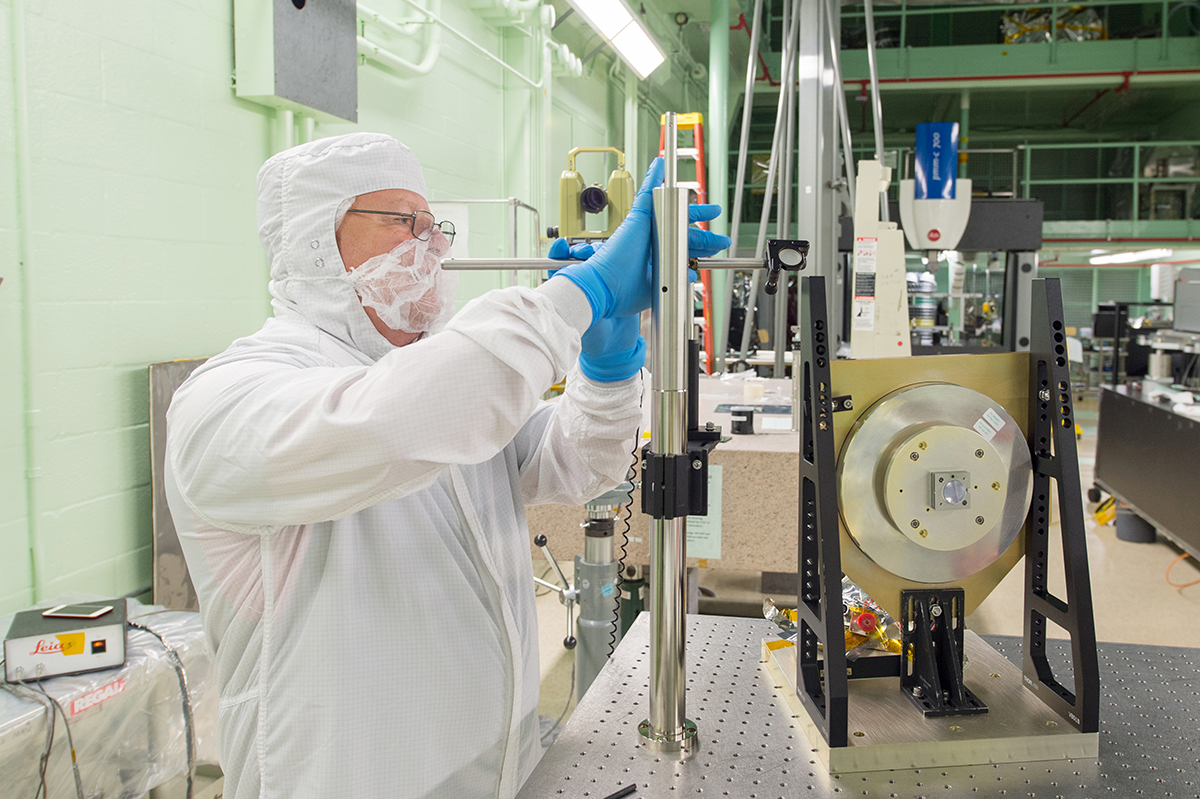
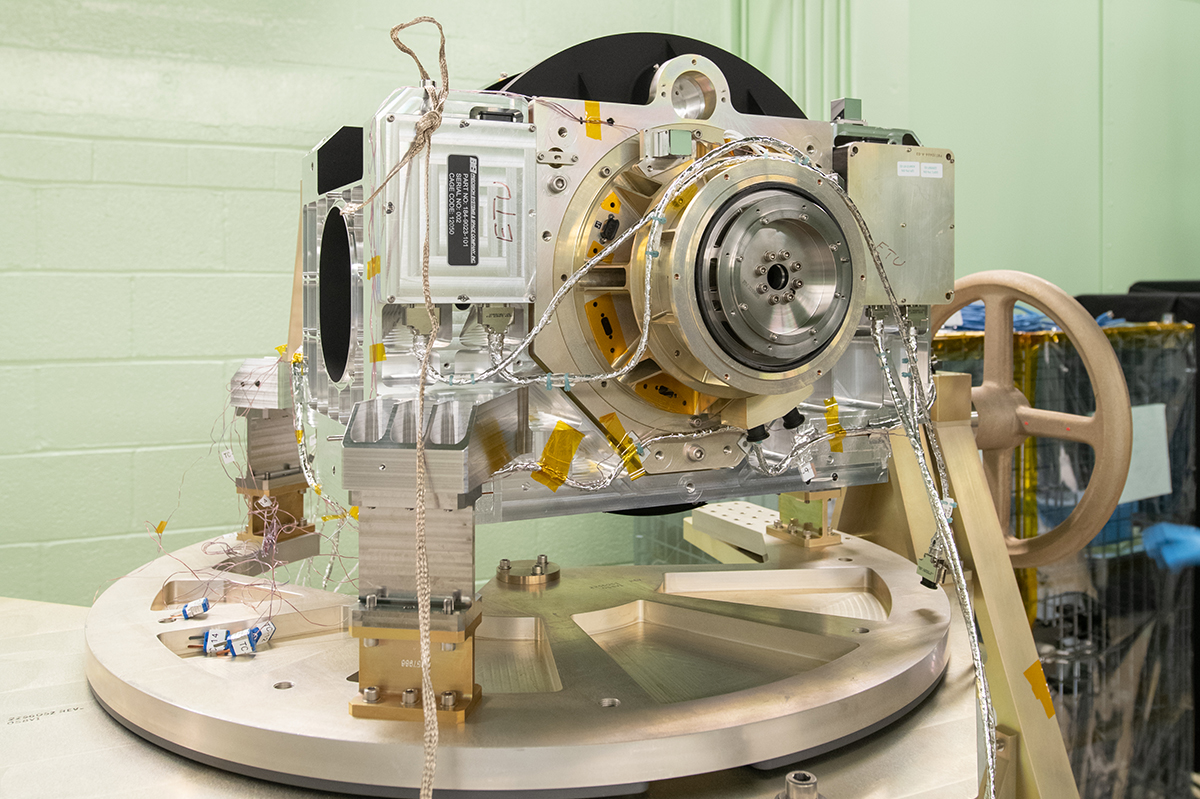
Setting up the Engineering Test Unit (ETU) for spindle axis characterization in order to measure the true spin axis of the mechanism.
NASA technicians assemble the BOLT unit into the vibration fixture.

Performing BOLT vibration testing. A contamination cover is installed to protect the hardware from debris.
A NASA technician installs the rotor mass simulator to the Bearing Only Life Test (BOLT) unit in preparation for vibration testing.
Ocean Color Instrument VIEW ALL »
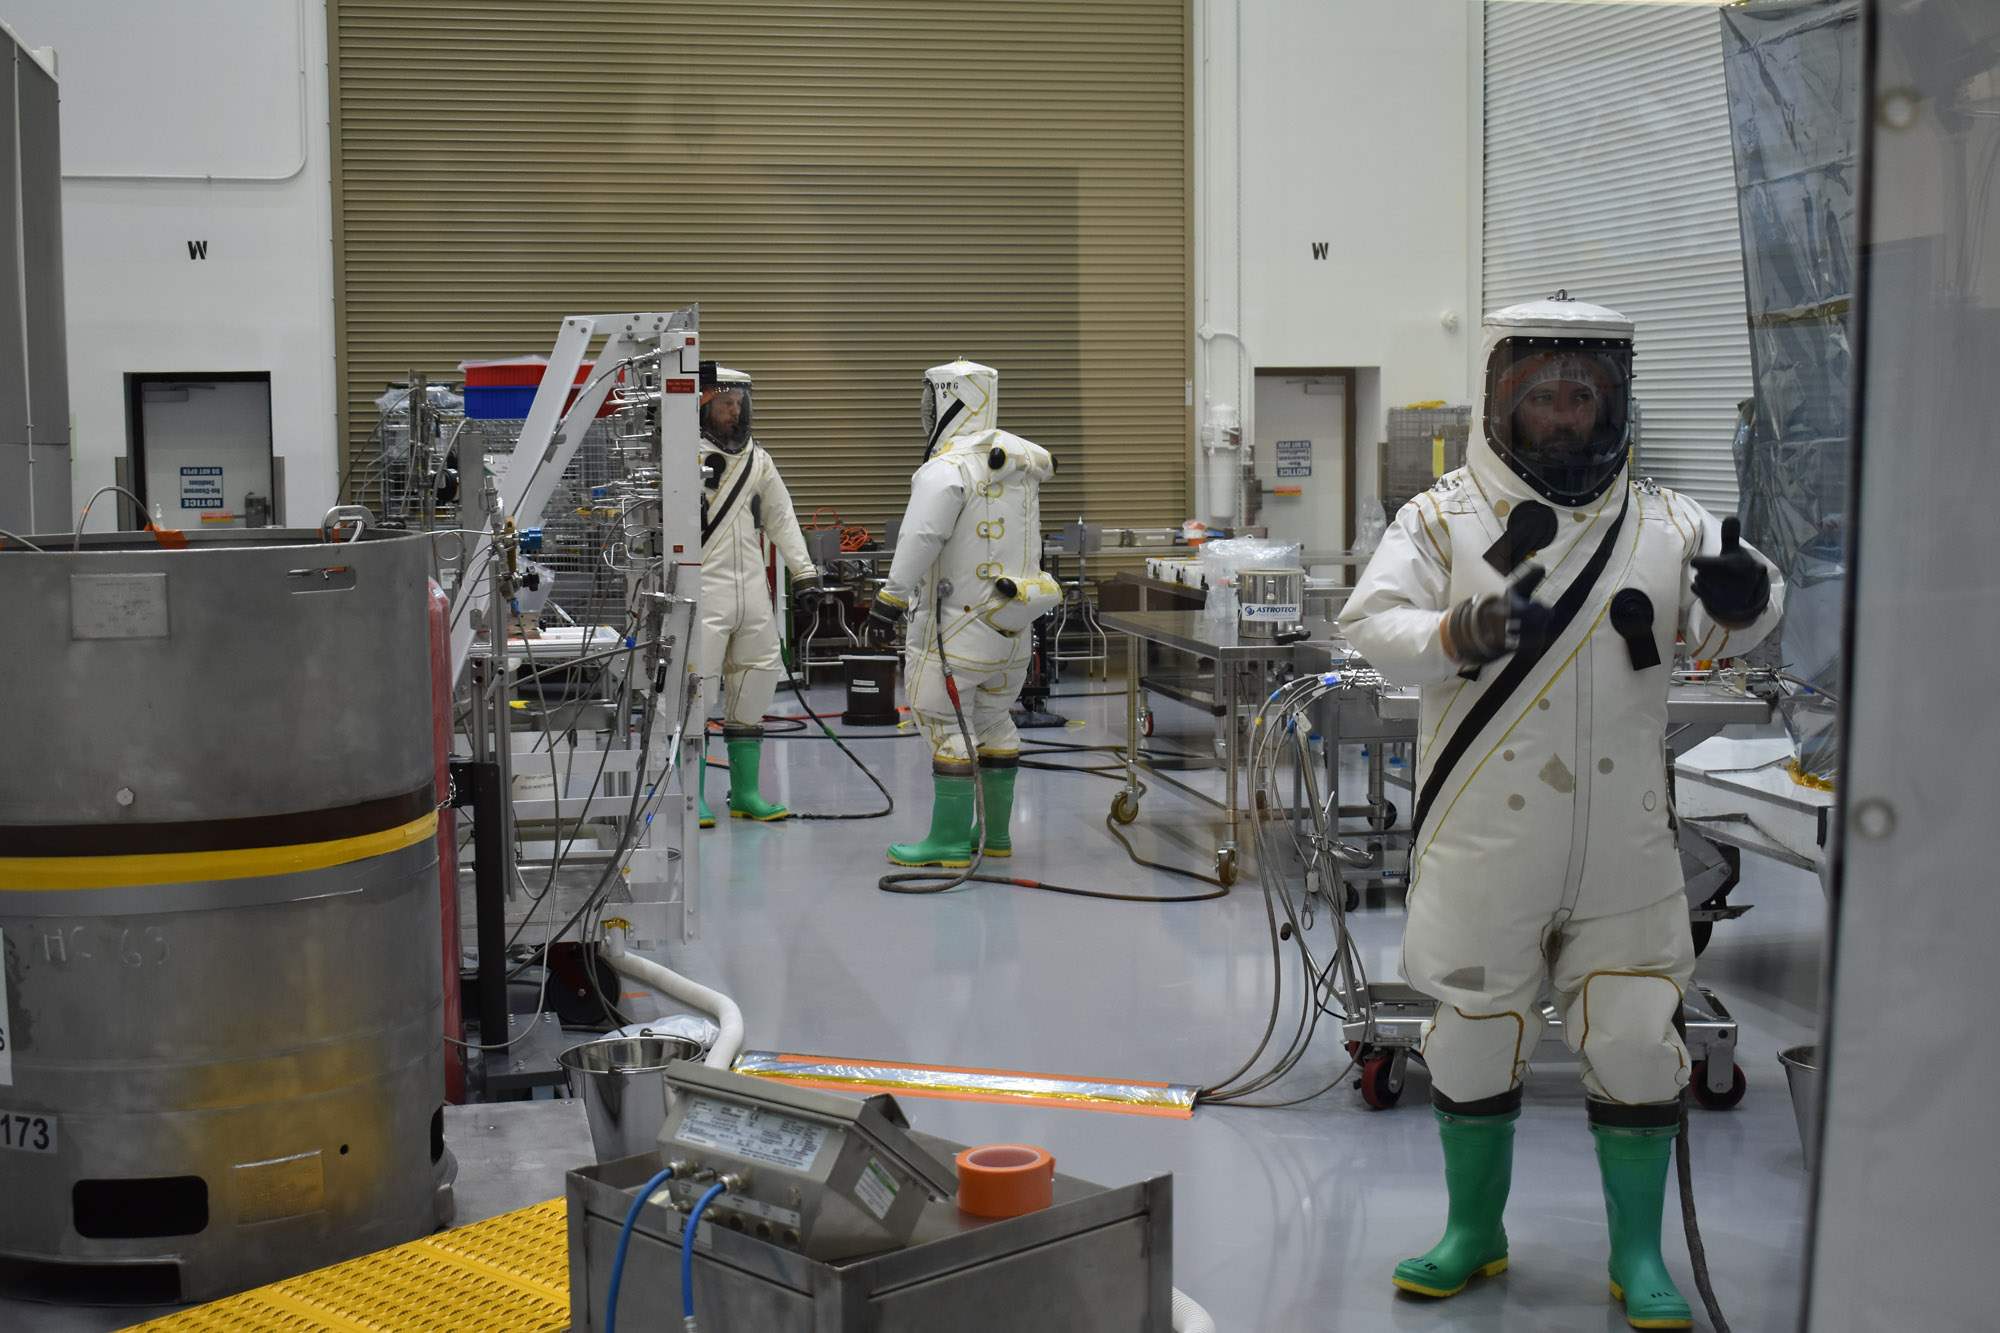
PACE Propellant Loading and Pressurization Procedure at Astrotech (Red Tag/Green Tag). Credit: NASA
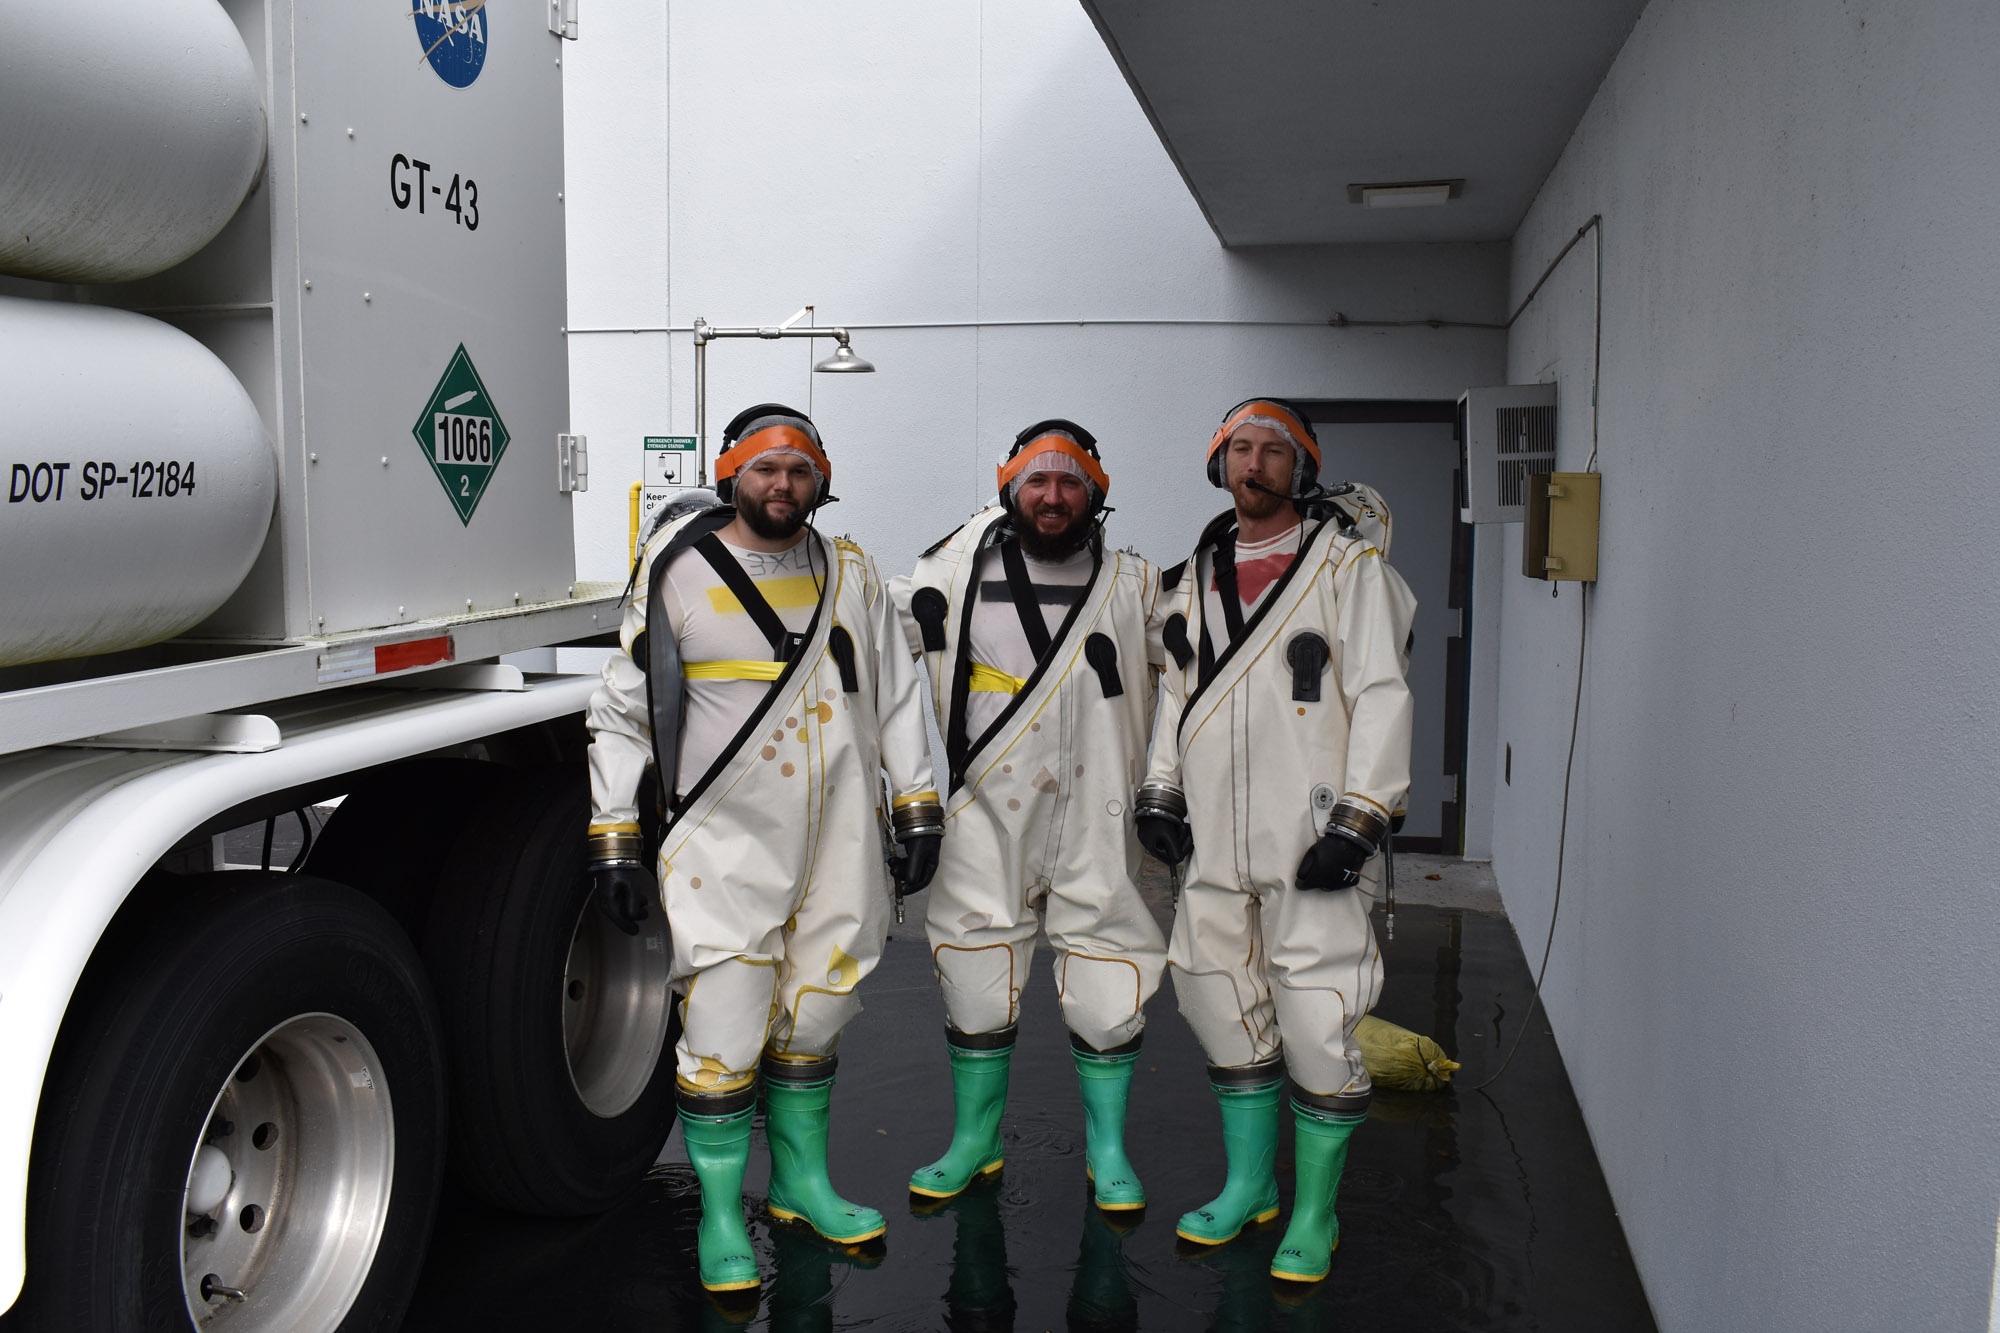
PACE Propellant Loading and Pressurization Procedure at Astrotech (Red Tag/Green Tag). Credit: NASA
Tracking and Delay Relay Satellites (TDRS) test photos. Launch Site integration and test: TDRS Live Sky at the Launch Site. Credit: NASA
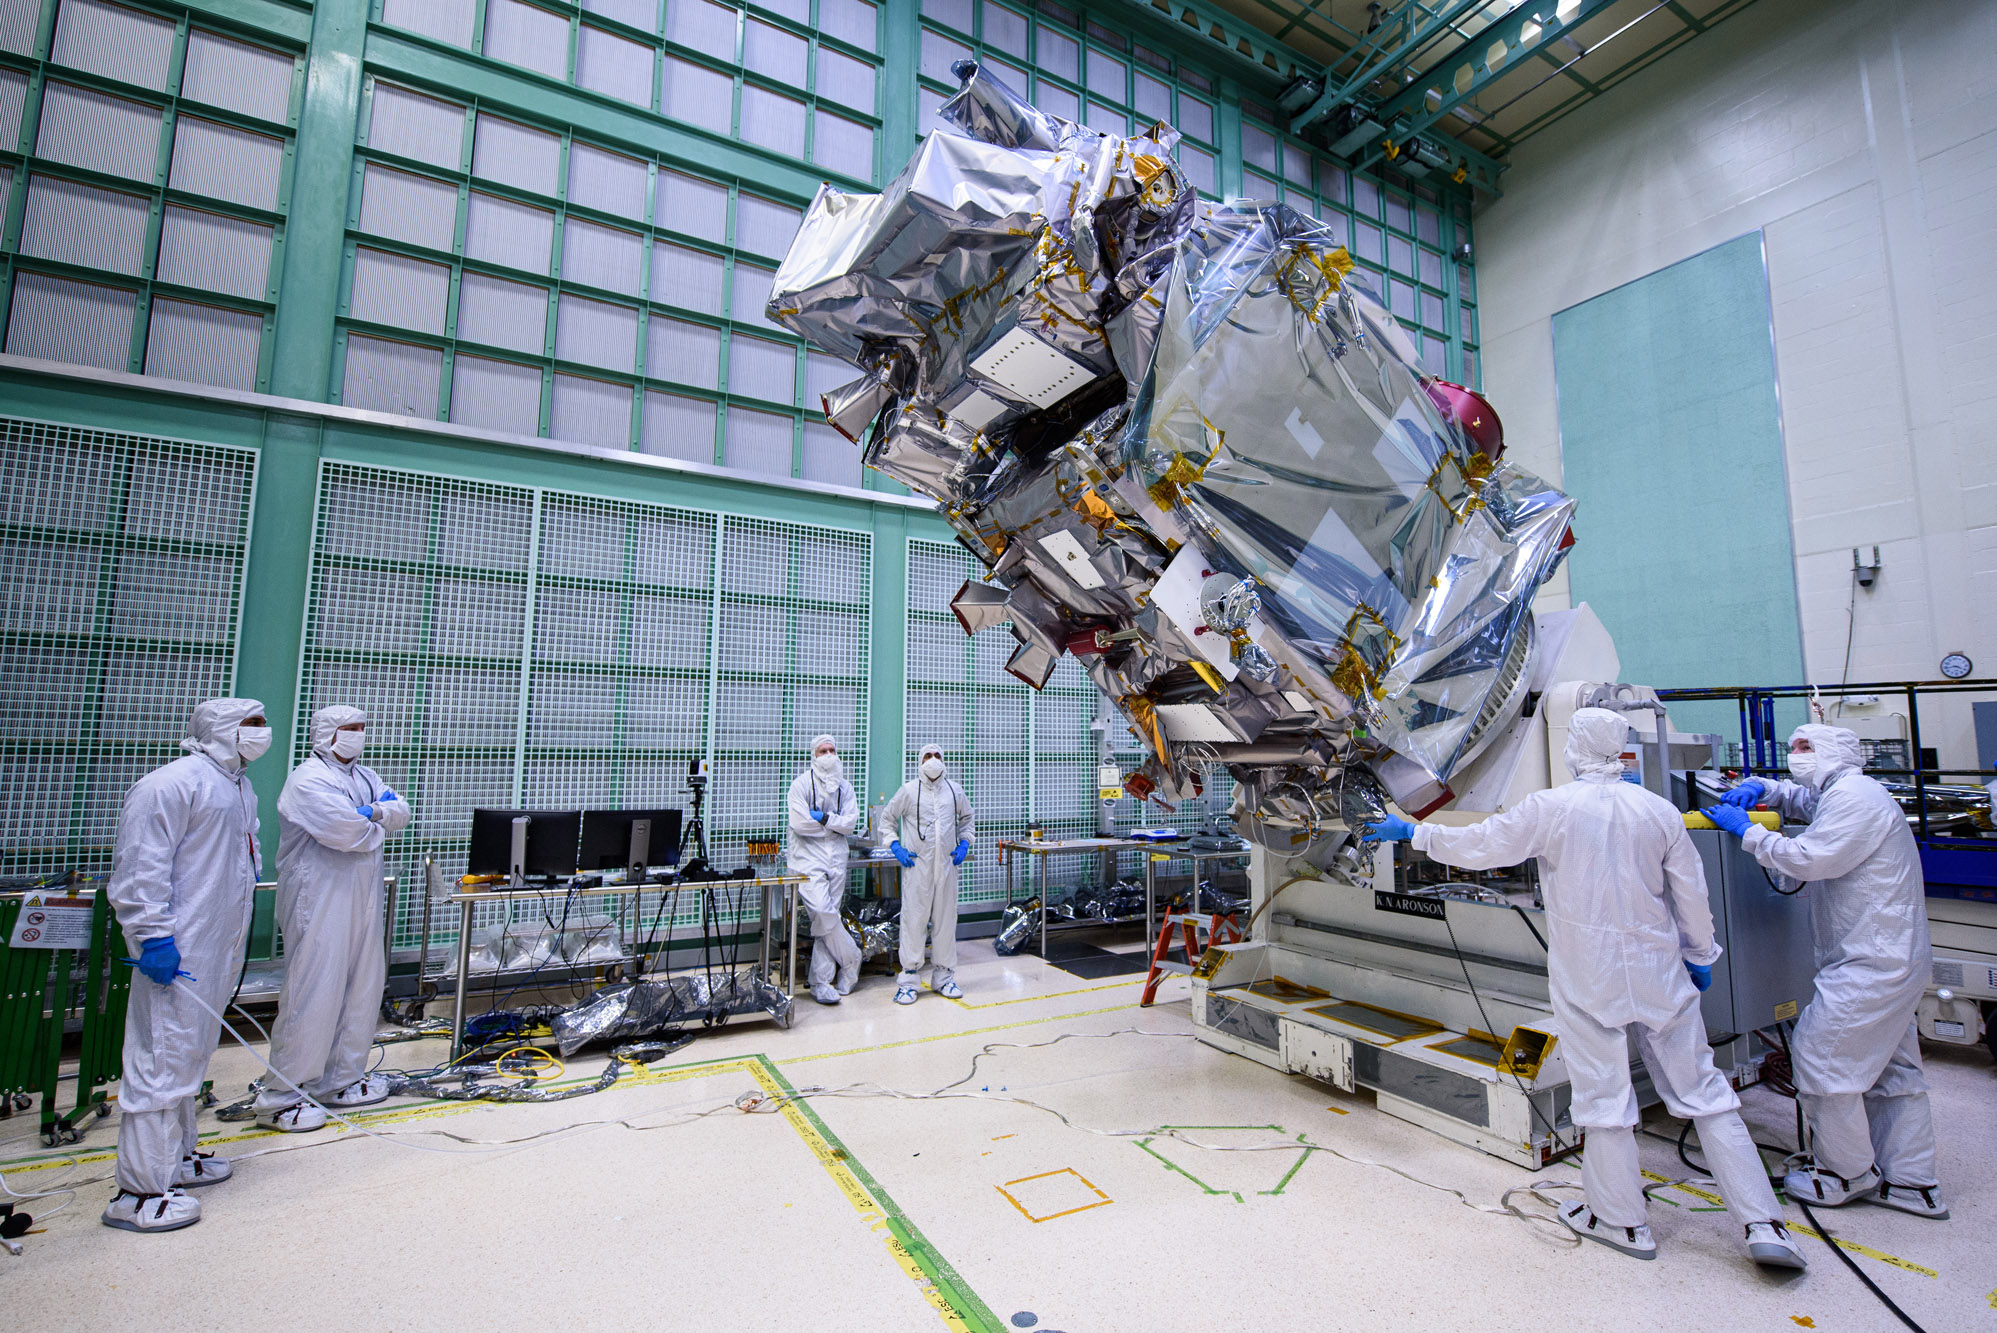
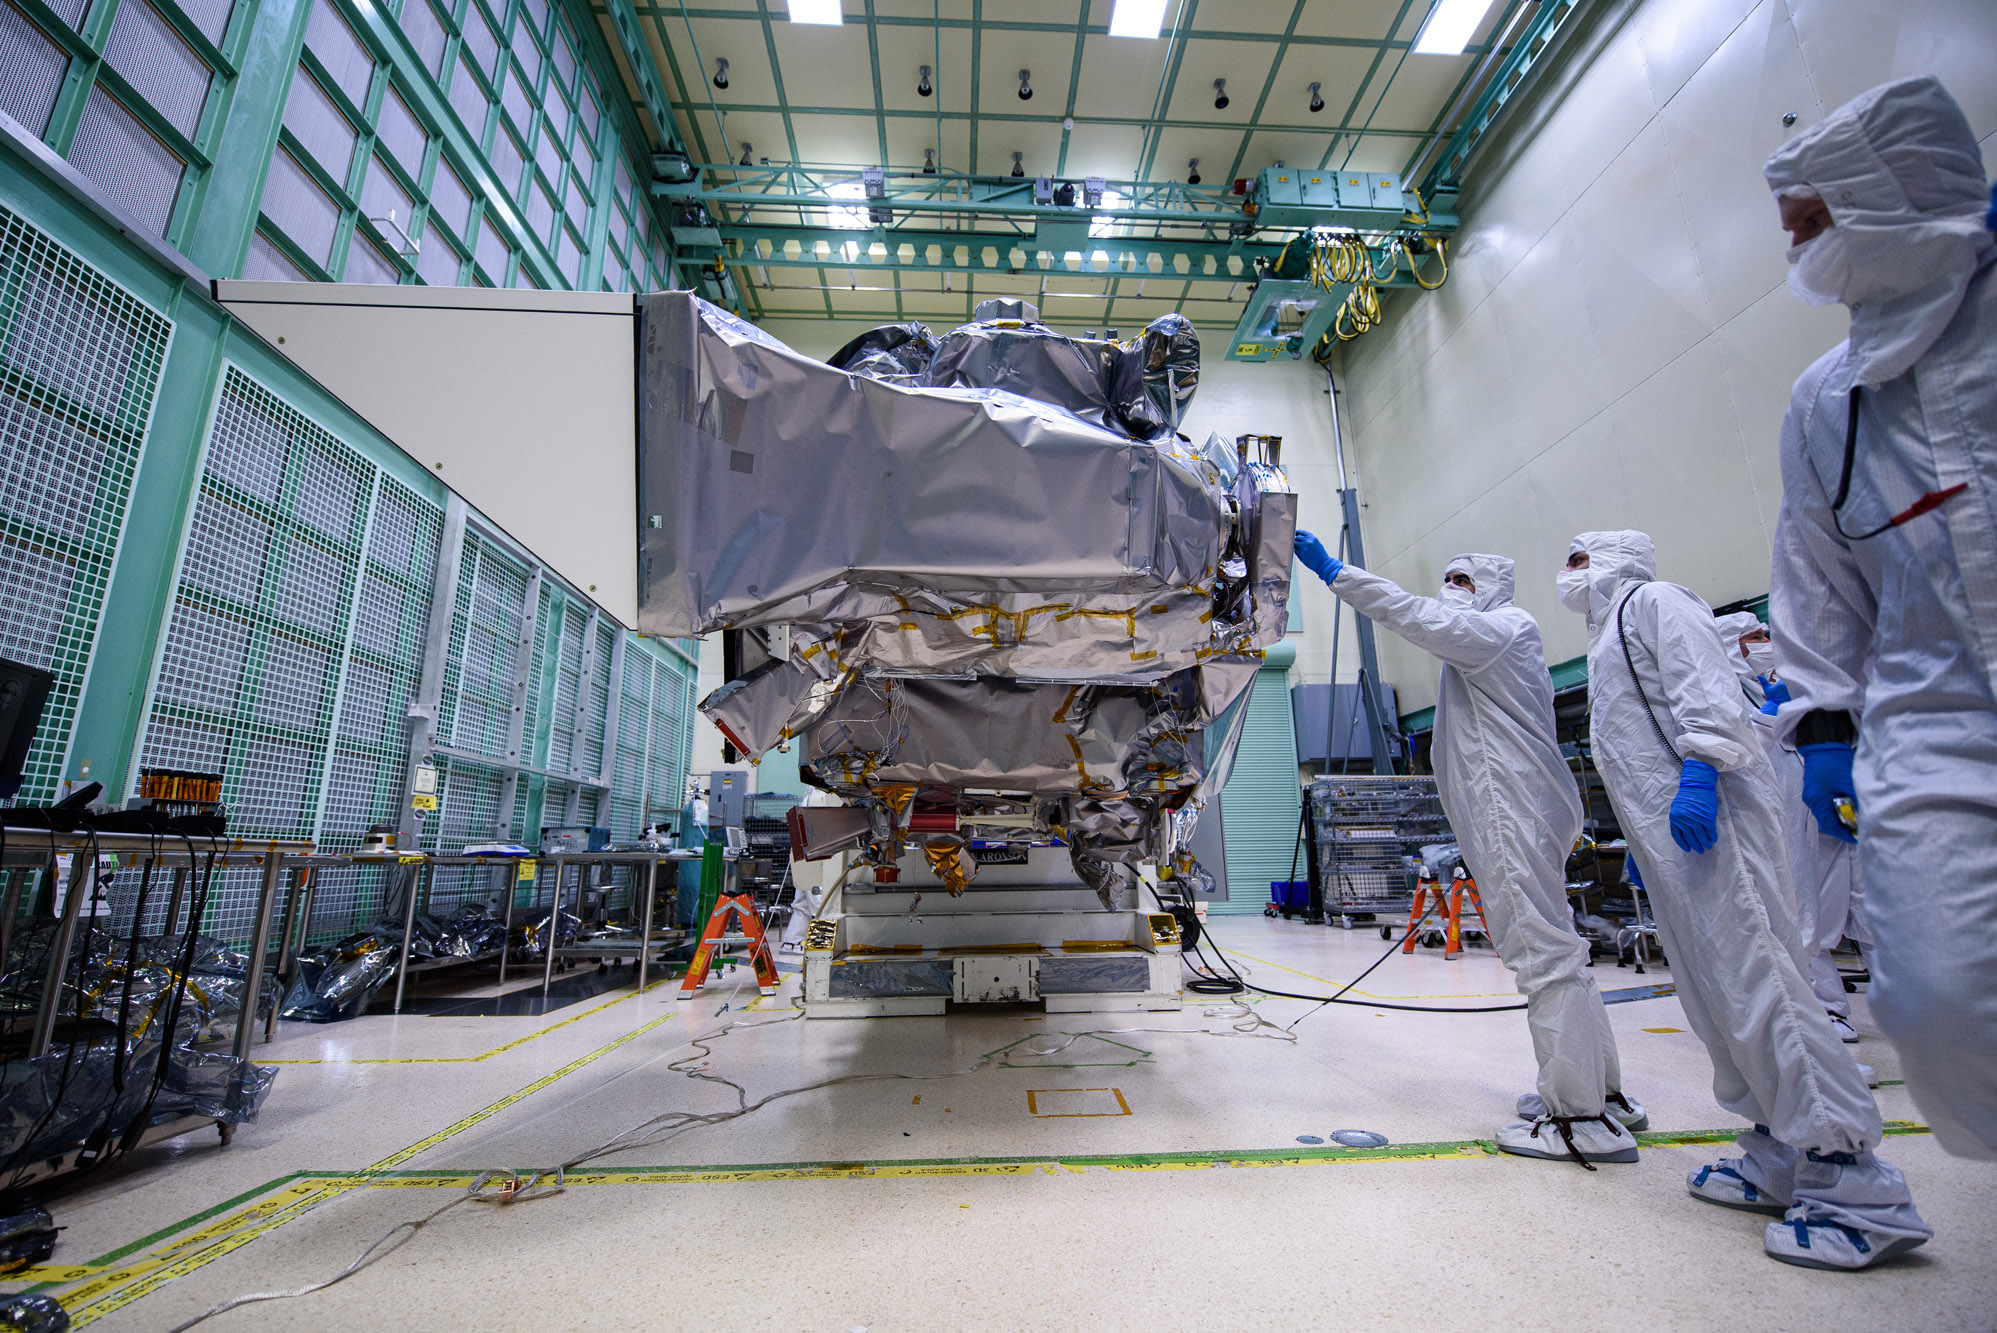
PACE Observatory on Dolly at Astrotech during Launch Campaign. Launch Site integration and test: Lift Observatory to Aronson Table. Lift Back to Observatory Dolly. Credit: NASA
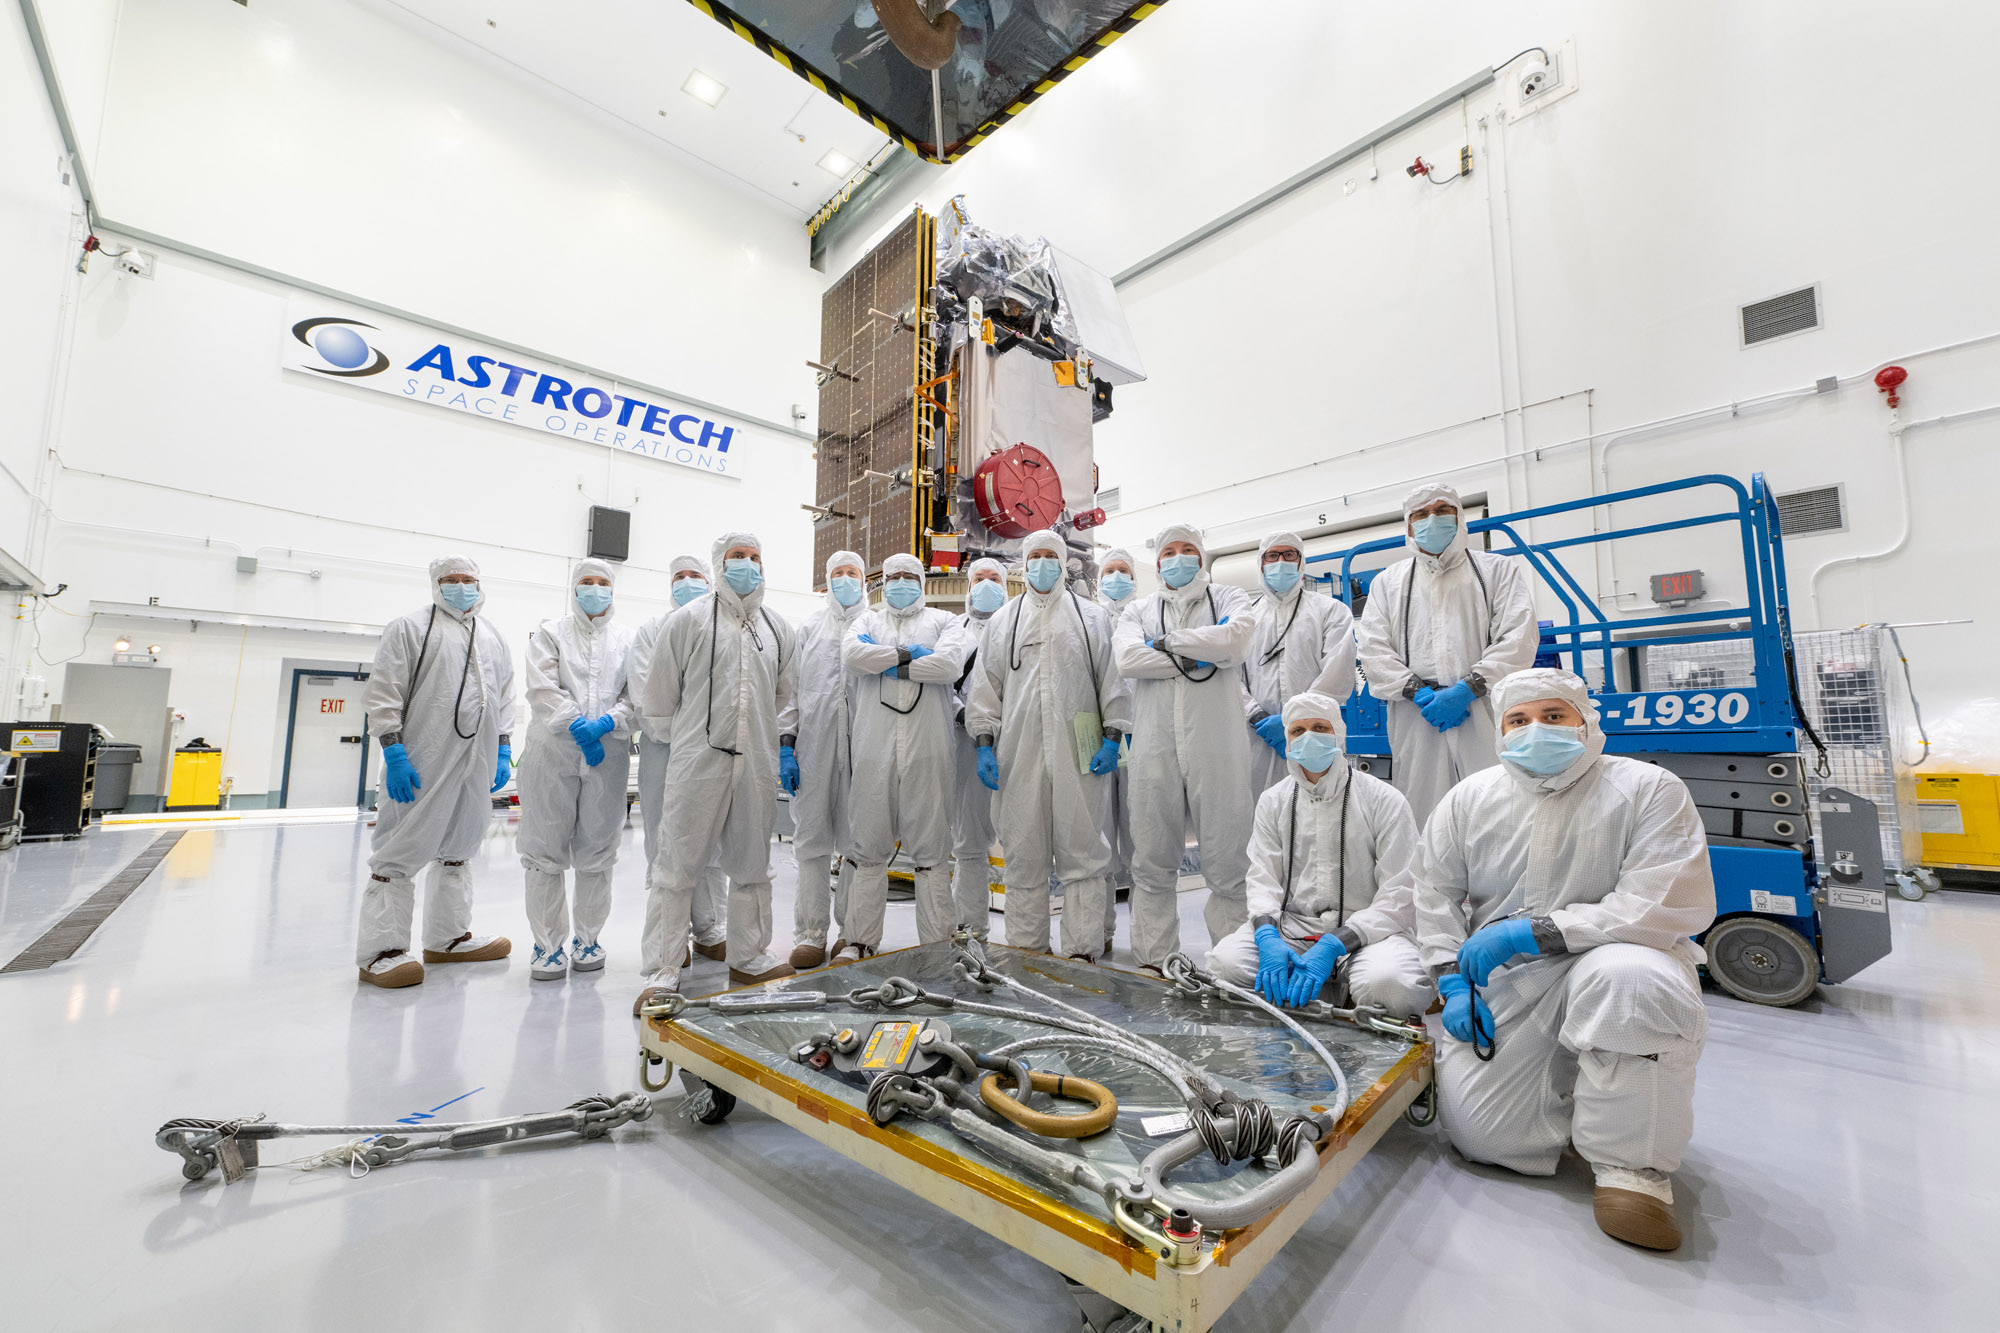
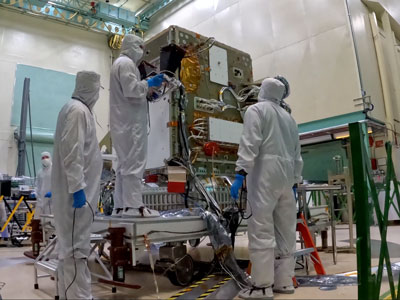
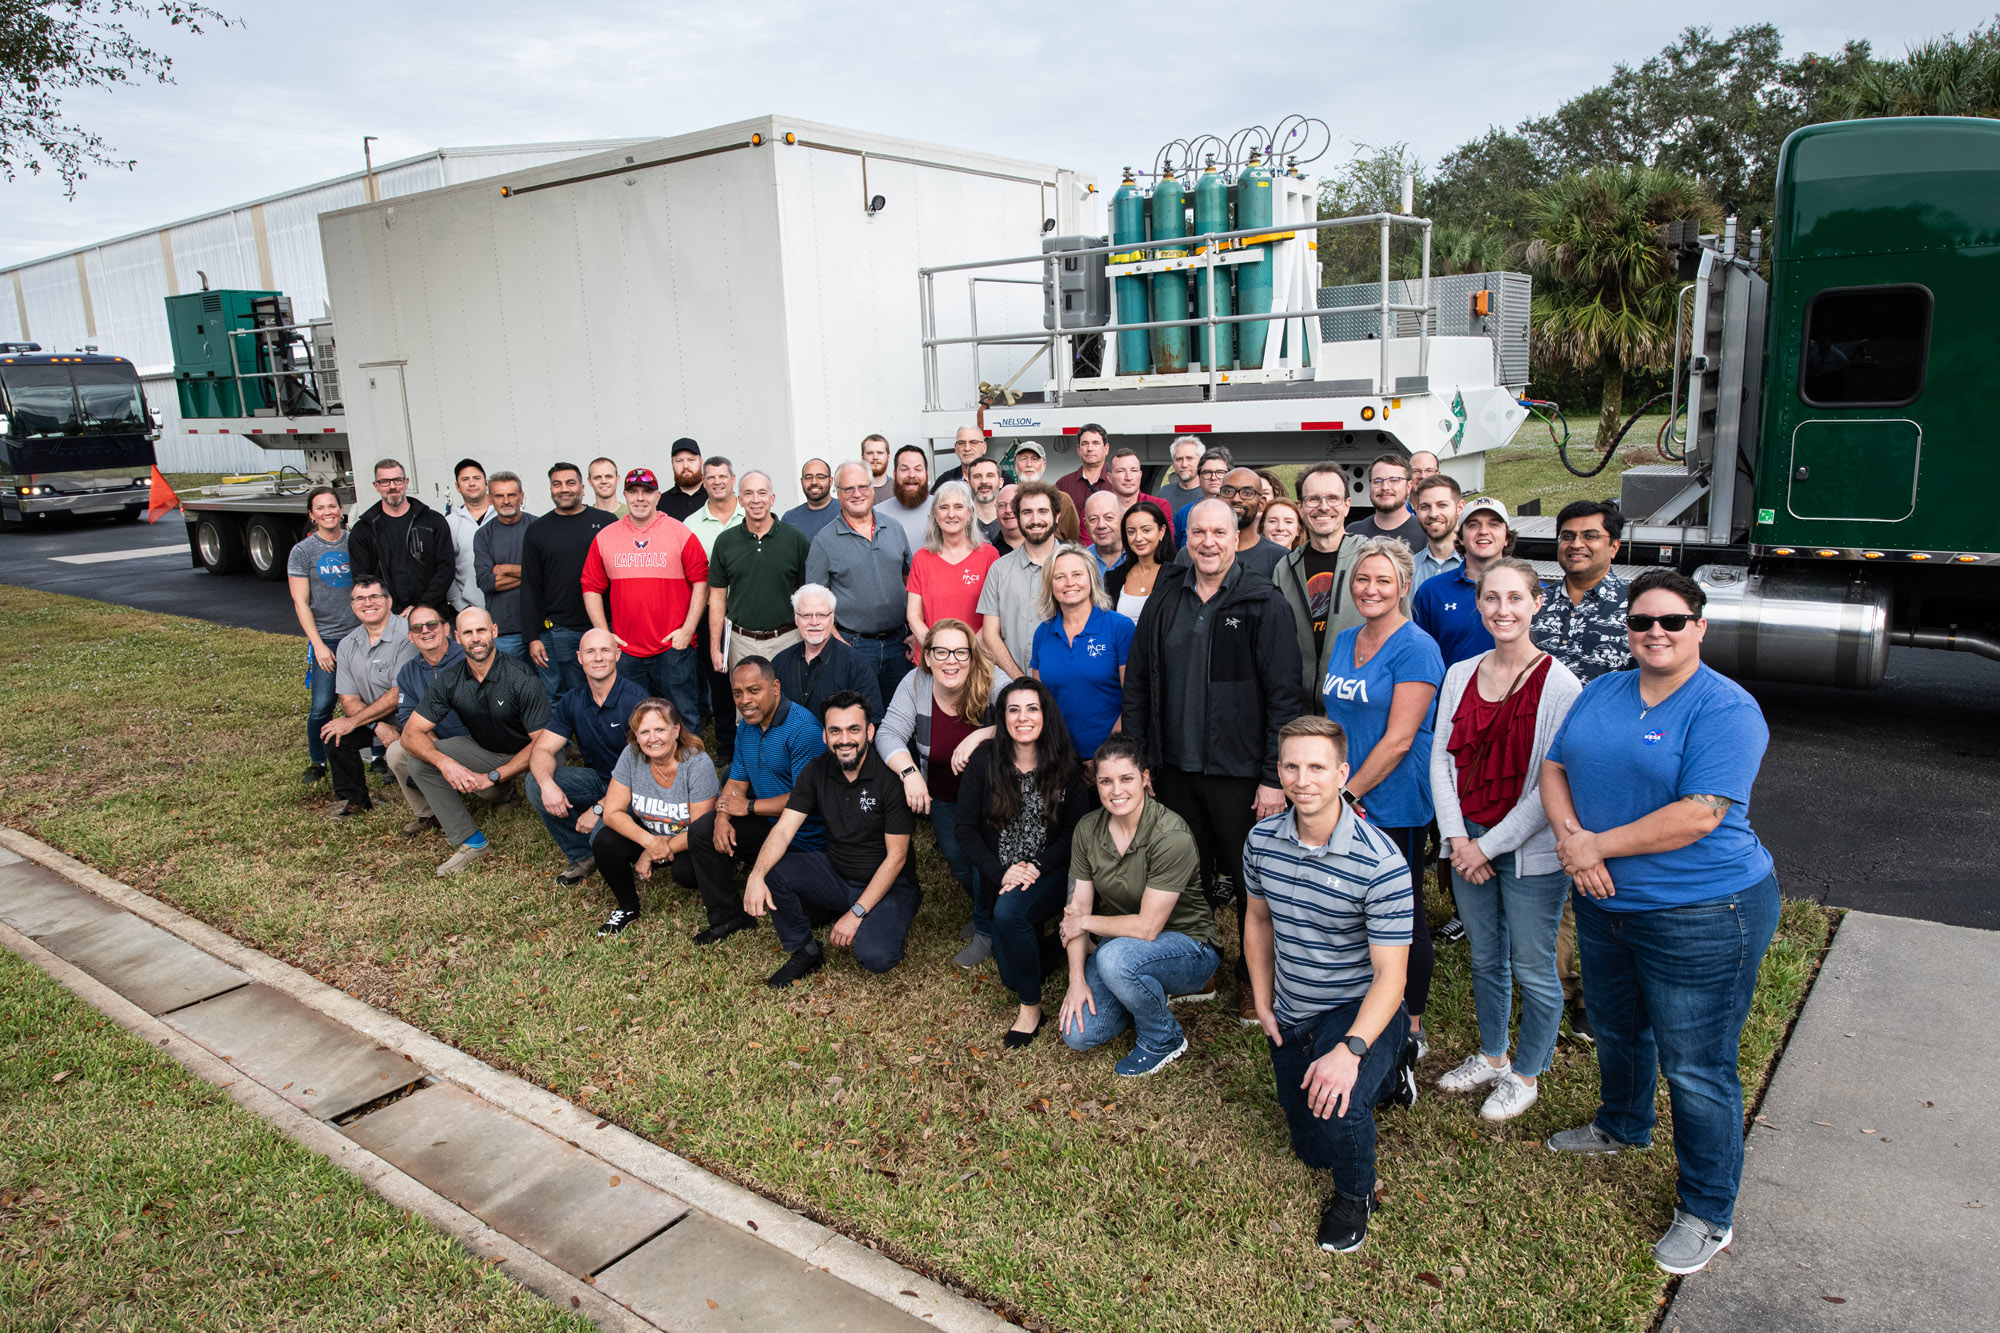
Mechanical Team Photo in front of PACE Observatory on Dolly at Astrotech during Launch Campaign. Credit: NASA
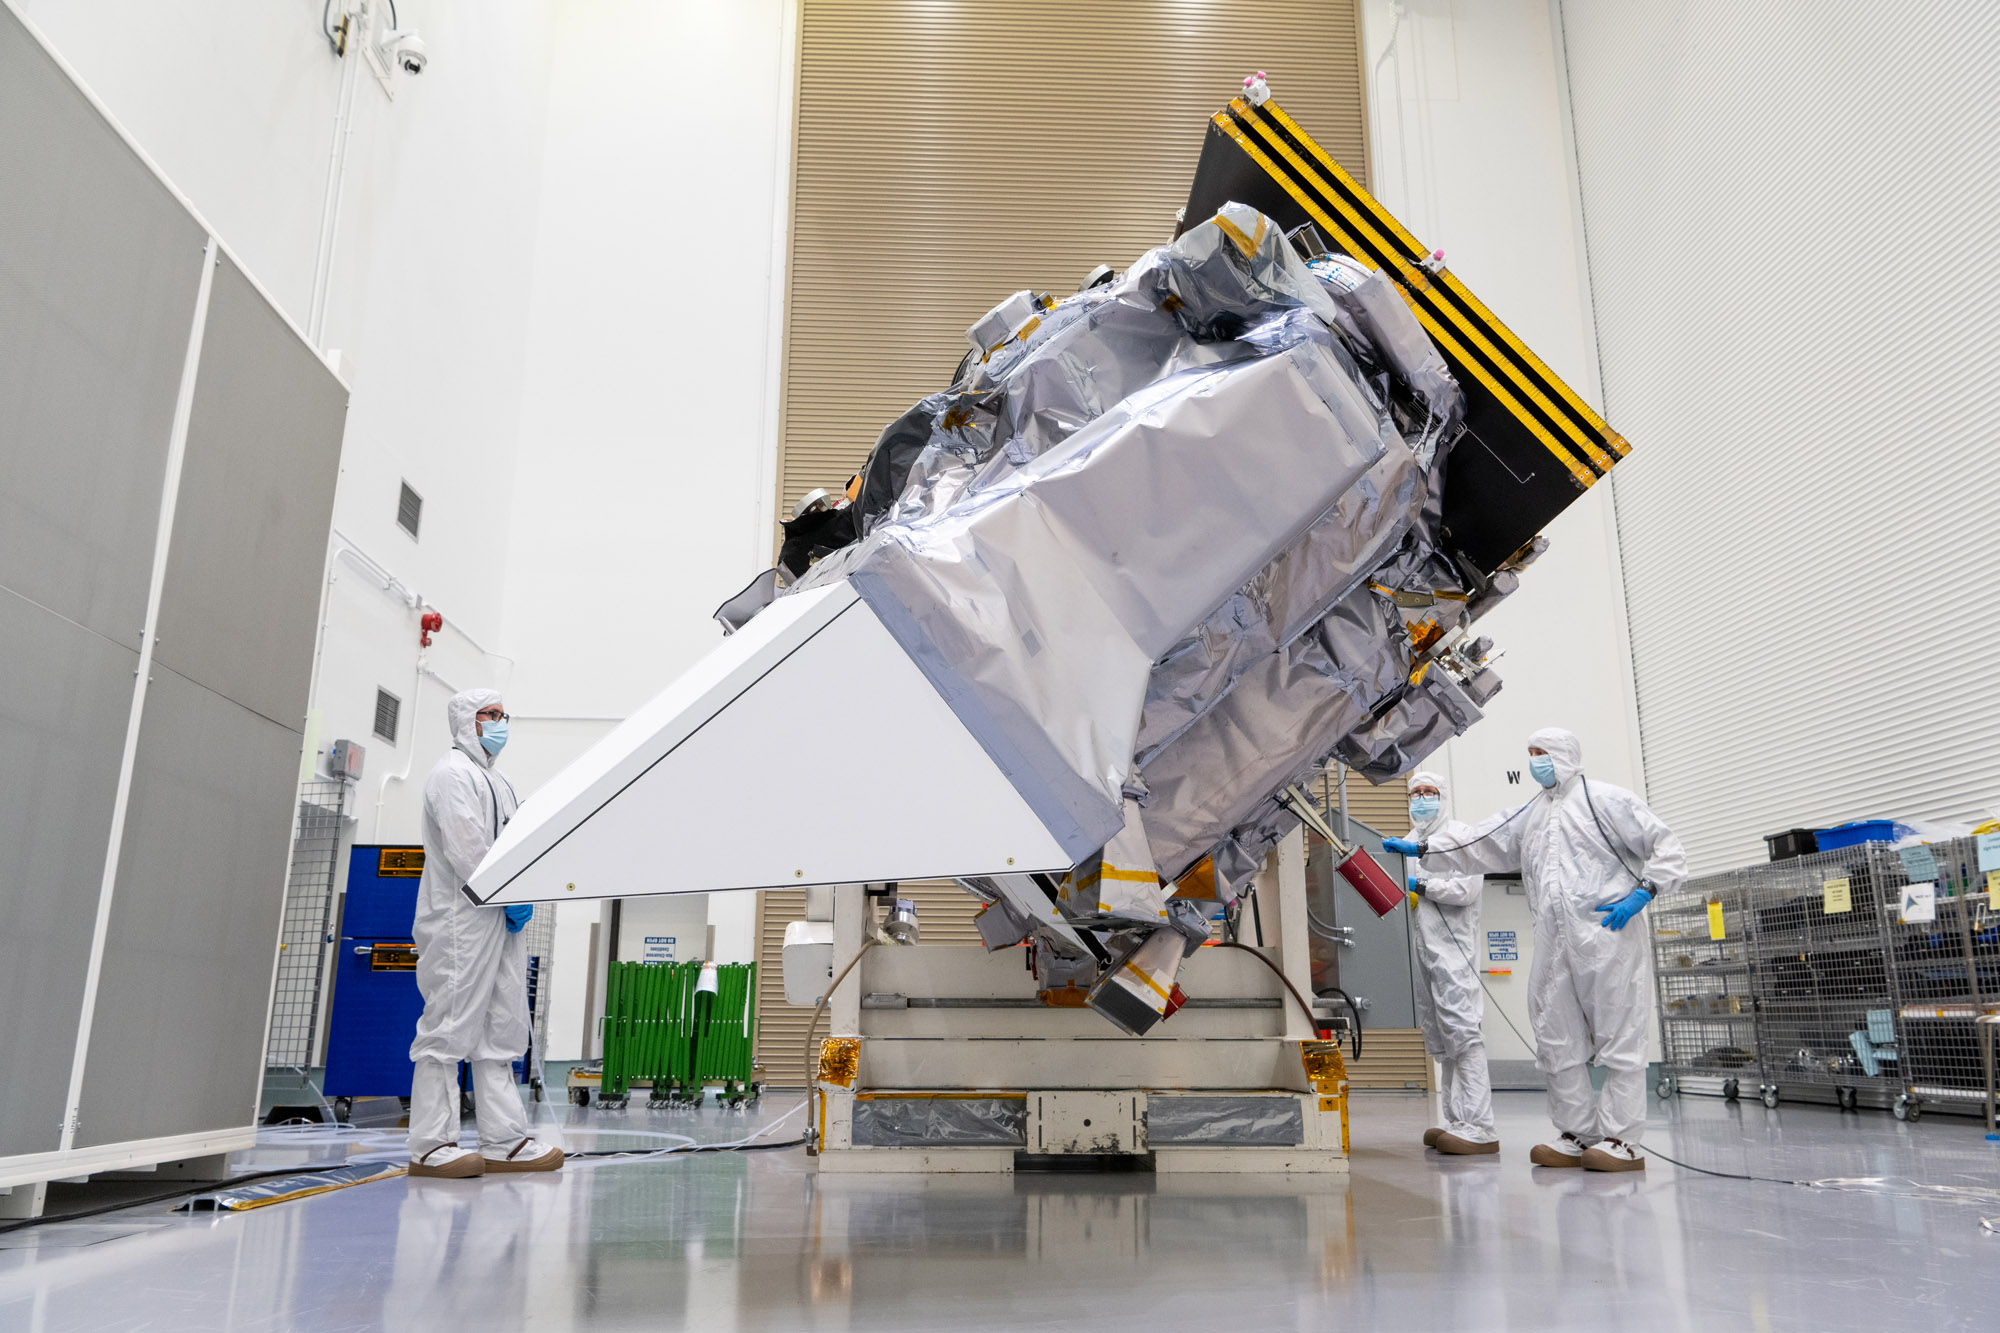
Launch Site integration and test. Lift Observatory to Aronson Table, Rotate for investigation, Lift Back to Observatory Dolly. Credit: NASA
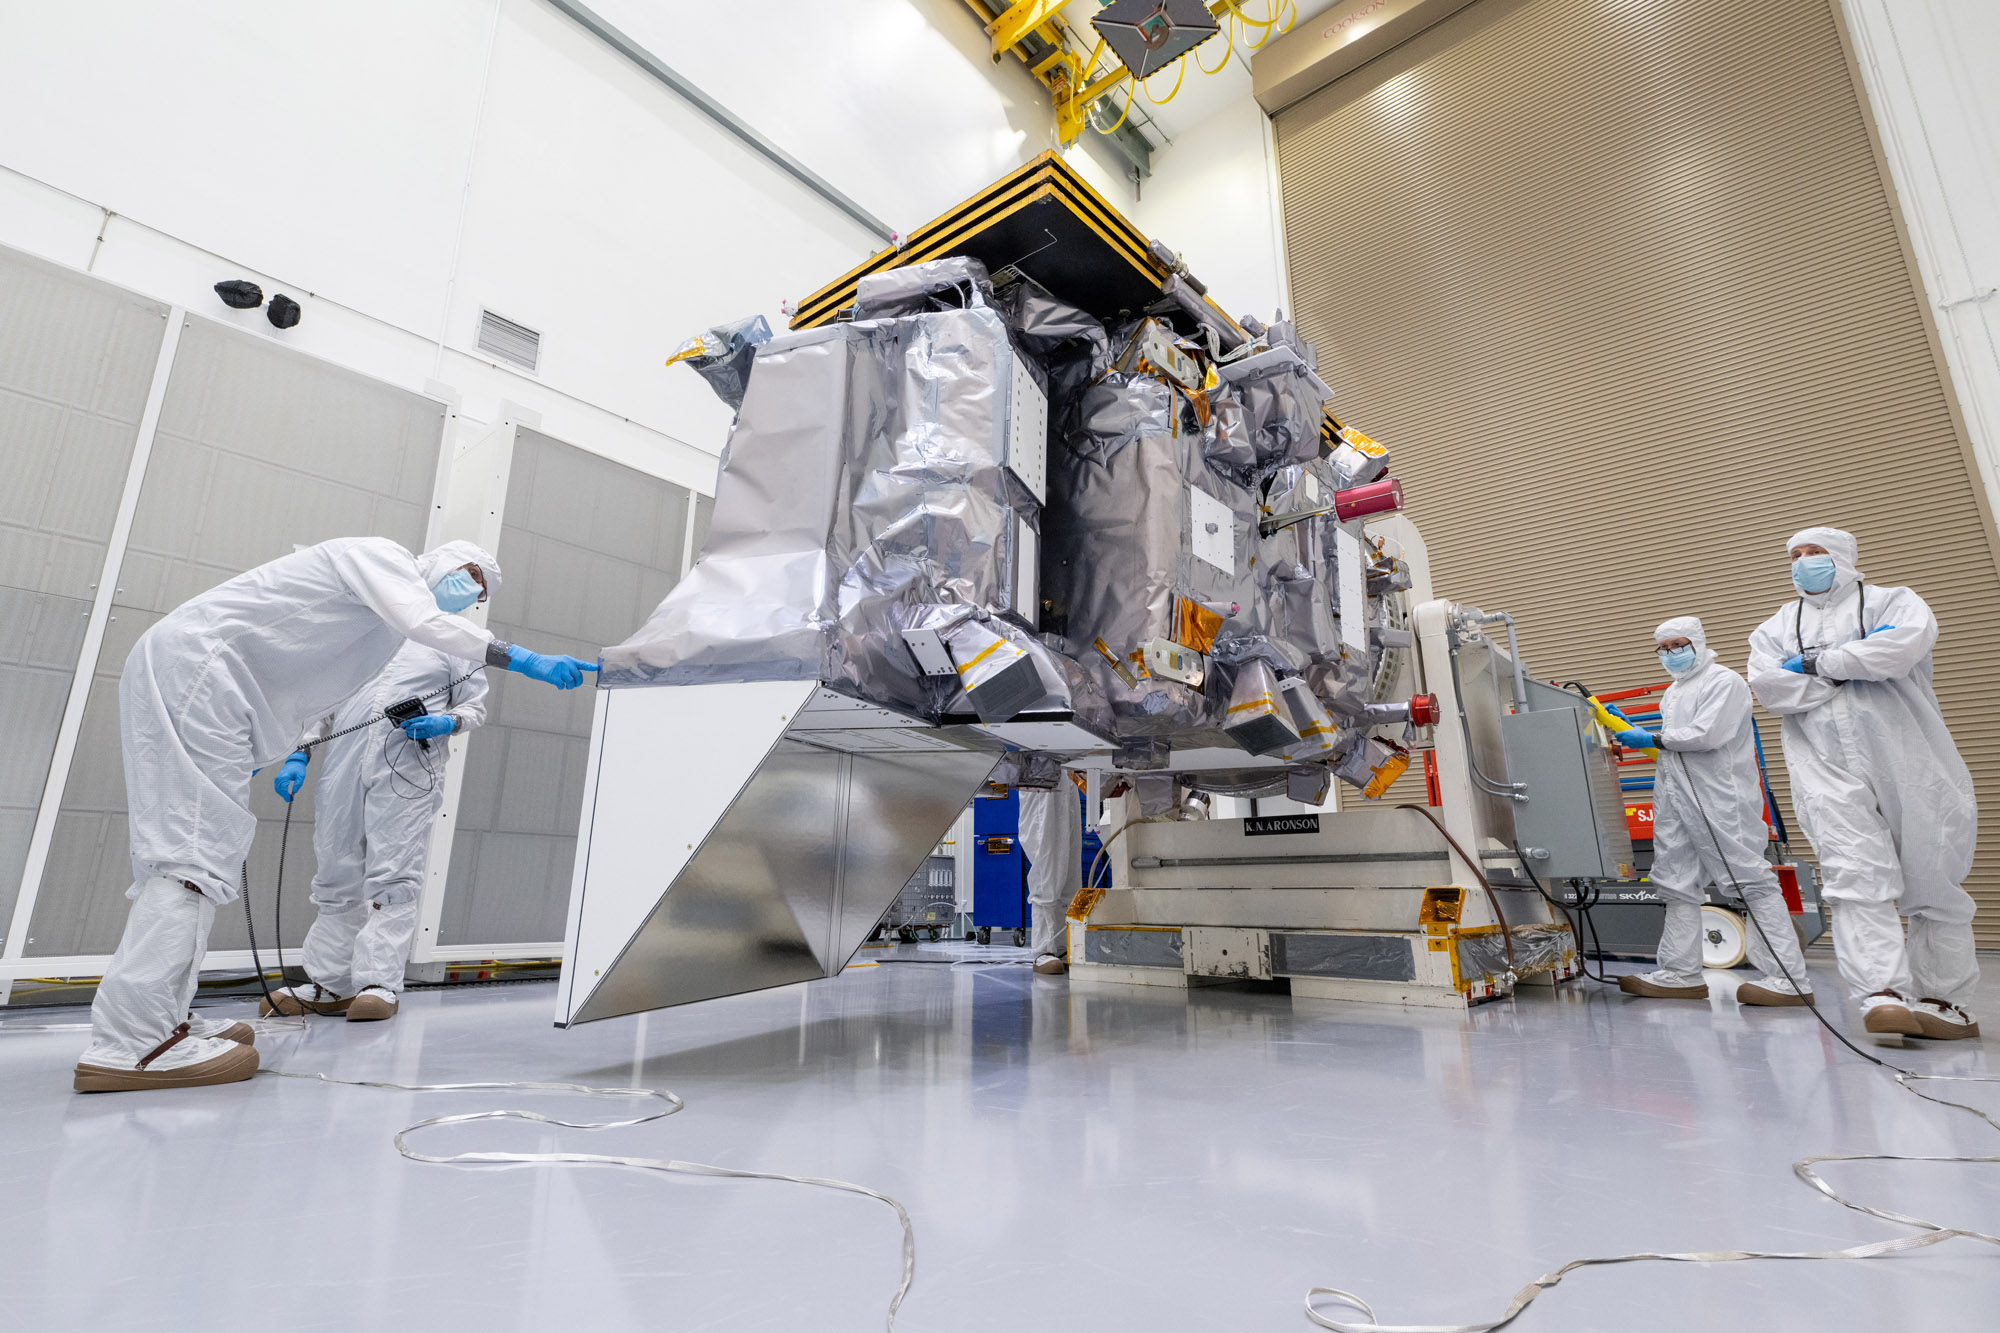
Launch Site integration and test. Lift Observatory to Aronson Table, Rotate for investigation, Lift Back to Observatory Dolly. Credit: NASA
PACE observatory's arrival at Astrotech. Credit: NASA
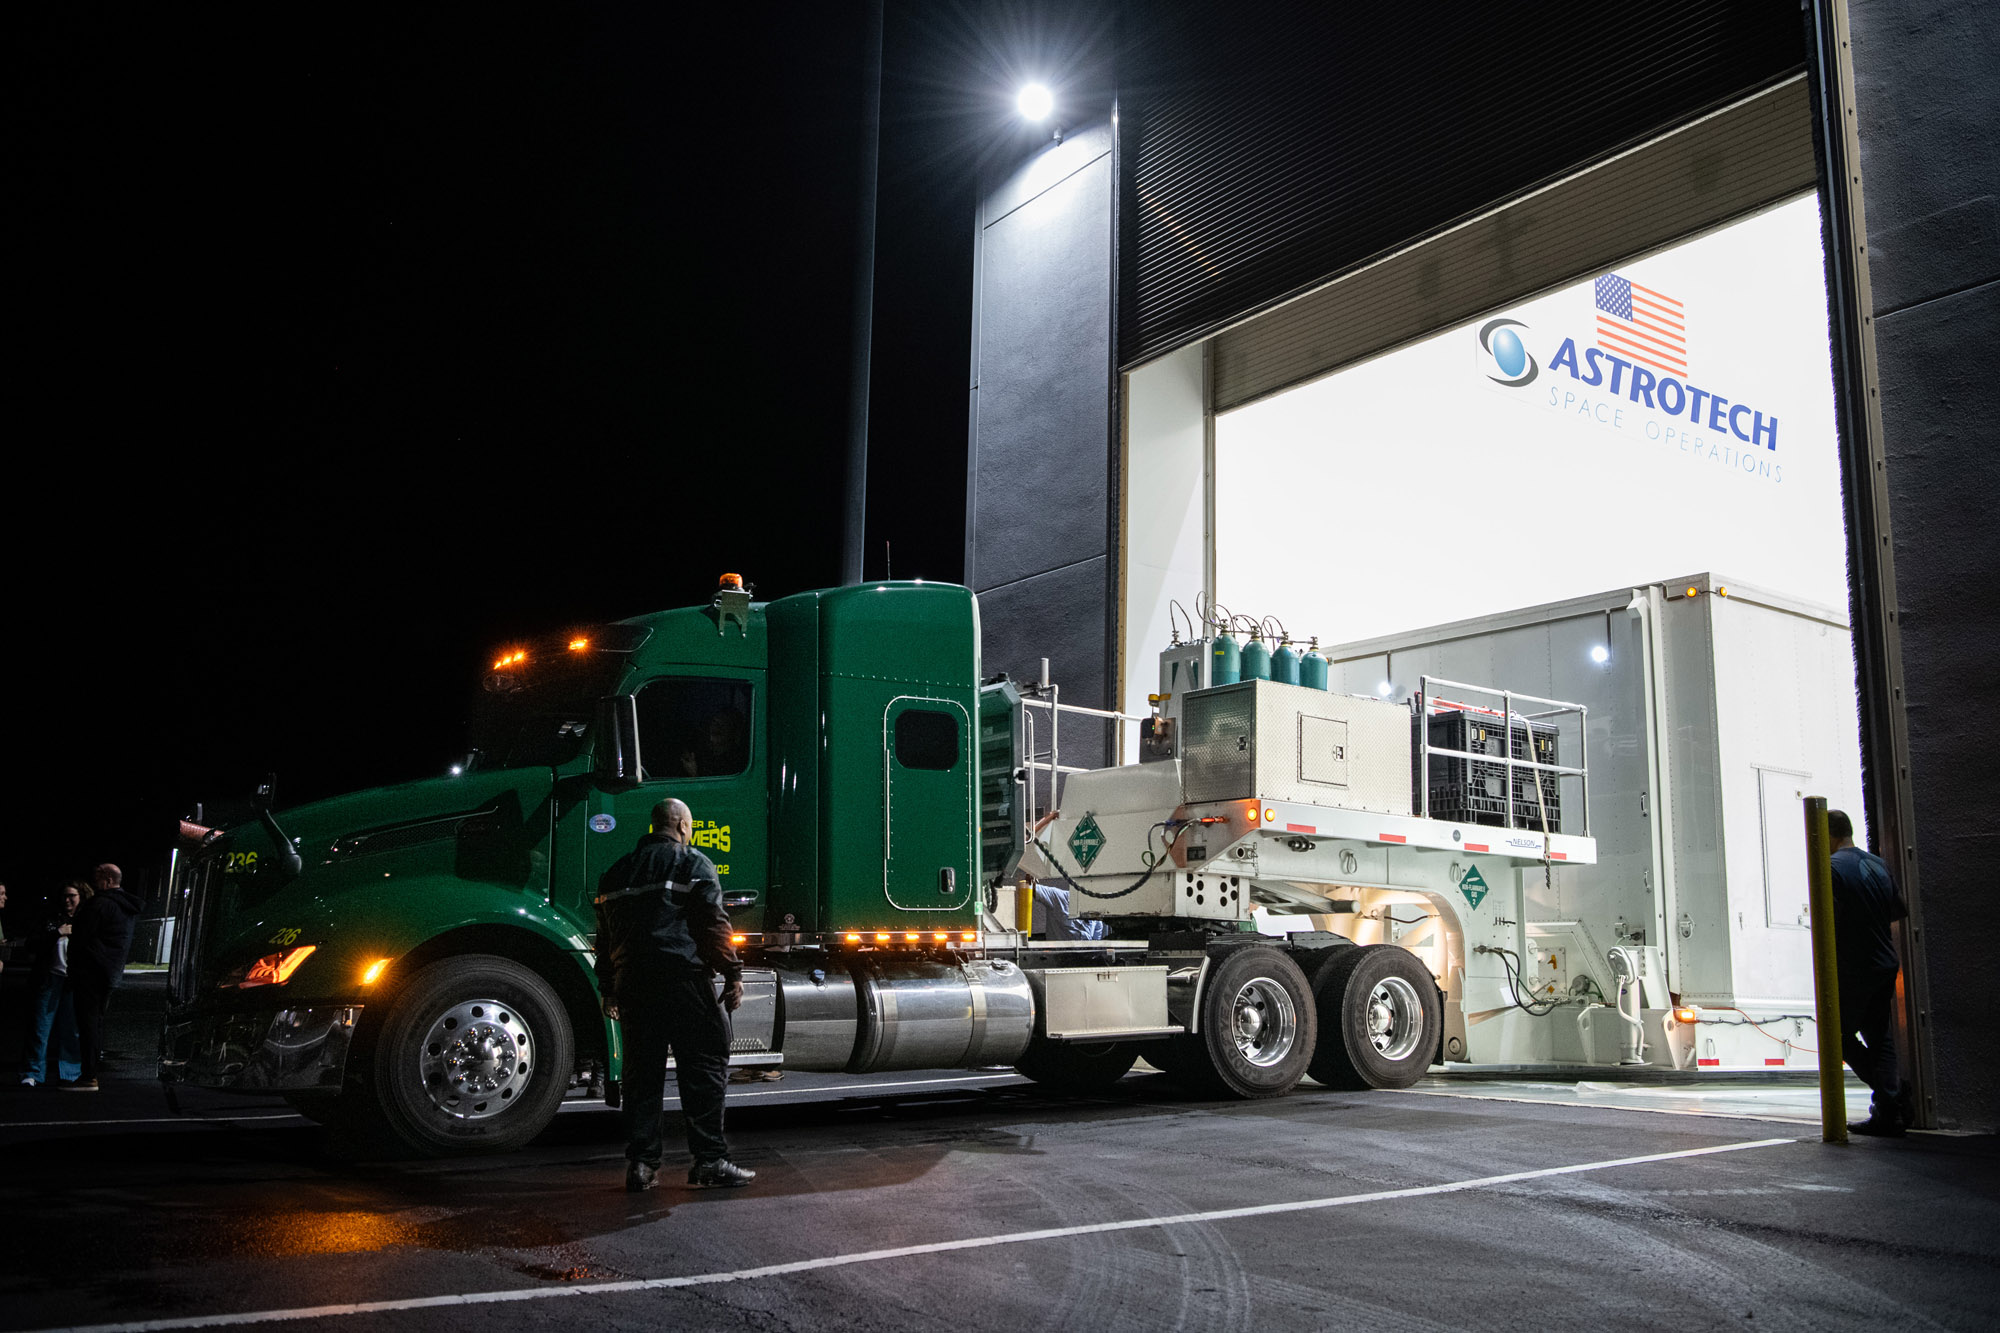
PACE observatory's arrival at Astrotech. Credit: NASA
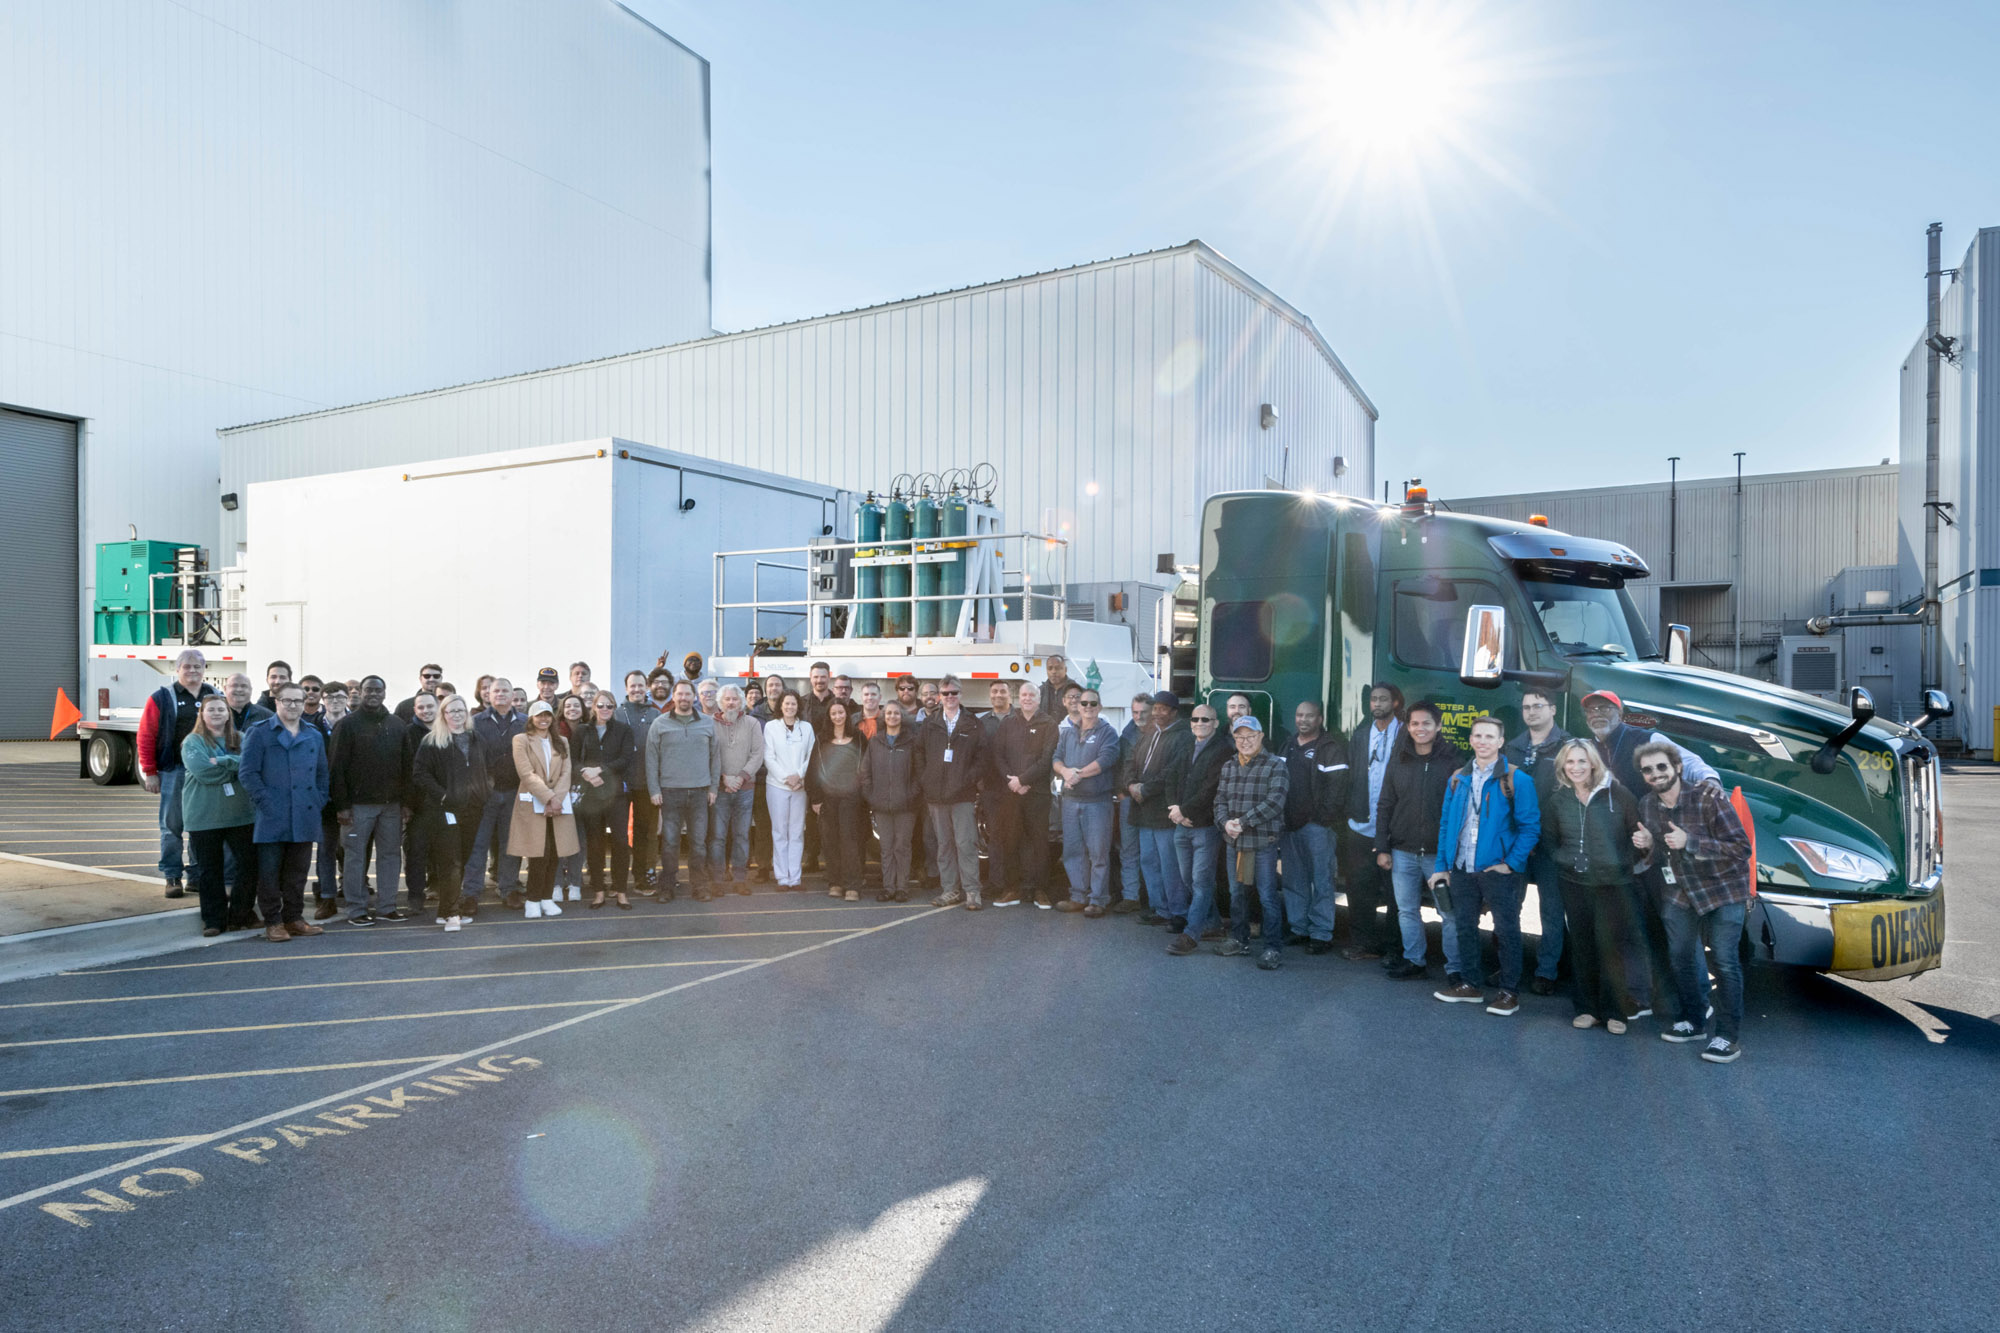
PACE Observatory transport to Astrotech. Credit: NASA
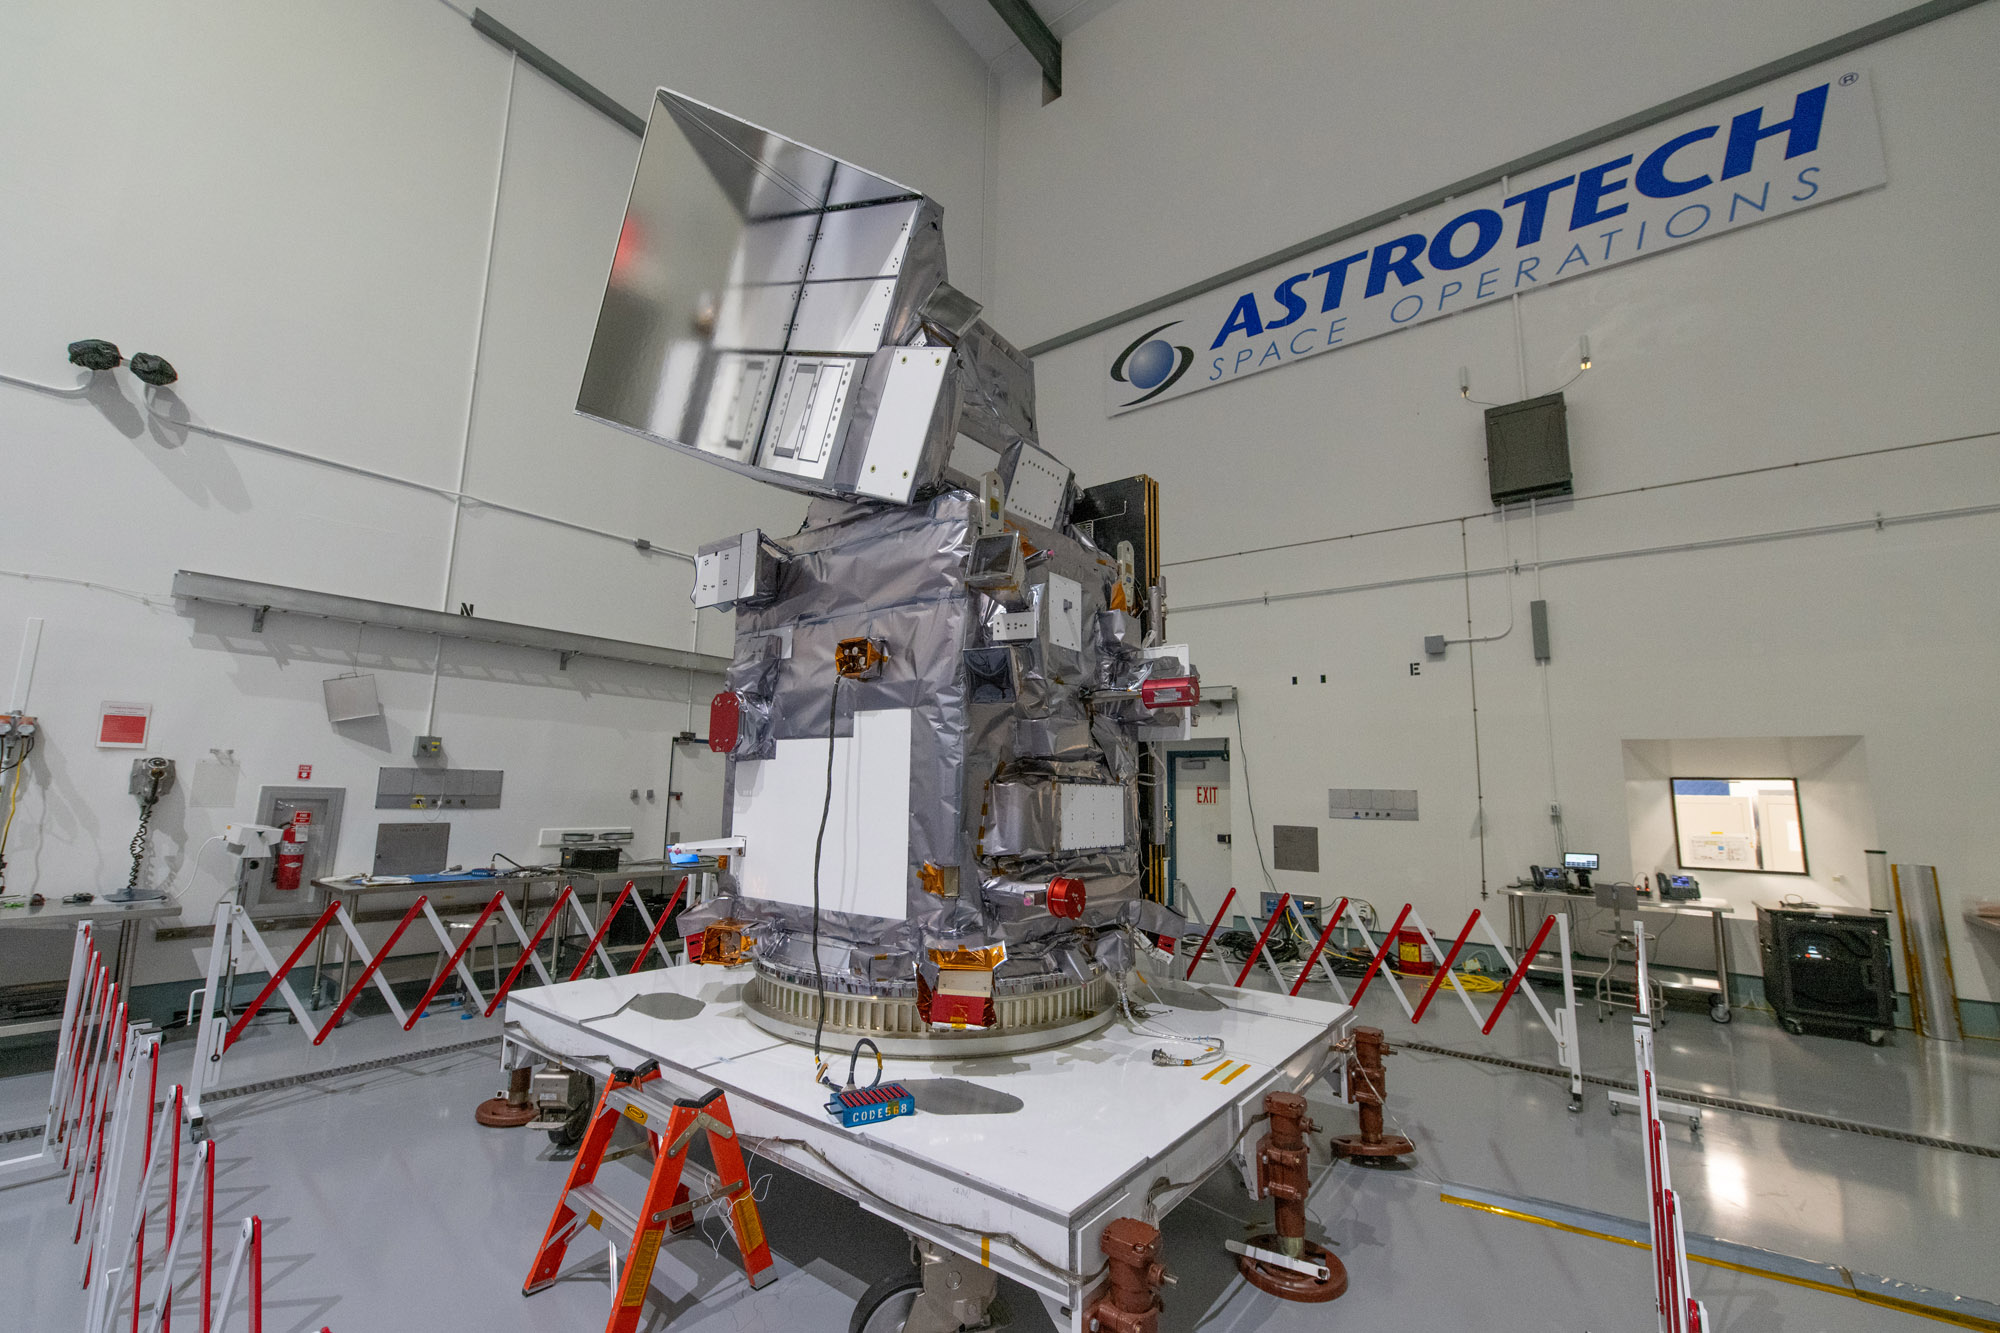
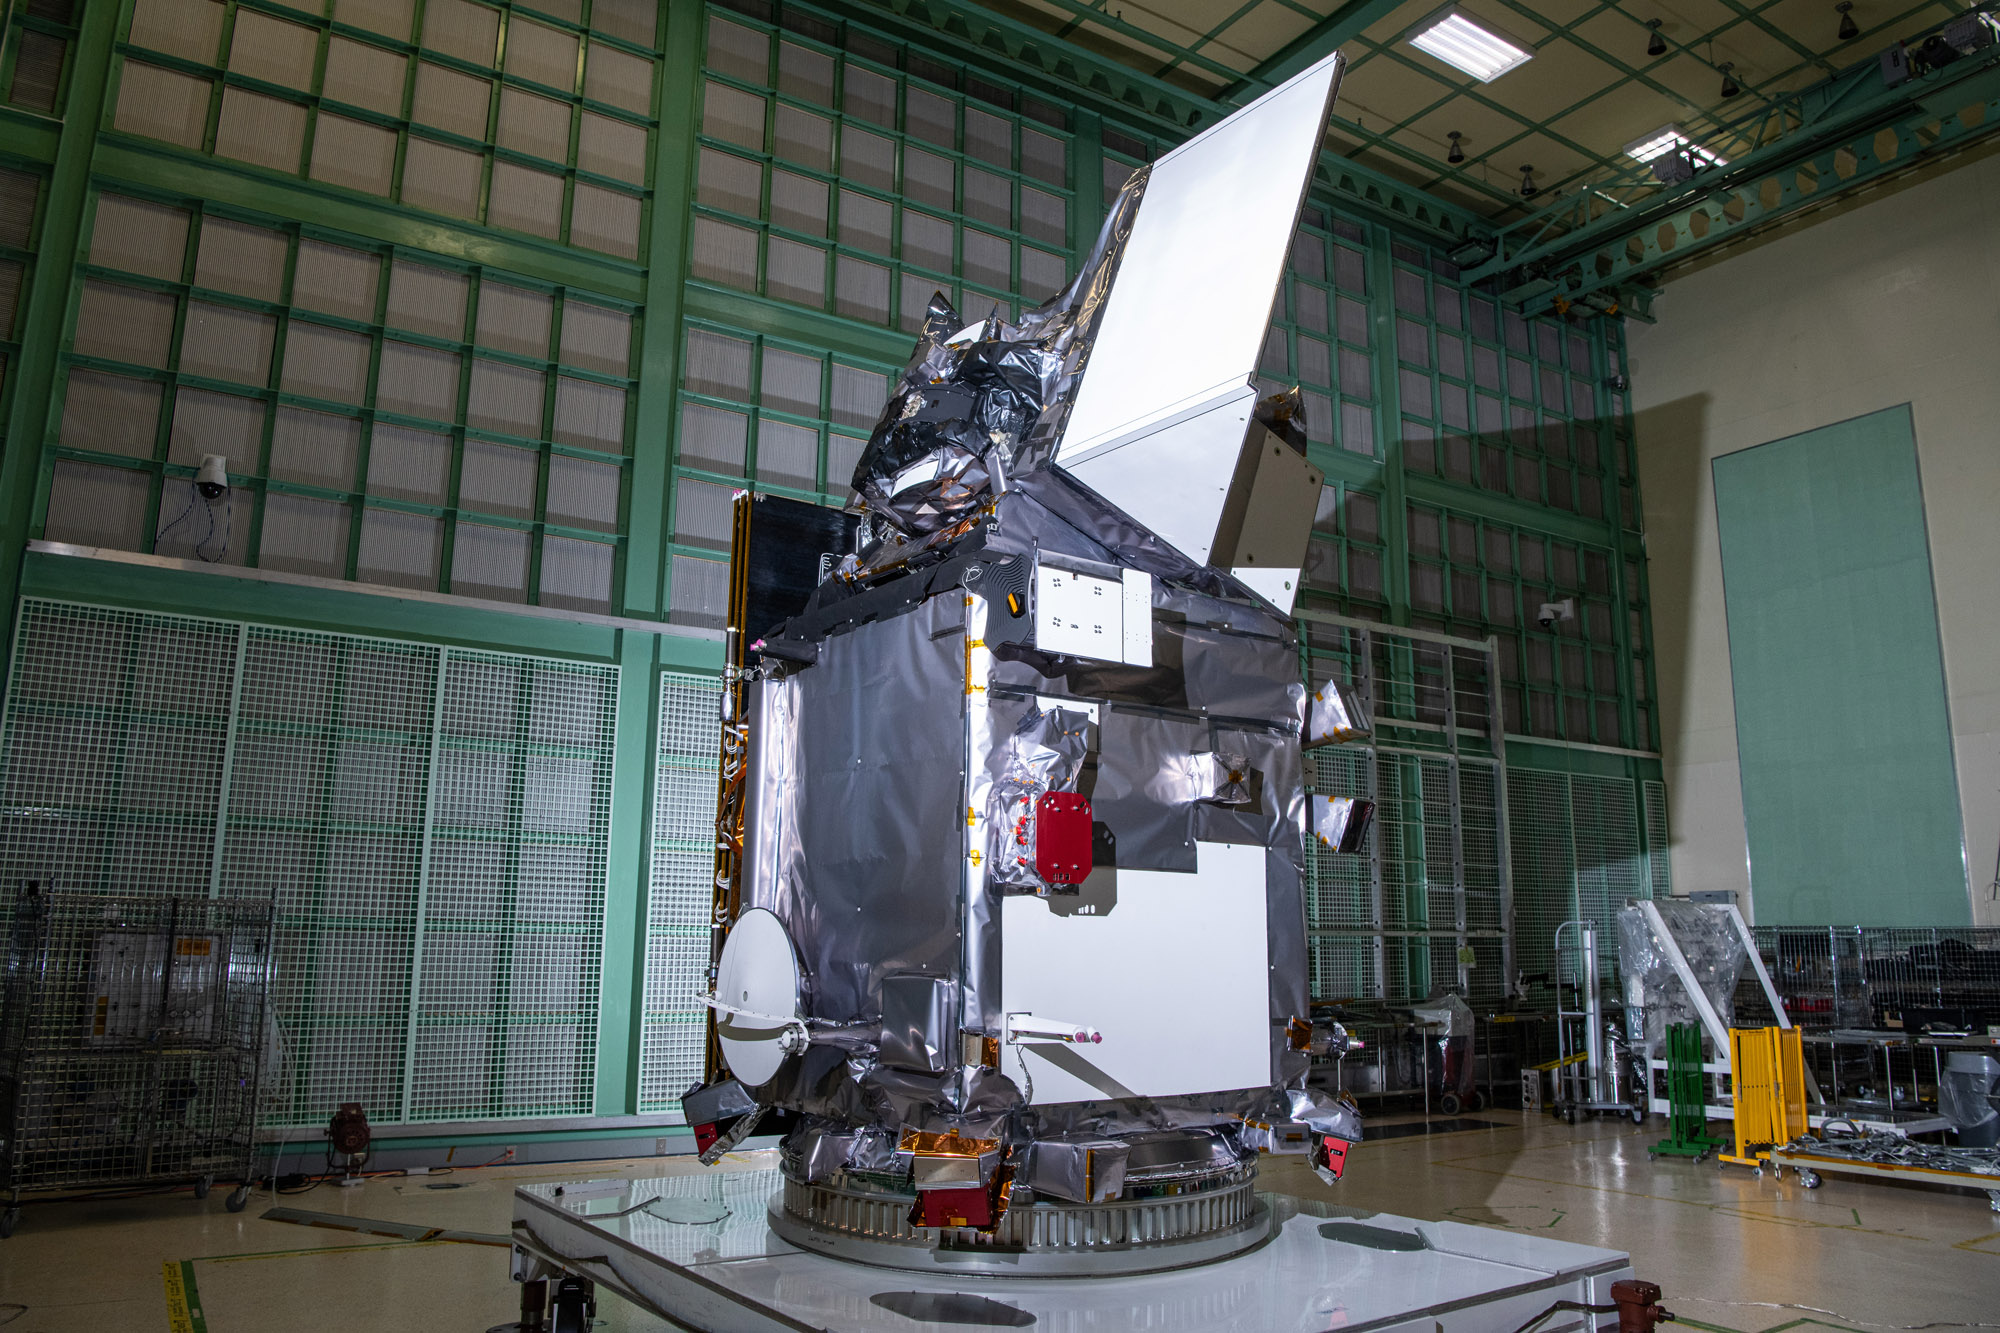
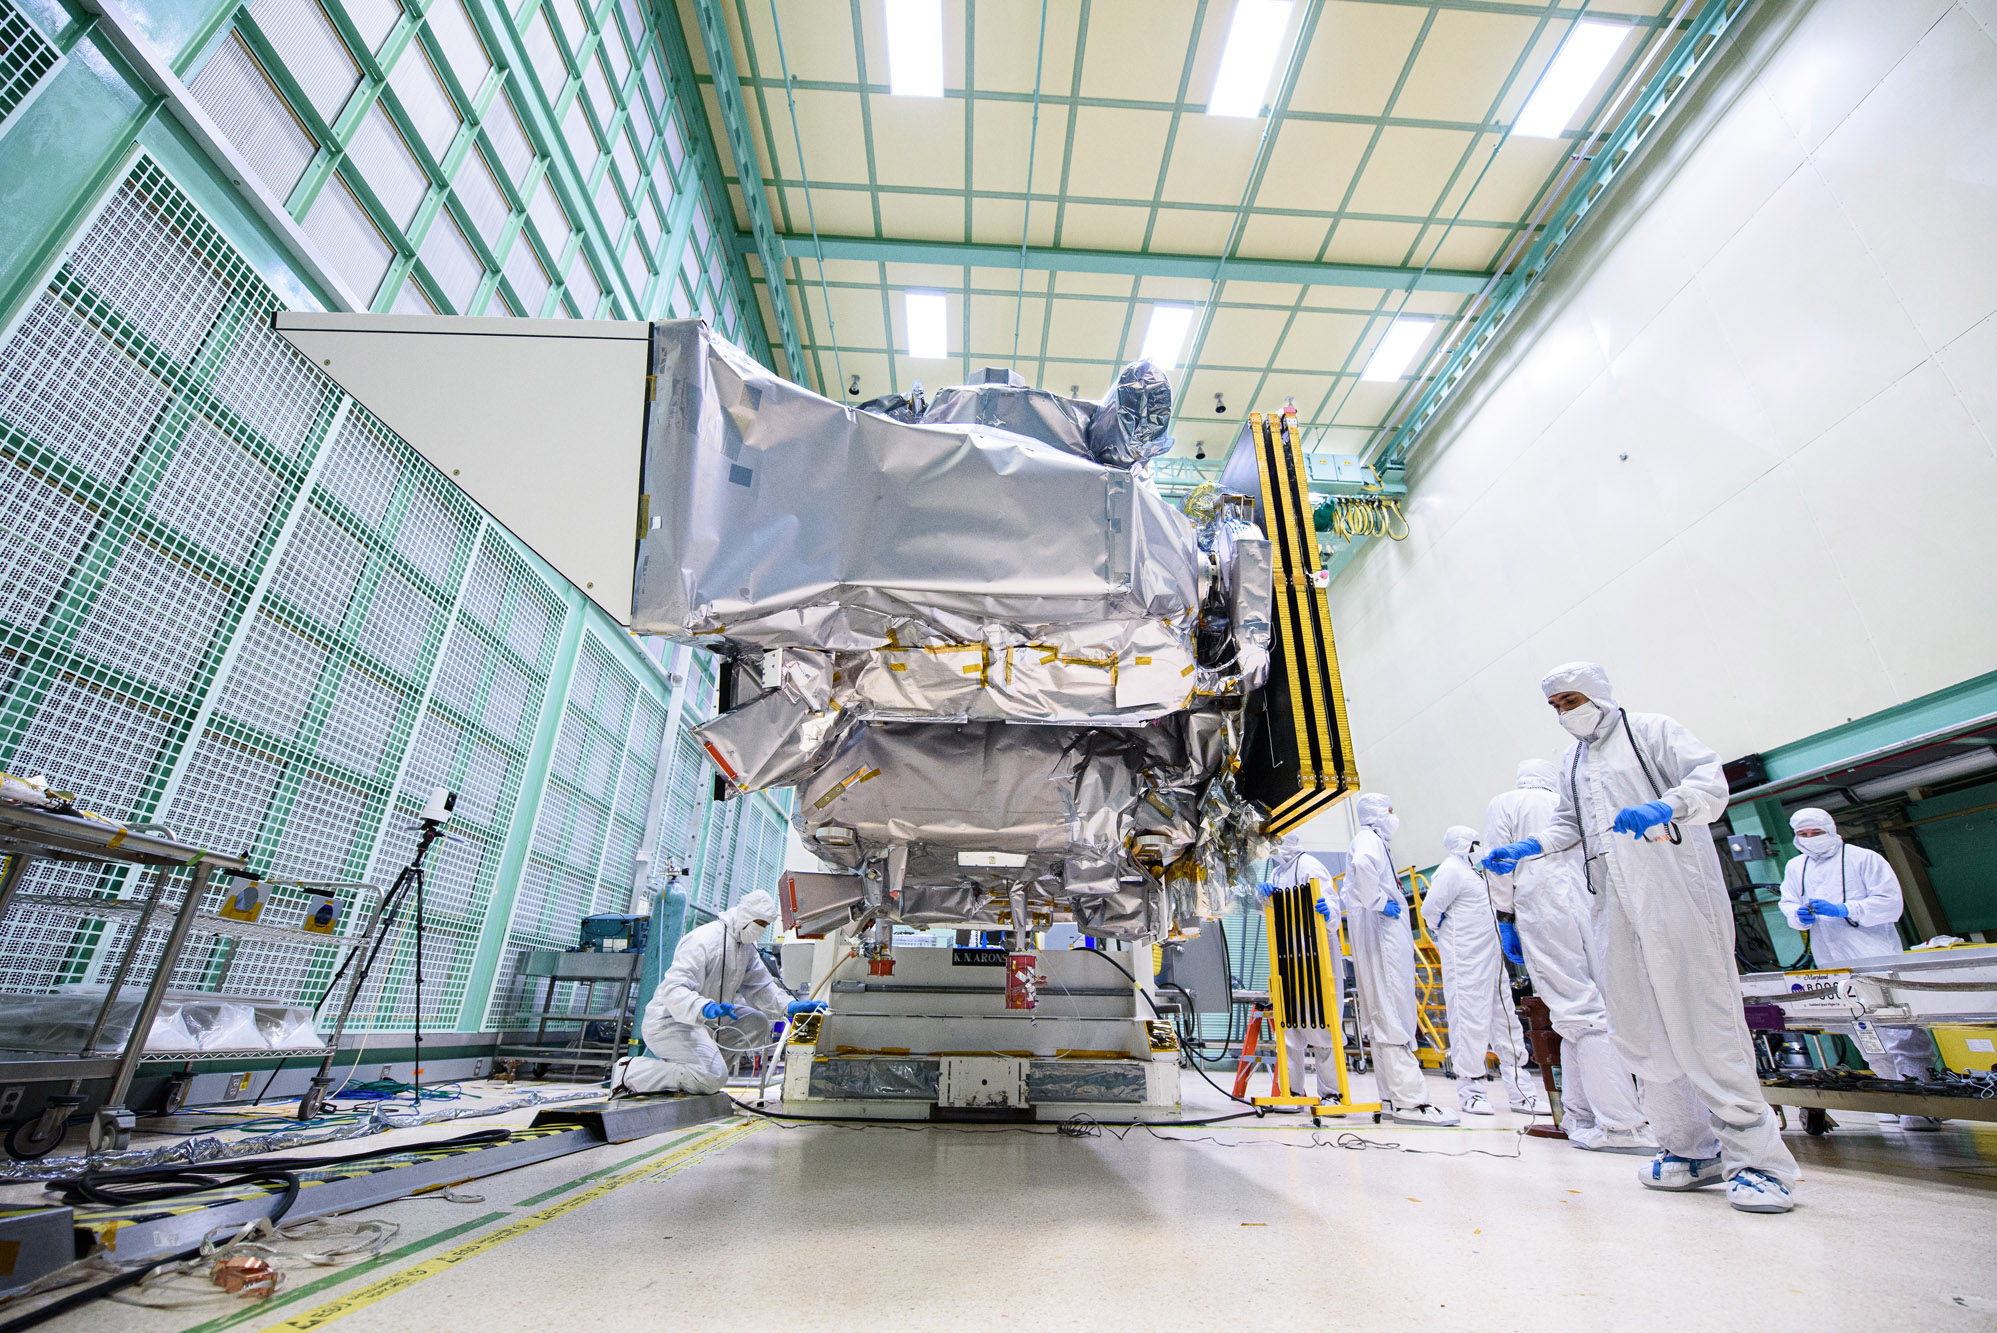
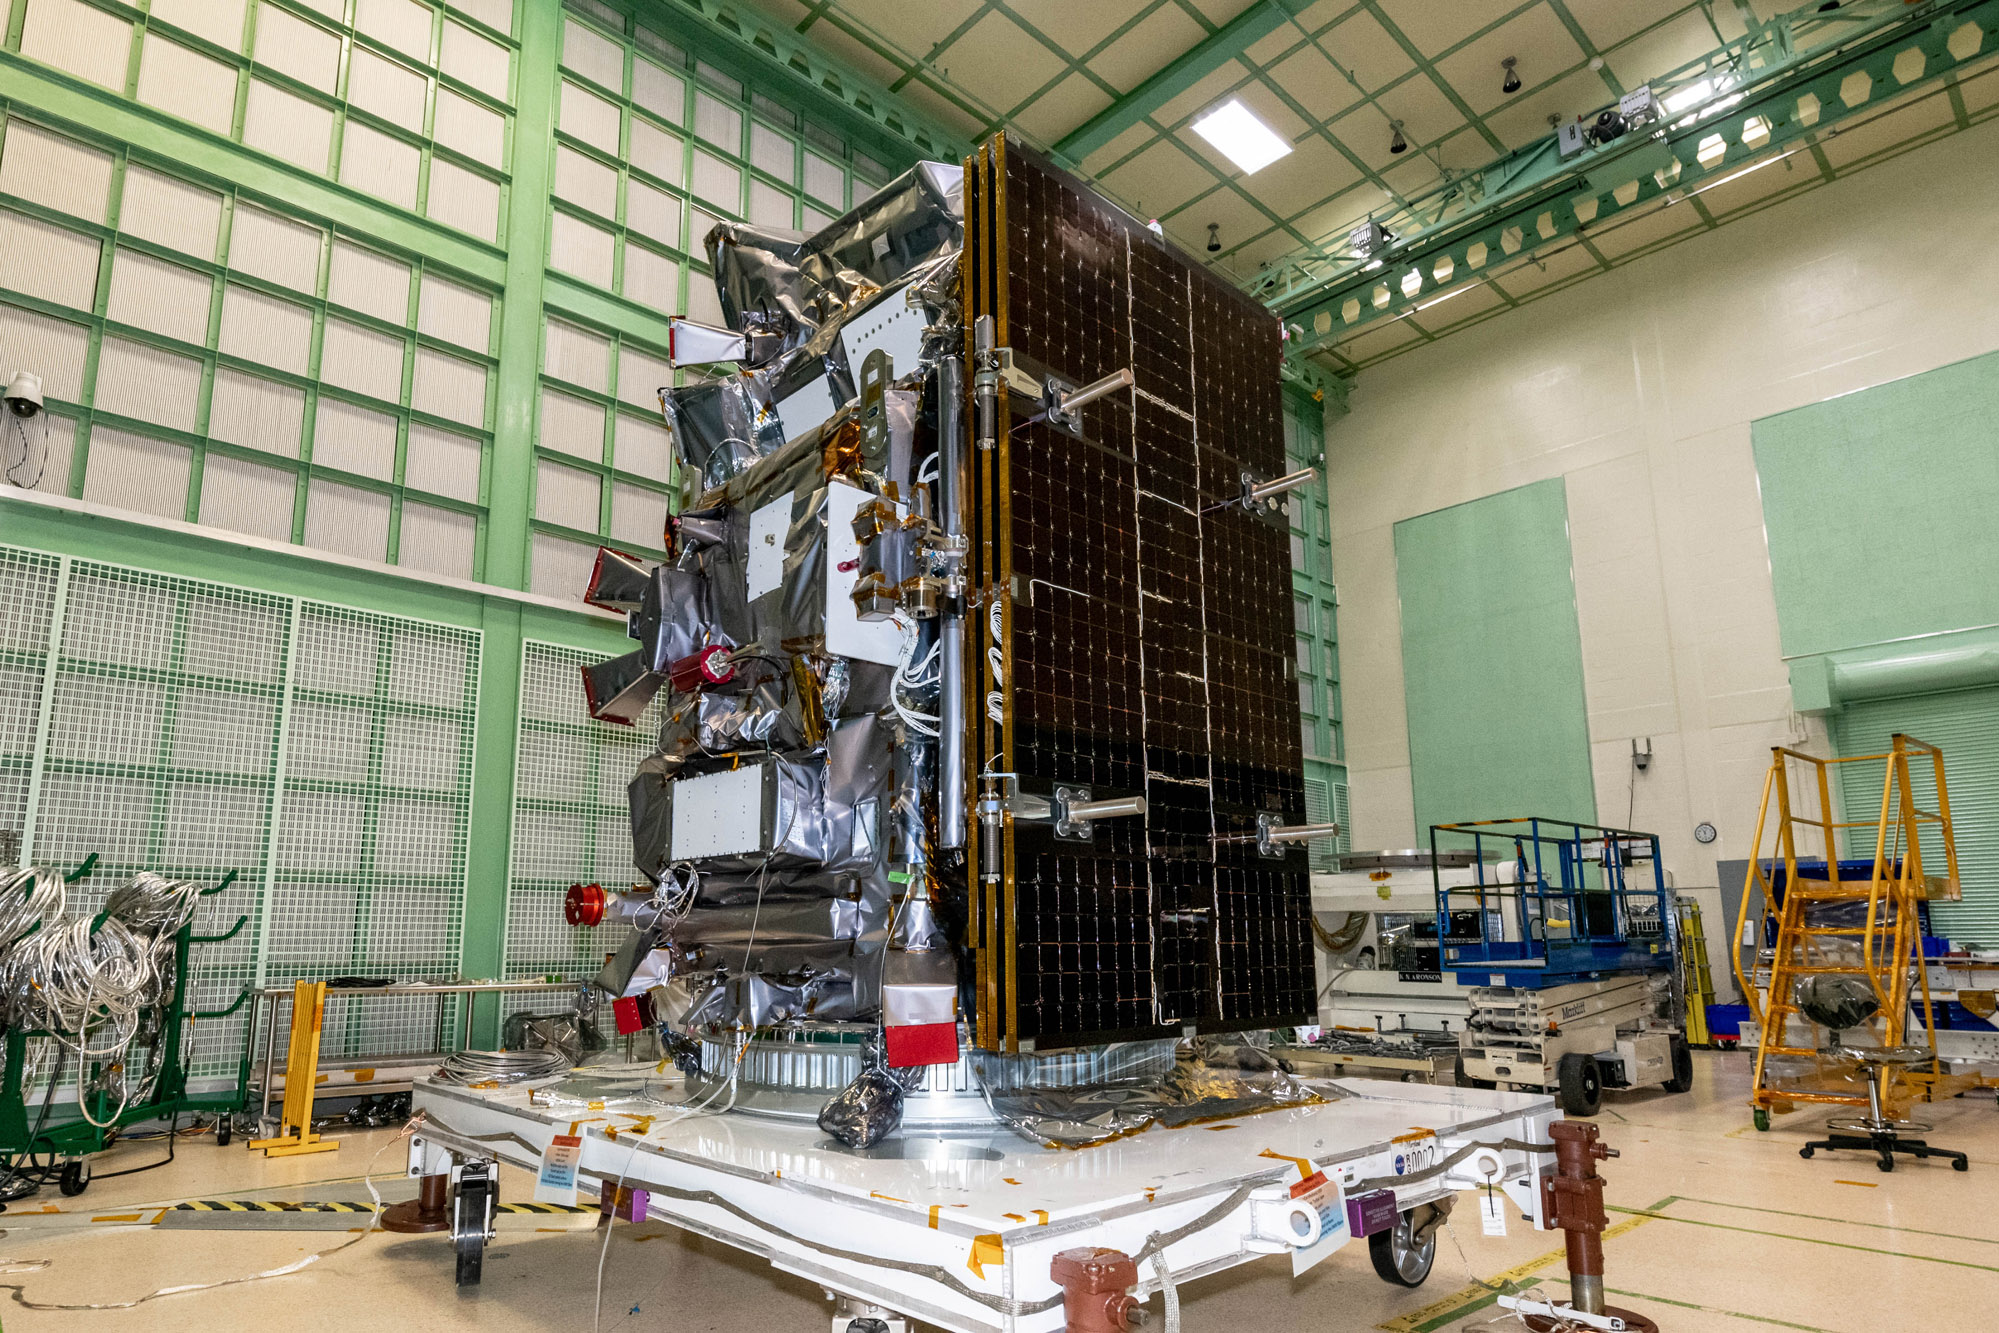
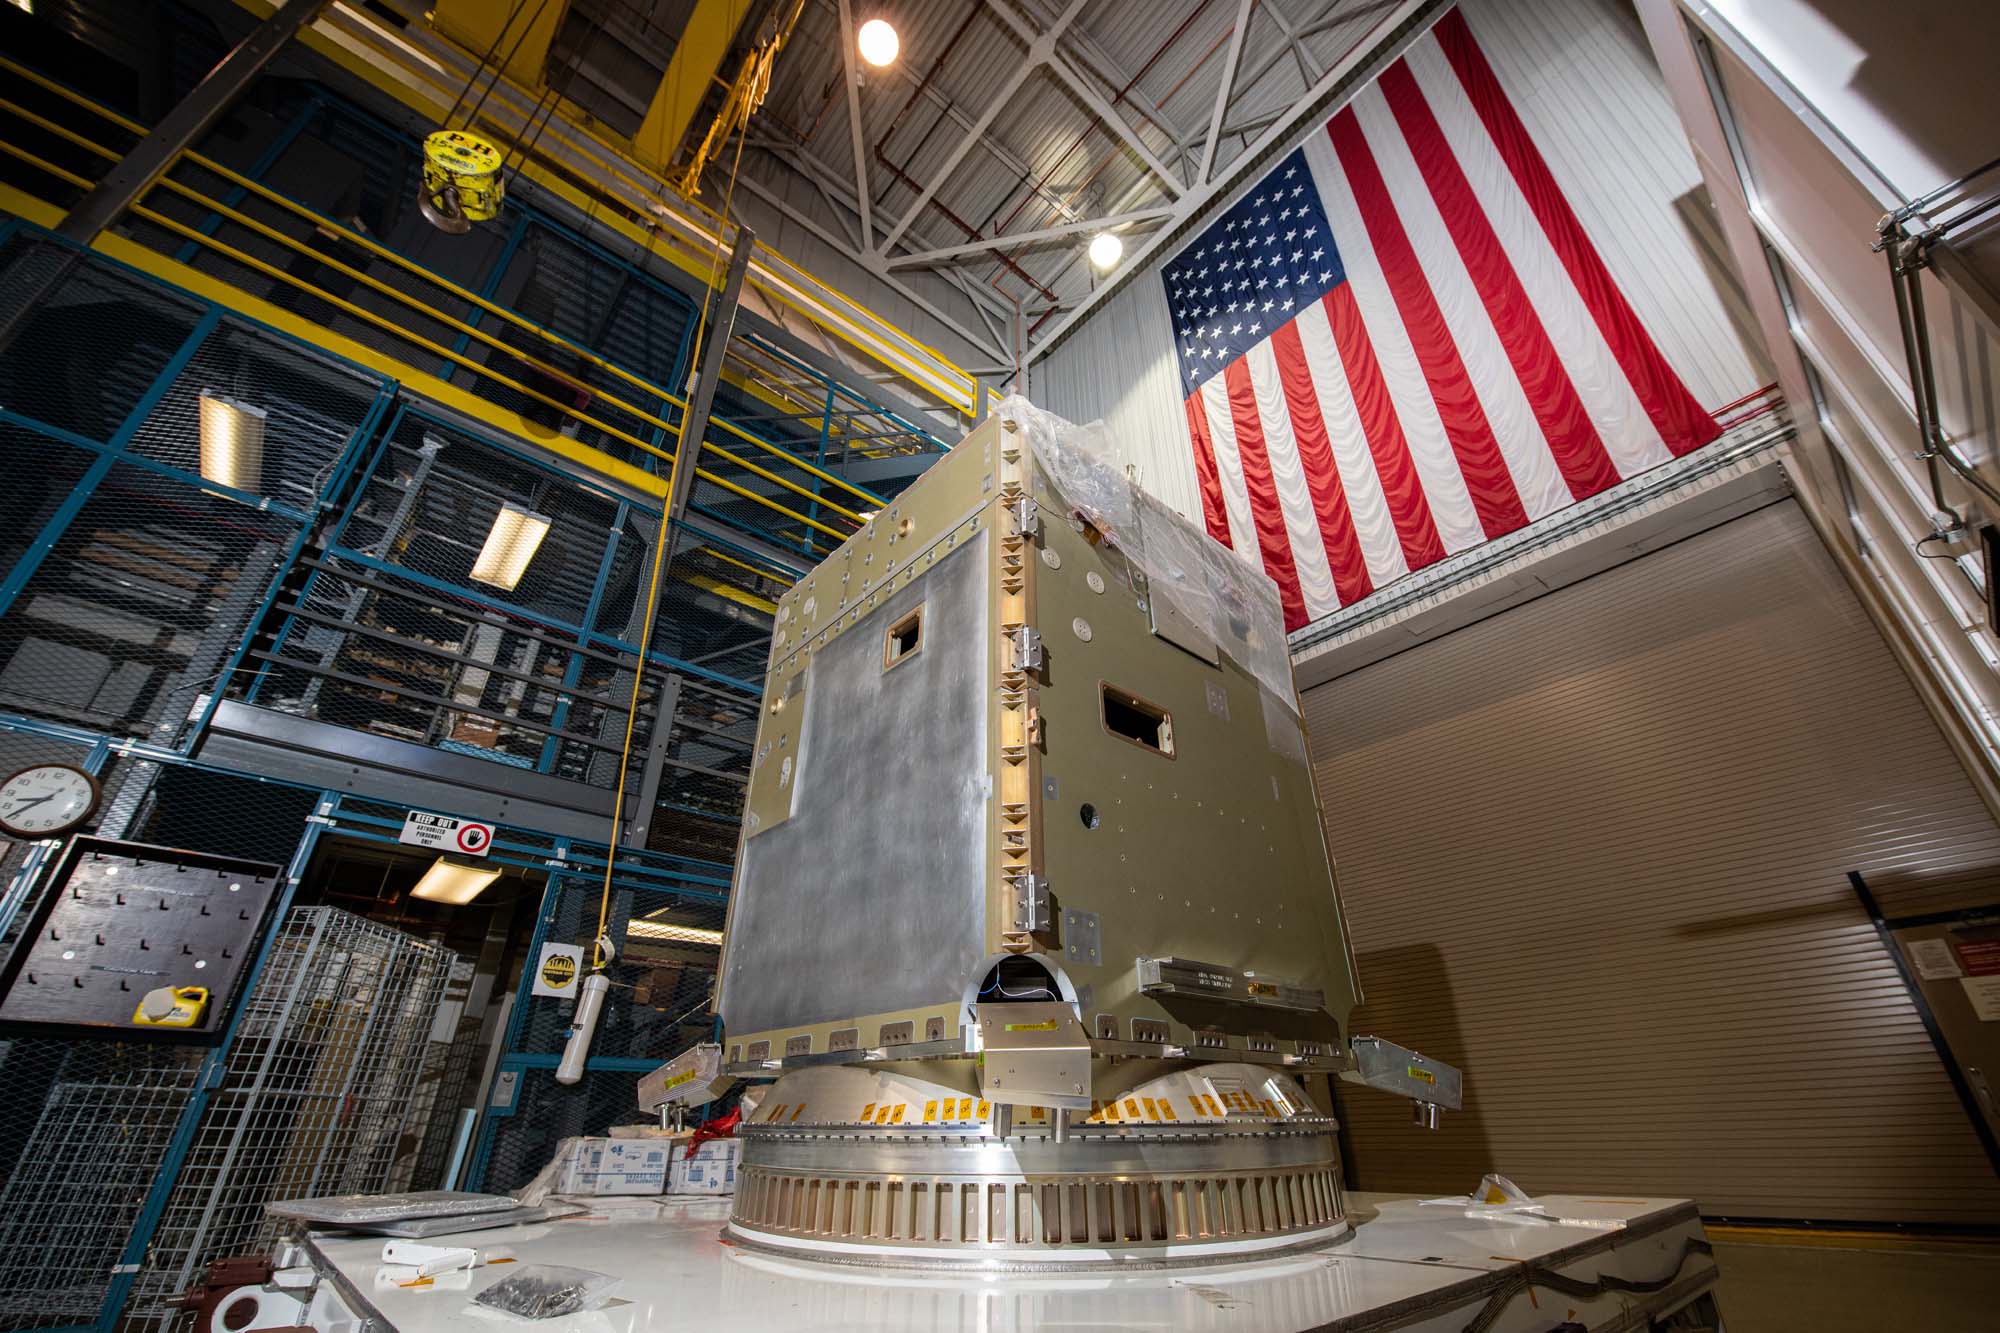
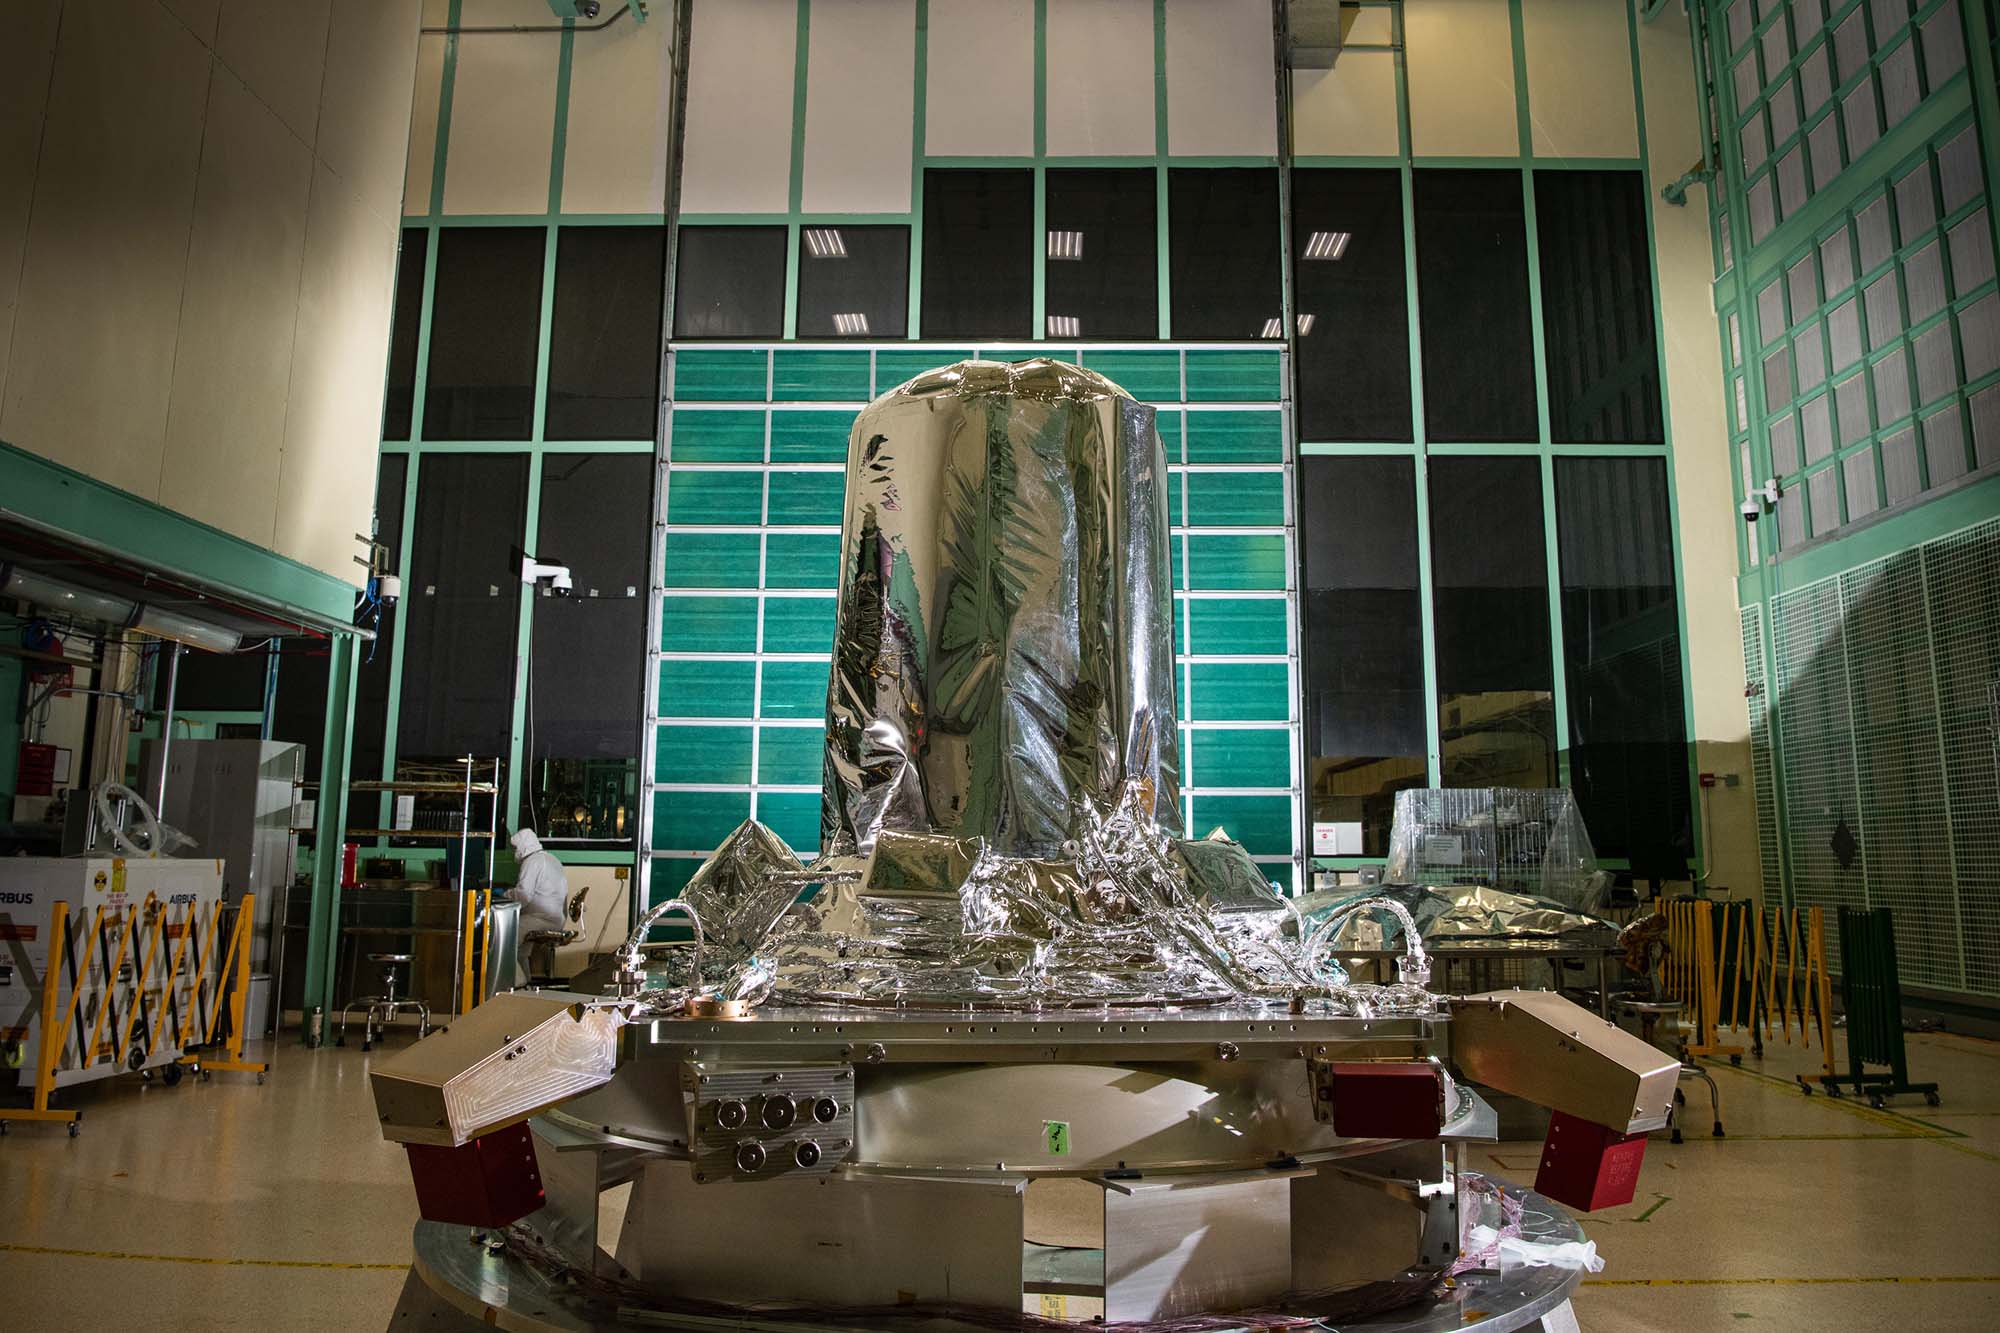
Glamour photo of PACE in the Spacecraft Checkout Area prior to shipment to Astrotech. Credit: NASA
Glamour photo of PACE in the Spacecraft Checkout Area prior to shipment to Astrotech. Credit: NASA
Glamour photo of PACE in the Spacecraft Checkout Area prior to shipment to Astrotech. Credit: NASA
Glamour photo of PACE in the Spacecraft Checkout Area prior to shipment to Astrotech. Credit: NASA
Glamour photo of PACE in the Spacecraft Checkout Area prior to shipment to Astrotech. Credit: NASA
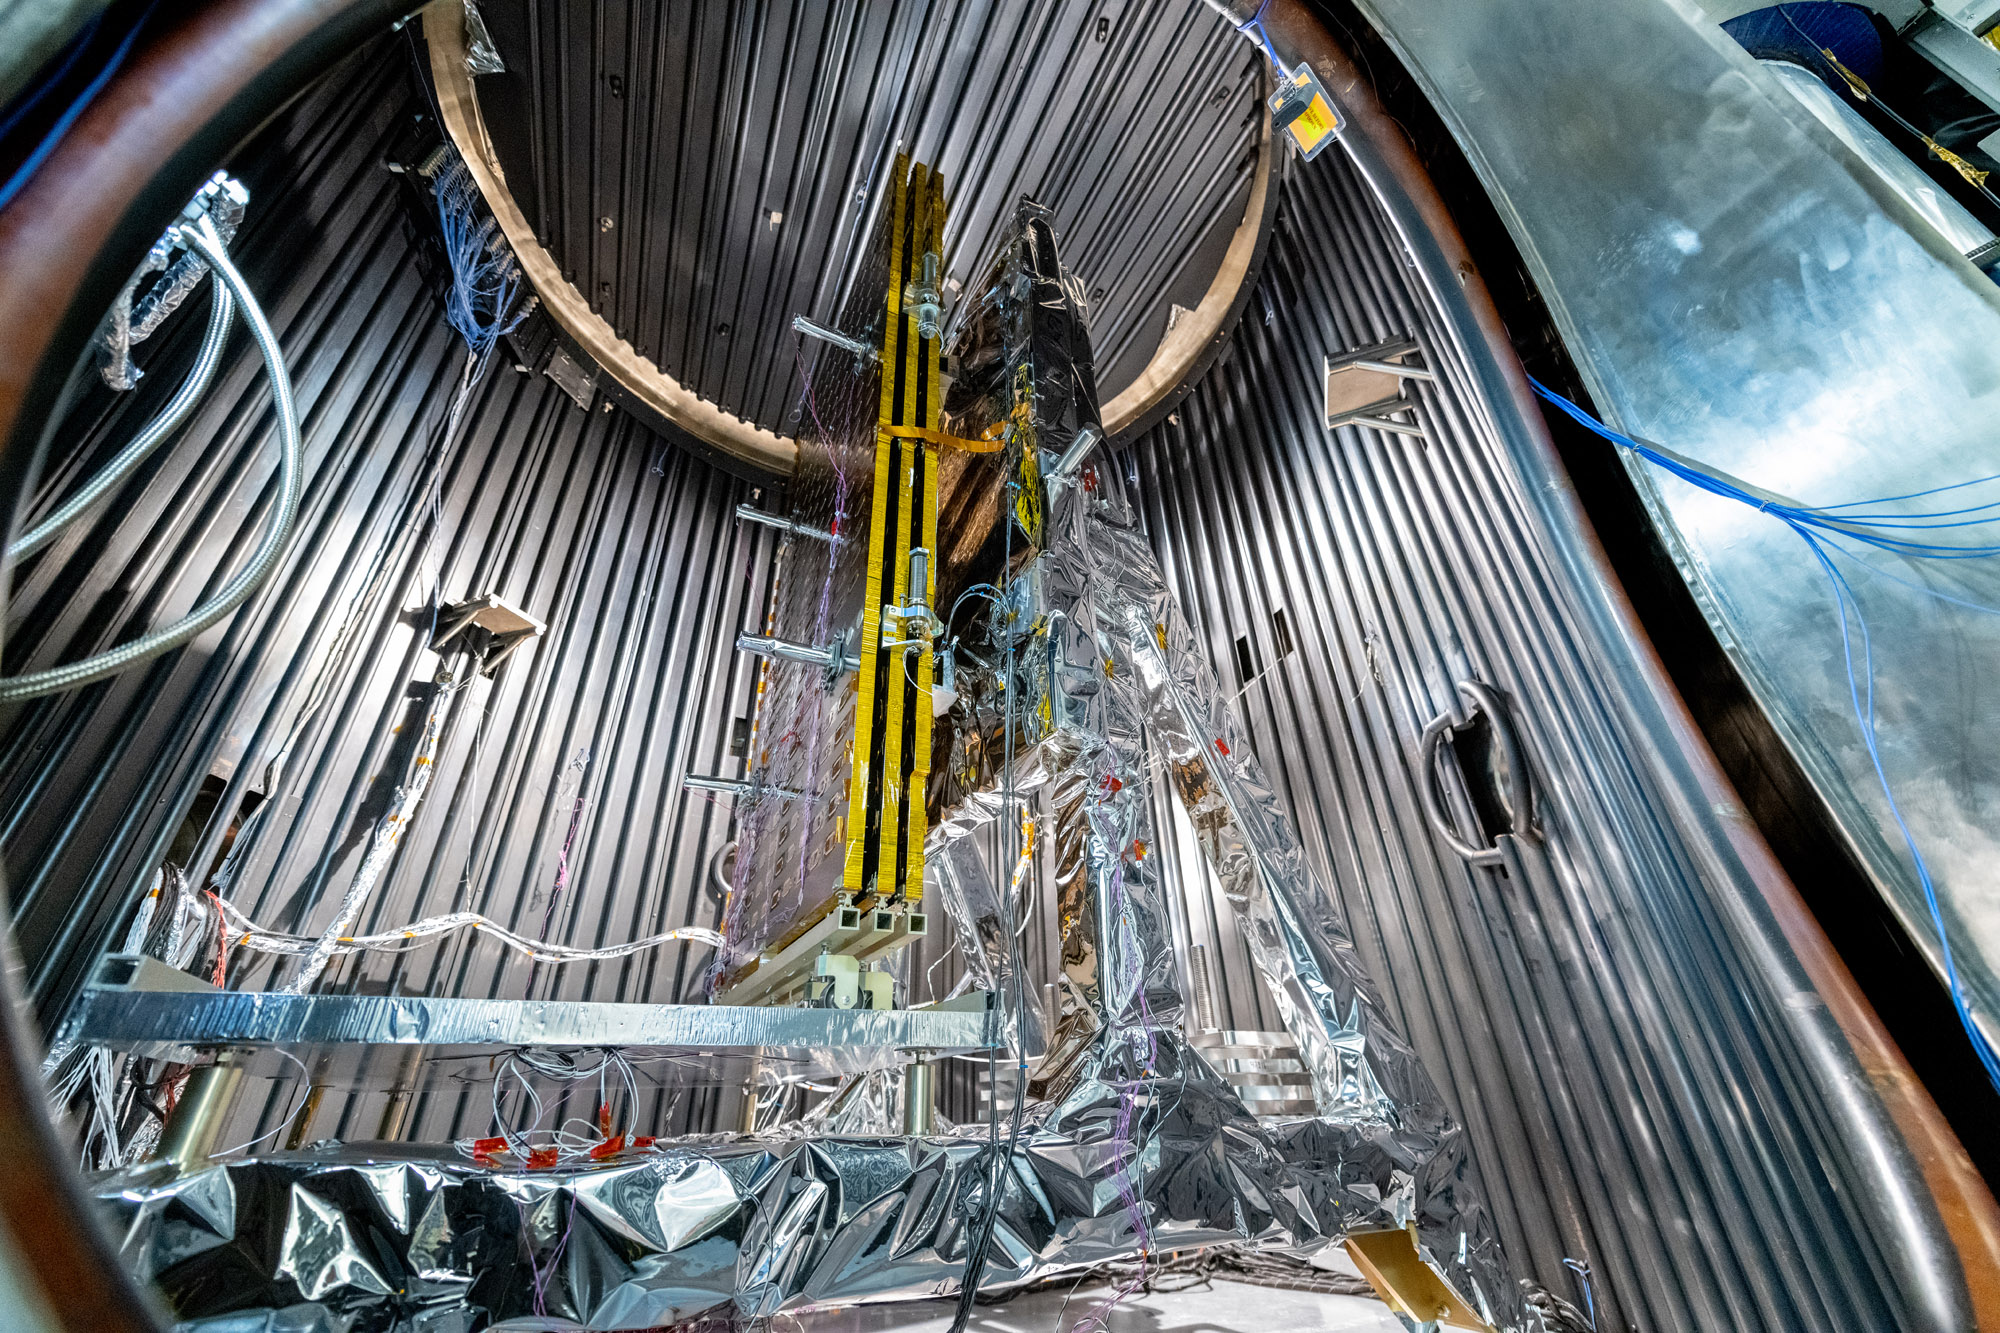
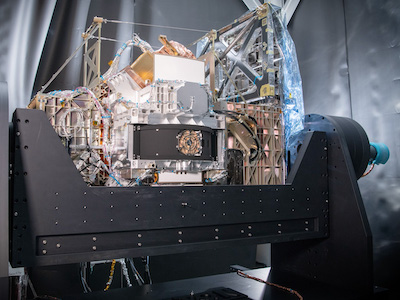
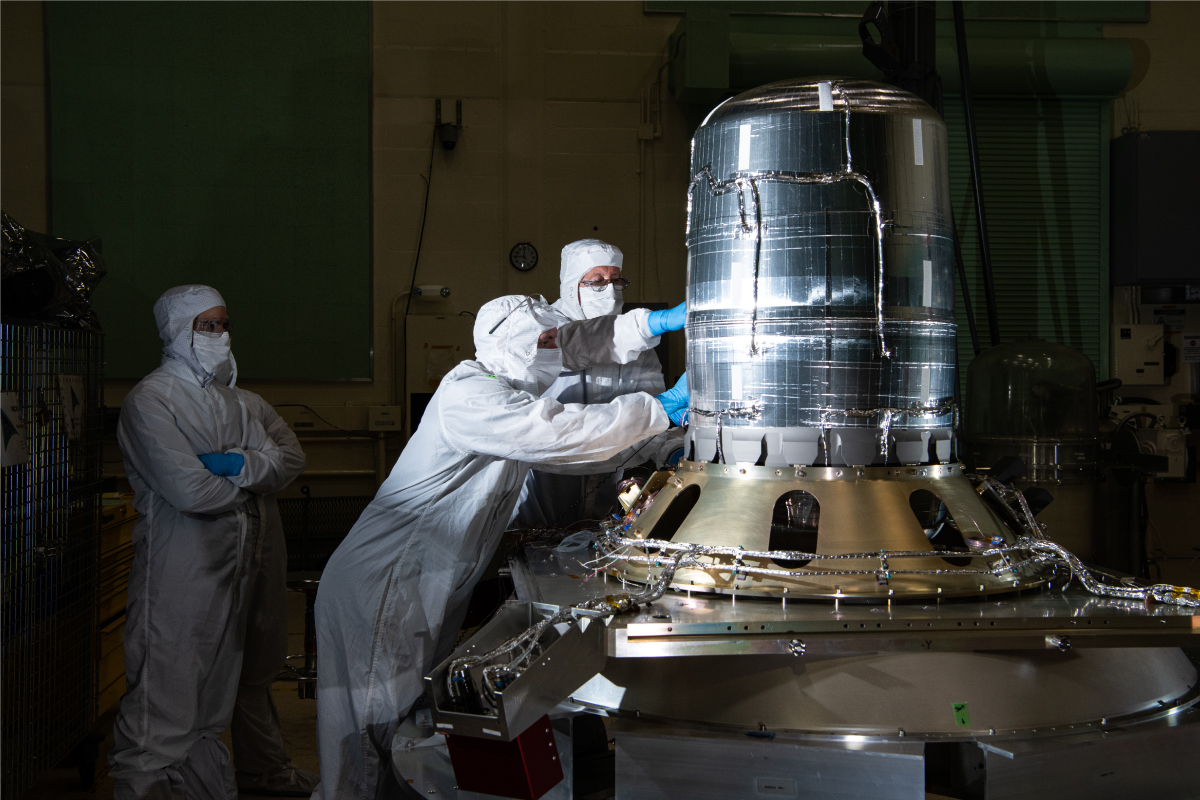
PACE Observatory thermal vacuum testing: Configure for Thermal Vacuum Test (Chamber Break); HARP2 sphere lift. Credit: NASA
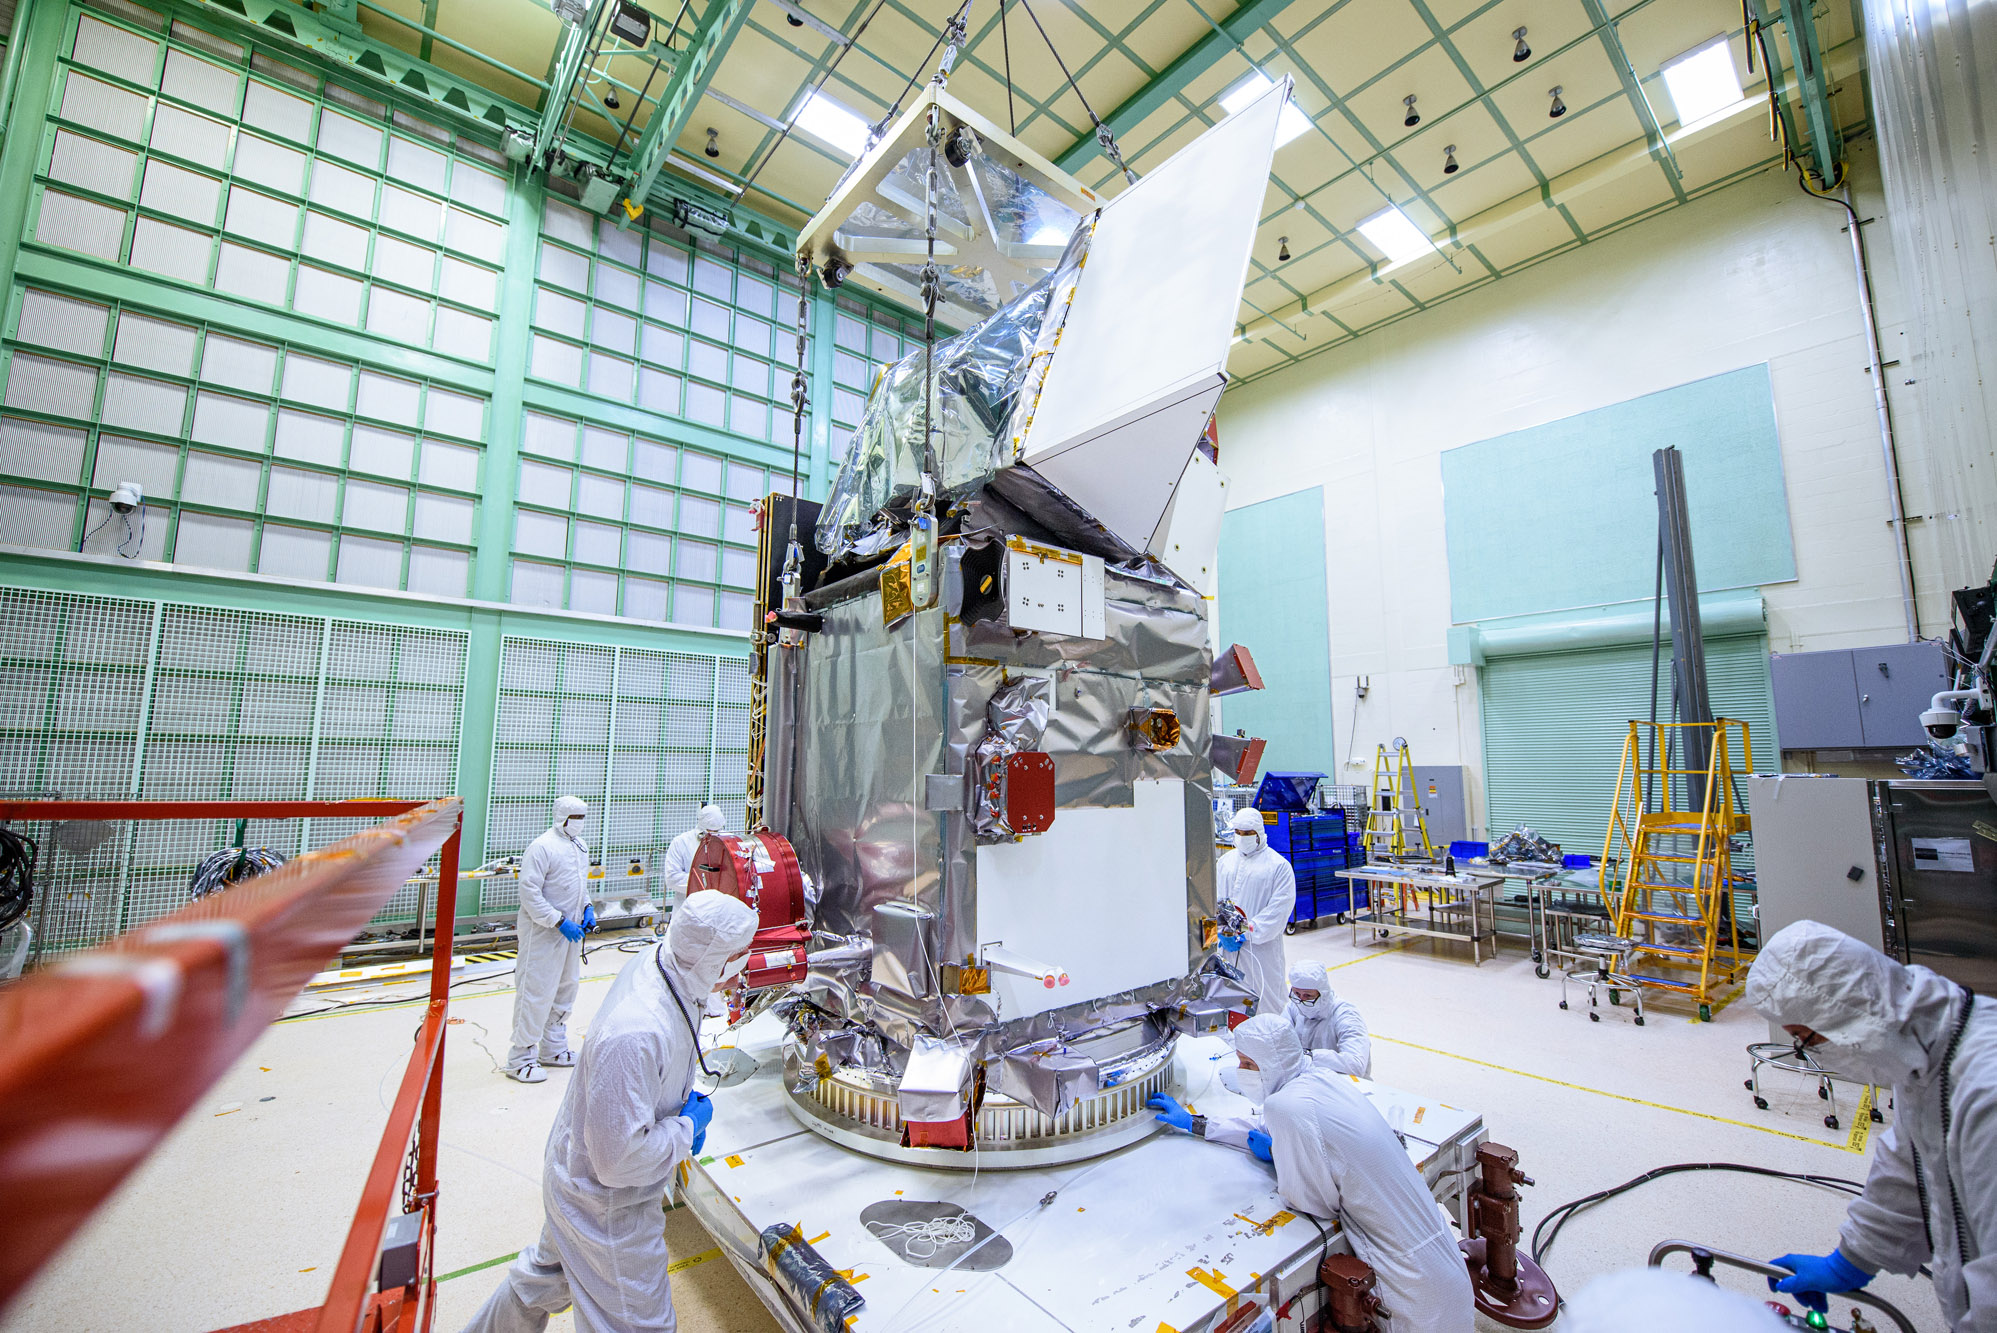
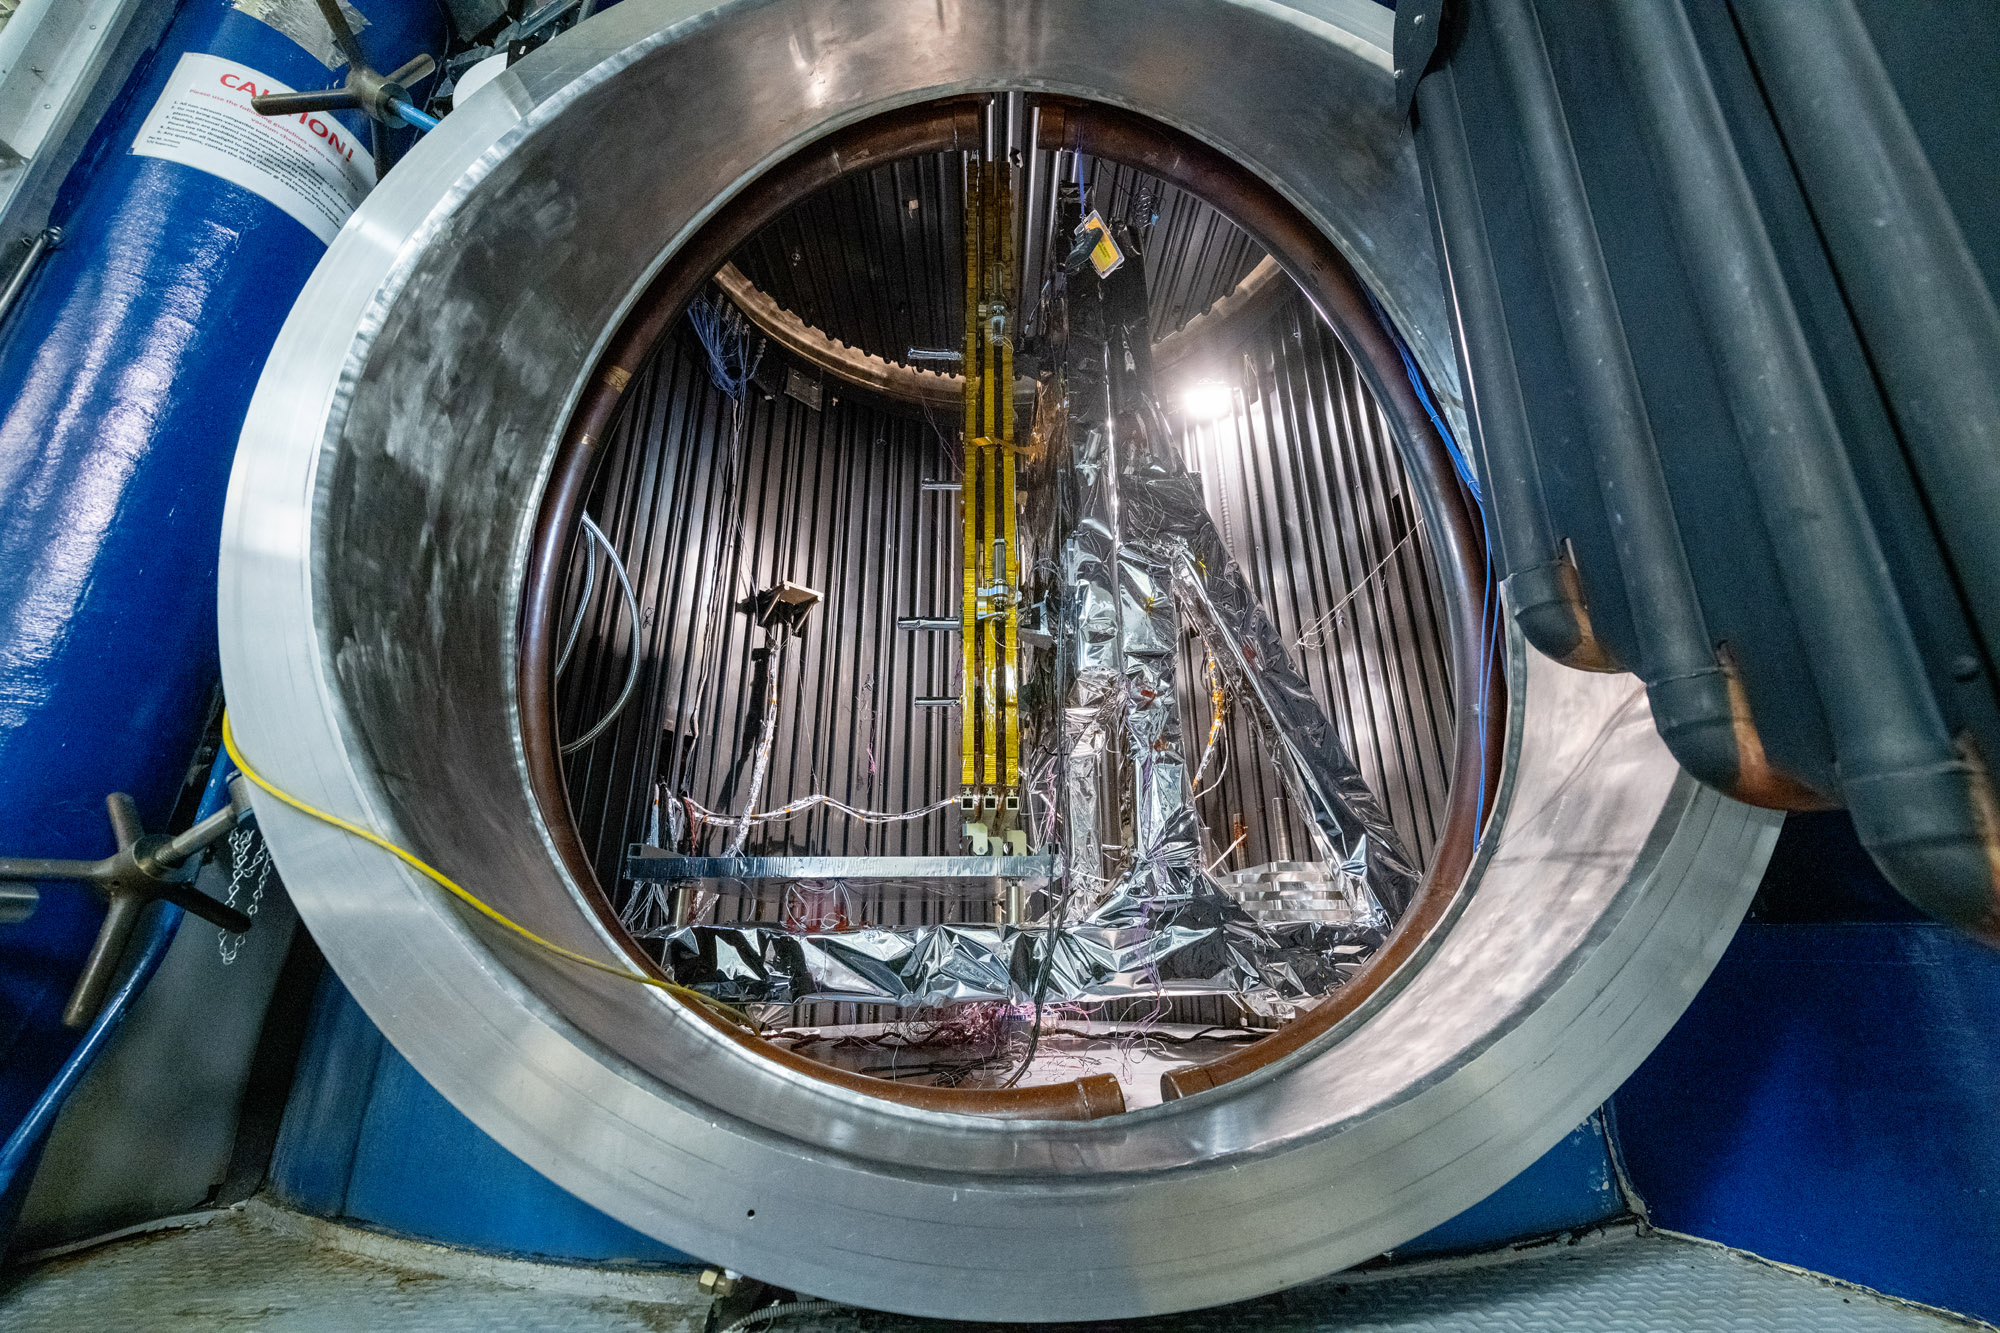
Observatory integration and test: Walkdown Observatory Space Environment Simulator Chamber and Ground Support Equipment Racks Prior to Chamber Closing. Quick overall photo of observatory and setup during prep and walkdown. Credit: NASA
Observatory integration and test: Walkdown Observatory Space Environment Simulator Chamber and Ground Support Equipment Racks Prior to Chamber Closing. Credit: NASA
Observatory integration and test: Walkdown Observatory Space Environment Simulator Chamber and Ground Support Equipment Racks Prior to Chamber Closing. Credit: NASA
Observatory integration and test: Walkdown Observatory Space Environment Simulator Chamber and Ground Support Equipment Racks Prior to Chamber Closing. Credit: NASA
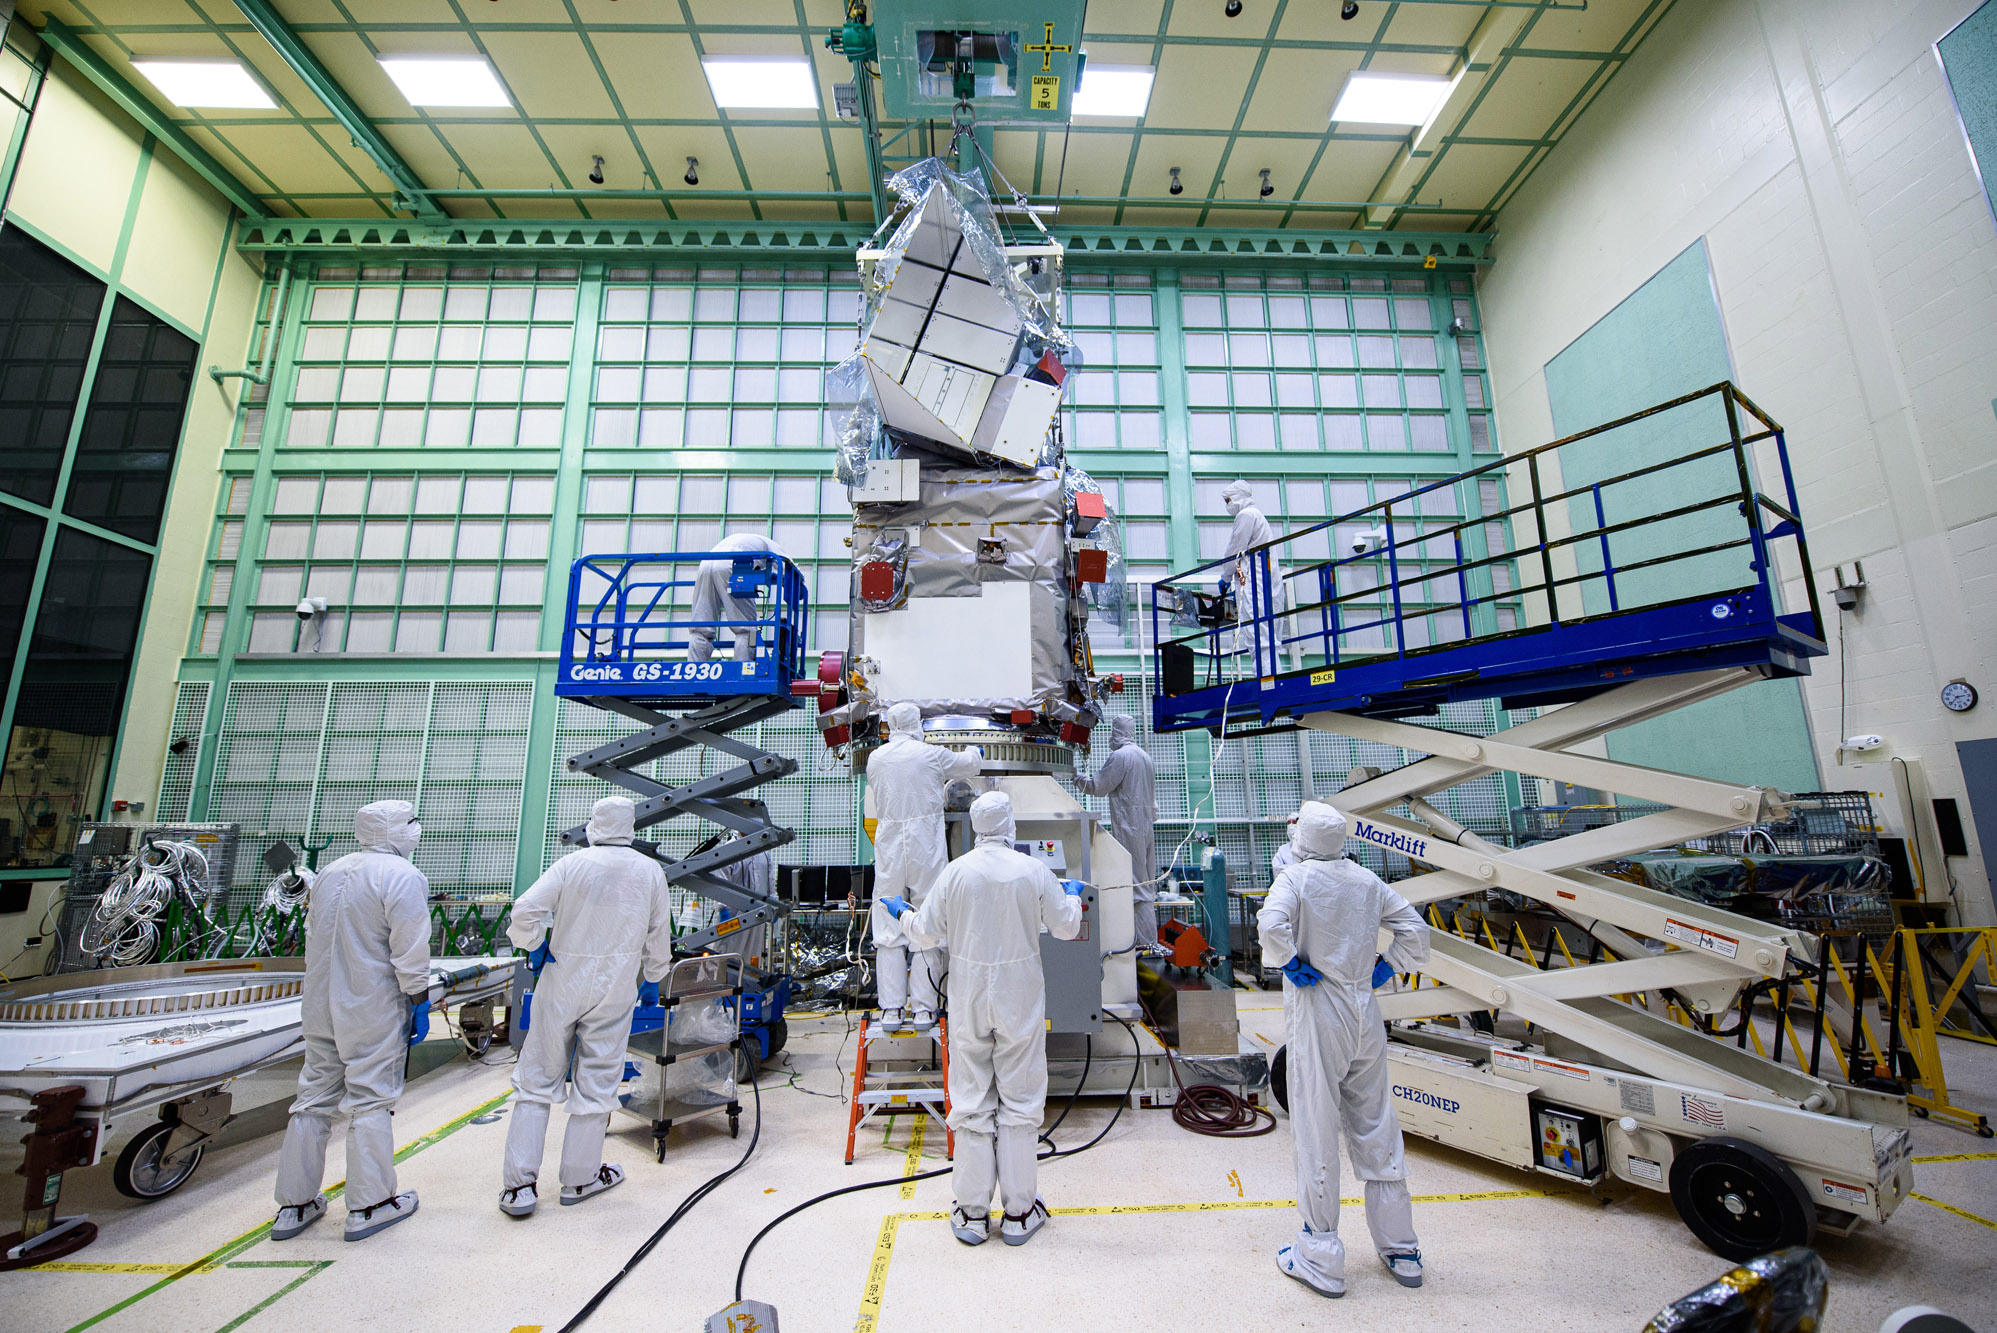
Stage the Observatory outside the Space Environment Simulator Chamber 290; Move Observatory to the Chamber for testing. Credit: NASA
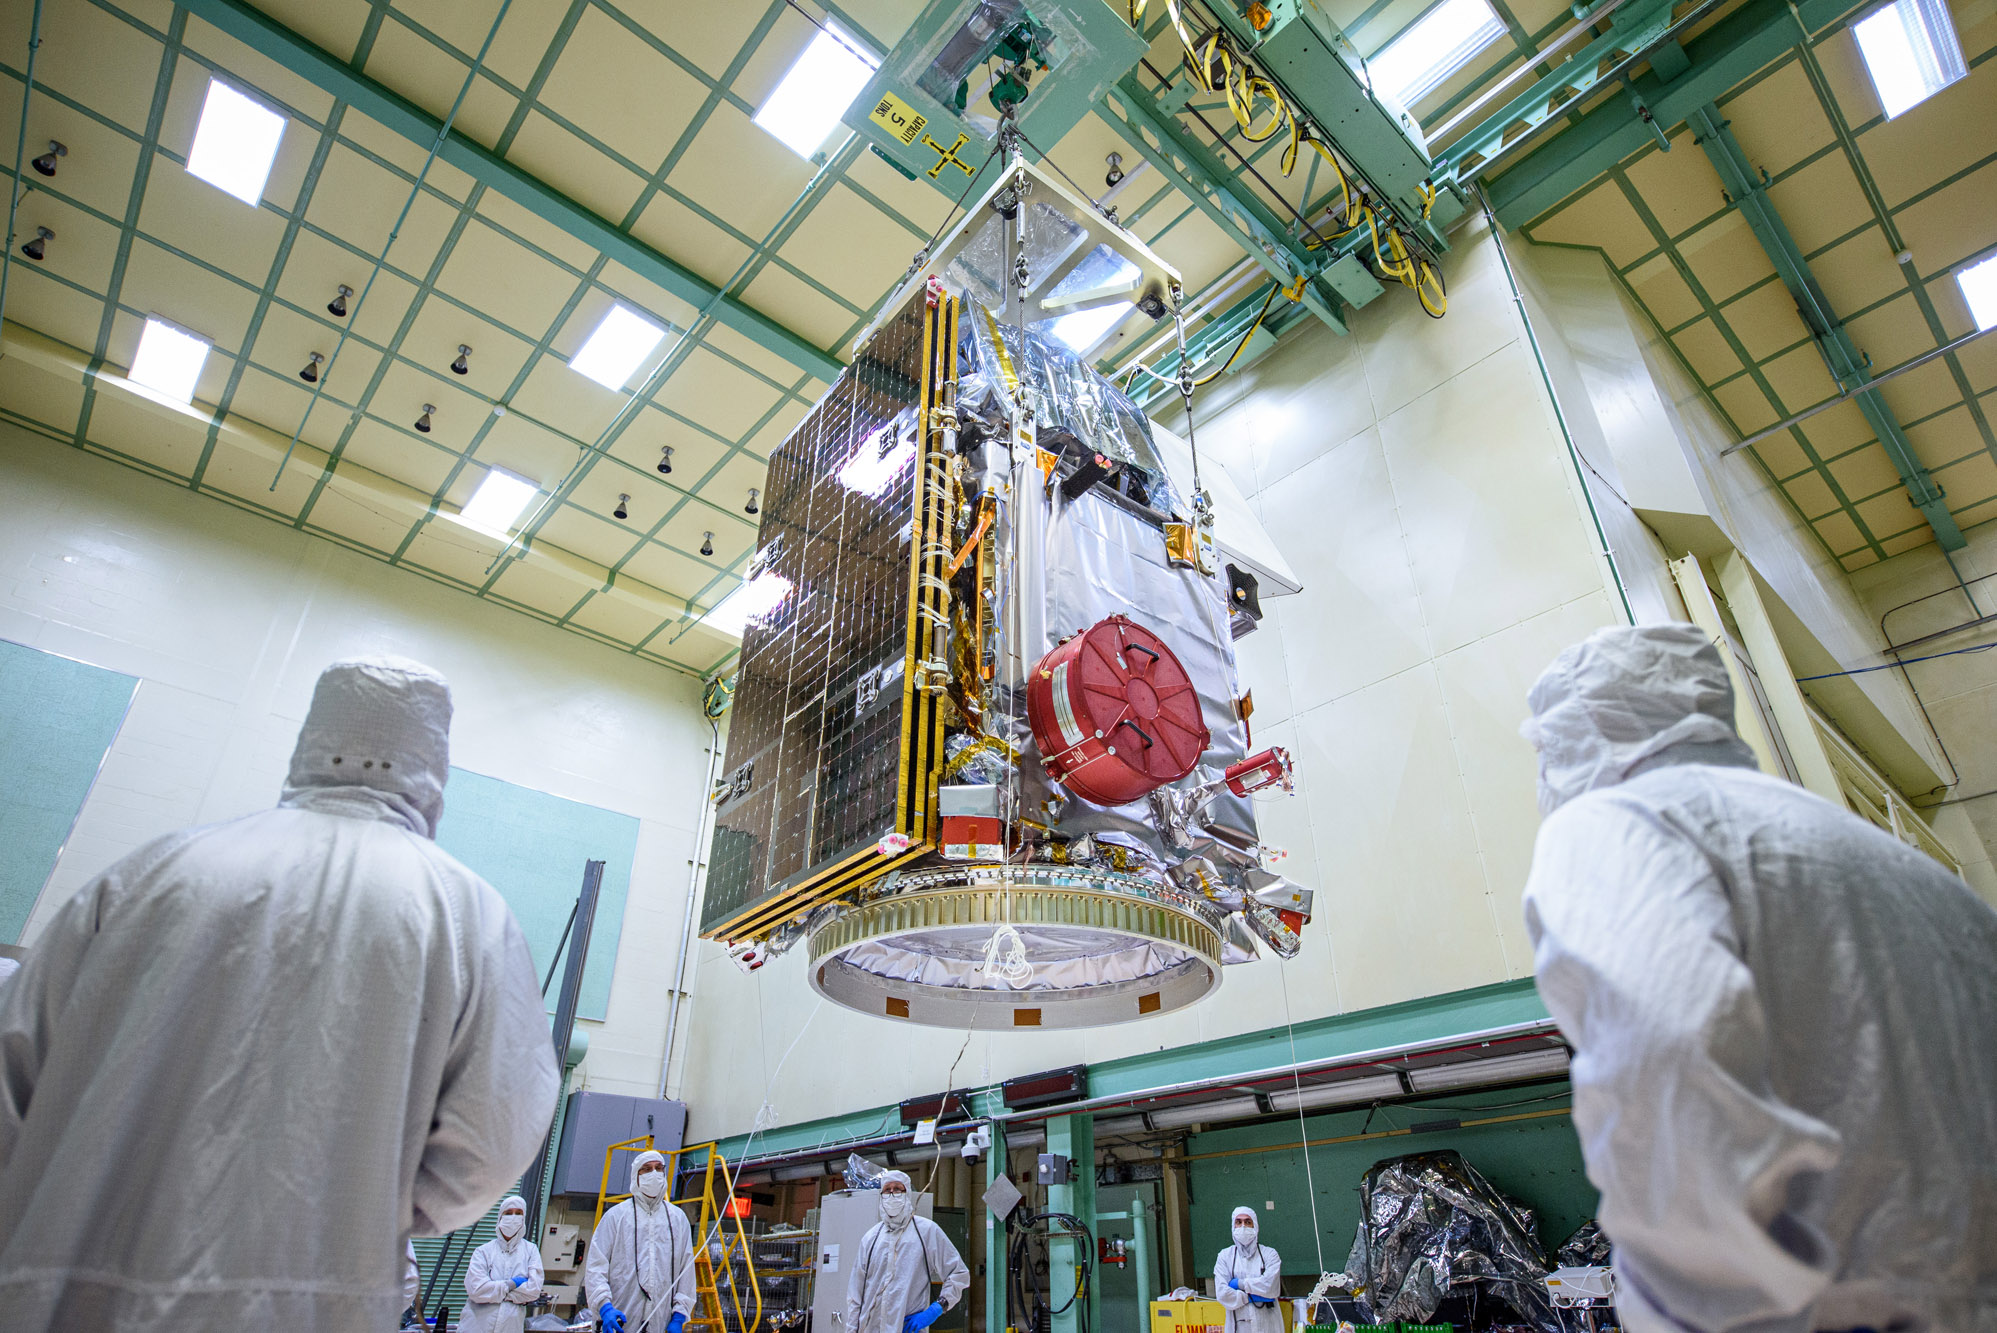
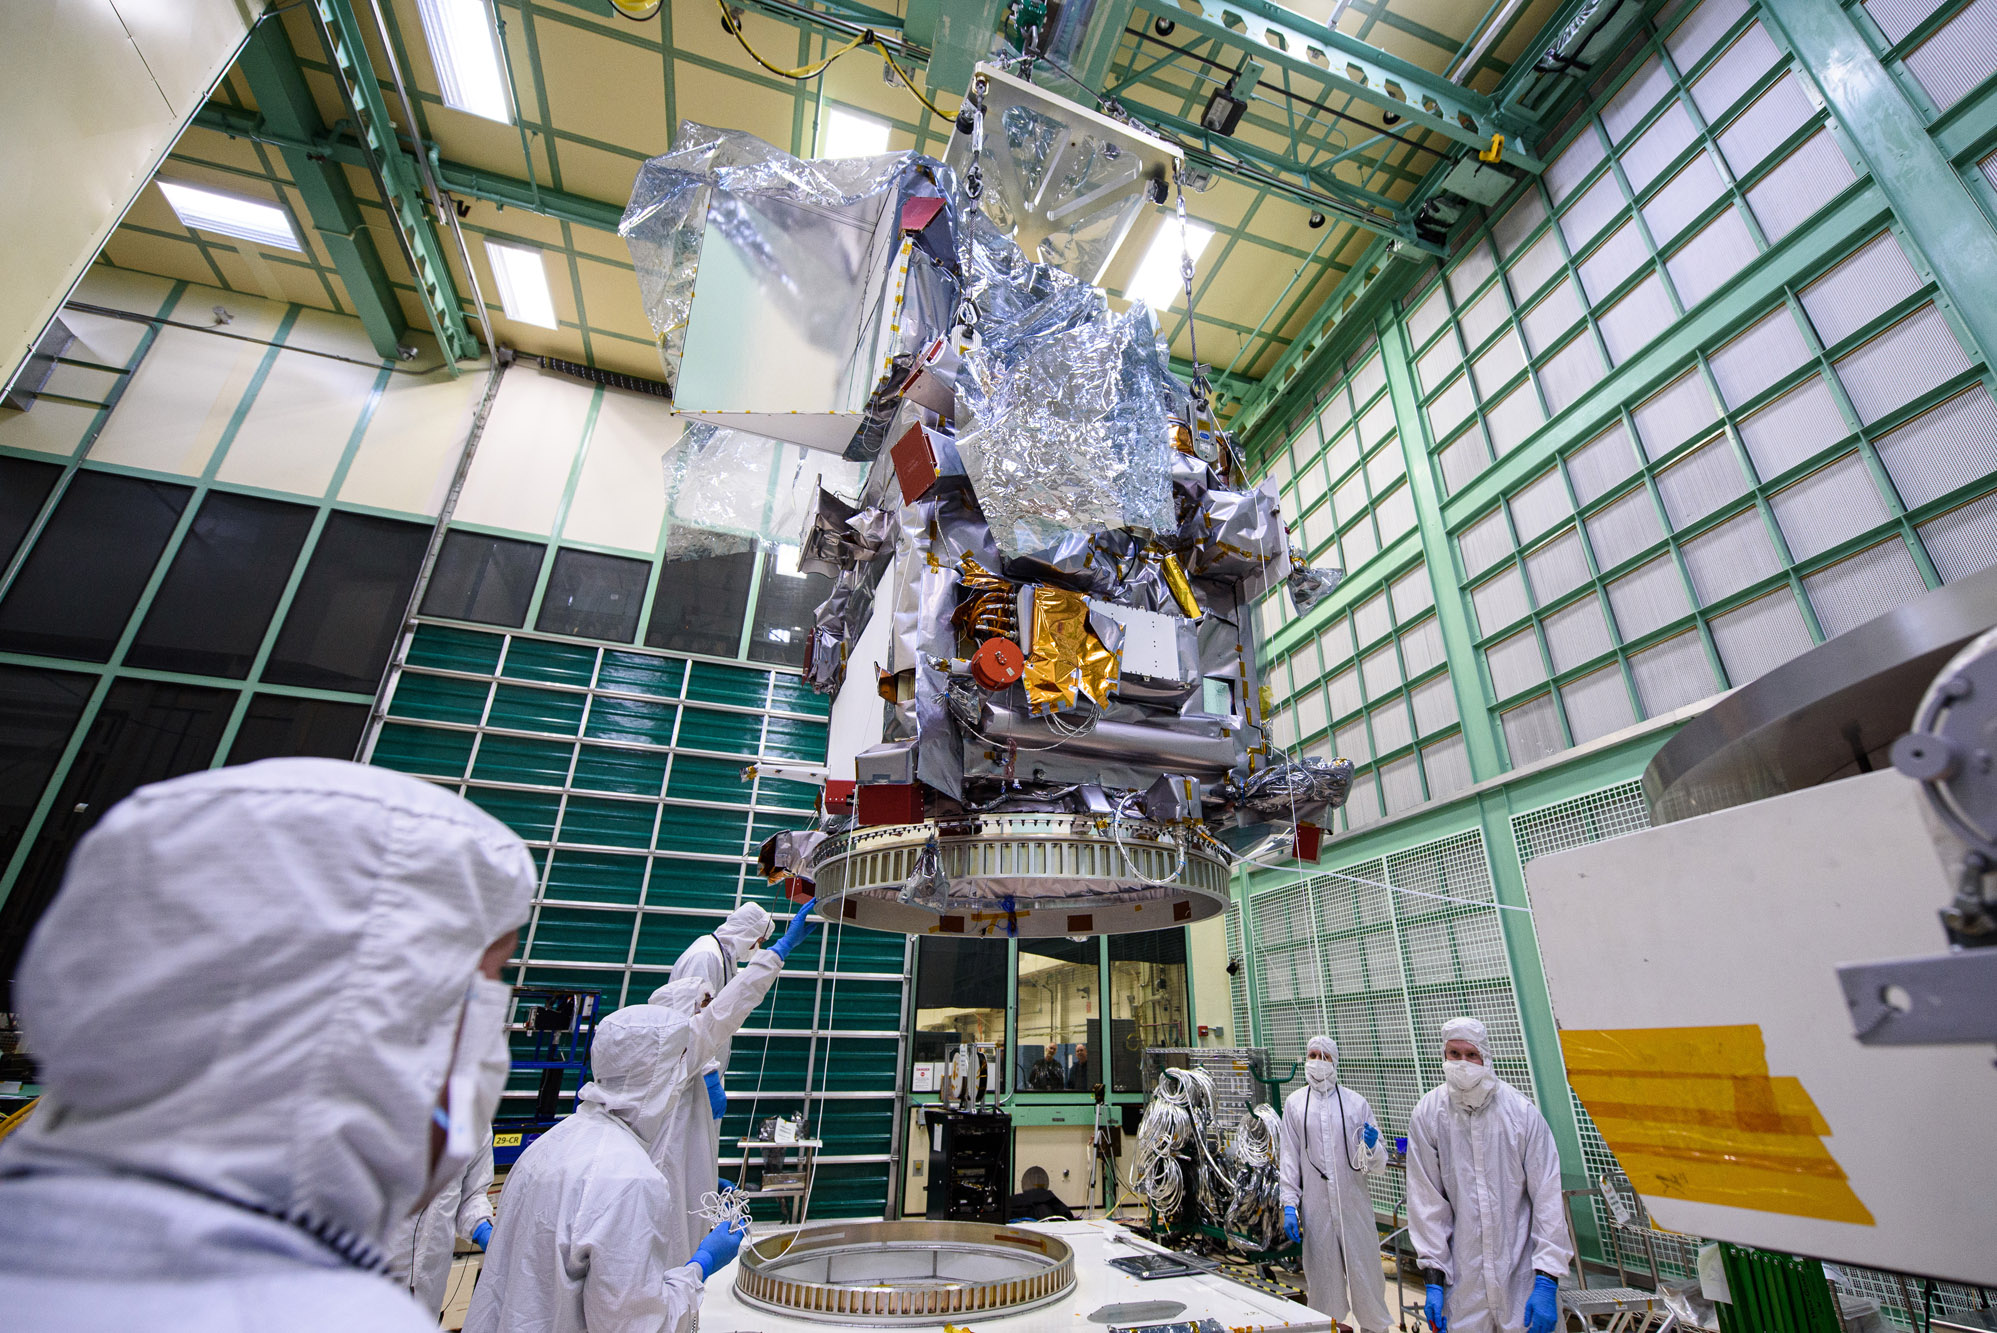
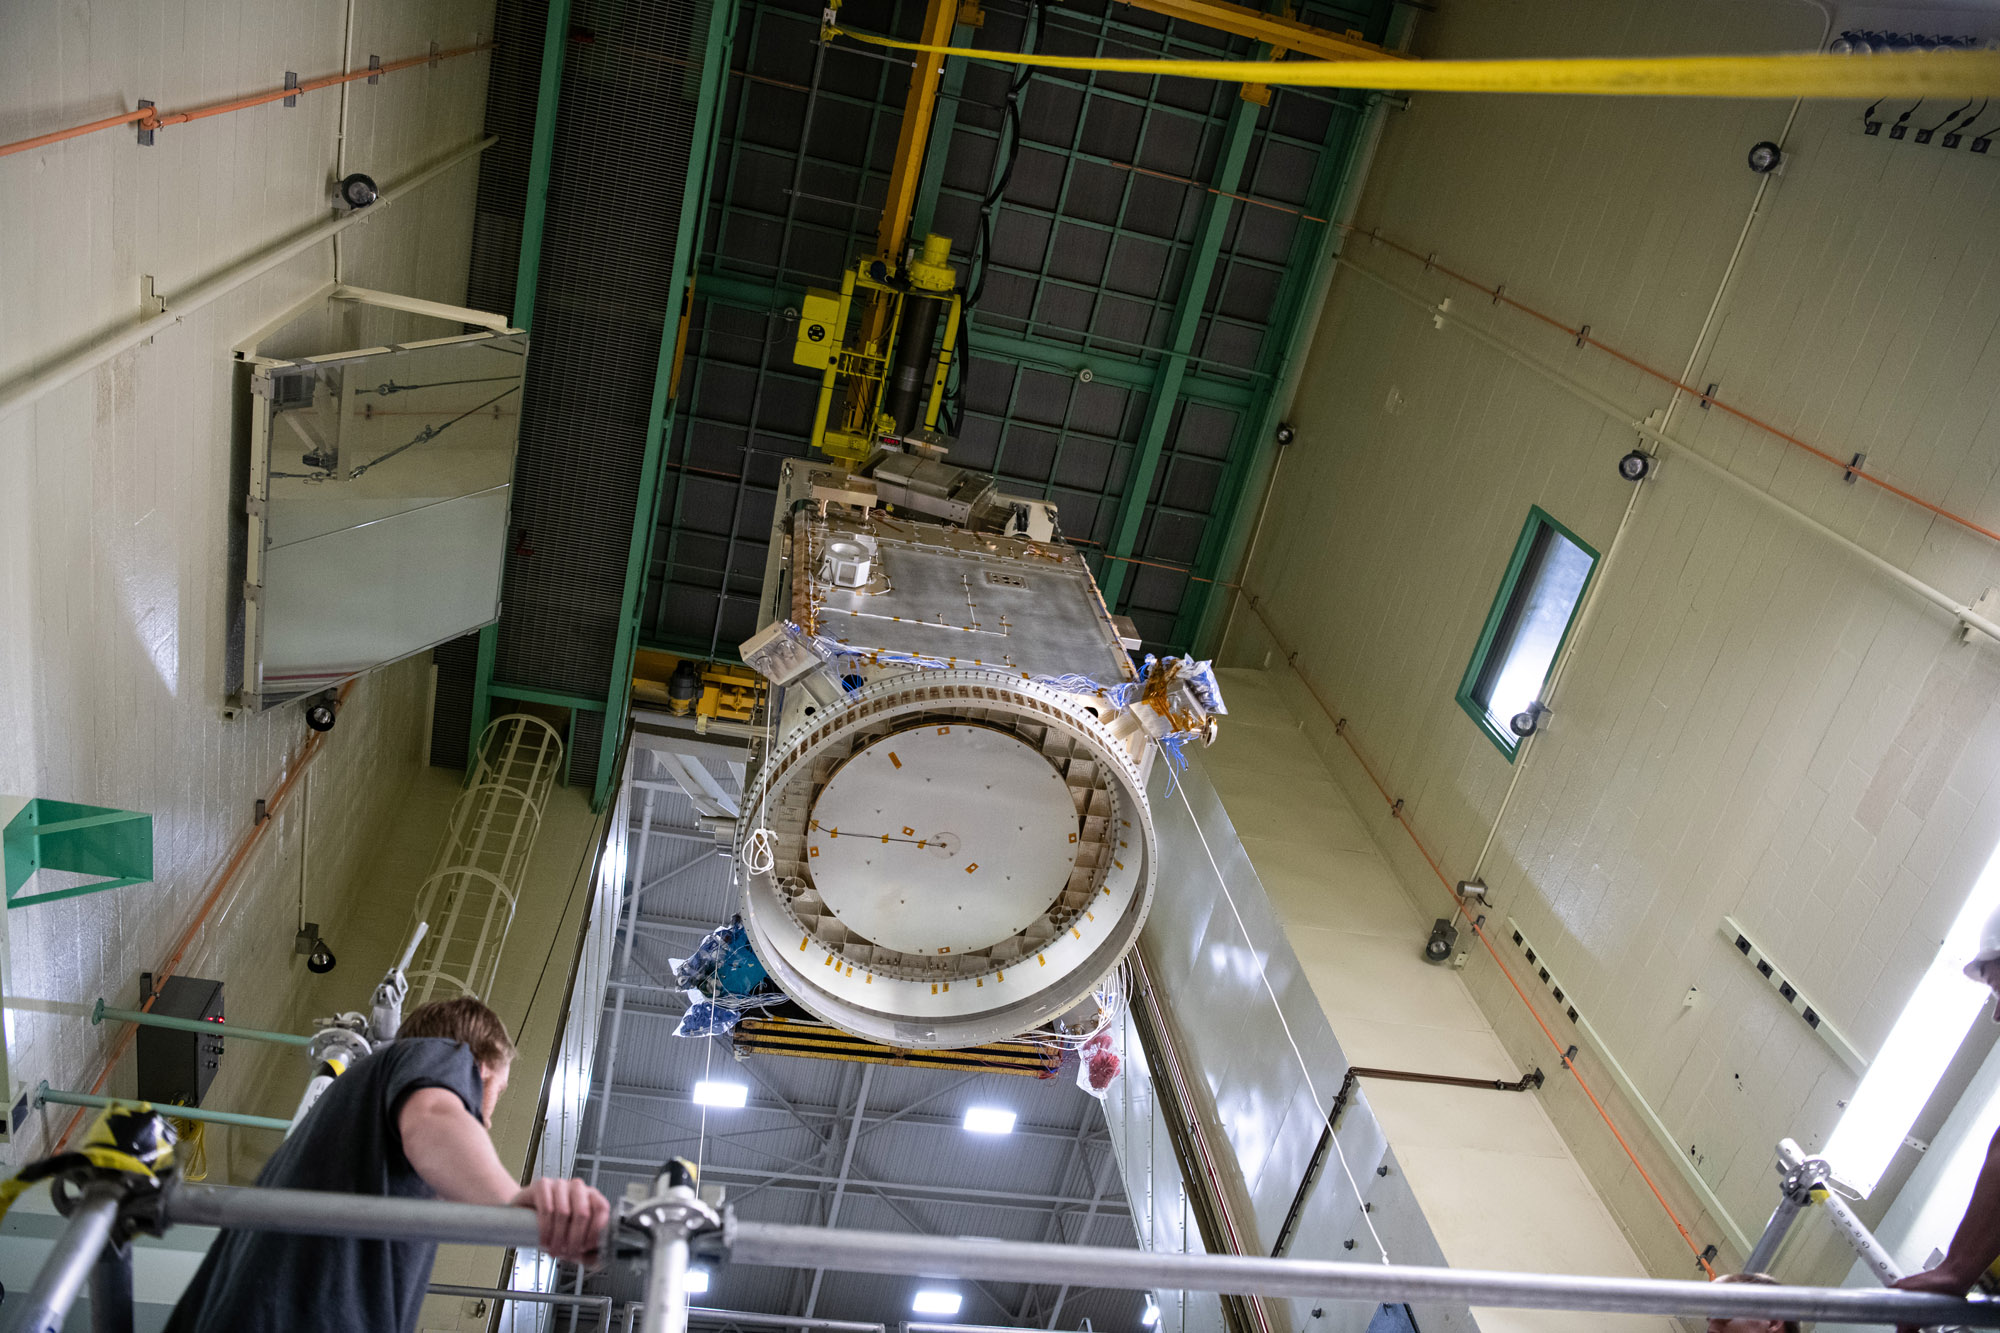
Lift the Observatory into the Space Environment Simulator (SES) Chamber; PACE Observatory thermal vacuum Testing: Lift into SES and Configure for testing. Credit: NASA
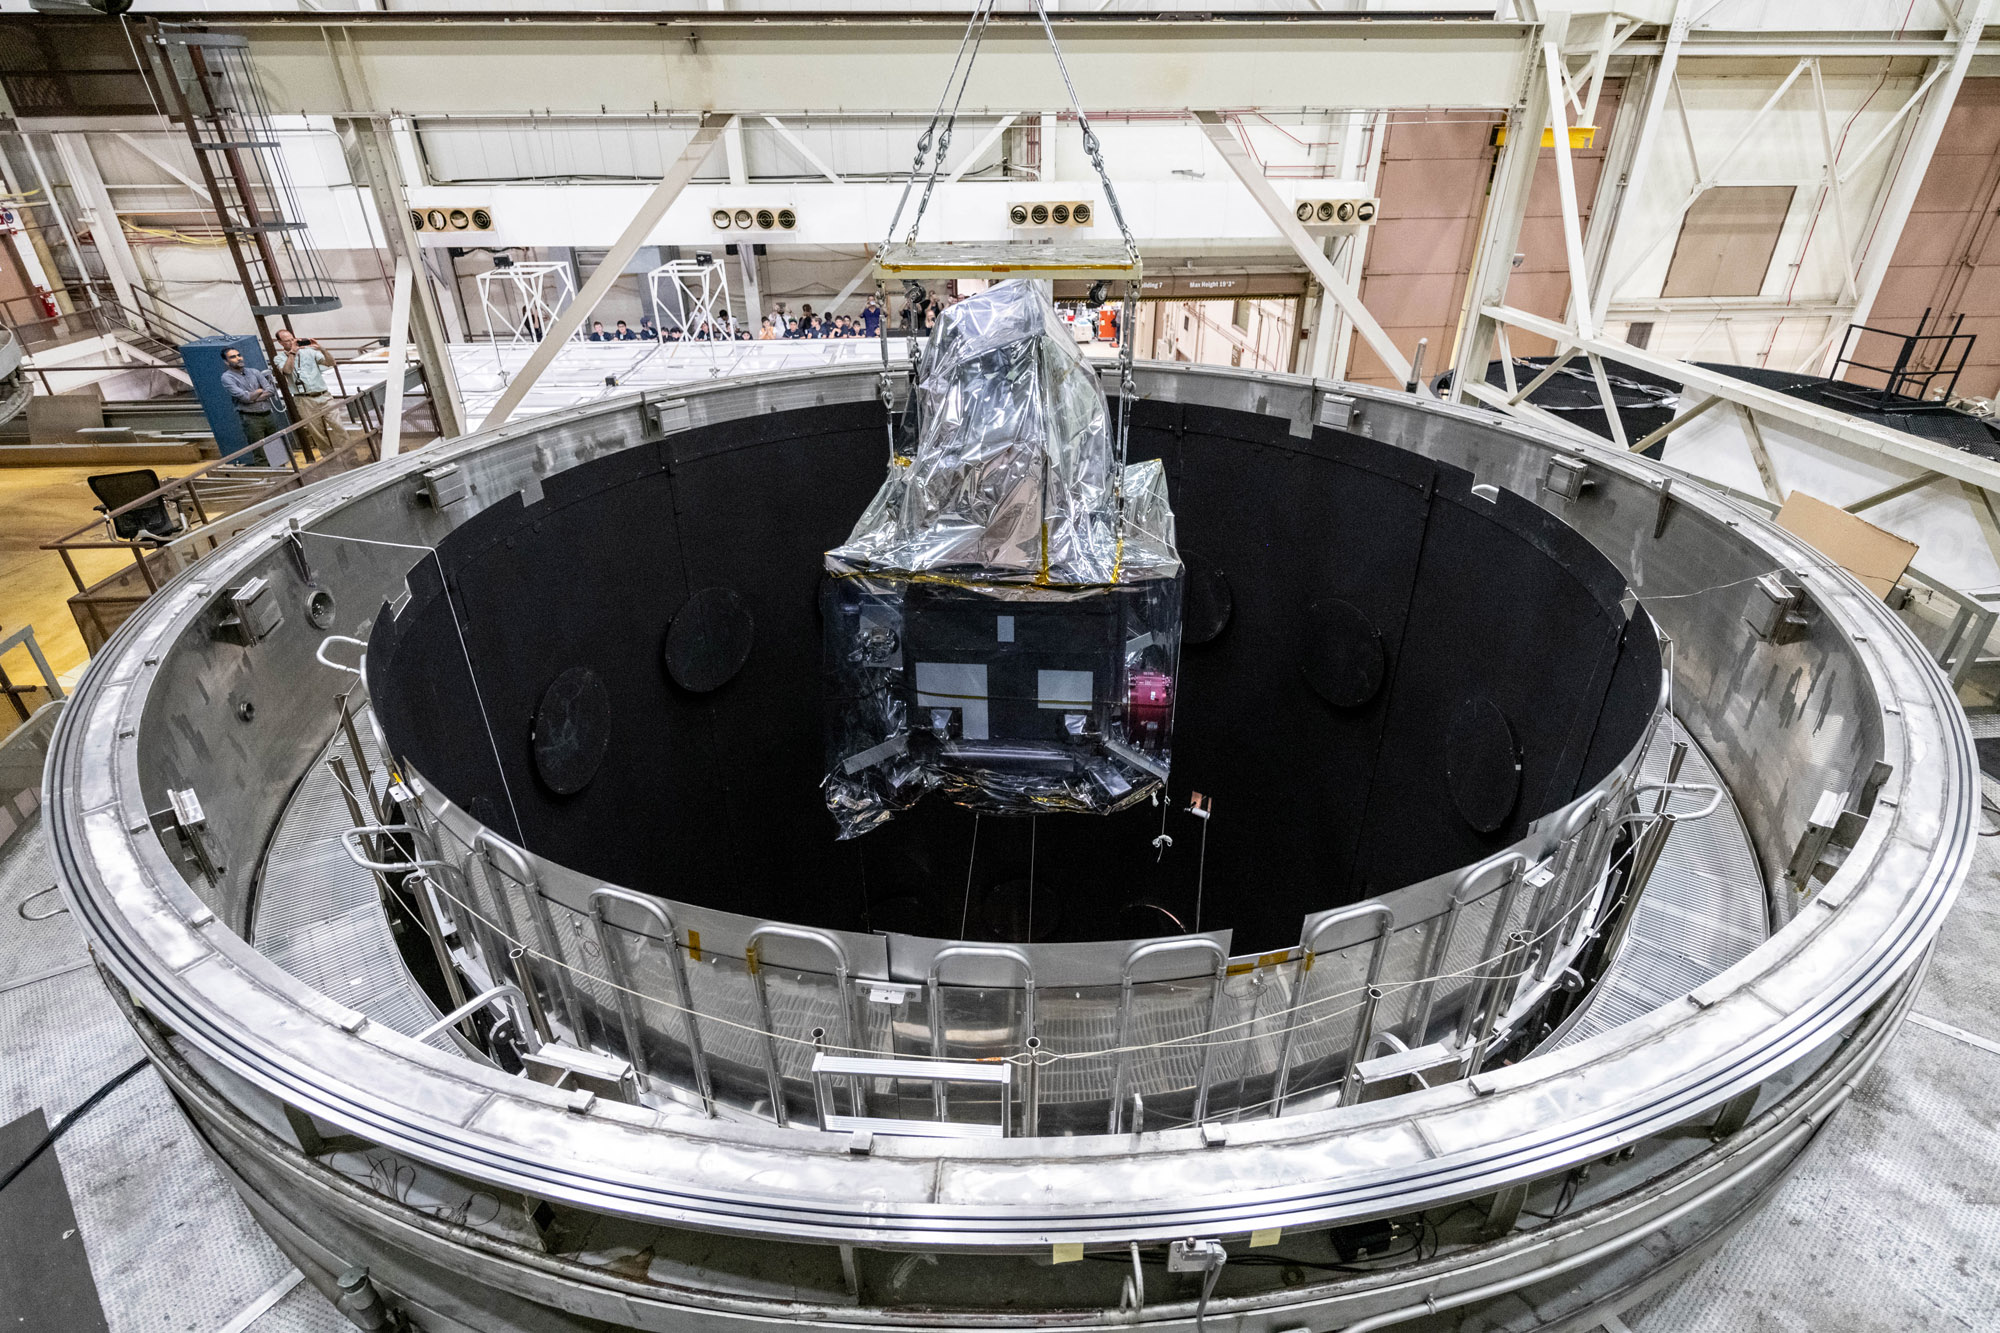
Lift the Observatory into the Space Environment Simulator (SES) Chamber; PACE Observatory thermal vacuum Testing: Lift into SES and Configure for testing. Credit: NASA
Lift Observatory to Aronson Table. Rotate for Flight Solar Array Wing Removal and Lift Back to Observatory Dolly; Tilt down Aronson table with +Z panel up. Credit: NASA
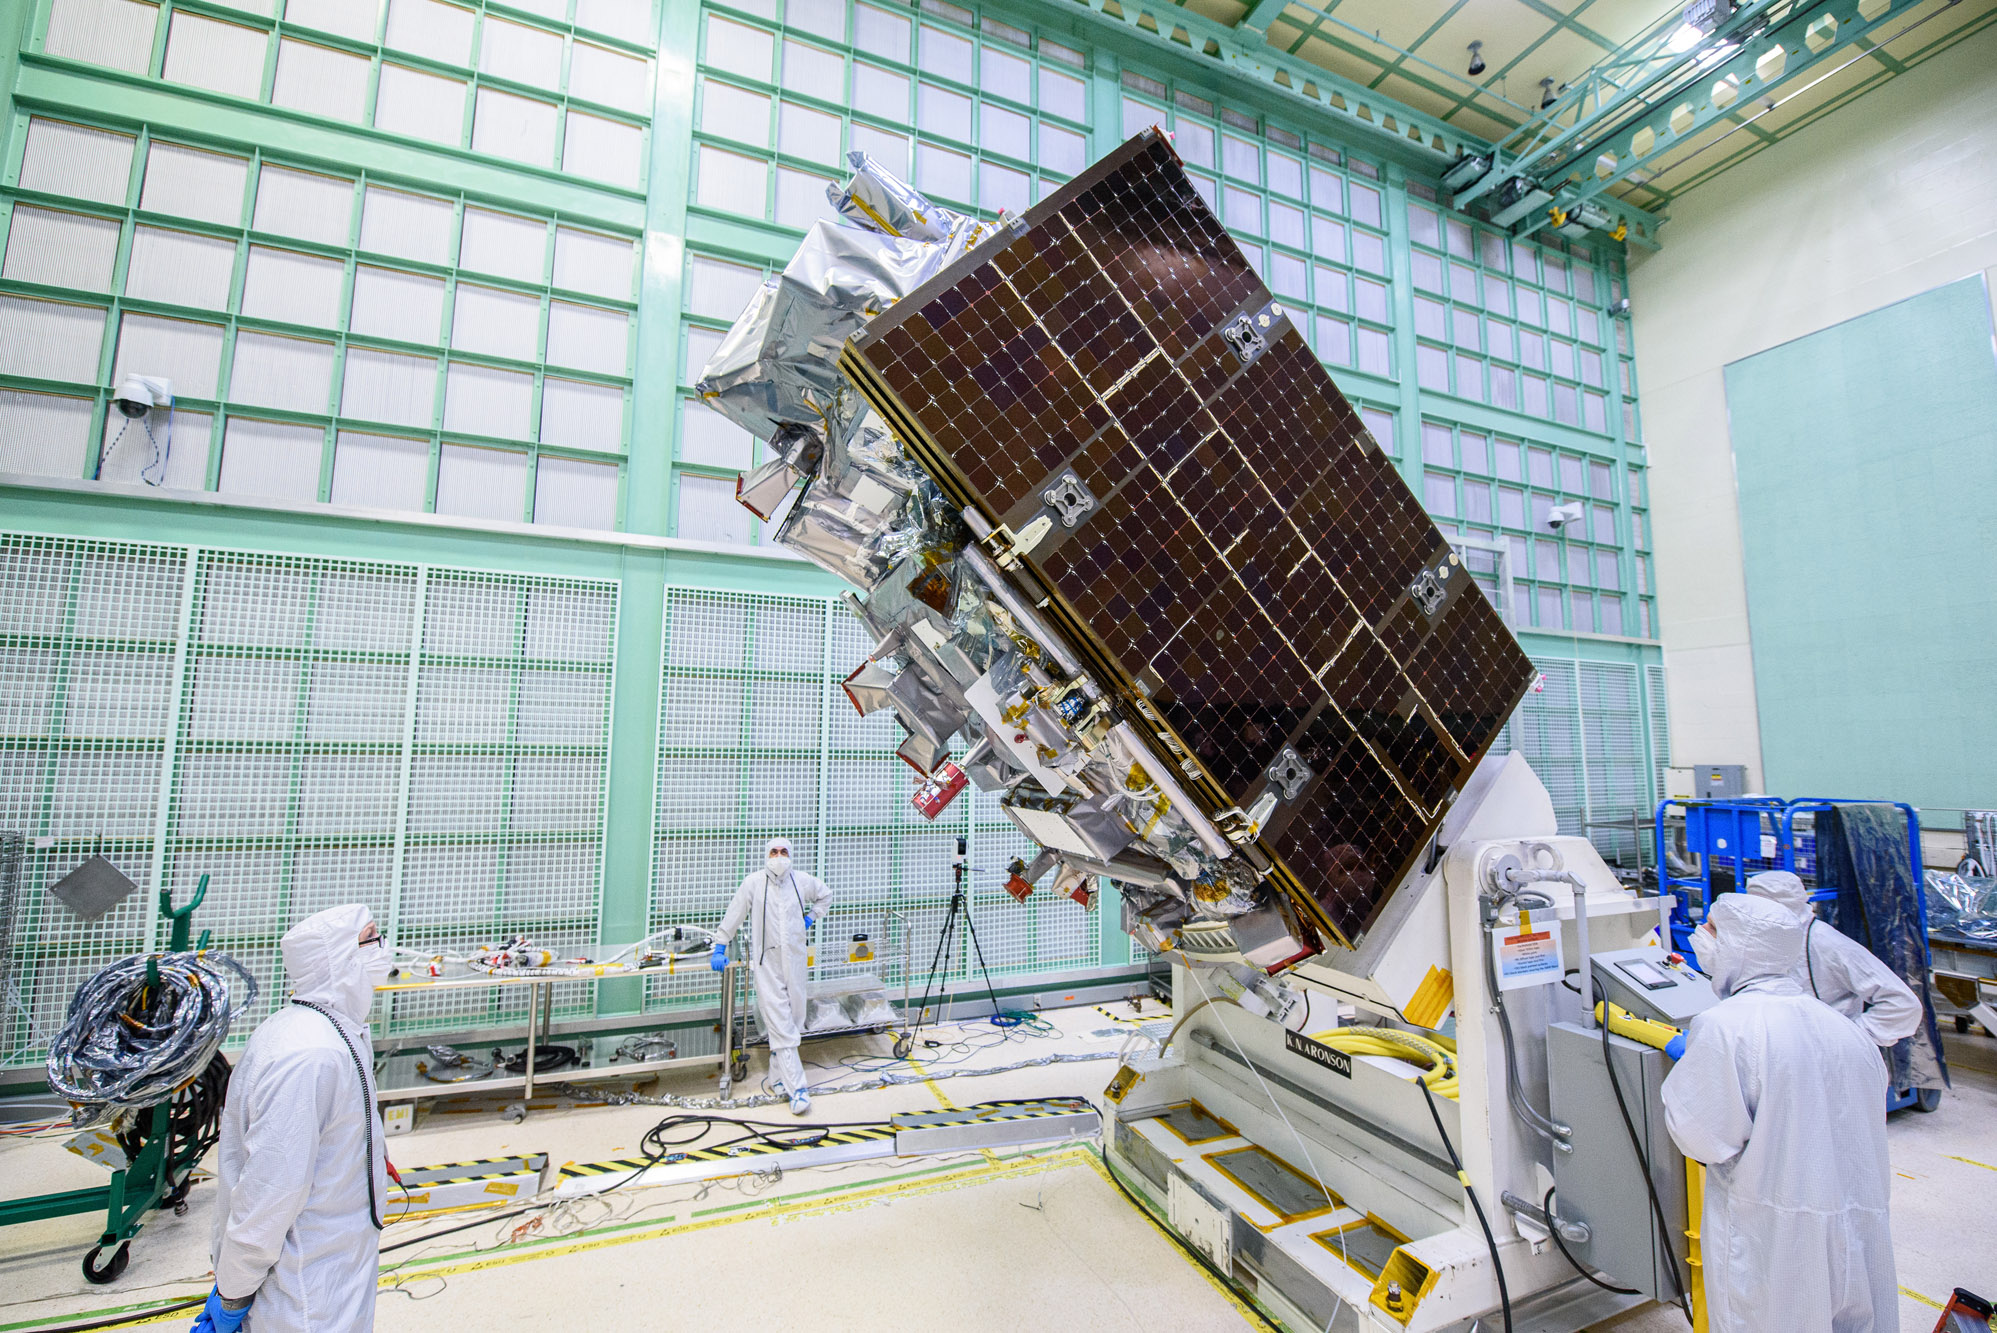
Lift Observatory to Aronson Table, Rotate for Flight Solar Array Wing Removal and Lift Back to Observatory Dolly; Tilt down Aronson table with +Z panel up. Credit: NASA
Lift Observatory to Aronson Table, Rotate for Flight Solar Array Wing Removal and Lift Back to Observatory Dolly; Lift of the observatory off the dolly to the Aronson table. Credit: NASA
Lift Observatory to Aronson Table. Rotate for Flight Solar Array Wing Removal and Lift Back to Observatory Dolly; Lift of the observatory off the dolly to the Aronson table. Credit: NASA
Final spacecraft configuration in Spacecraft Checkout Area (SCA). Prep, bag and move the Observatory to SCA. Credit: NASA
Lift Observatory to Aronson Table, Rotate for Flight Solar Array Wing Installation and Phasing Tests, Lift Back to Observatory Dolly; Lift onto Aronson Table. Credit: NASA
Lift Observatory to Aronson Table, Rotate for Flight Solar Array Wing Installation and Phasing Tests, Lift Back to Observatory Dolly; Lift onto Aronson Table. Credit: NASA
Lift Observatory to Aronson Table, Rotate for Flight Solar Array Wing Installation and Phasing Tests, Lift Back to Observatory Dolly; Lift onto Aronson Table. Credit: NASA
Lift Observatory to Aronson Table, Rotate for Flight Solar Array Wing Installation and Phasing Tests, Lift Back to Observatory Dolly; Lift onto Aronson Table. Credit: NASA
Lift to Aronson Table, Rotate for Flight Solar Array Wing Removal, Lift Back to Observatory Dolly; Cleaning of Aronson table. Credit: NASA
Final configuration in chamber prior to door closing & Hot Soak; Solar Array engineering test unit Wing Pop and Catch Thermal Vacuum Test. Credit: NASA
Final configuration in chamber prior to door closing & Hot Soak; Solar Array engineering test unit Wing Pop and Catch Thermal Vacuum Test. Credit: NASA
Solar Array enginnering test unit Wing Pop and Catch Thermal Vacuum Test; Replace NEAs, Preload, tethers, after hot pop before Cold Pop and catch Credit: NASA
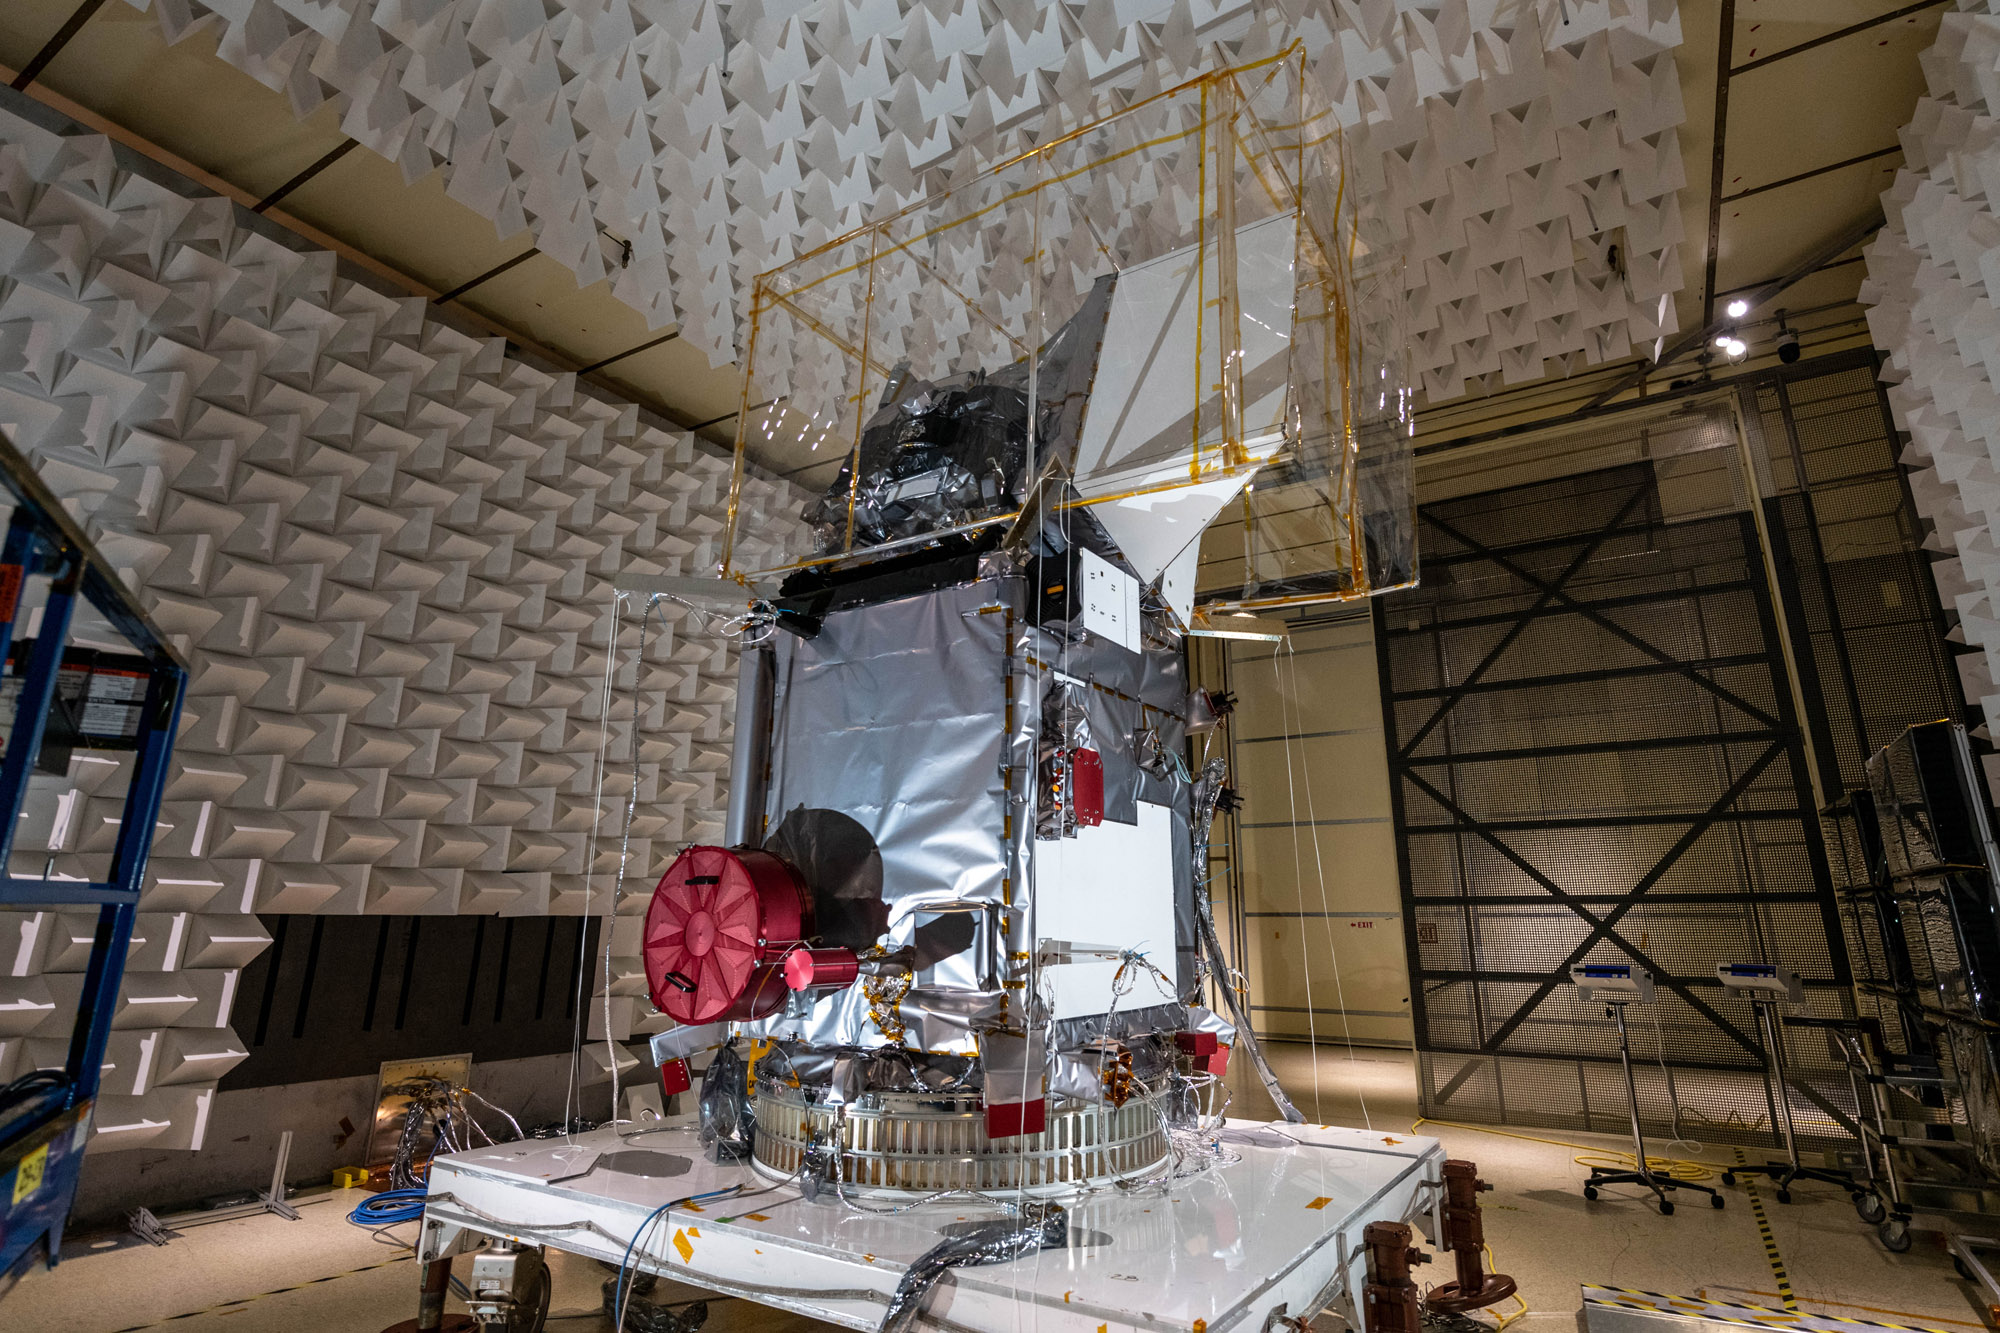
PACE Observatory Glamour Photos in electromagnetic interference (EMI) Chamber; Move Observatory to EMI: Install bagging standoffs, bag the Observatory, and move to EMI test facility. Credit: NASA
Partial +Y Panel Opening; Open and Close the +Y Panel. Credit: NASA
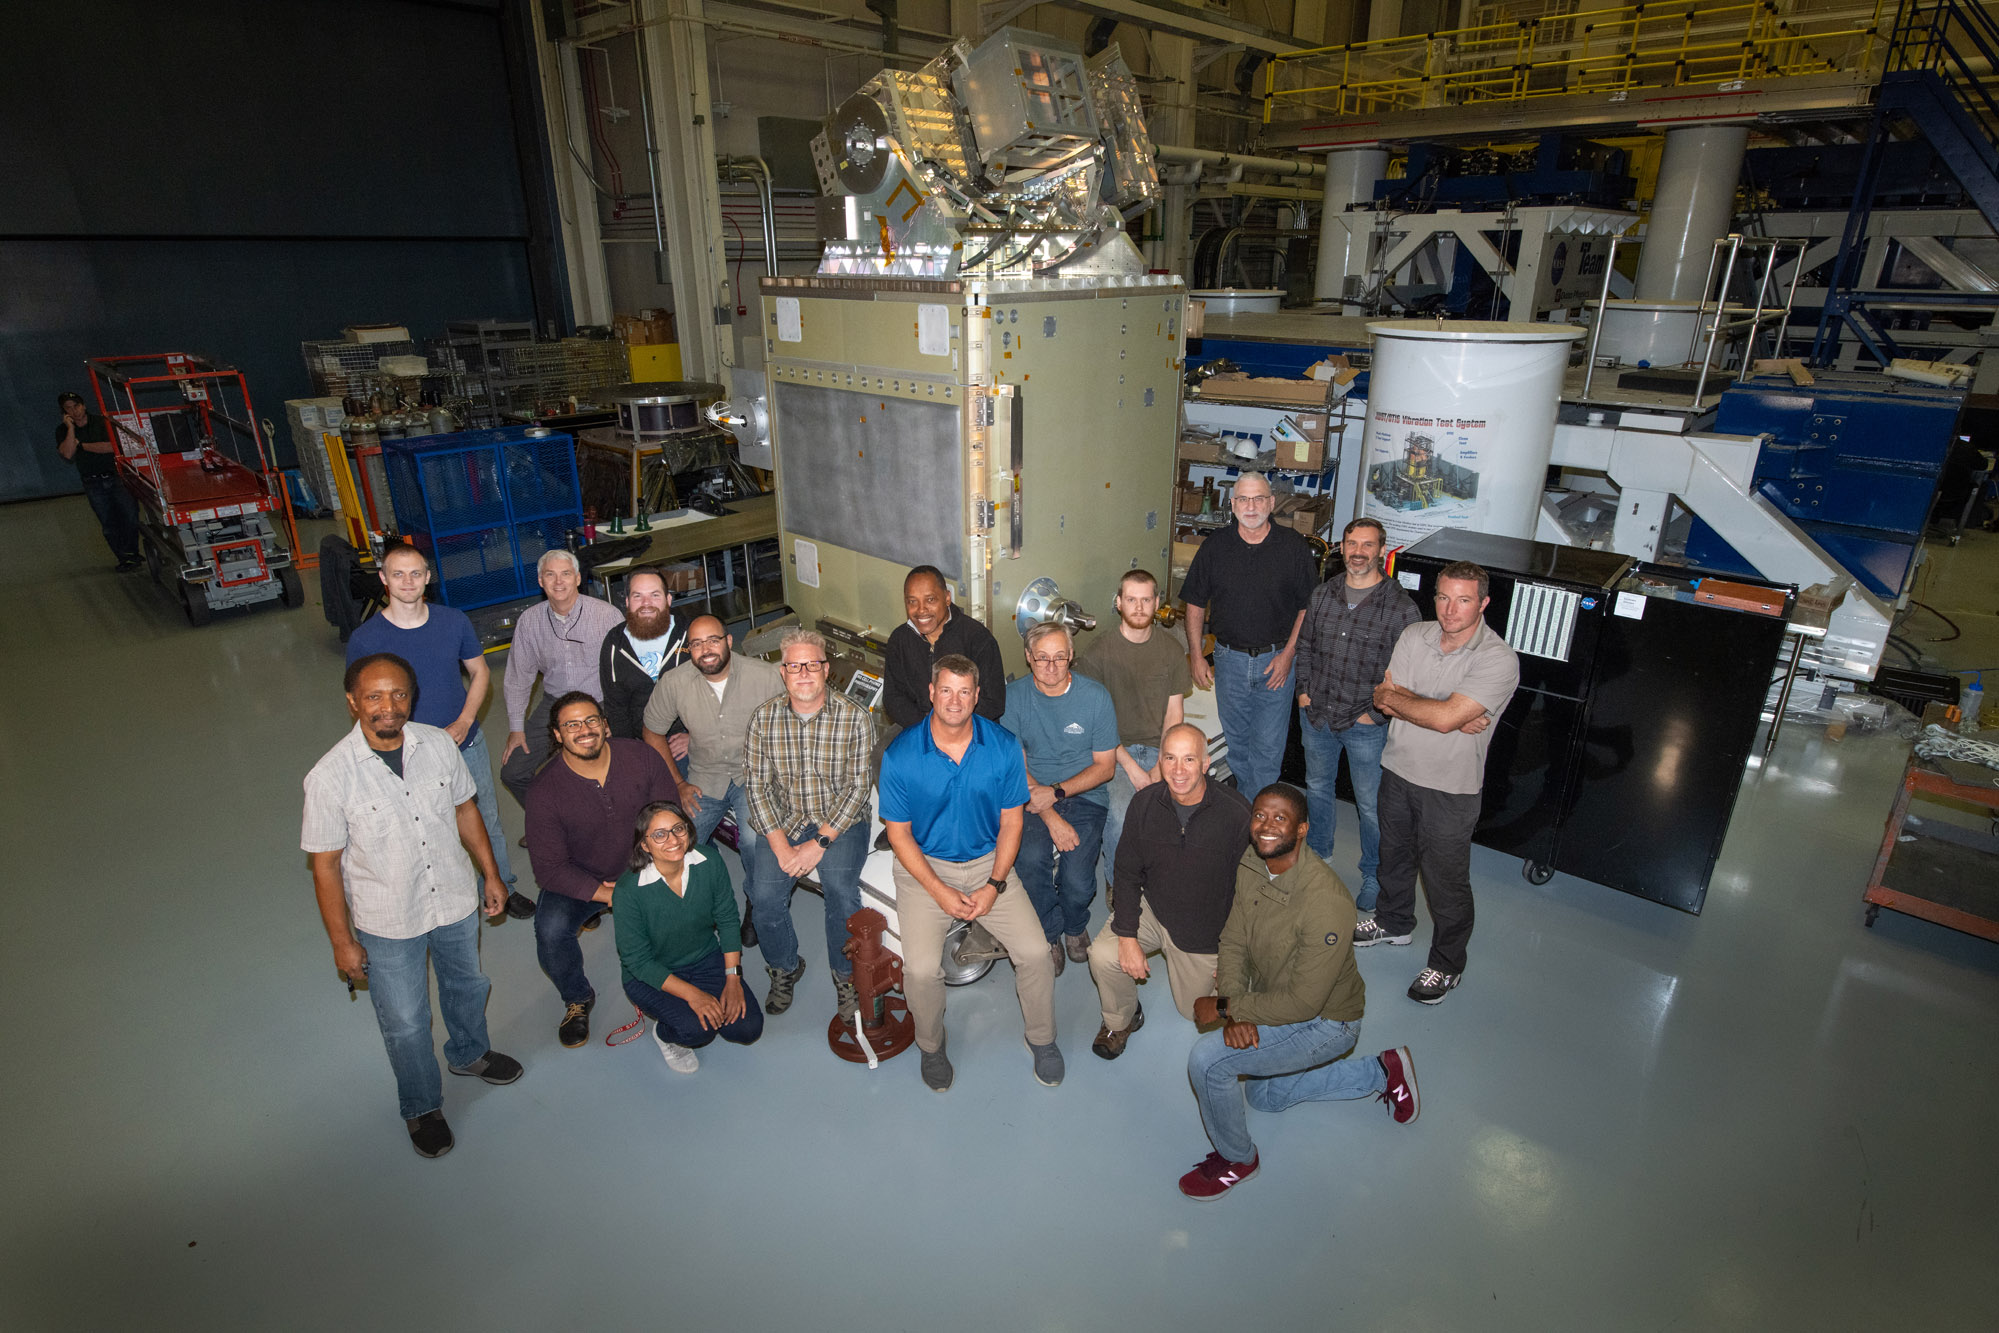
PACE Mechanical Team with the spacecraft. Credit: NASA
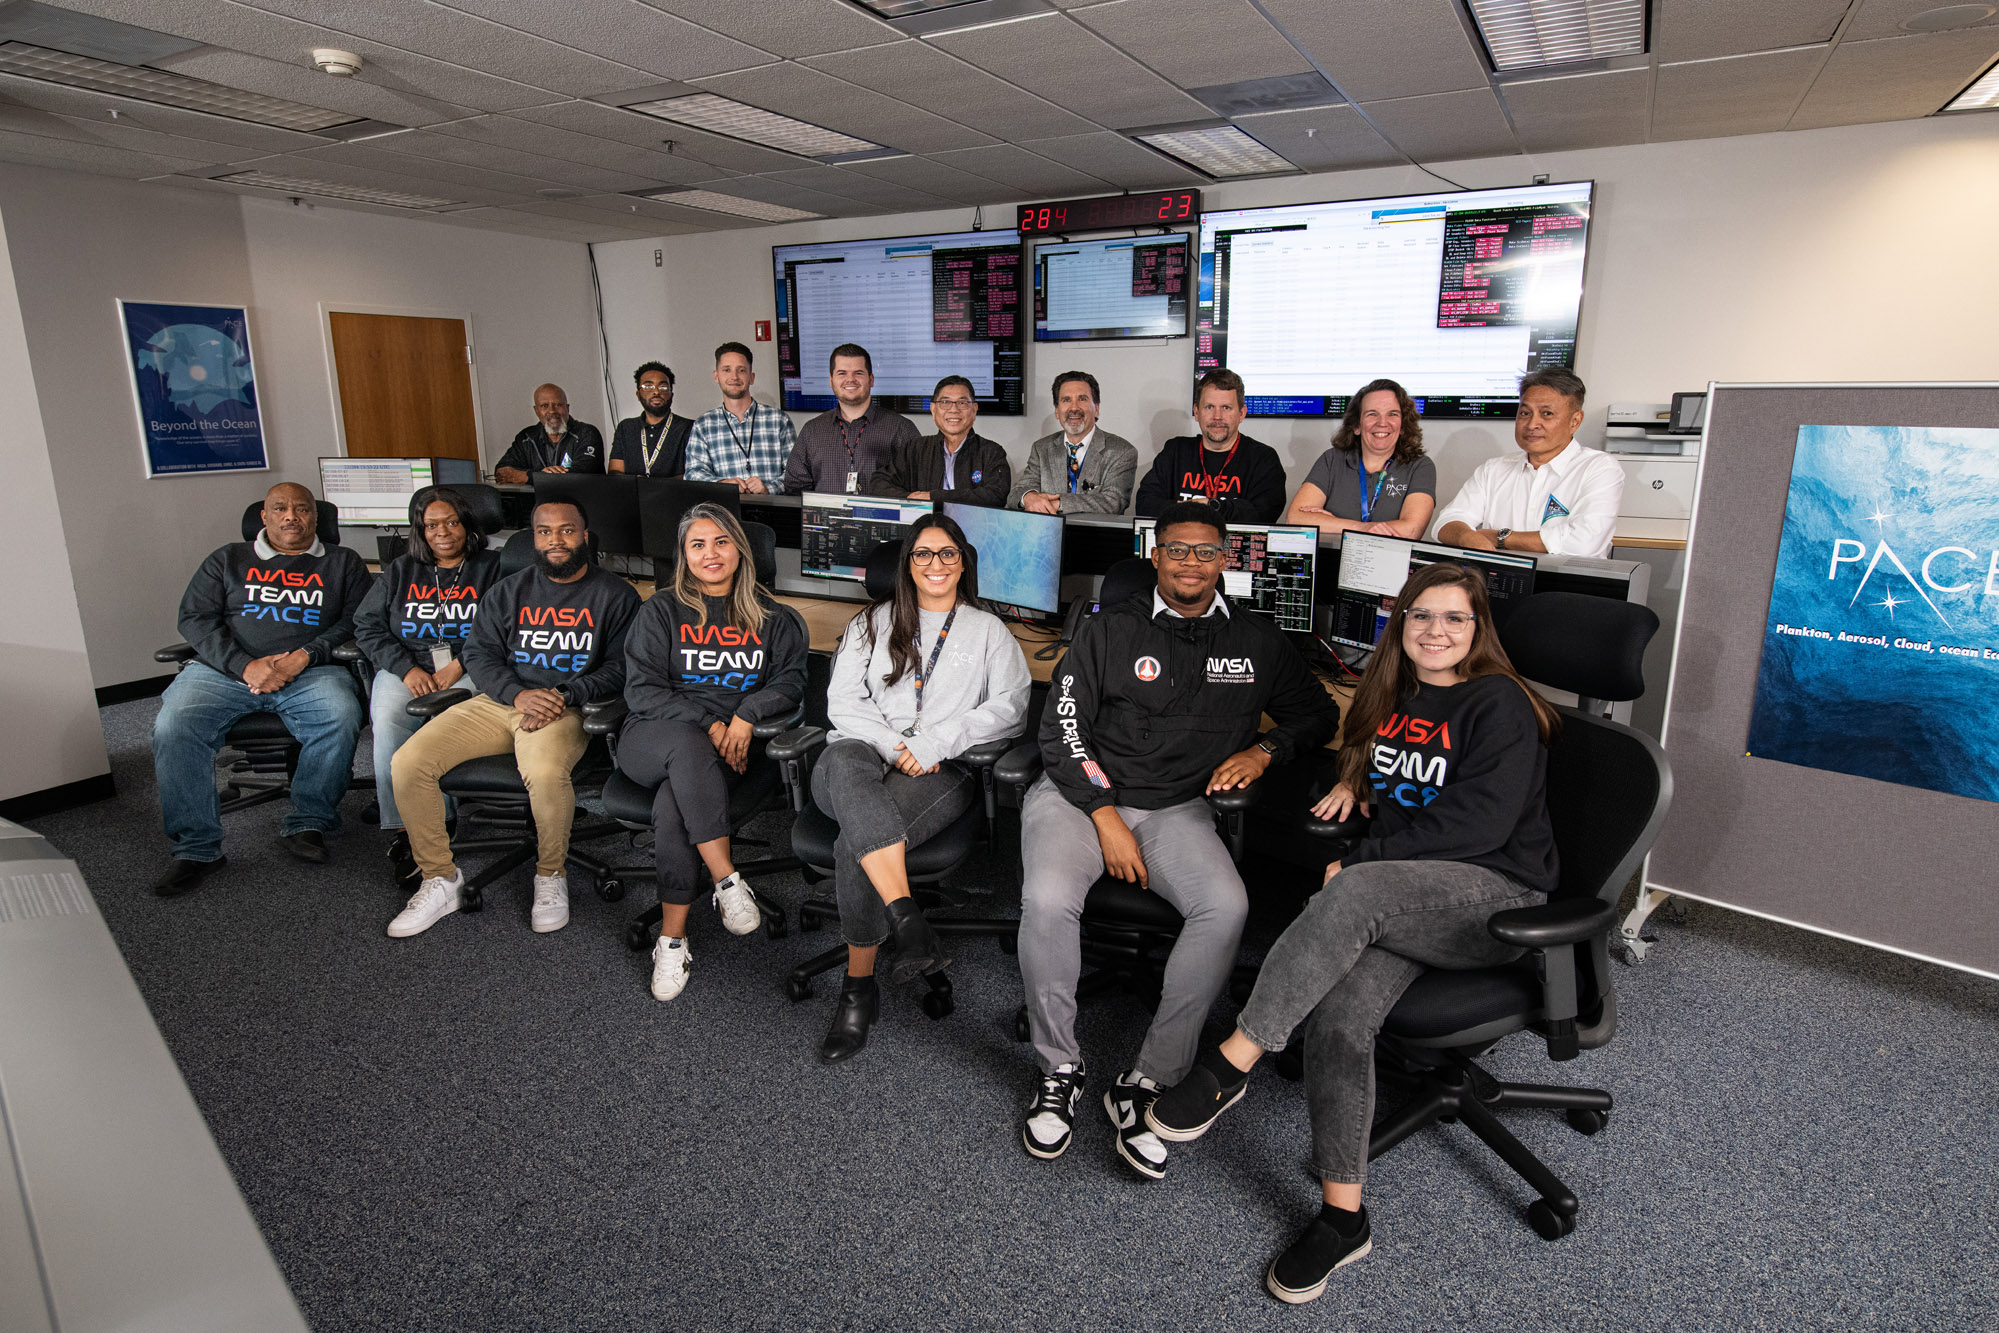
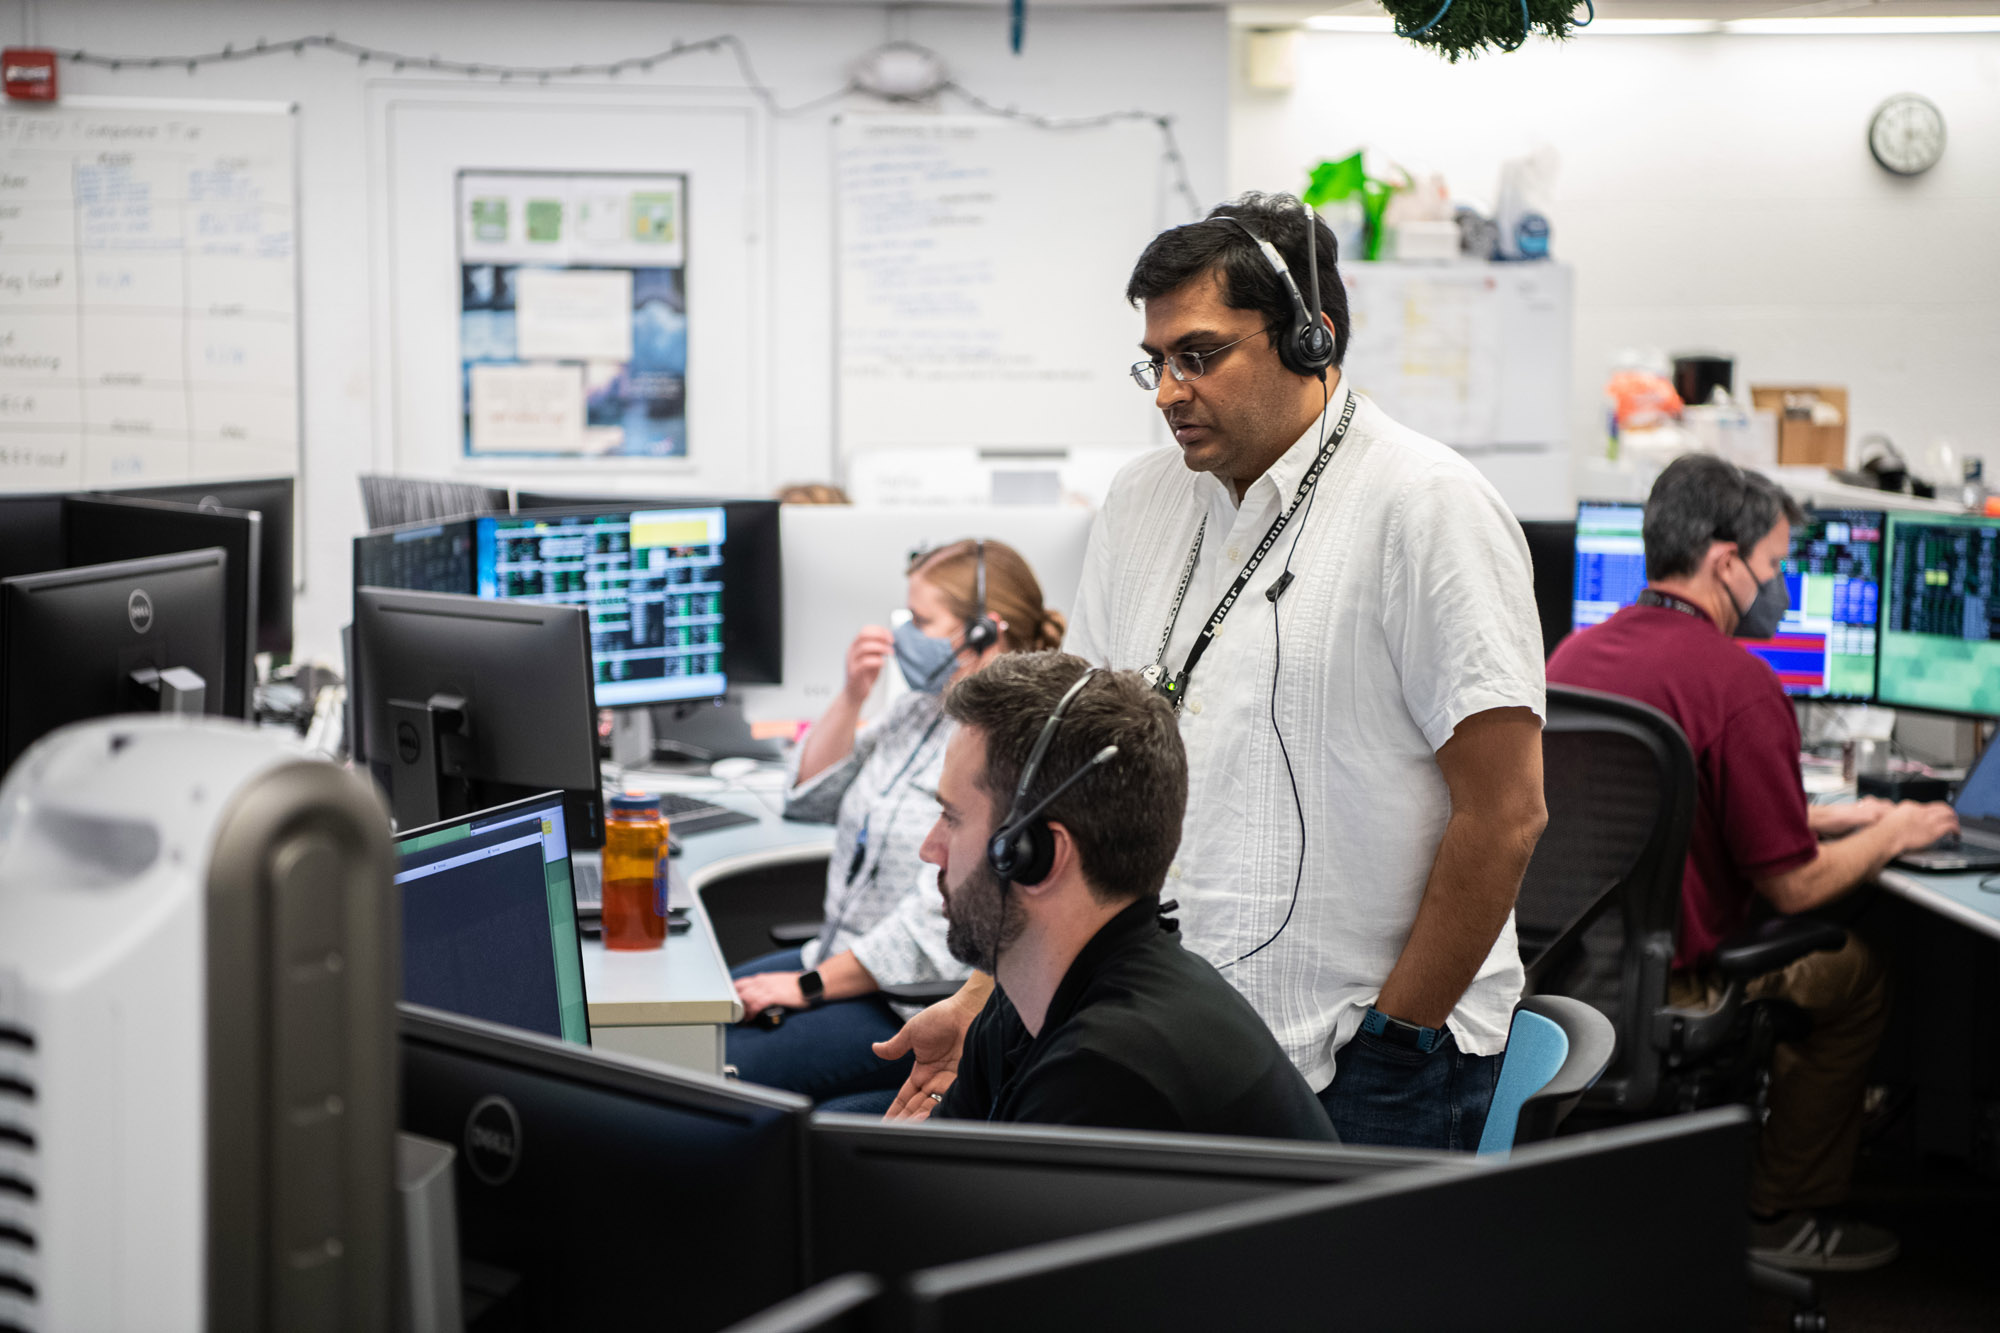
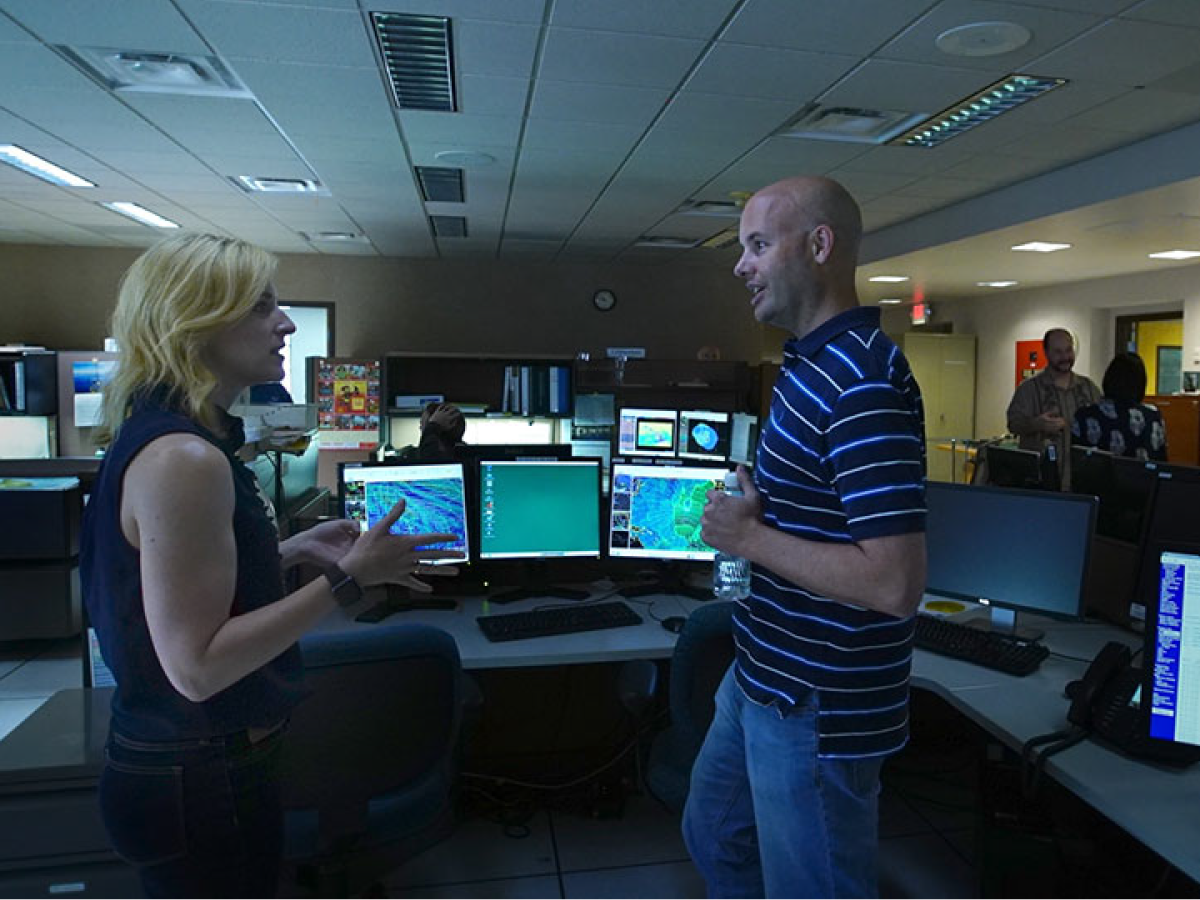
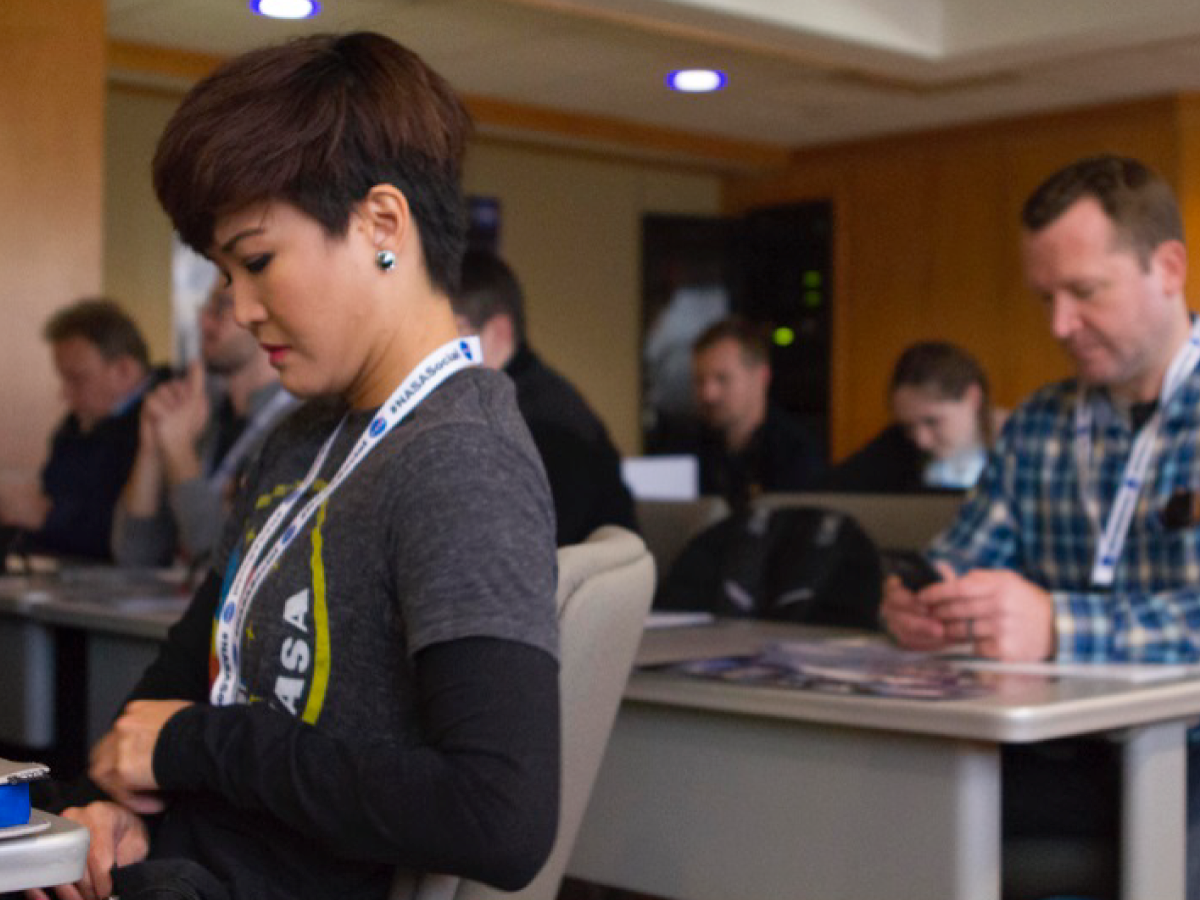
Candid and portrait photos of the PACE Mission Operations Center. Credit: NASA
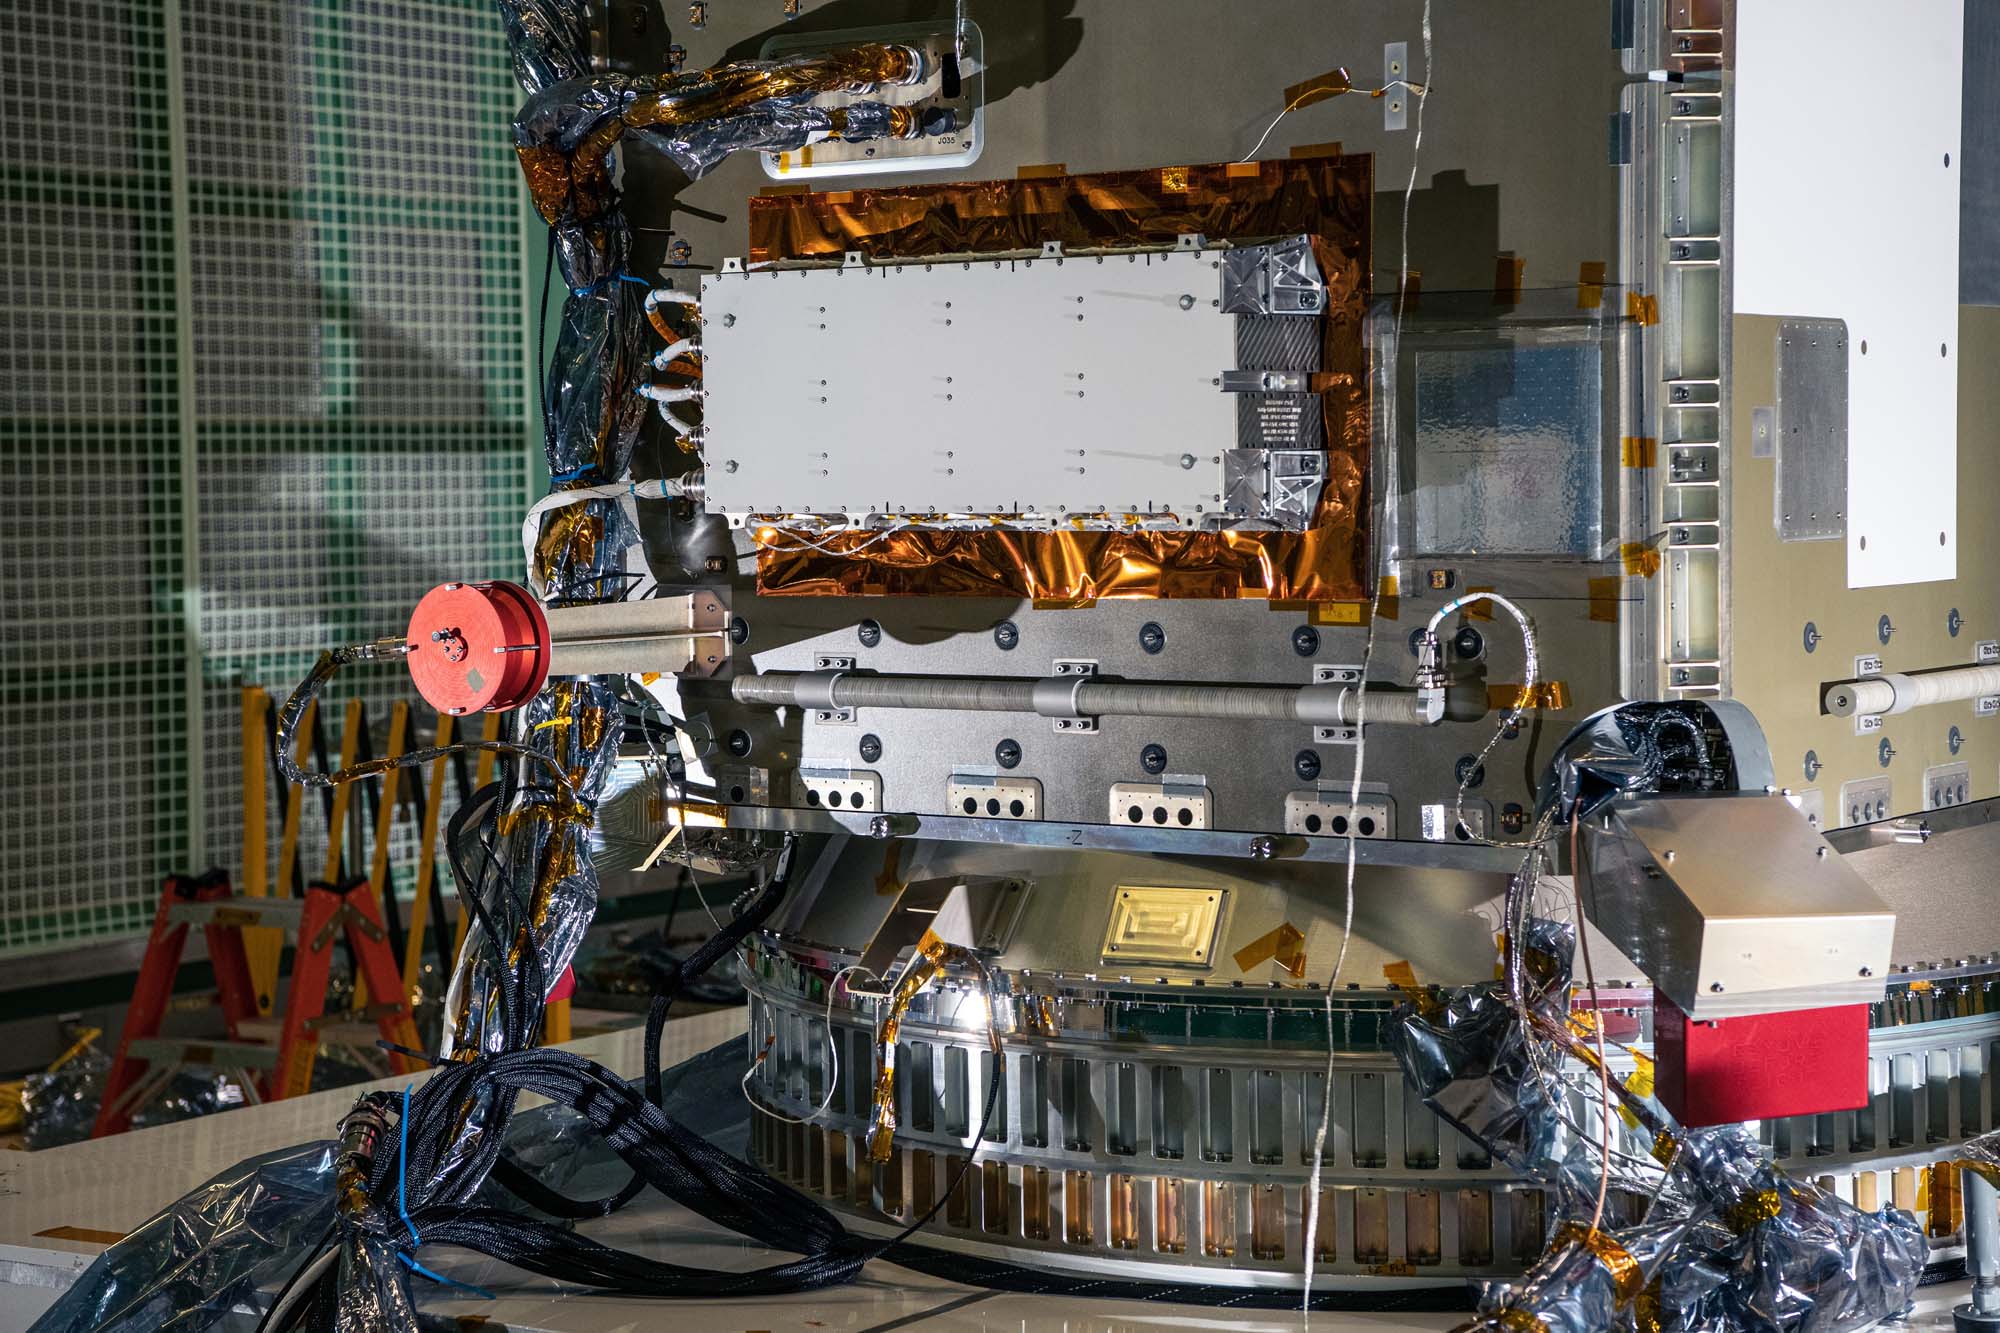
Install Earth Coverage Antenna (ECA) and Temporary Install Waveguides to PACE Spacecraft BUS; ECA and Hat Coupler installed on Spacecraft. Credit: NASA
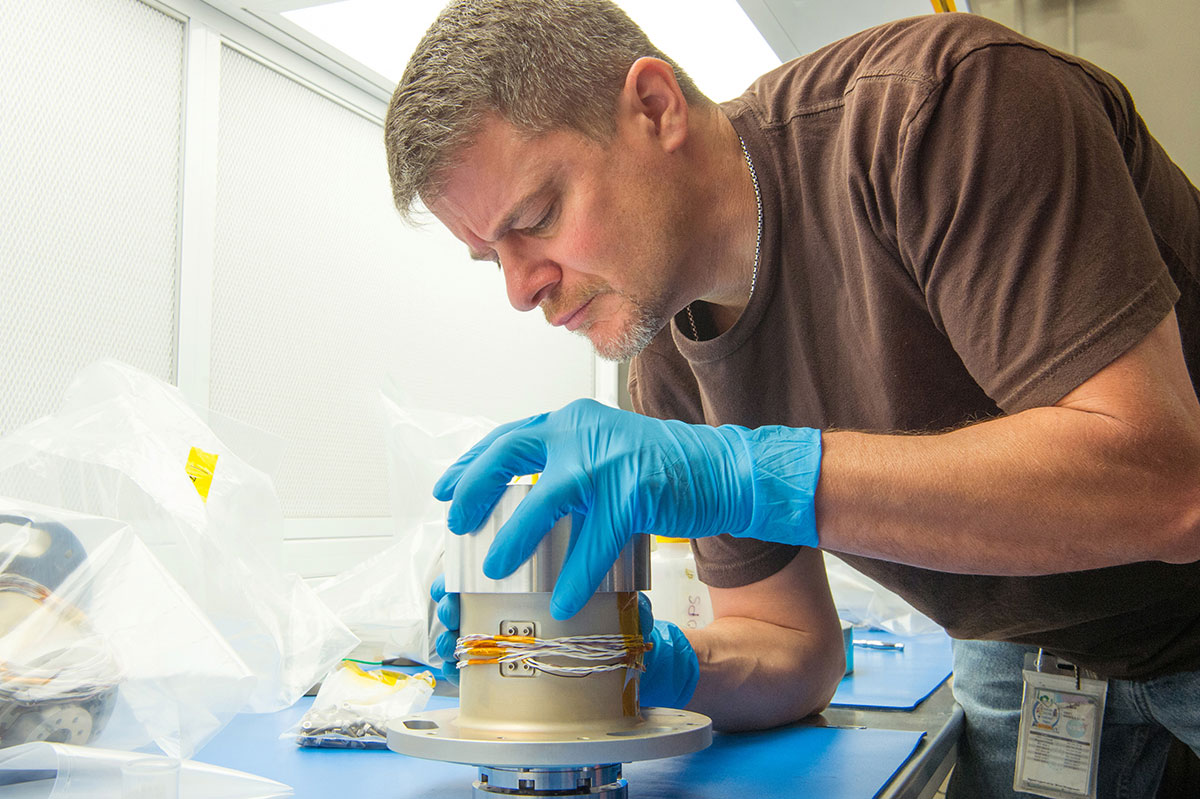
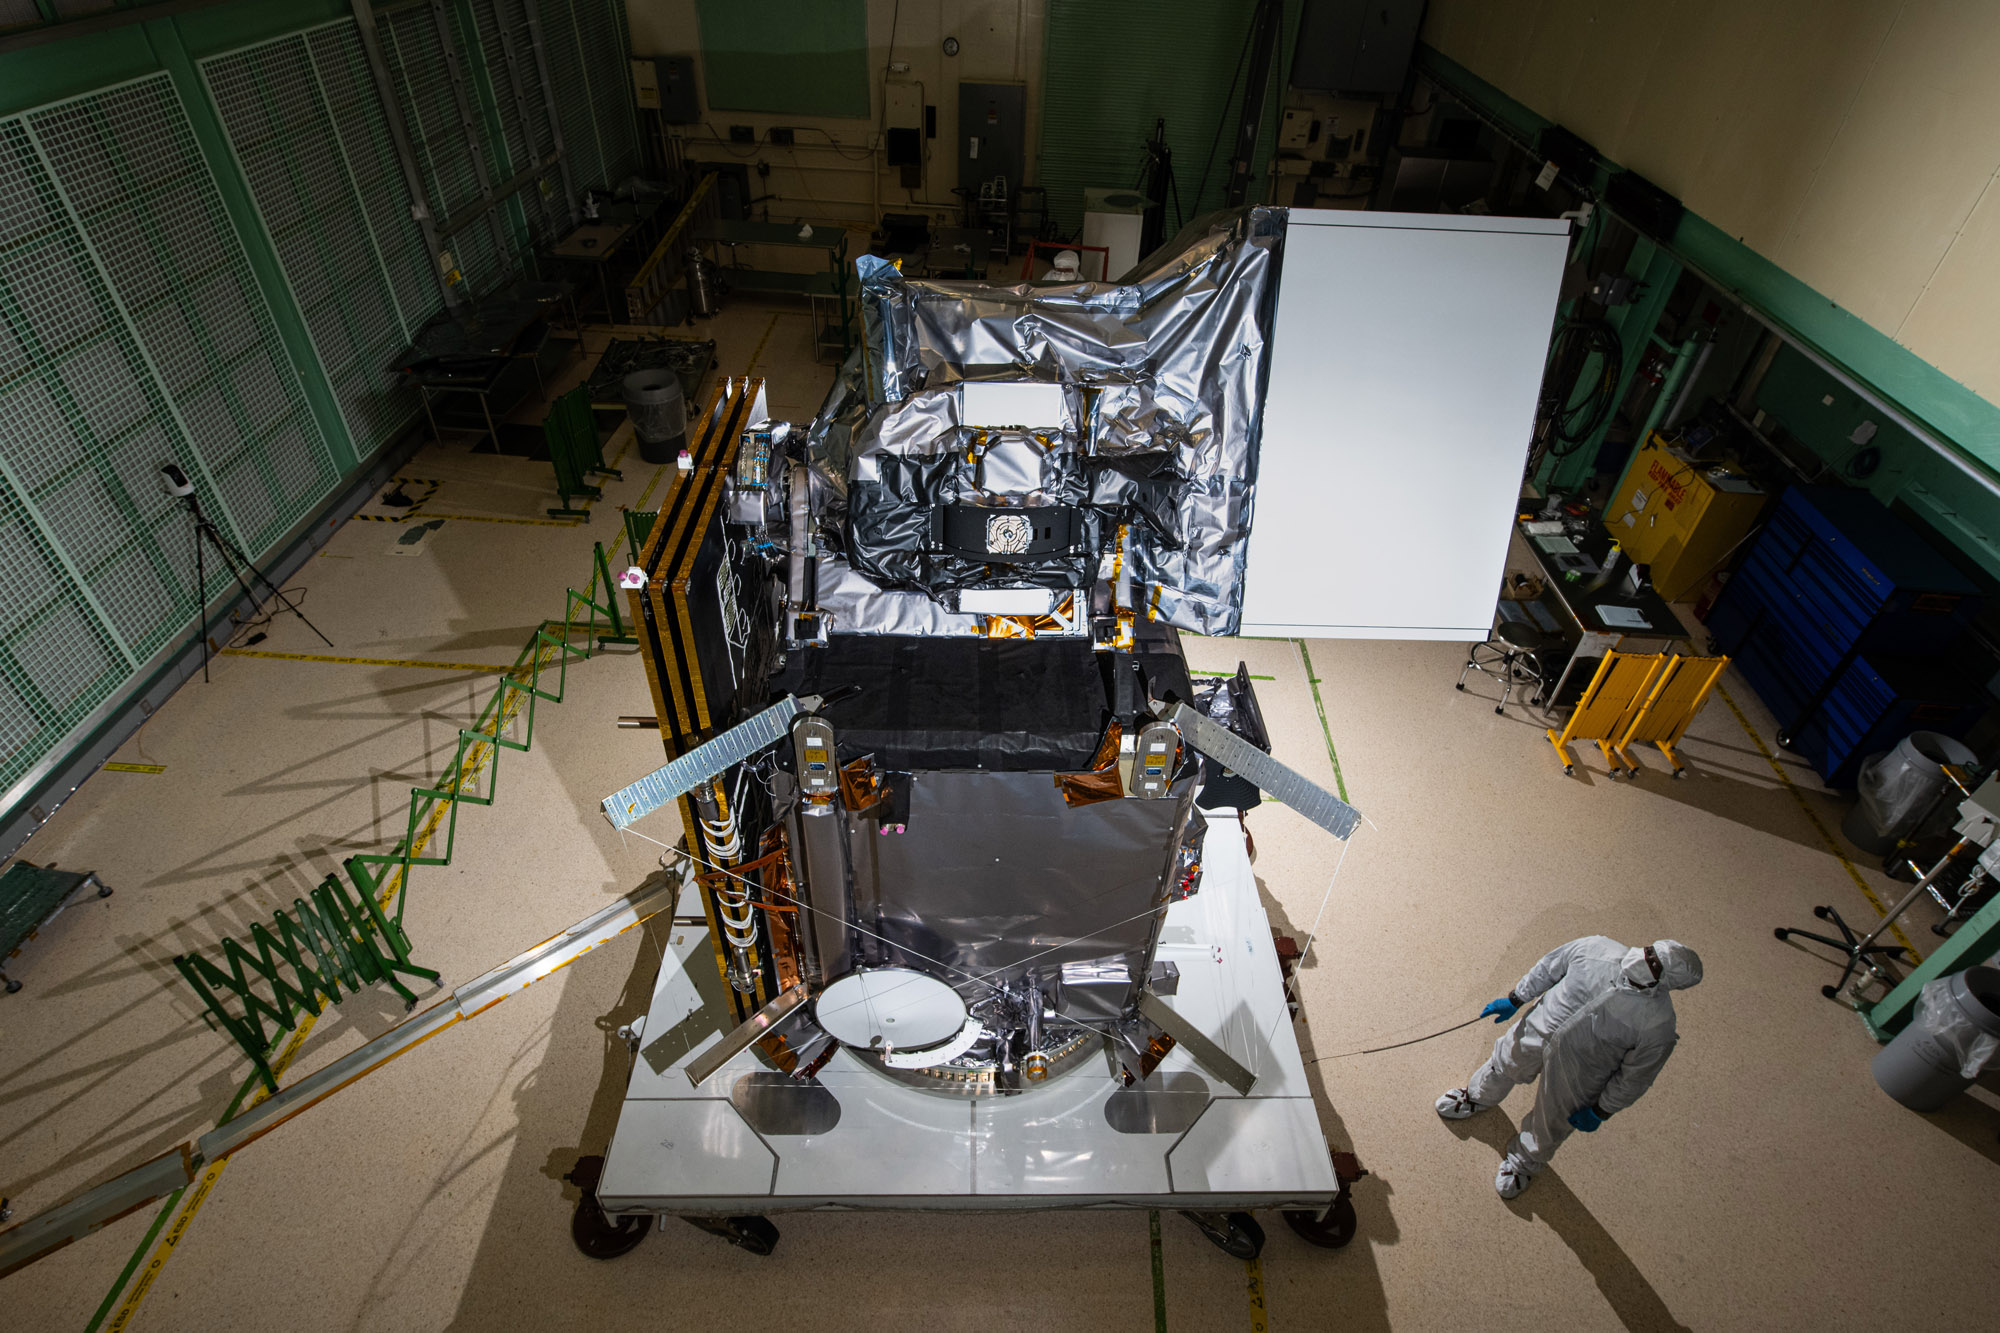
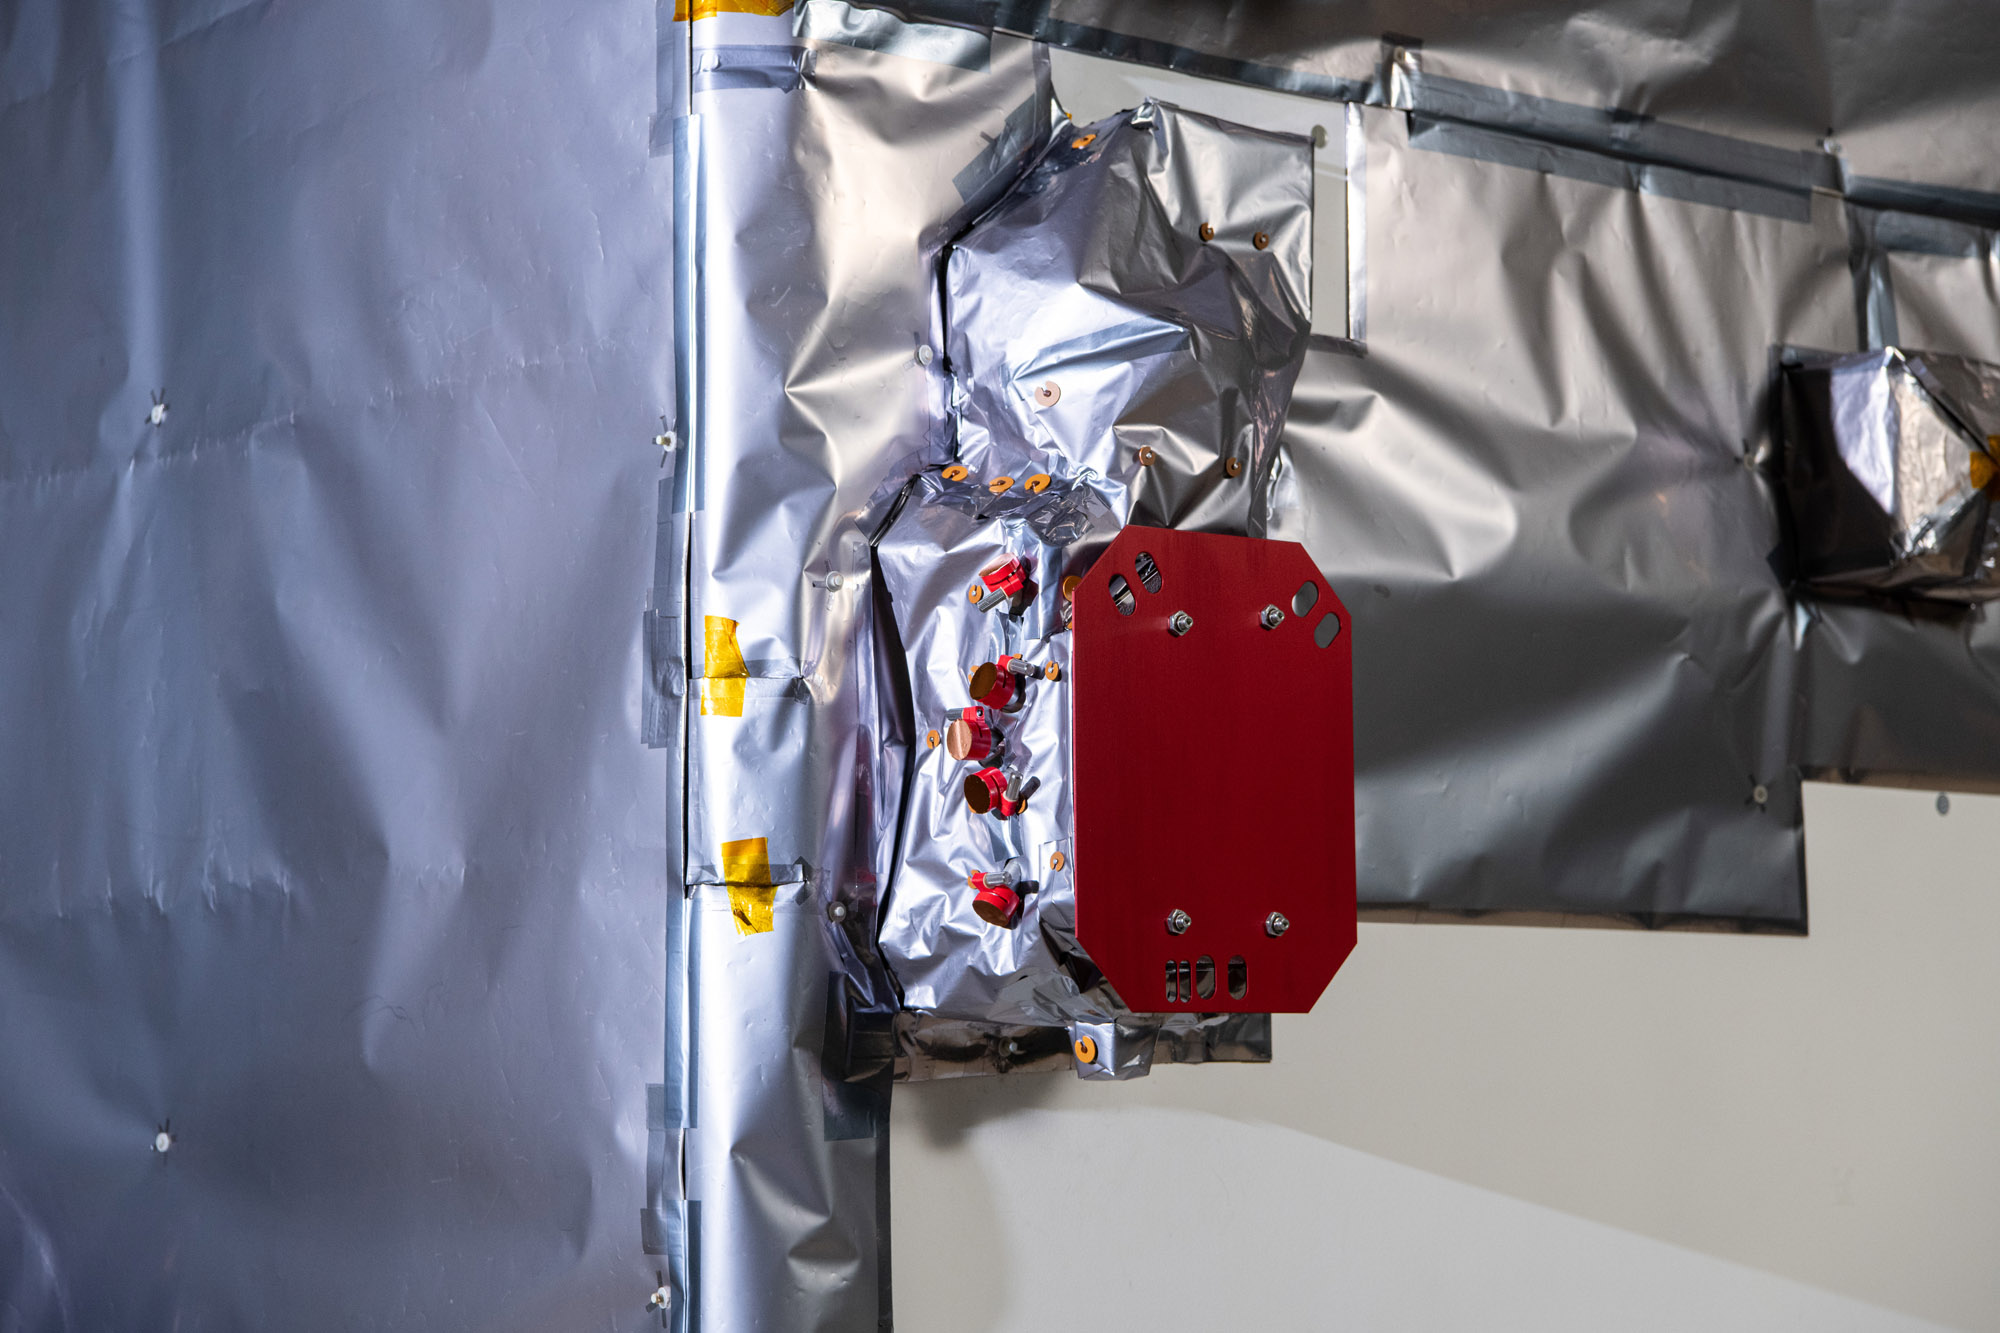
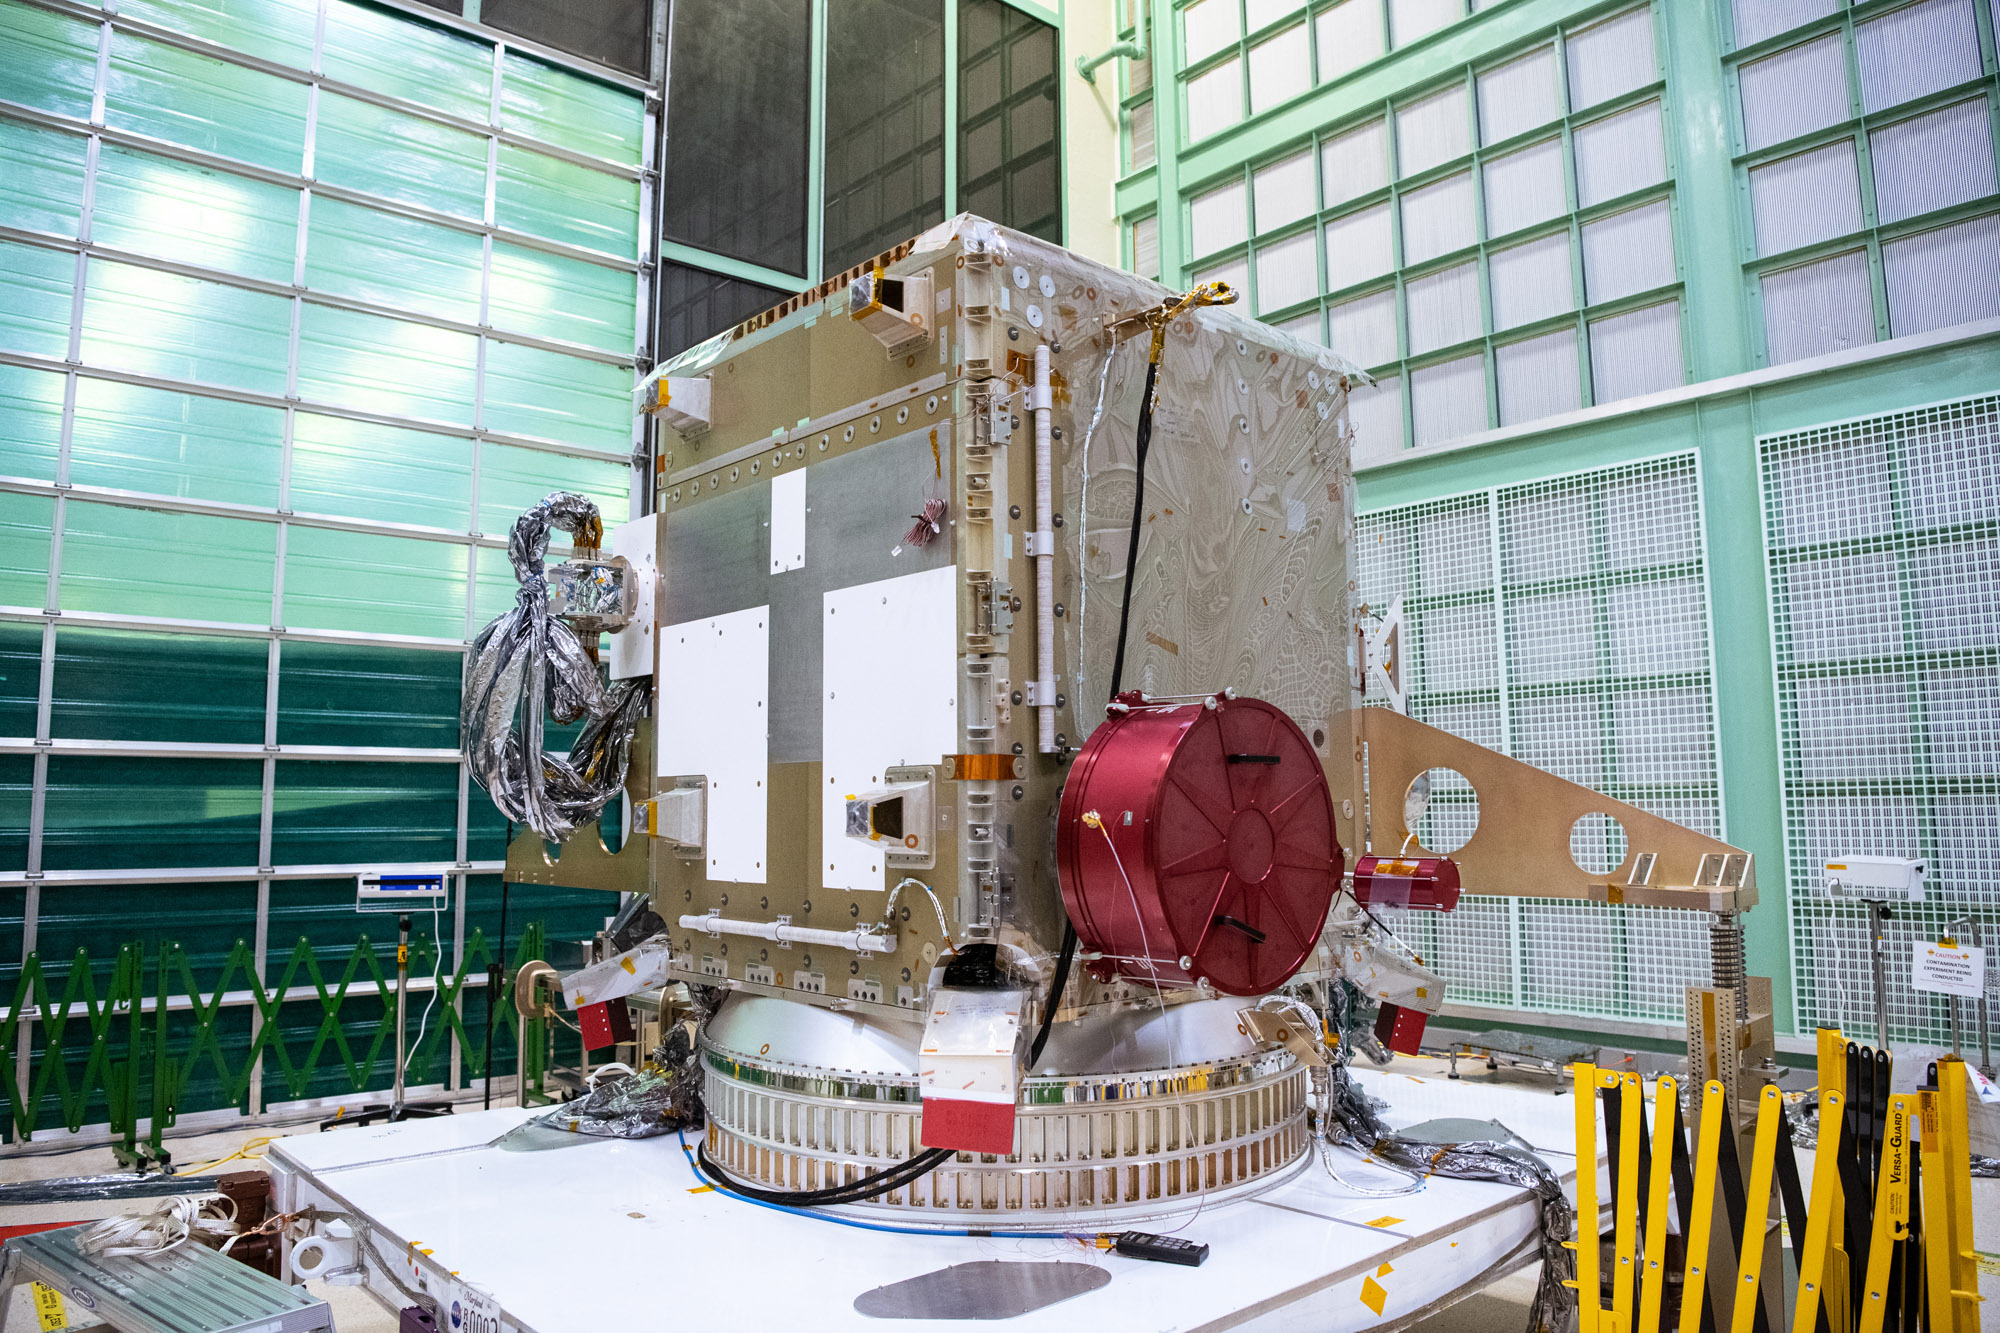
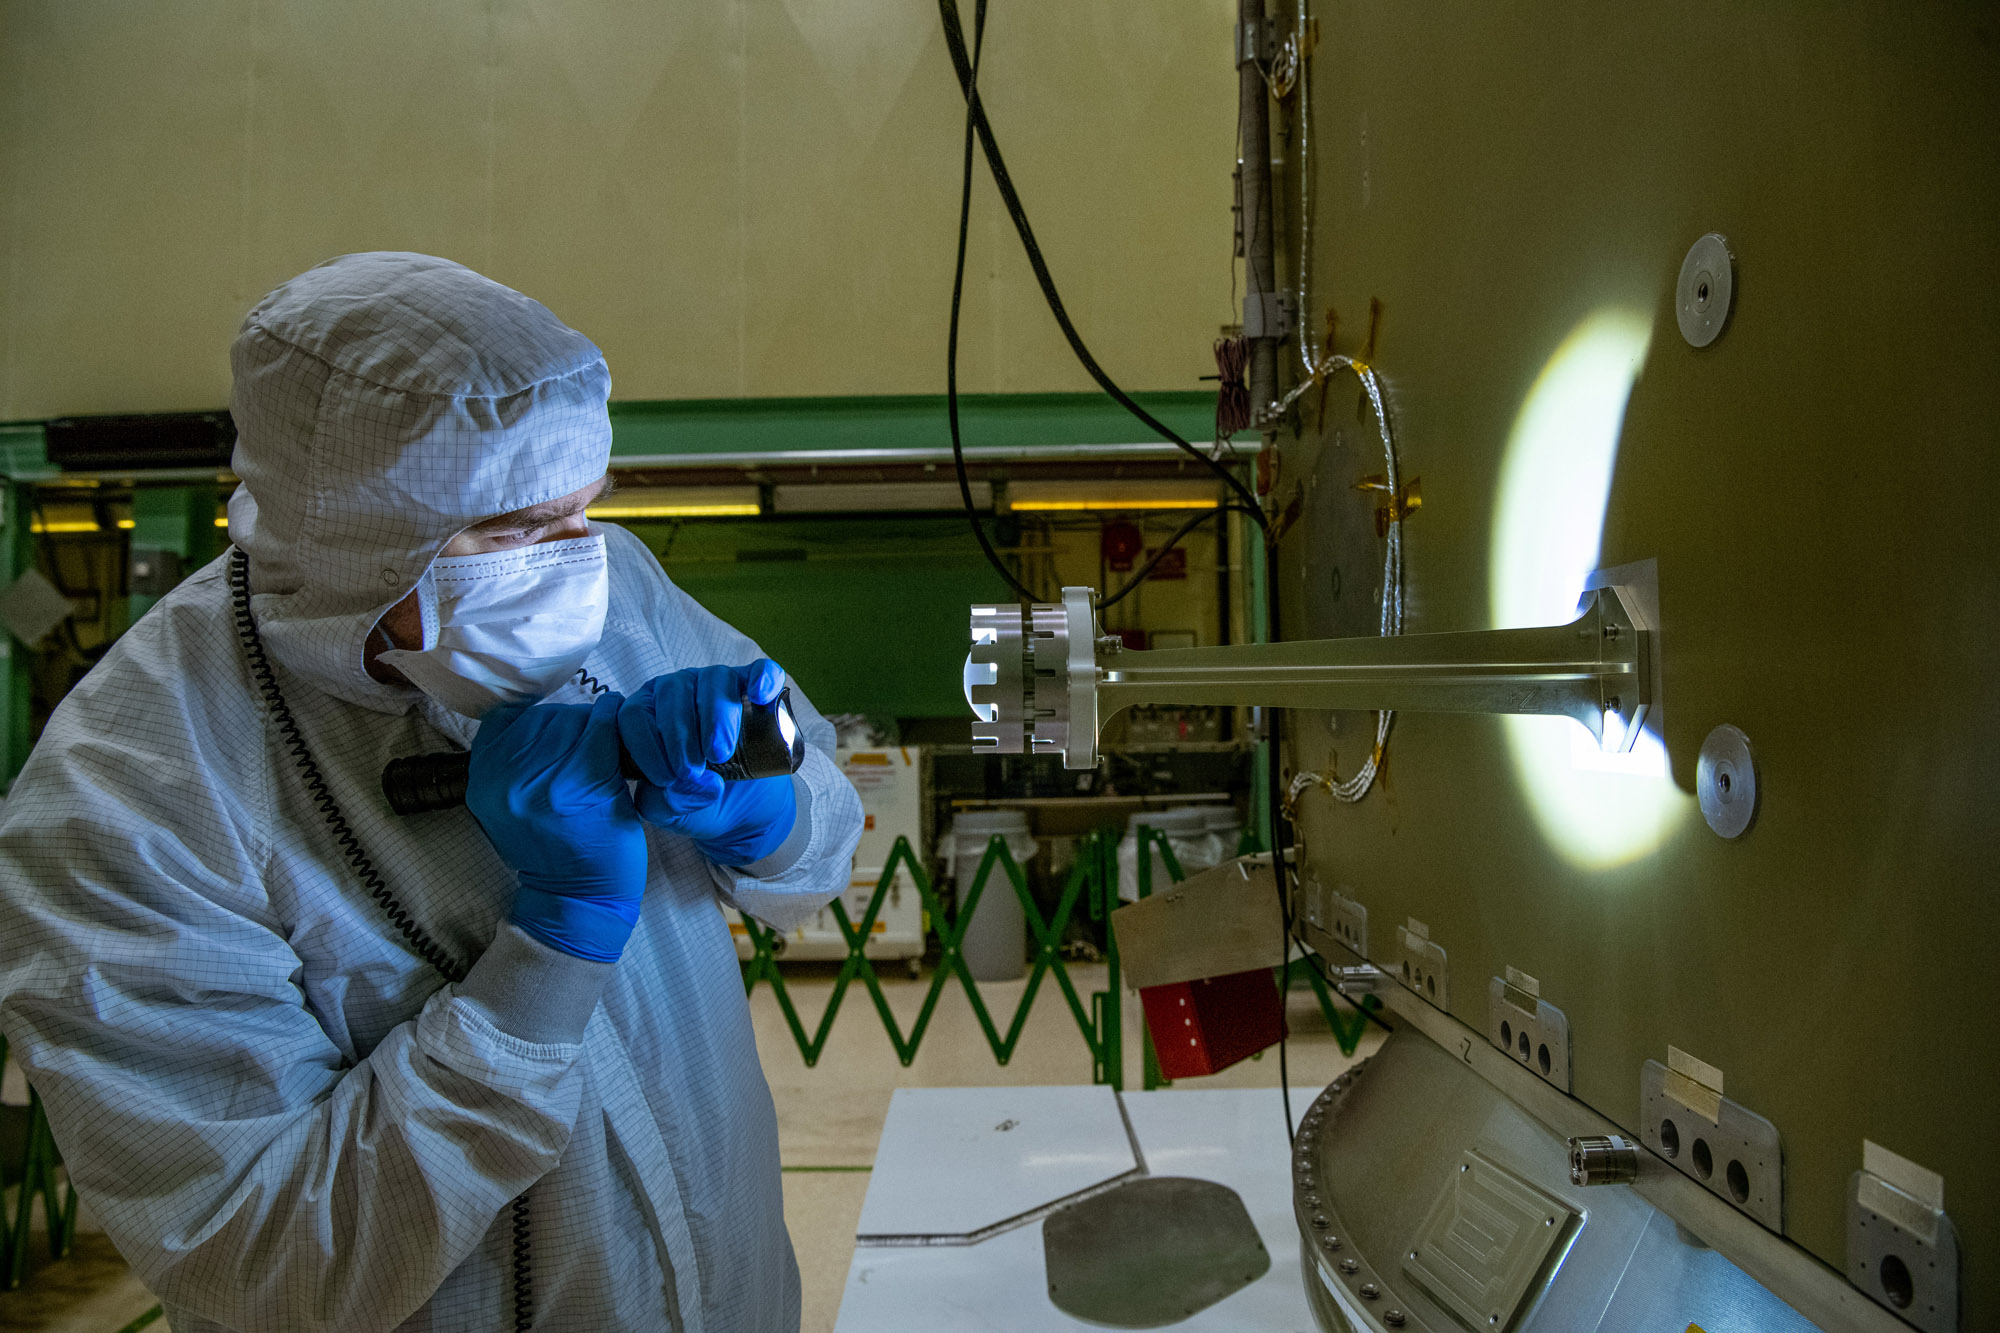
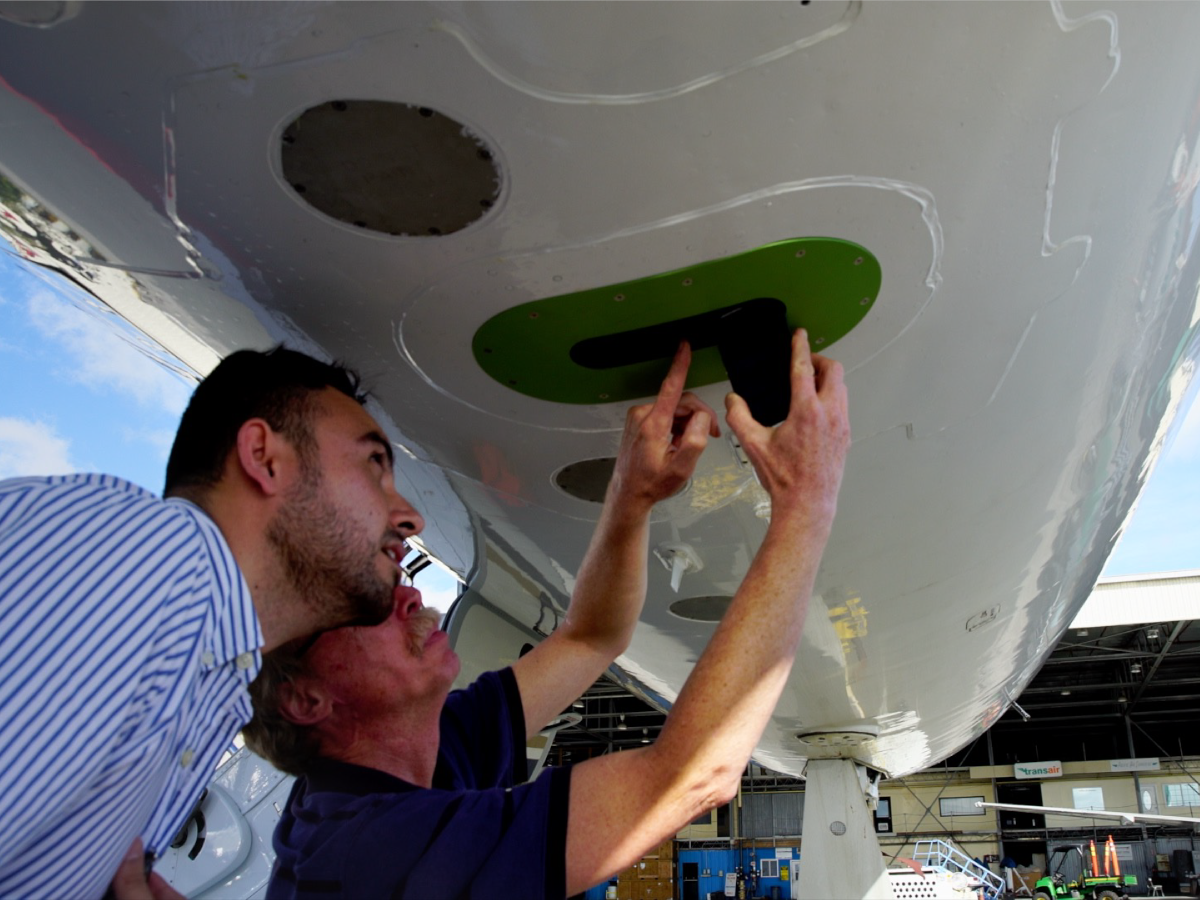
The red object is known as a "hat," which shields PACE's Earth coverage antenna and prevents emission of radiation during testing. Credit: Henry, Dennis (Denny)
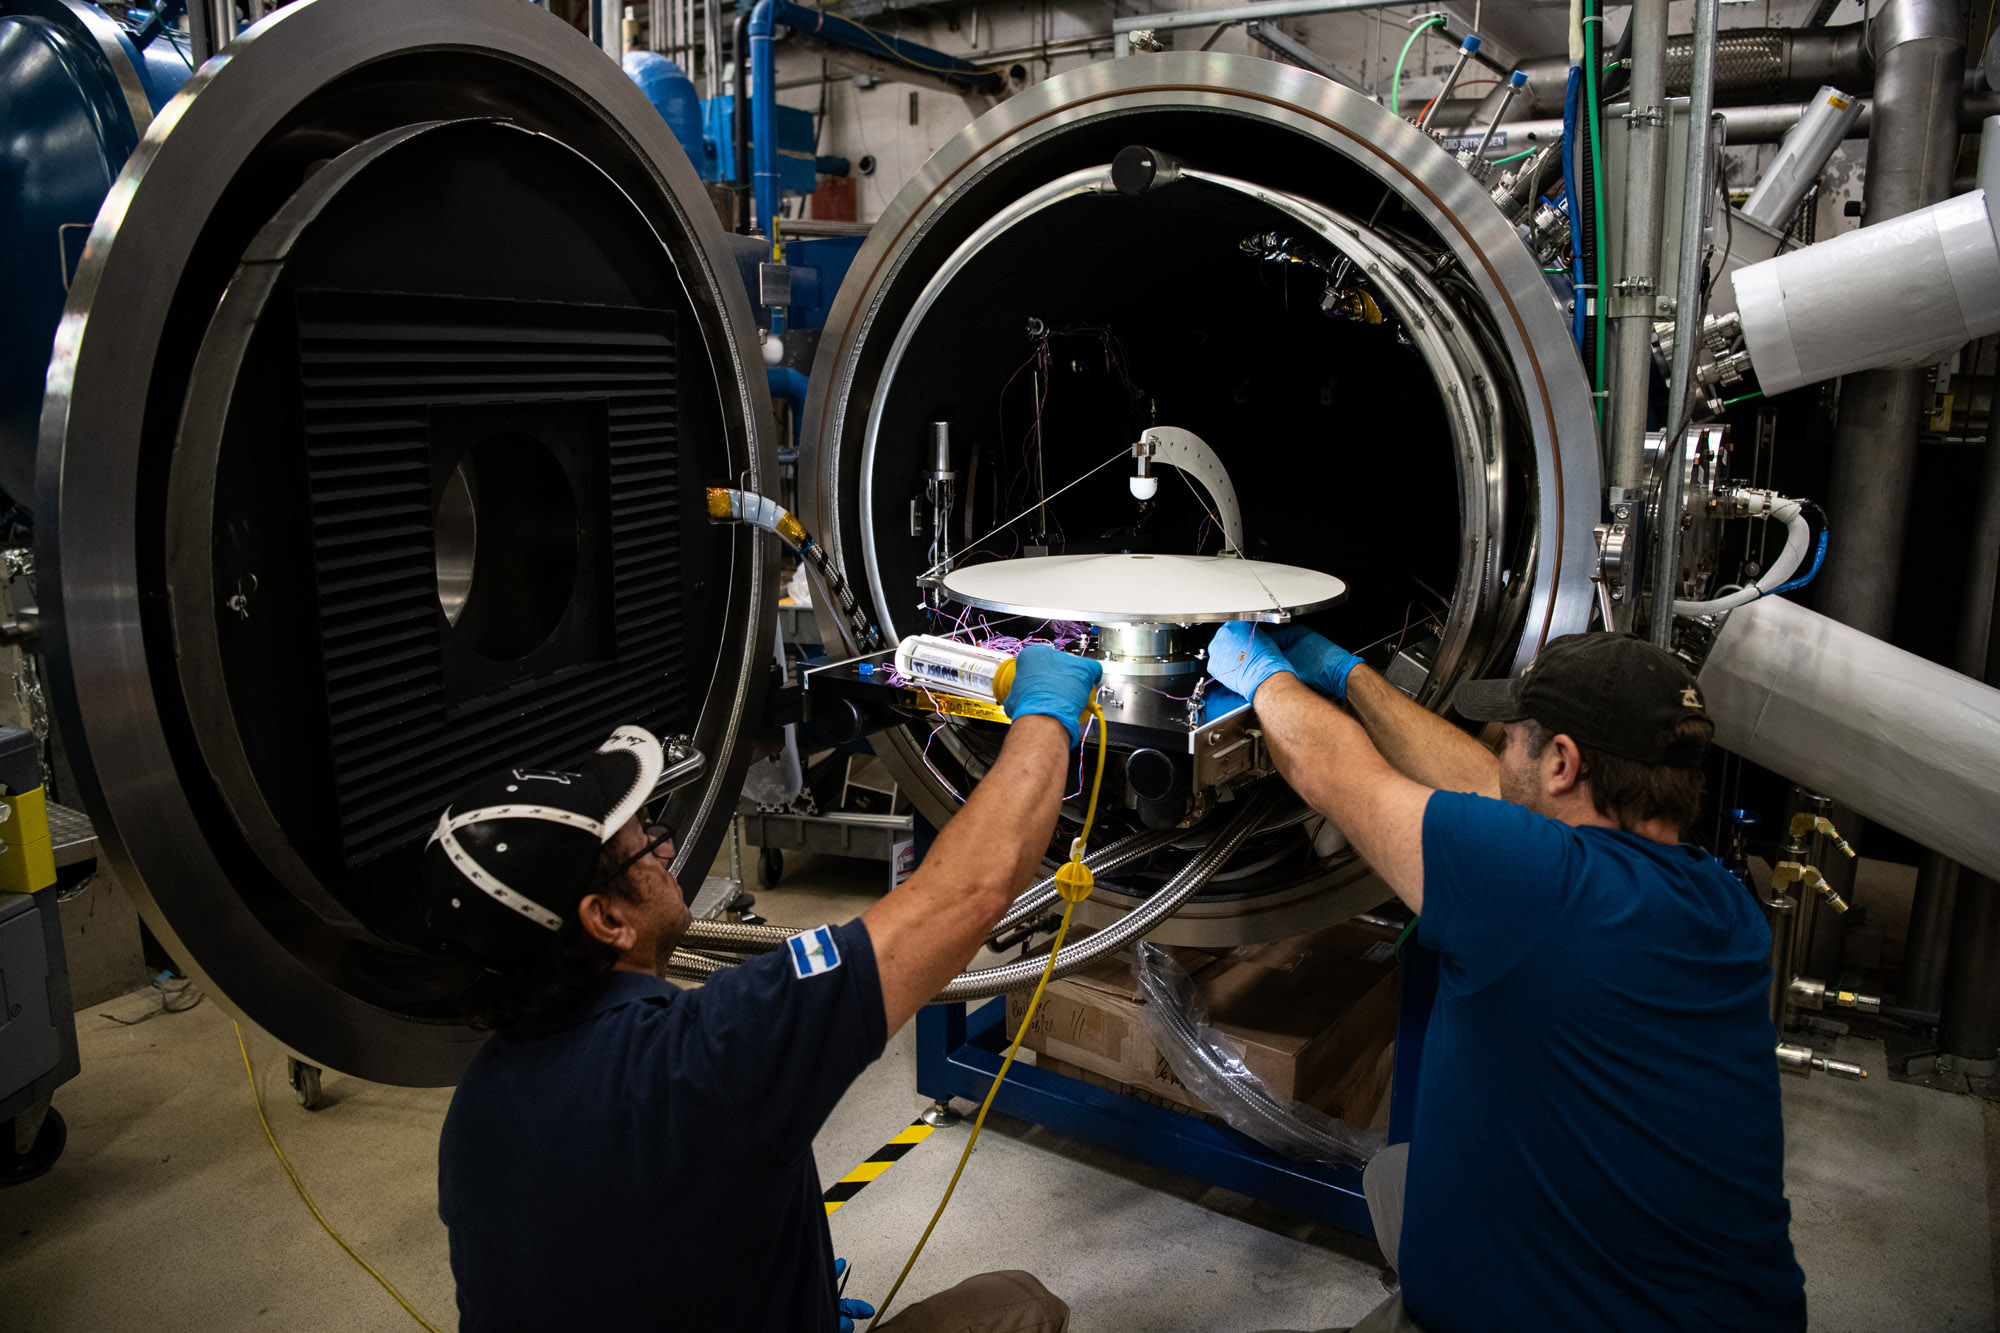
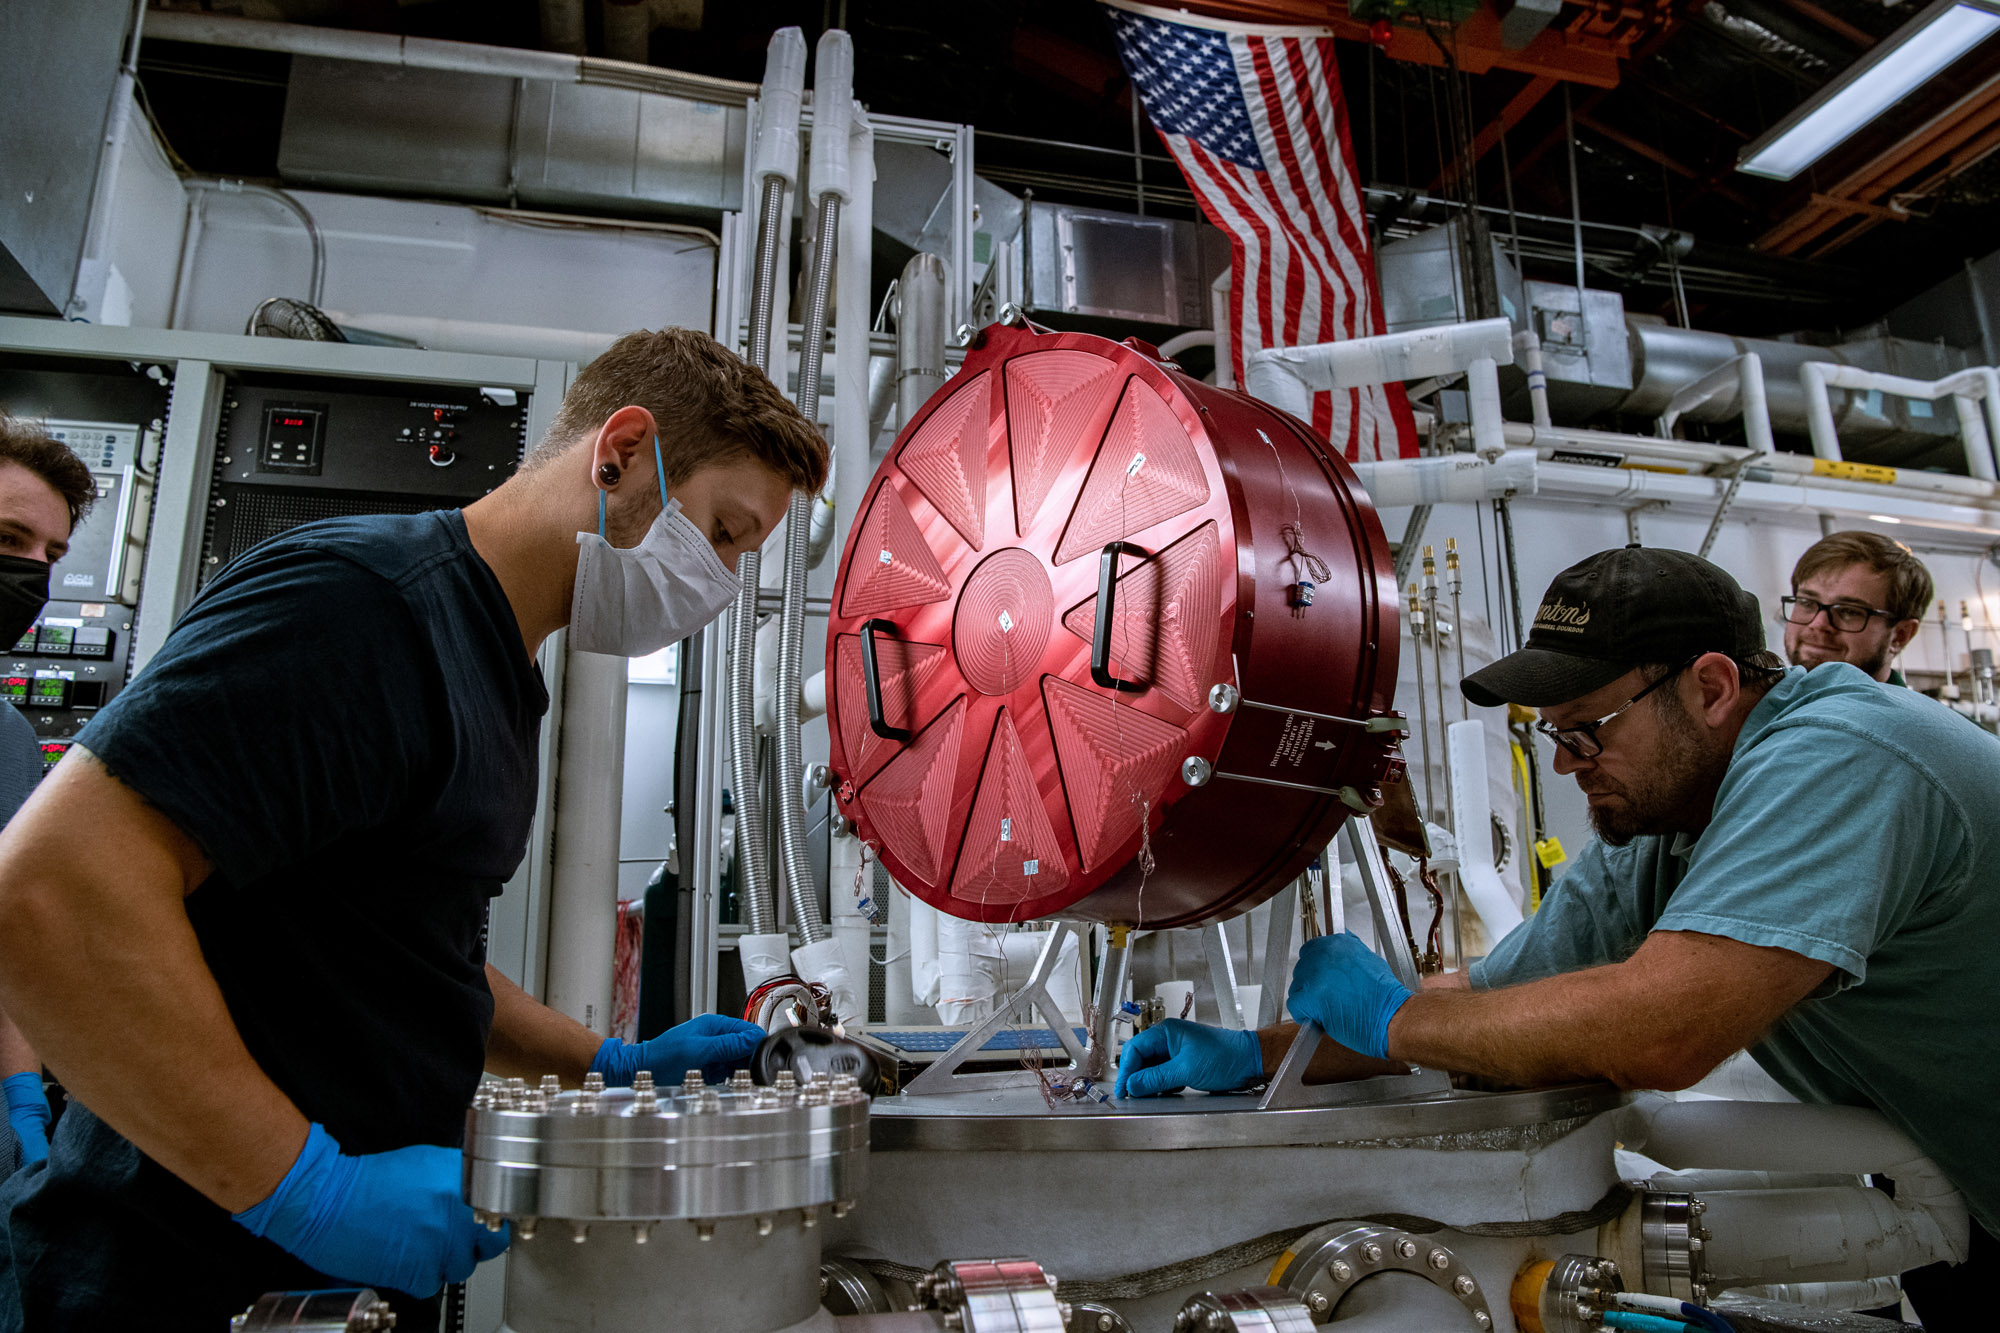
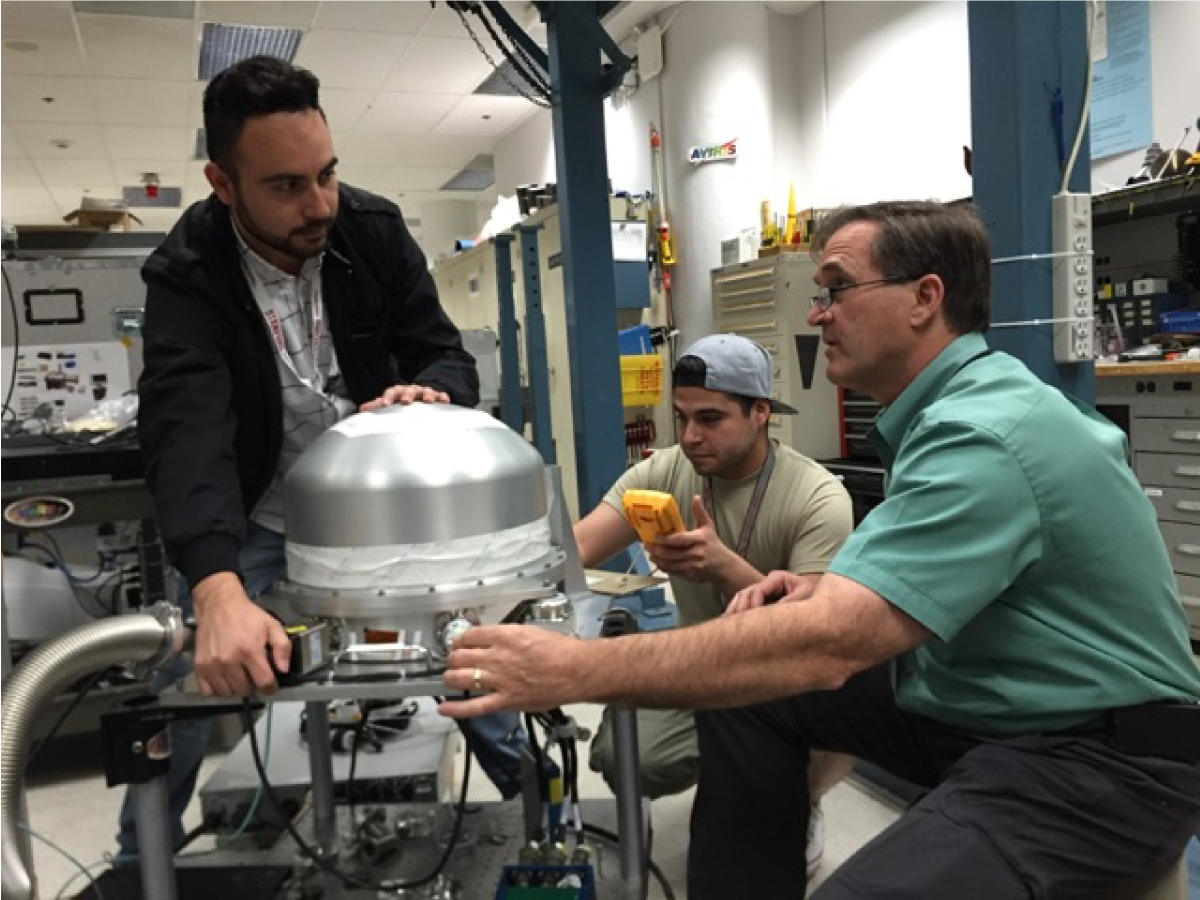
Thermal vacuum test of Ka-band Earth coverage antenna. Credit: Henry, Dennis (Denny)
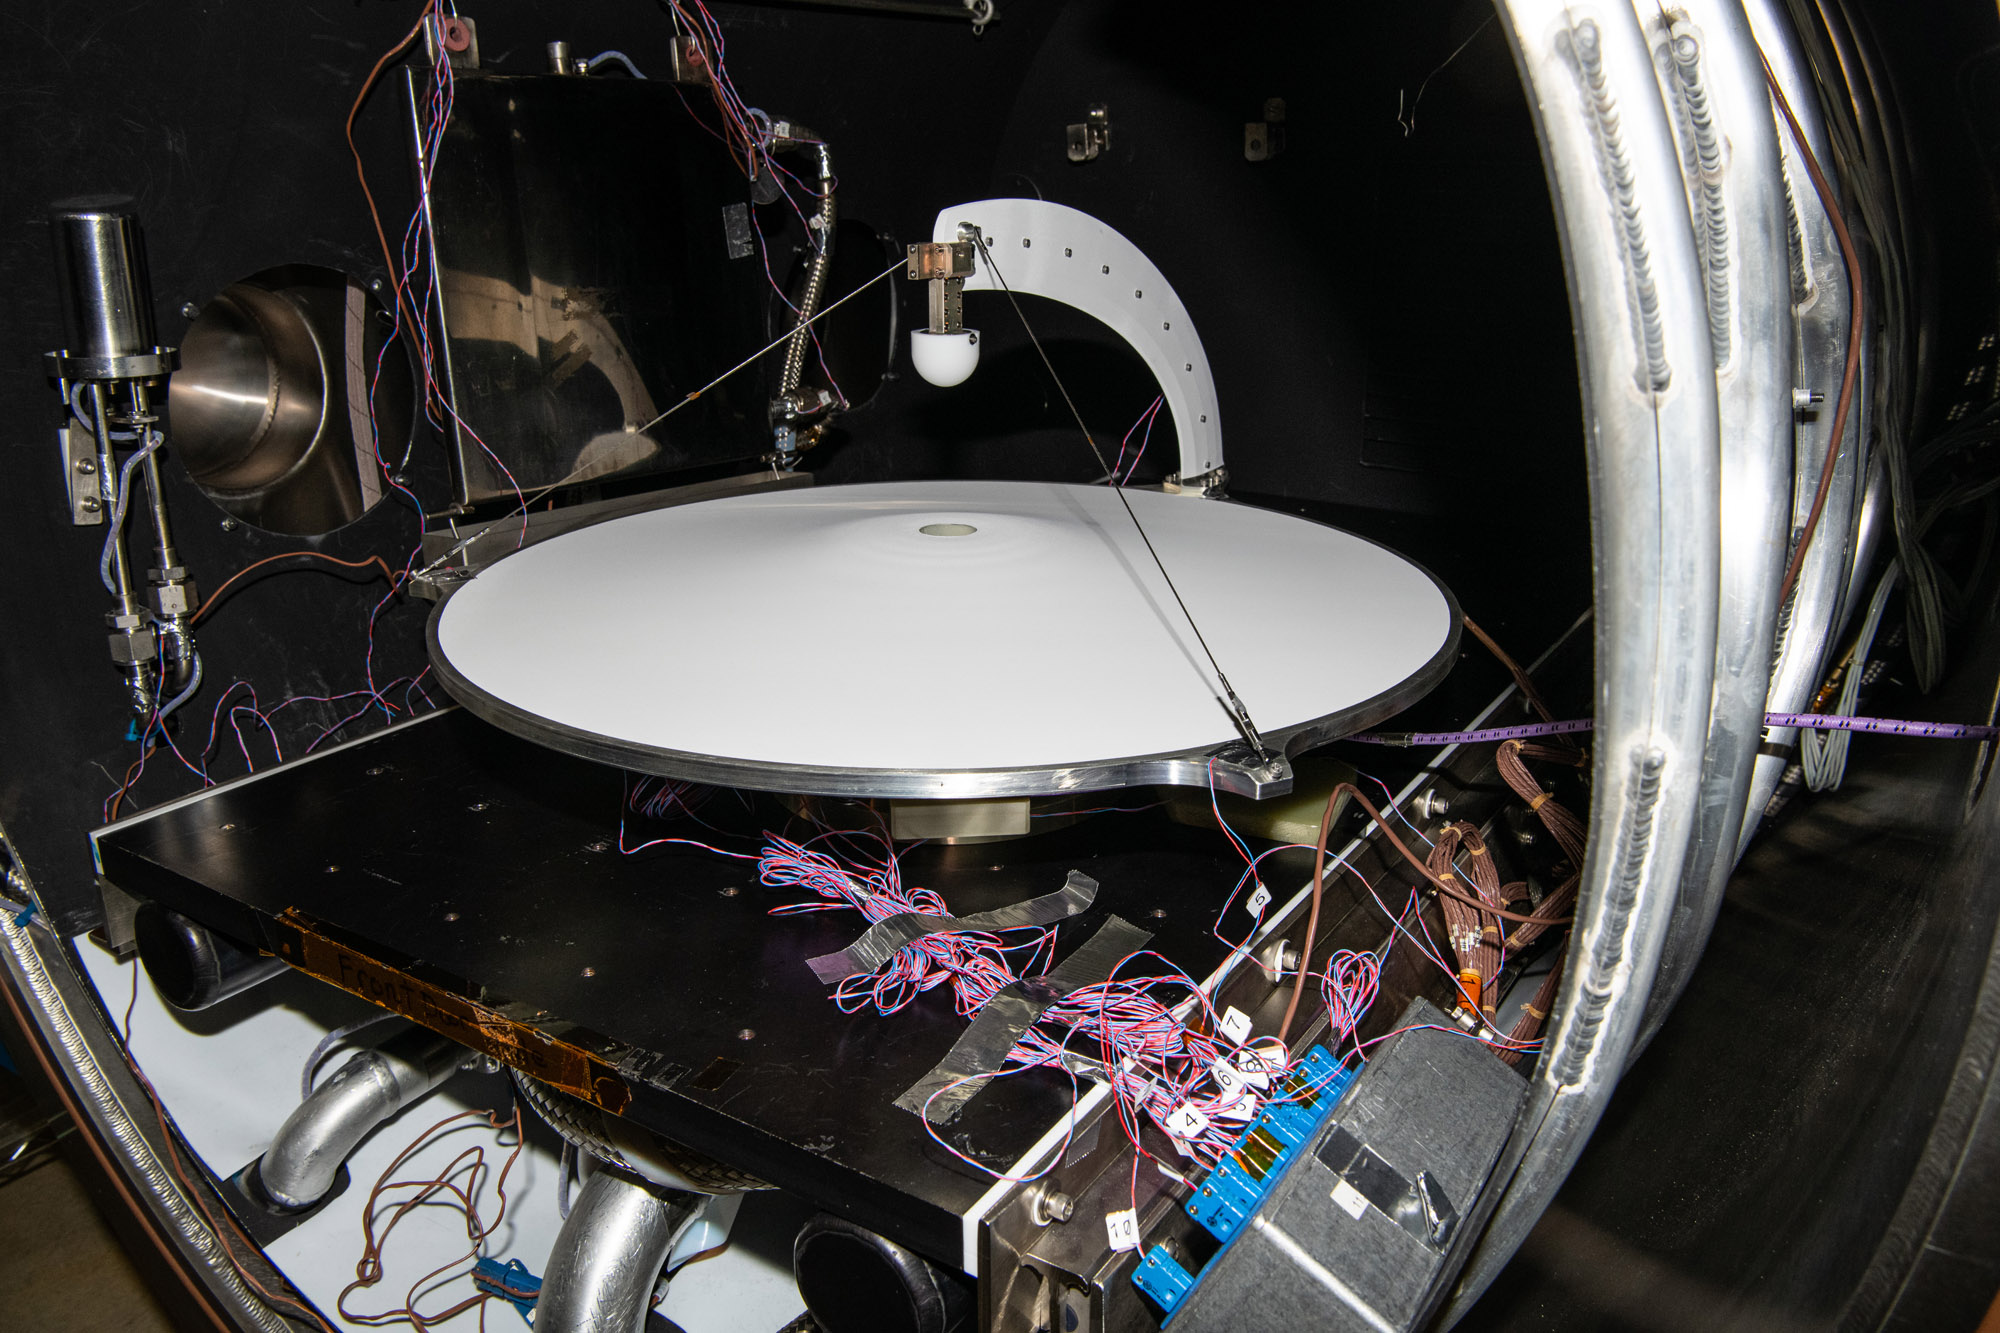
Thermal vacuum test of Ka-band Earth coverage antenna. Credit: Henry, Dennis (Denny)
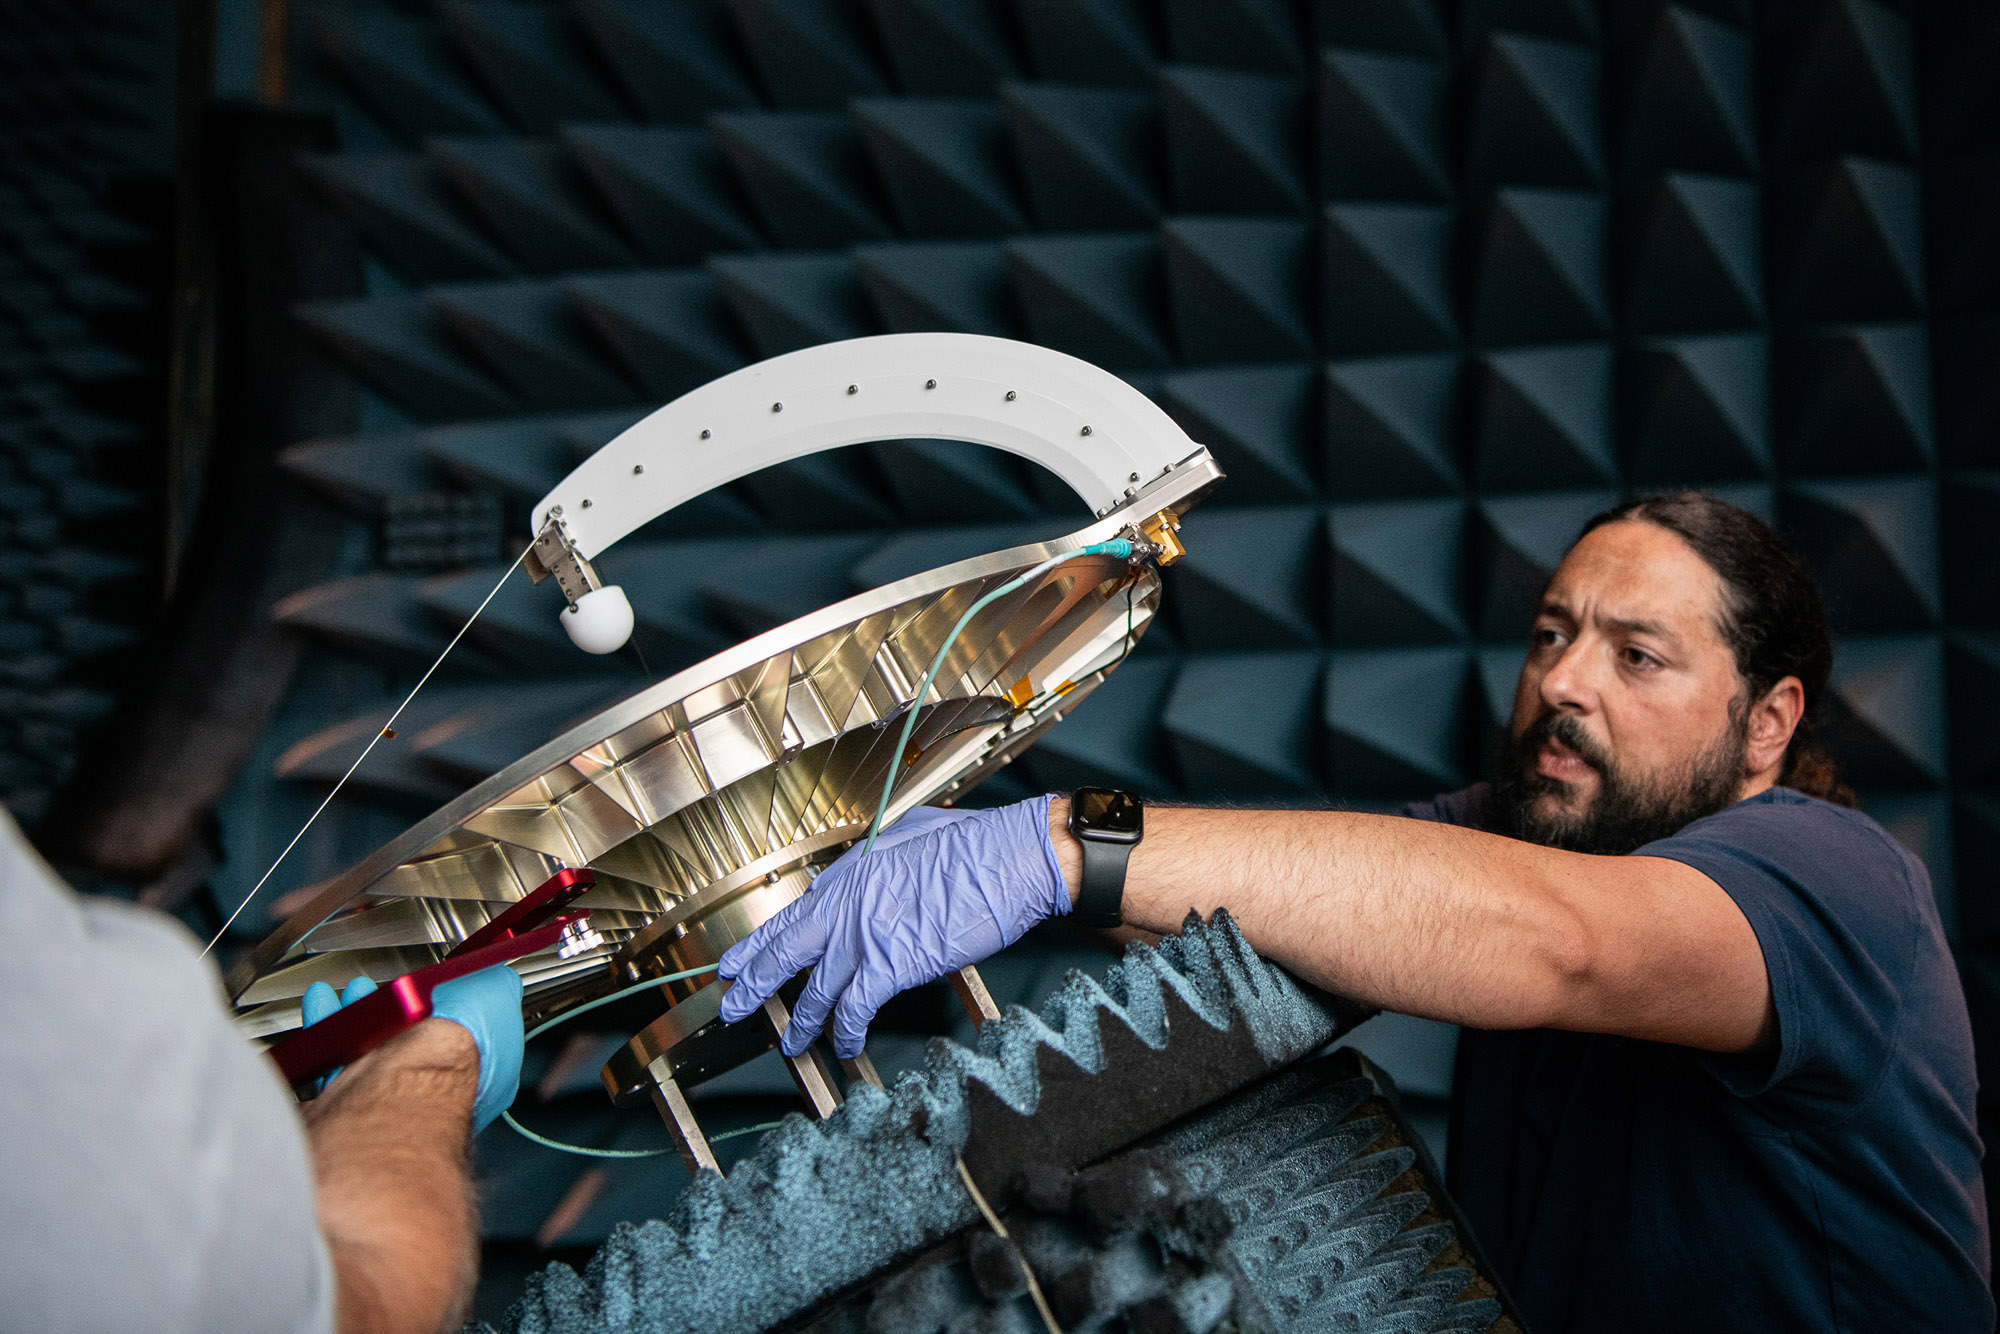
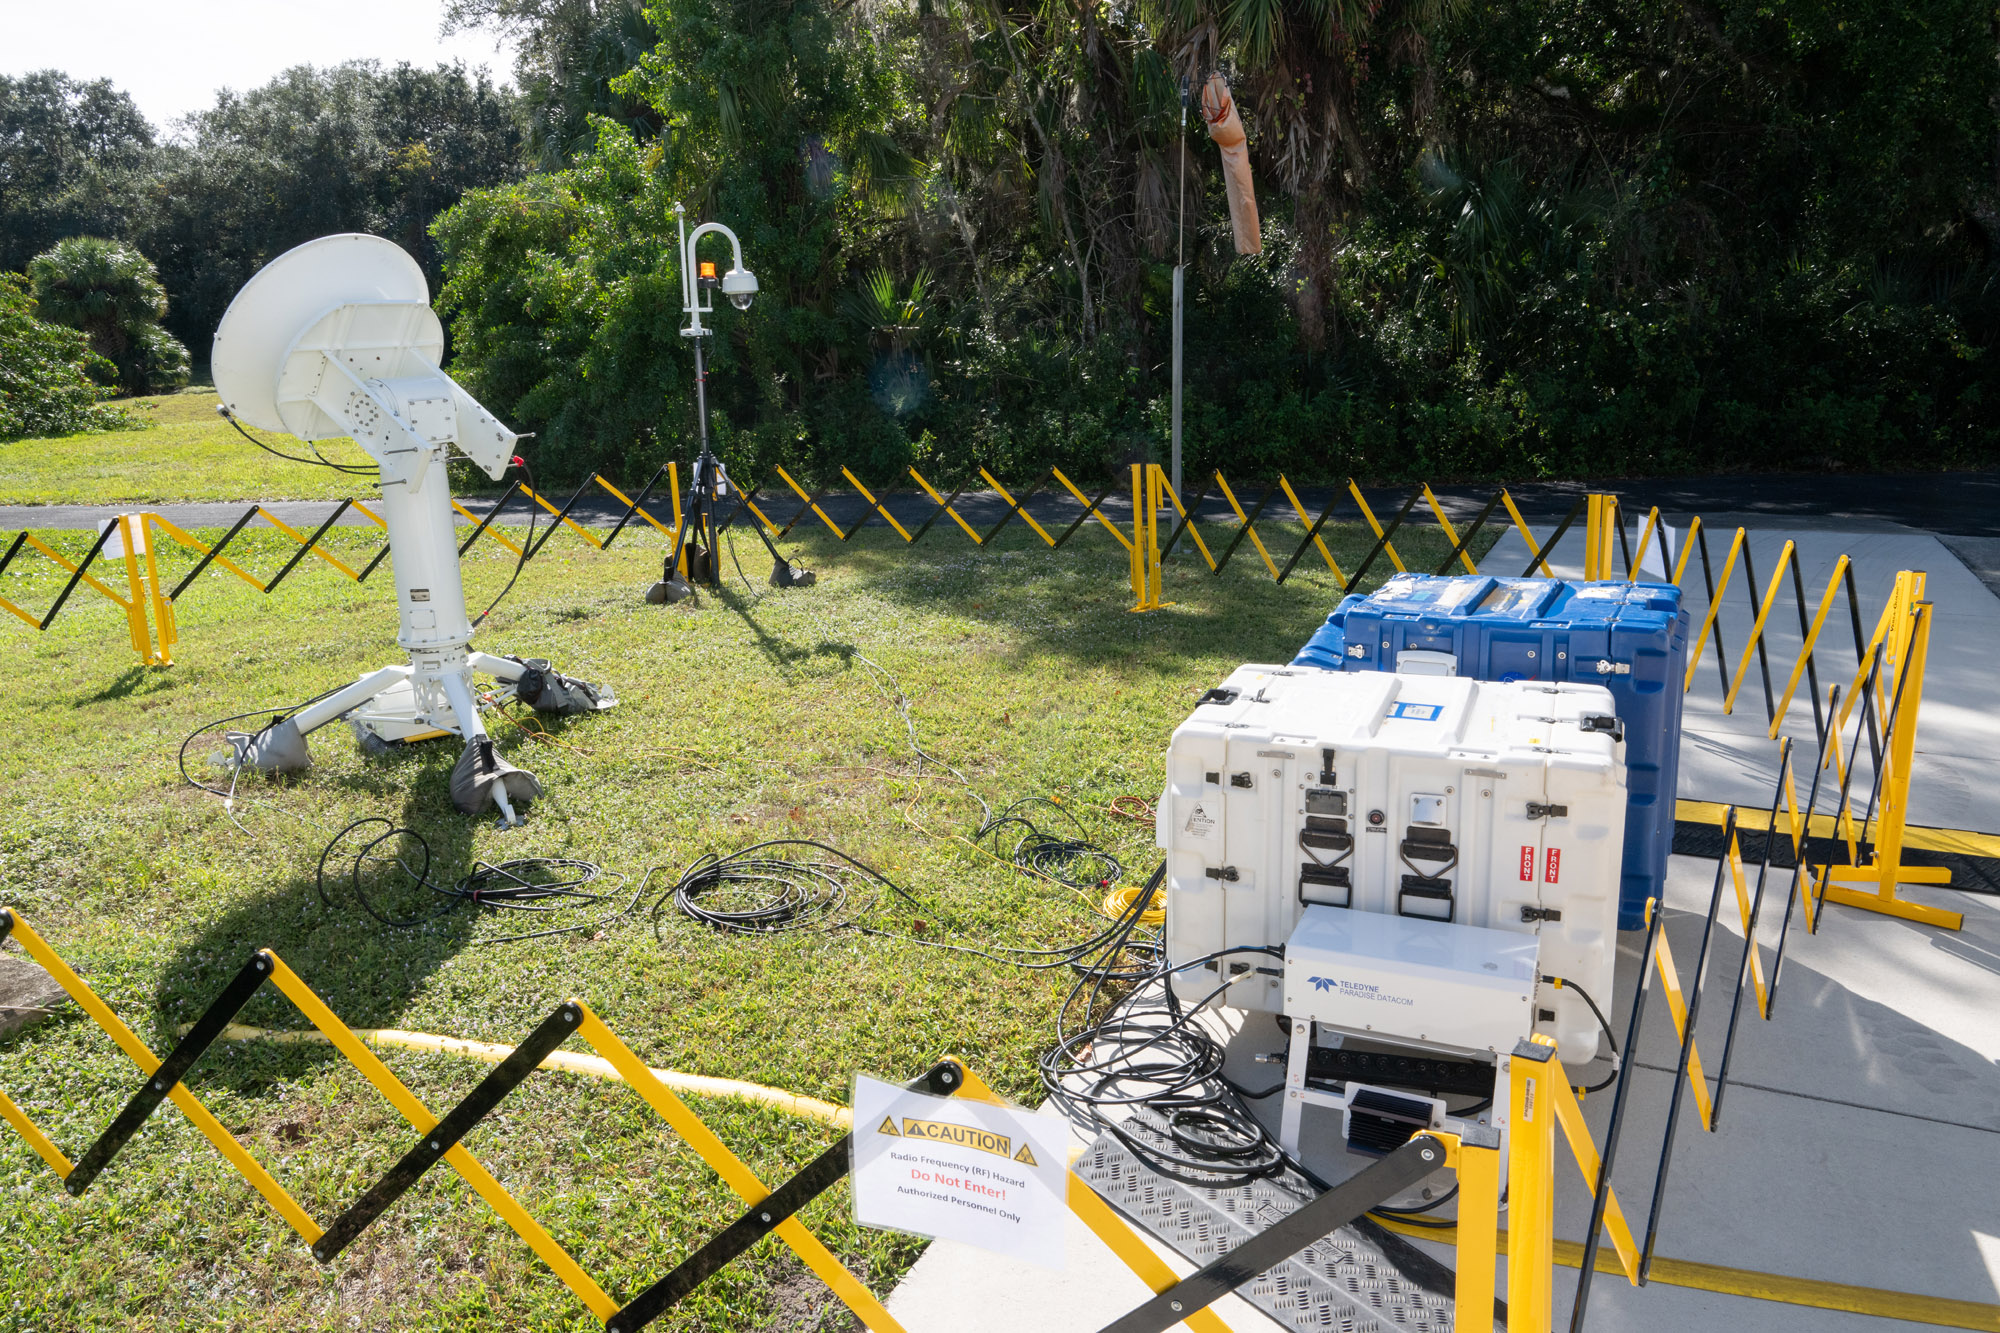
Radiofrequency testing setup after spacecraft vibration test. Credit: Henry, Dennis (Denny)
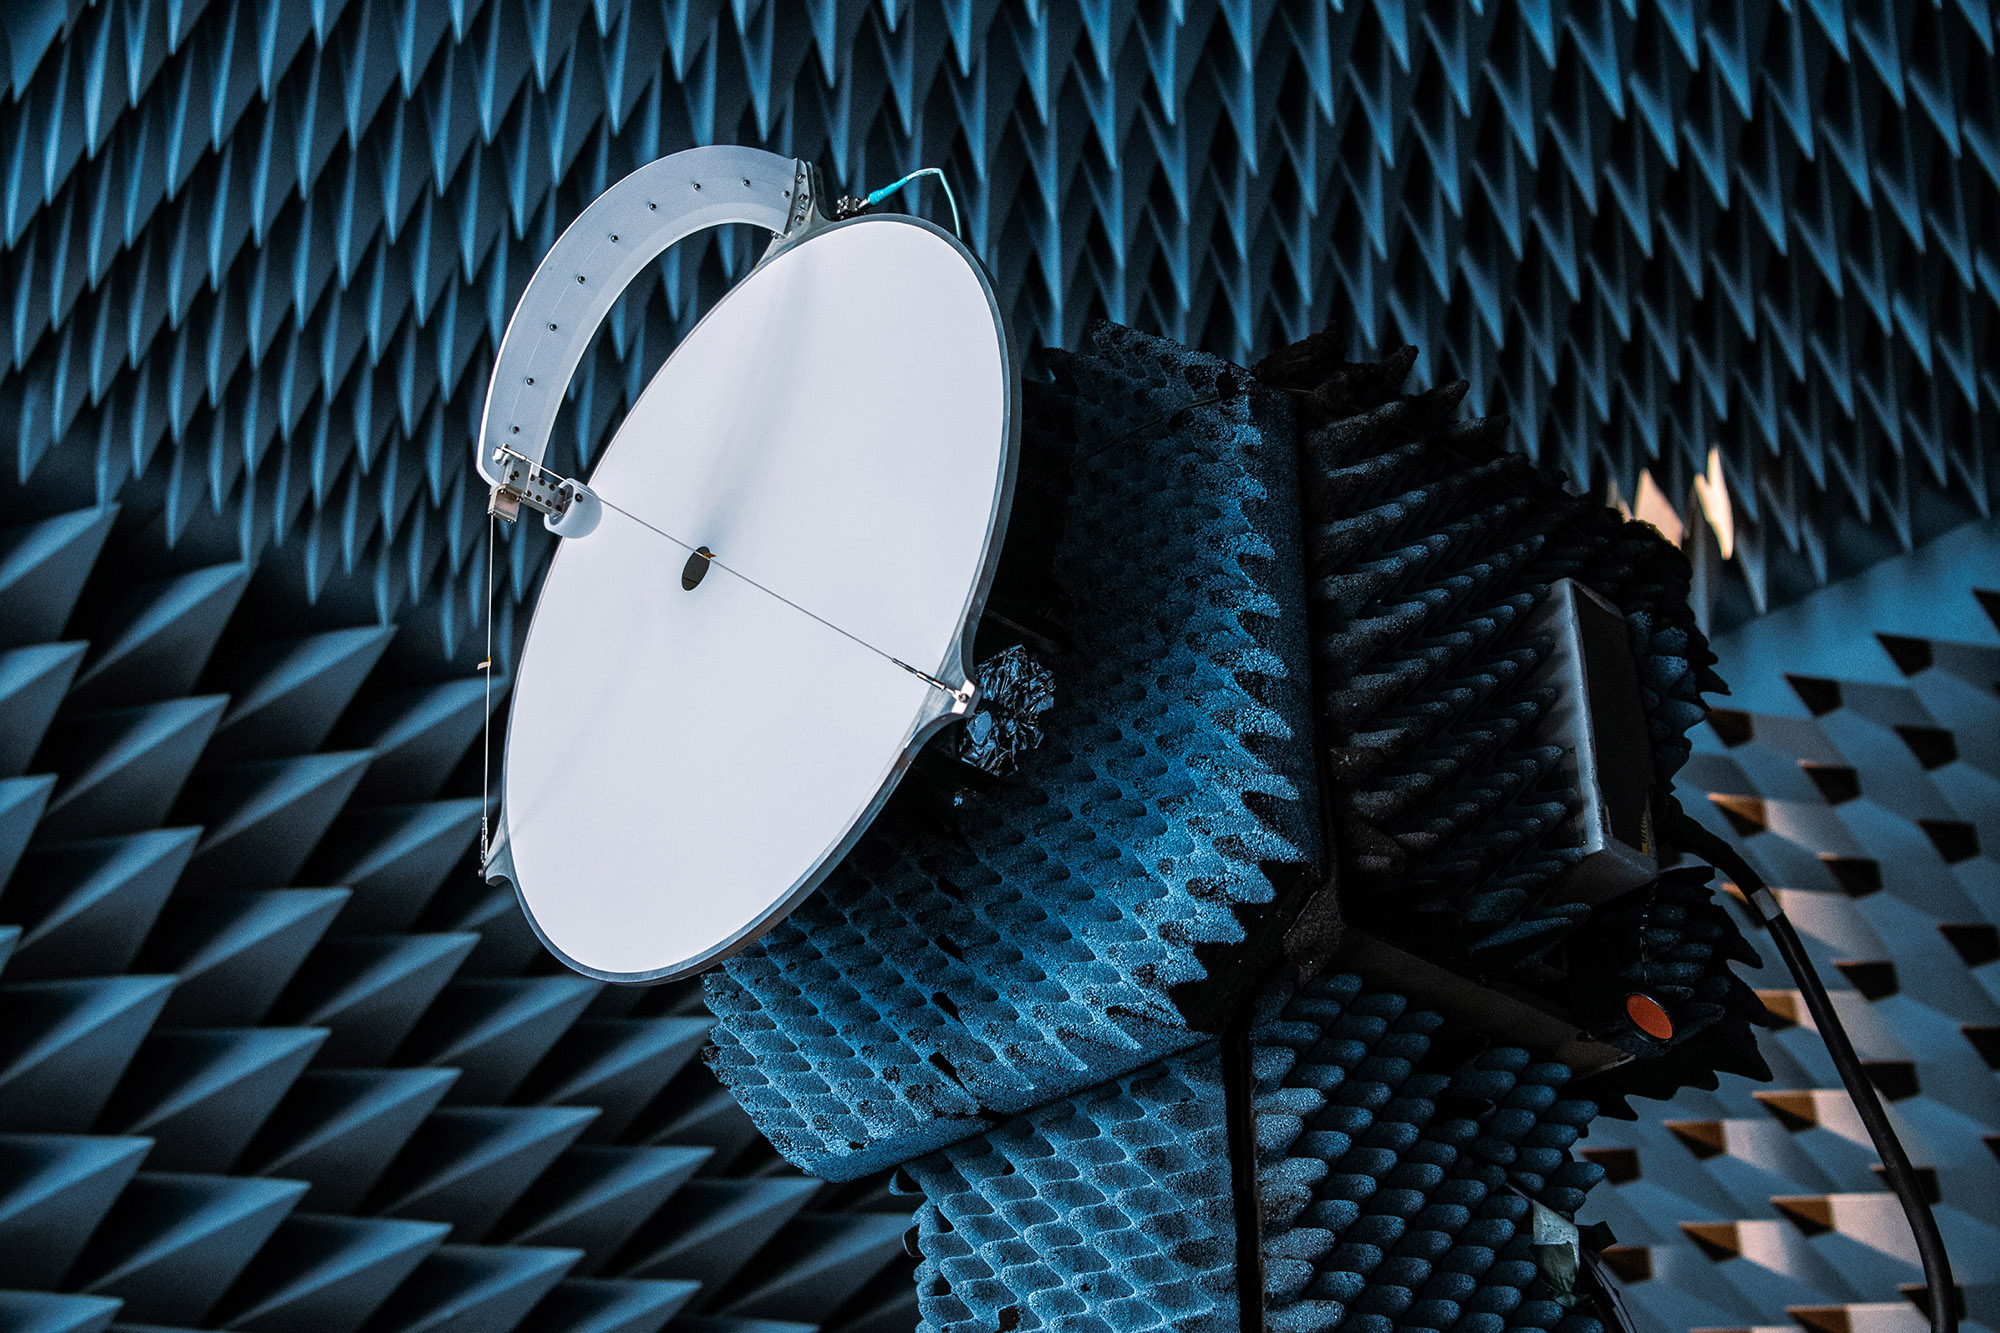
Setting up for radiofrequency testing. Credit: Henry, Dennis (Denny)
PACE Control room. Credit: Henry, Dennis (Denny)
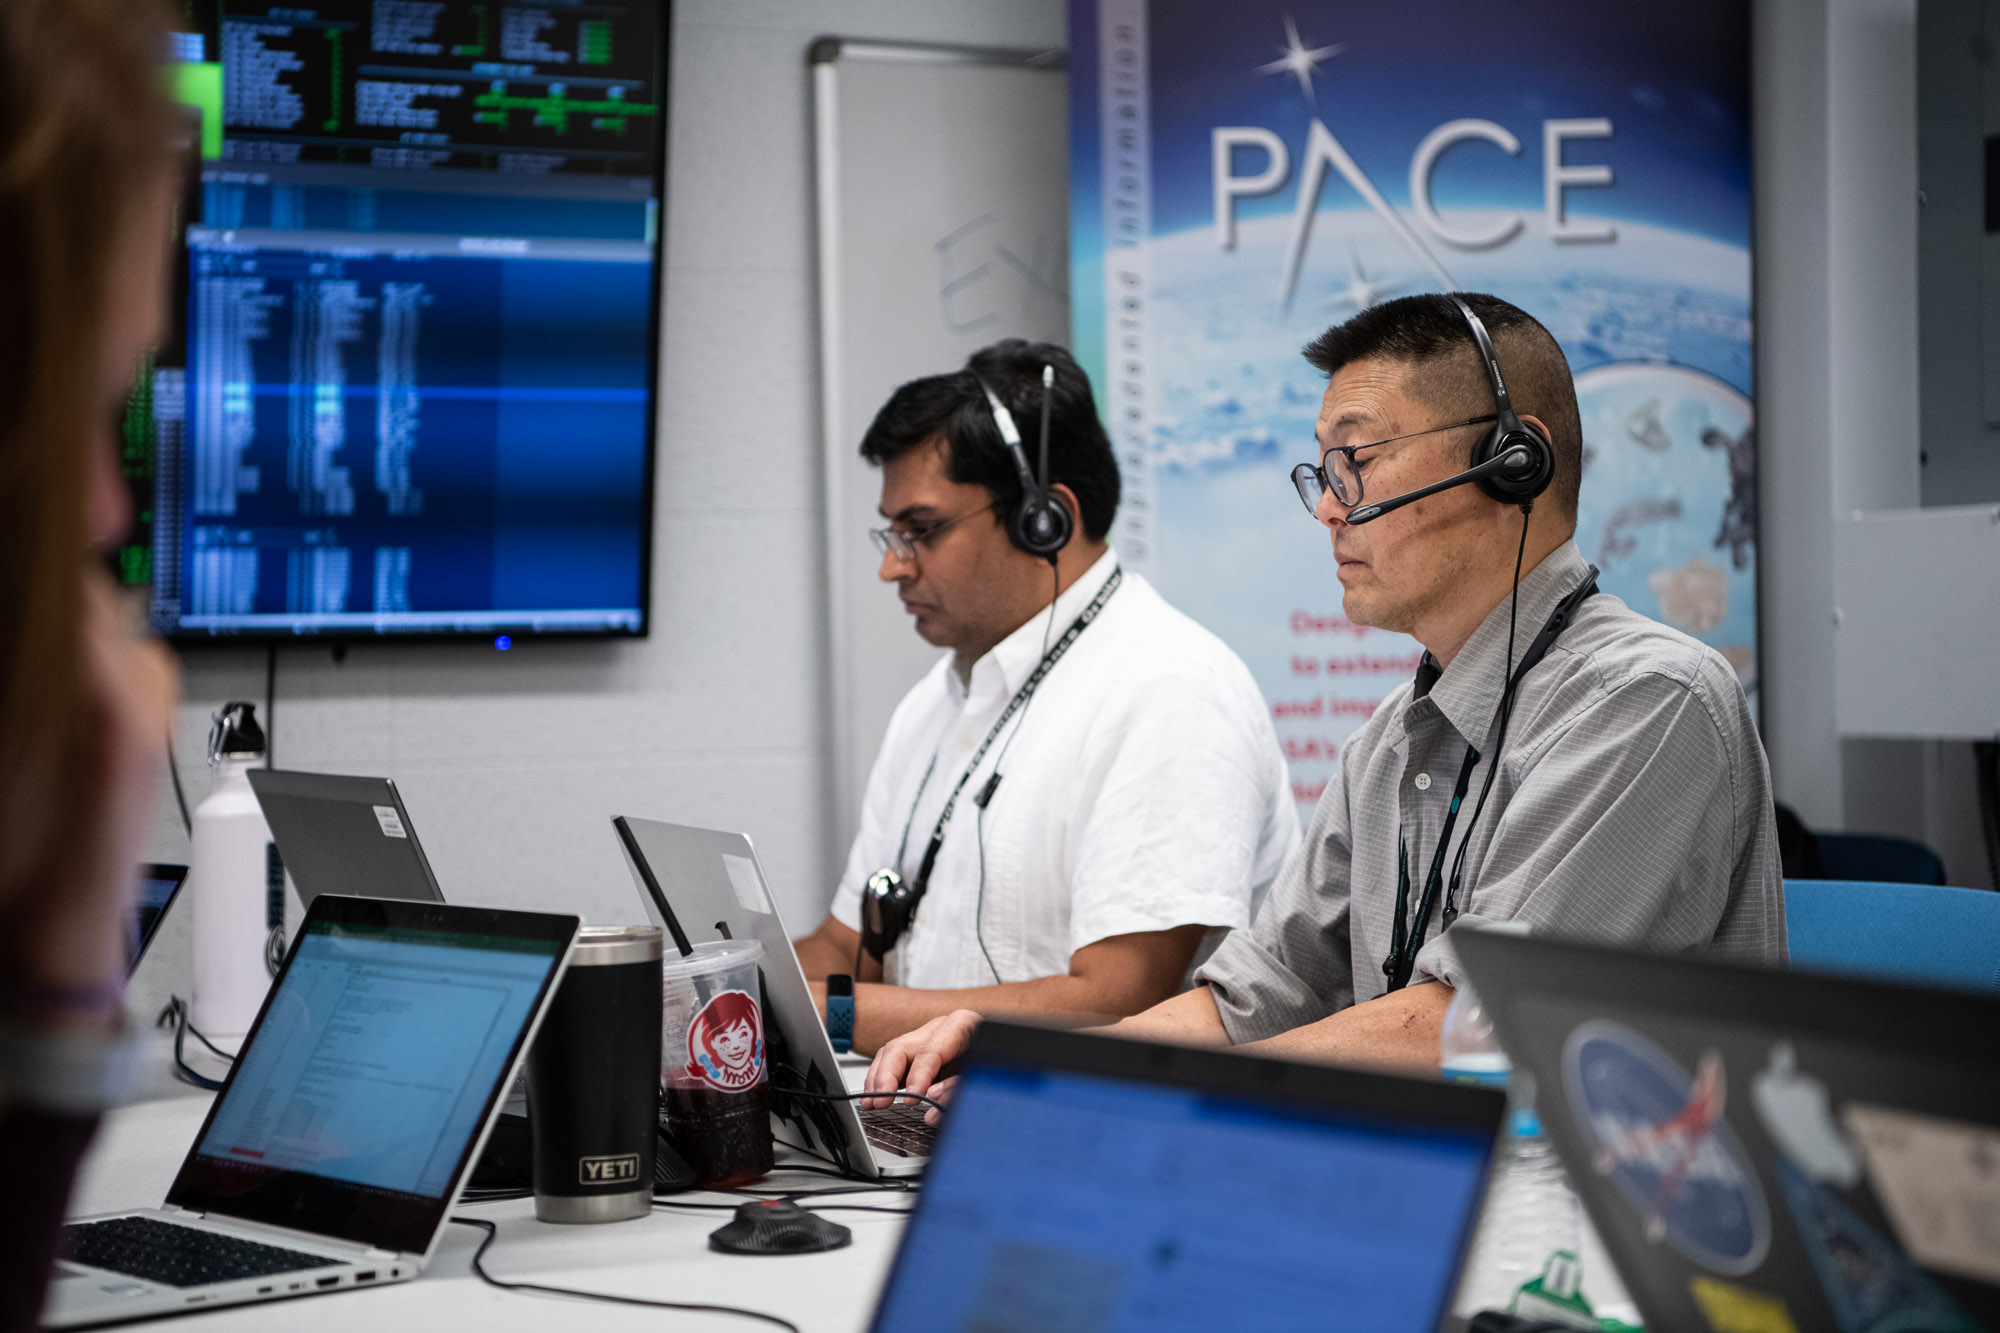
PACE Control room. Credit: Henry, Dennis (Denny)
Lifting Structural Verification Unit out of chamber for the Sine Vibration Test. Credit: Henry, Dennis (Denny)
Installing Low Gain Antenna on PACE Spacecraft bus. Credit: Henry, Dennis (Denny)
Aligning the solar arrays and Structural Verification Unit to perform electrical tests. Credit: Lambert, Barbara
Lifting PACE Structural Verification Unit onto Aronson Table for engineering tests. Credit: Lambert, Barbara
Opened -Y Panel. Credit: Henry, Dennis (Denny)
Installing bus Star Tracker Sensor on the PACE -Z Panel. Credit: Henry, Dennis (Denny)
Installing the bus Star Tracker Sensor on the -Z Panel. Credit: Lambert, Barbara
Installing Star Tracker Sensor on the -Z Panel. Credit: Henry, Dennis (Denny)
Inspecting the PACE Star Tracker Sensor. Credit: Lambert, Barbara
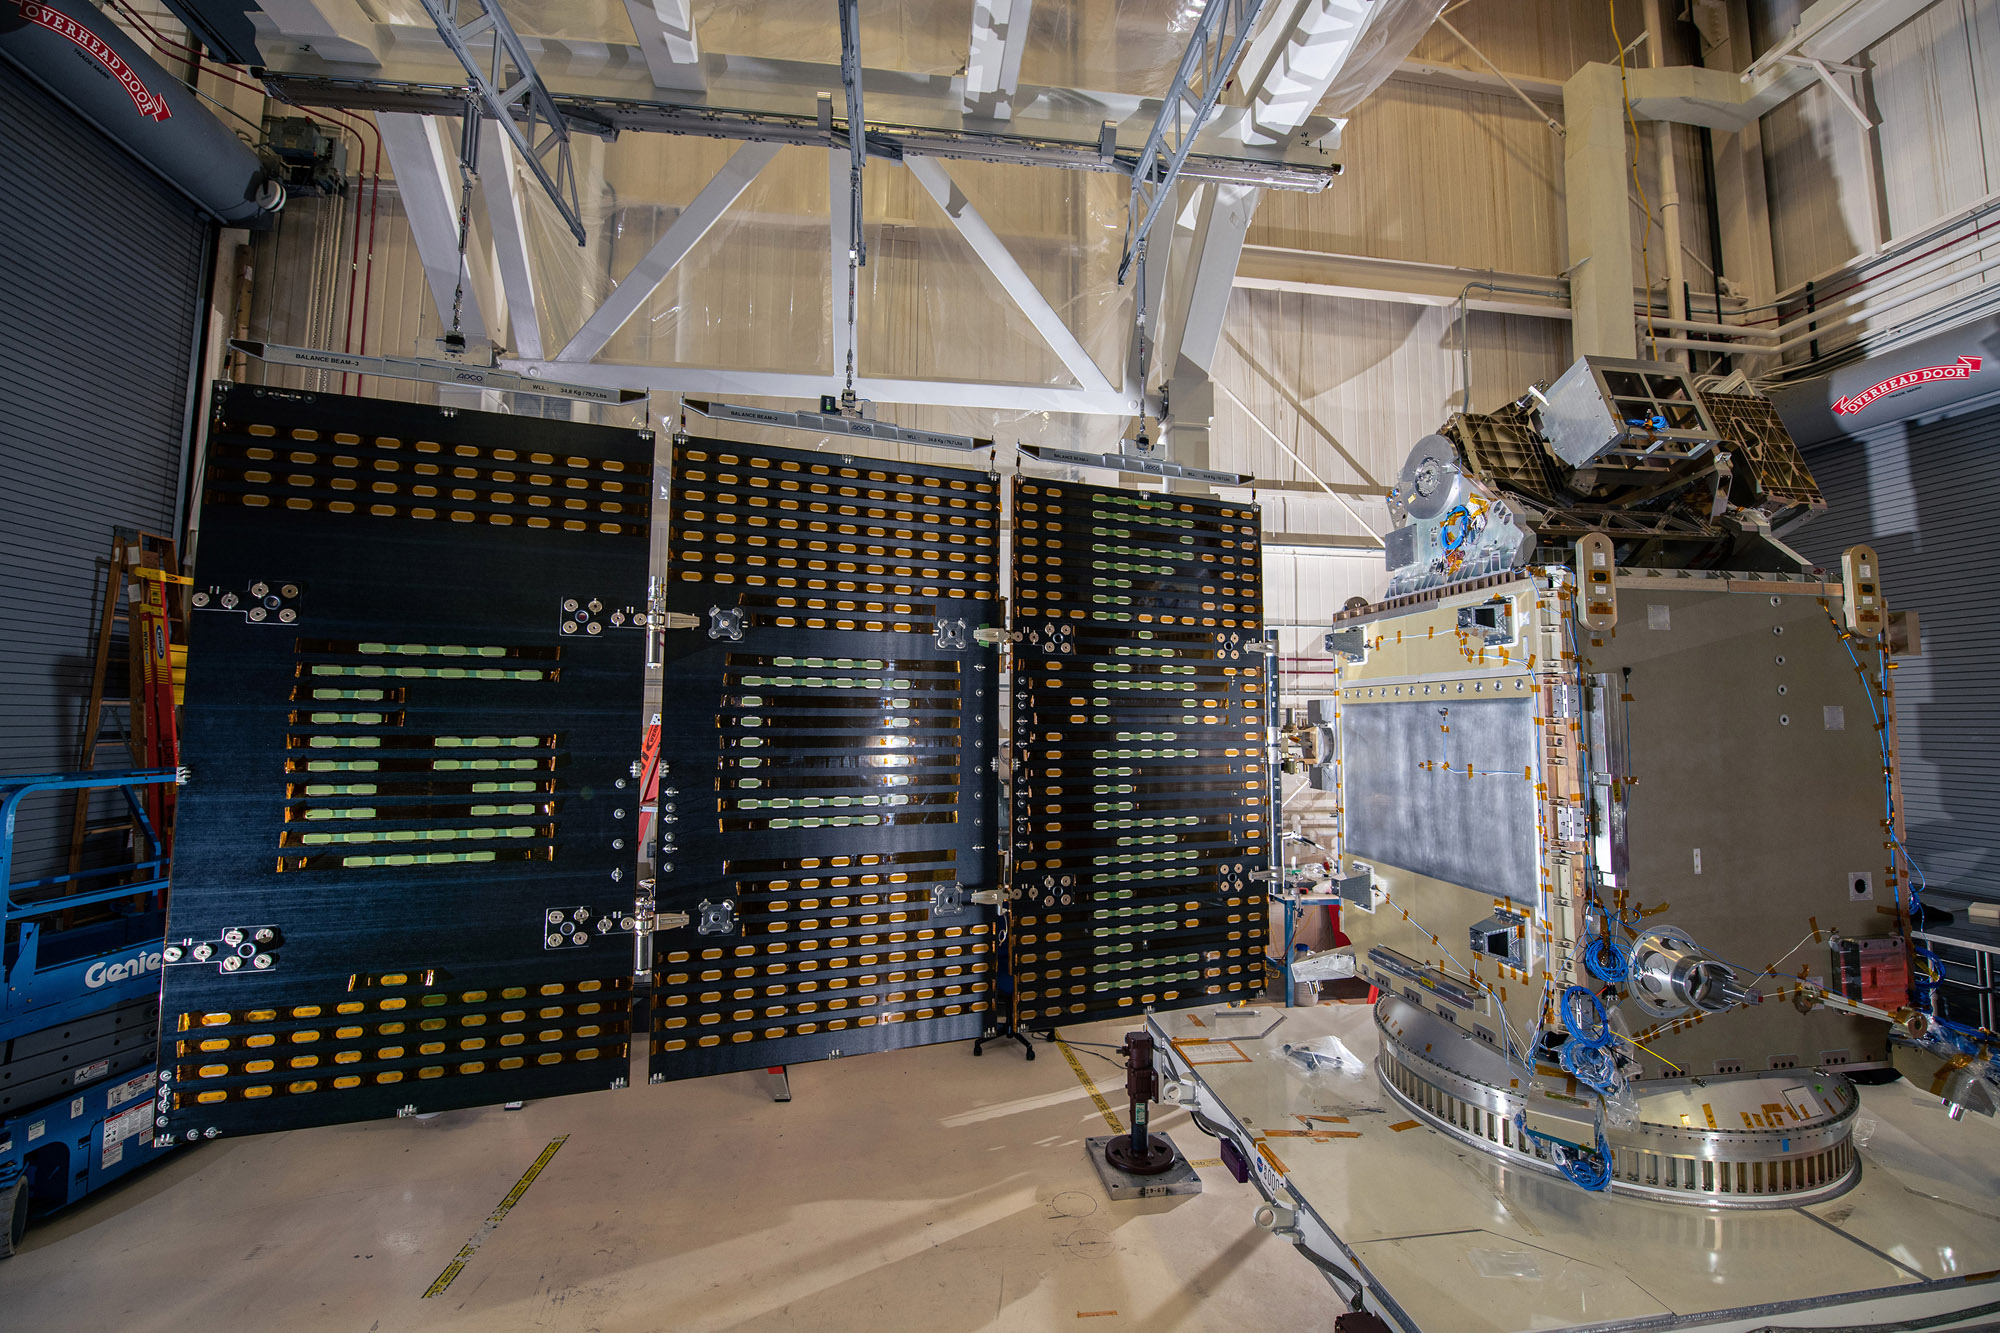
Inspection and electrical testing of PACE Flight Solar Array Panels. Credit: Henry, Dennis (Denny)
Alignment team working on the PACE spacecraft. Credit: Henry, Dennis (Denny)
Alignment team working on the PACE spacecraft. Credit: Henry, Dennis (Denny)
Testing solar array drive assembly on PACE spacecraft bus. Credit: Henry, Dennis (Denny)
Installing the solar array drive assembly on the PACE spacecraft bus. Credit: Lambert, Barbara
Overall photos of spacecraft after solar array drive assembly install. Credit: Lambert, Barbara
PACE spacecraft team checking alignment data. Credit: Henry, Dennis (Denny)
PACE engineering test unit for solar array drive assembly wing setup. Credit: Henry, Dennis (Denny)
PACE engineering test unit for solar array drive assembly walkouts on the gantry. Credit: Henry, Dennis (Denny)
Tightening bolts on the PACE engineering test unit solar array drive assemblies wing setup. Credit: Lambert, Barbara
Measuring PACE engineering test unit solar array drive assemblies wing setup. Credit: Lambert, Barbara
Carlos Duran-Aviles with the PACE reaction wheel assembly. Credit: Lambert, Barbara
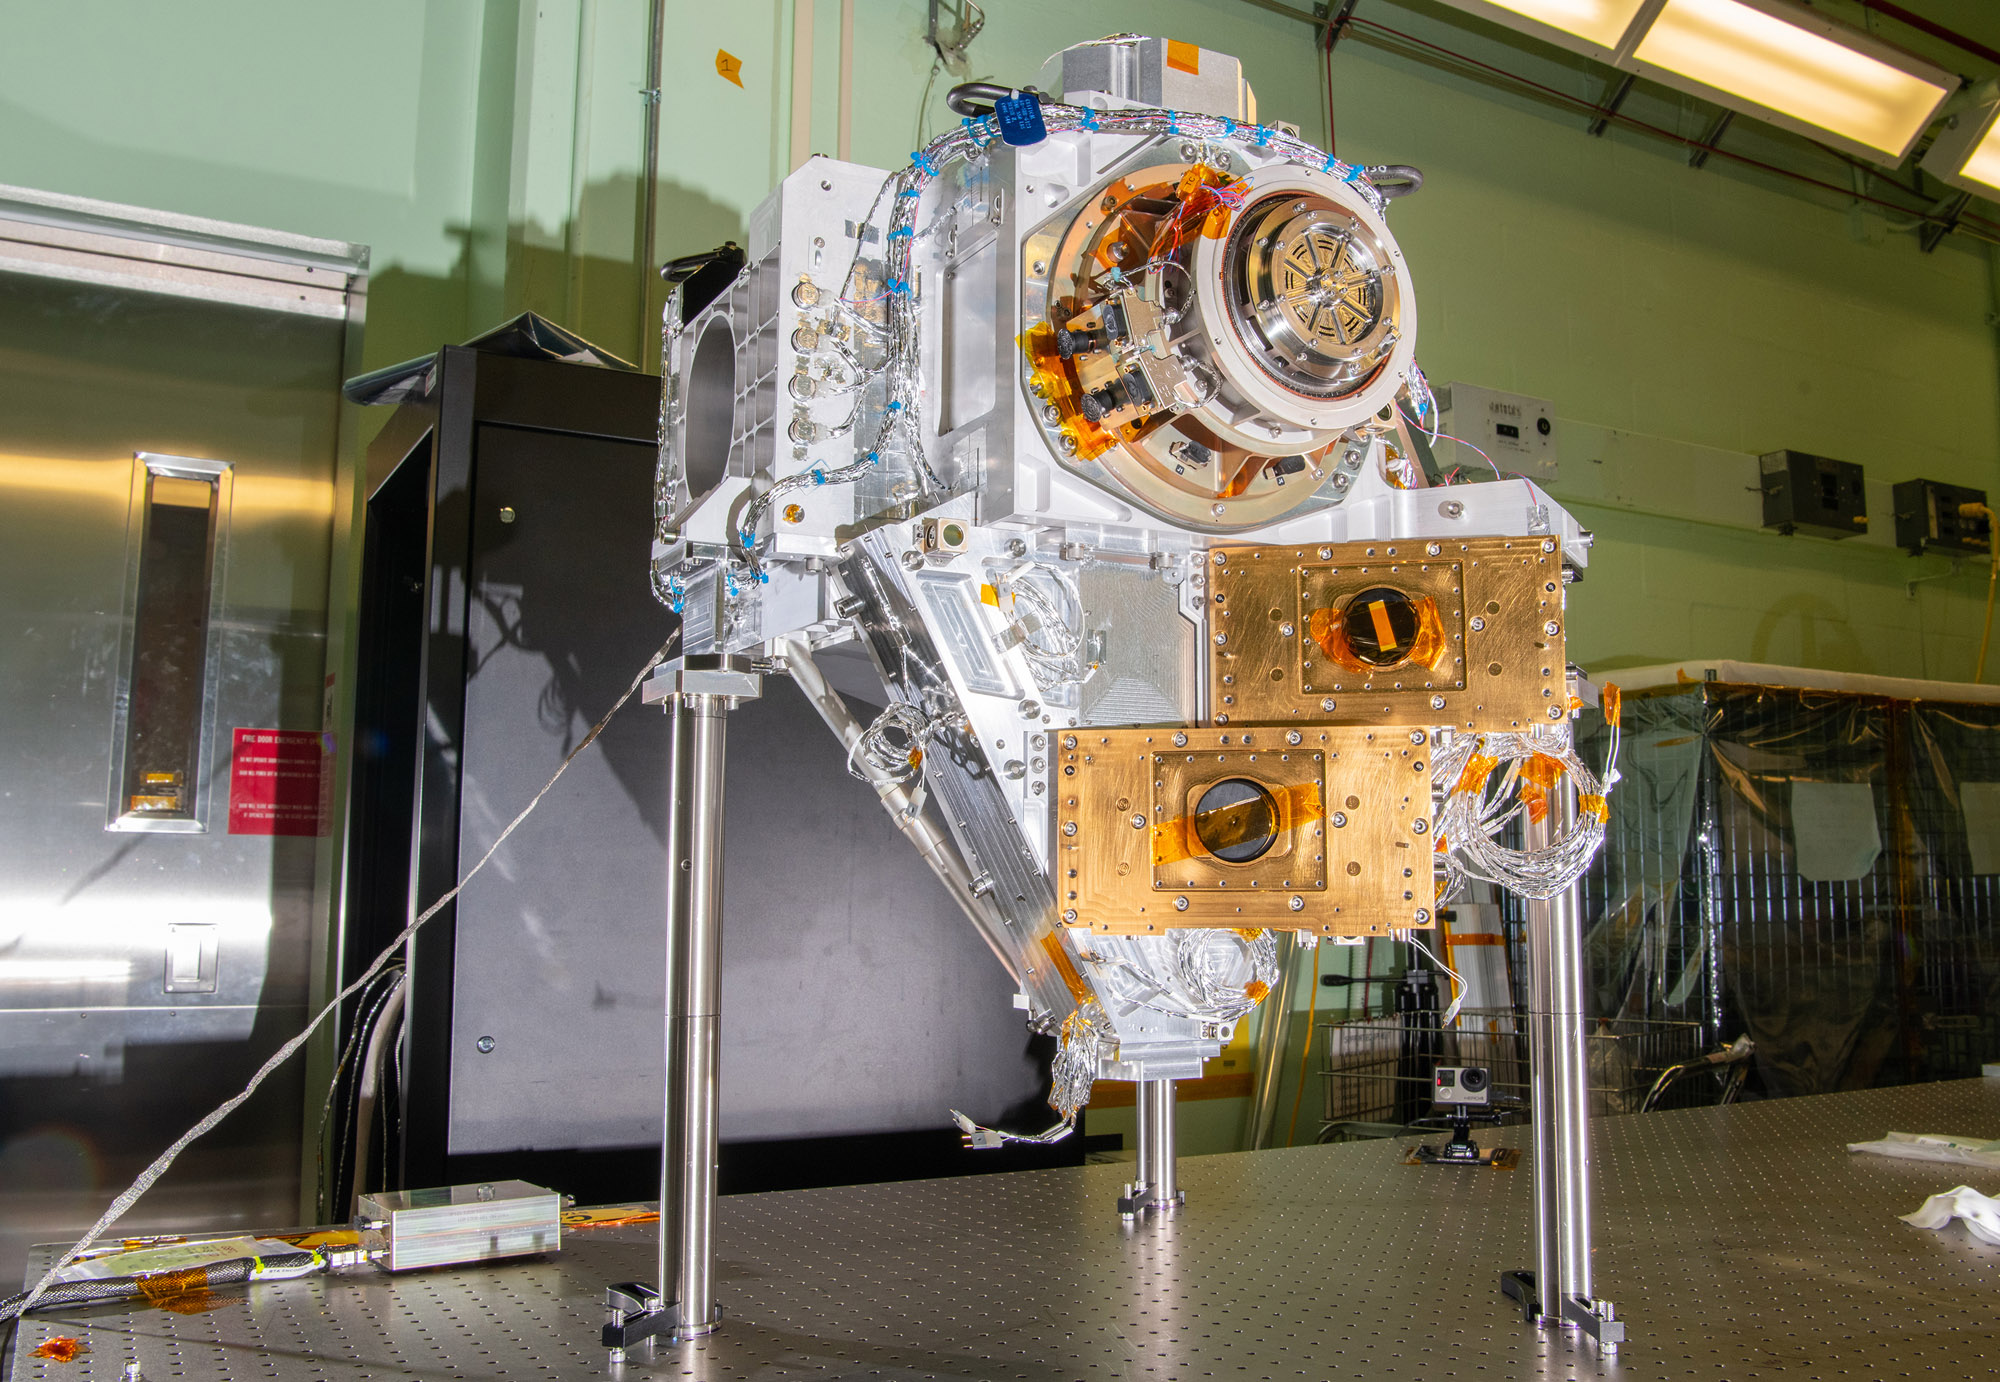
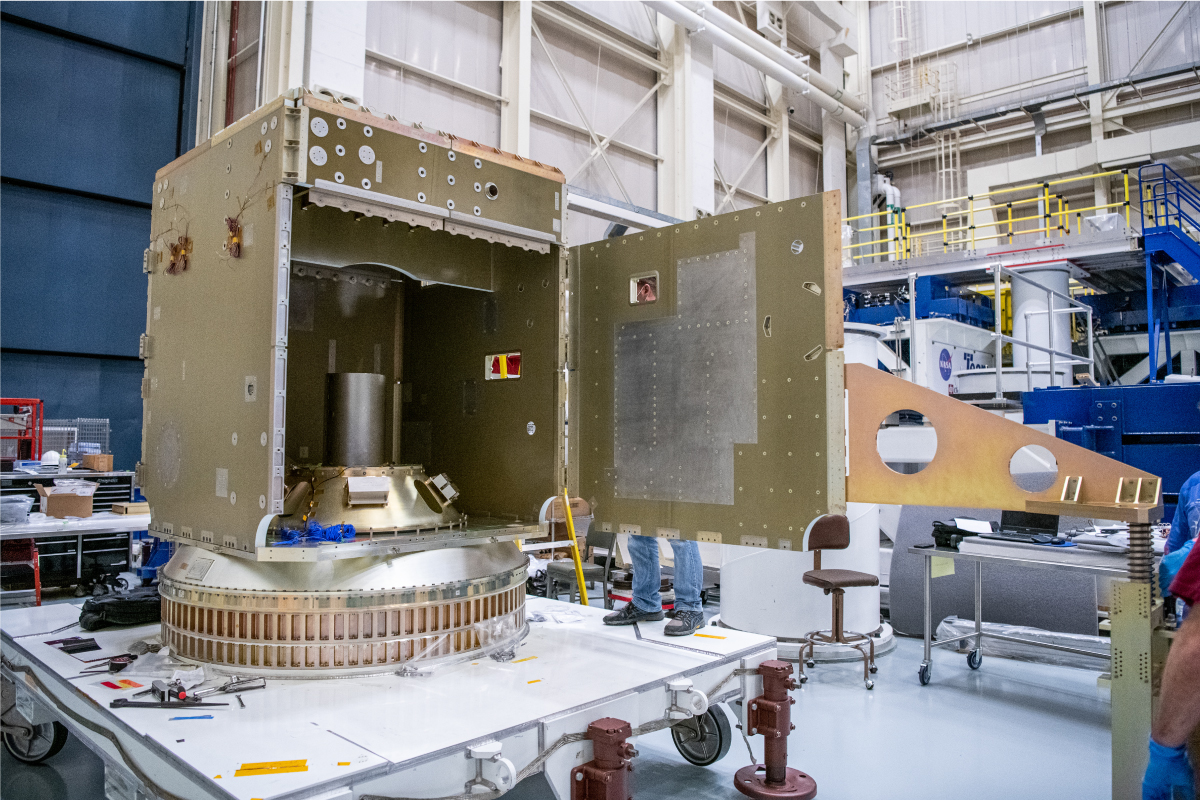
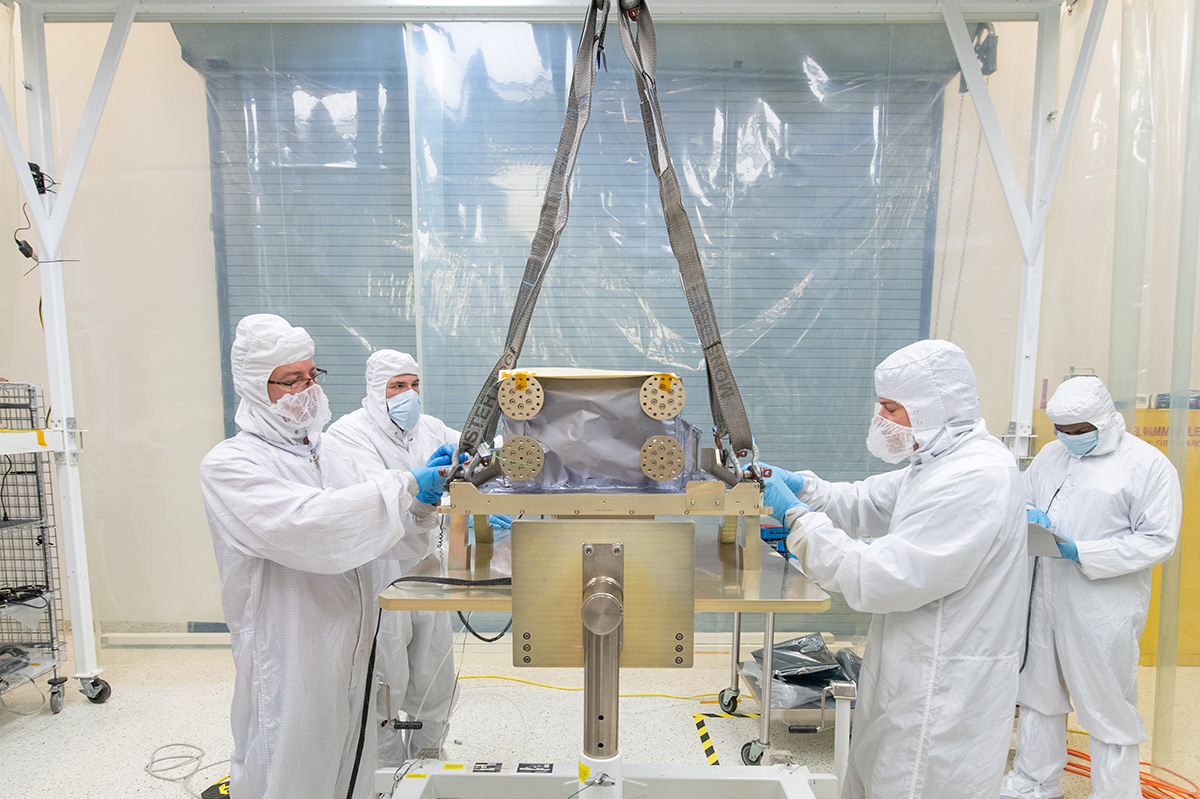
The Optical Module (OM) and the Flight Instrument Deck Structure (IDS) are integrated together, creating the Flight Ocean Color Instrument. Credit: Stover, Desiree
Performing component functional testing on the PACE spacecraft. Credit: Lambert, Barbara
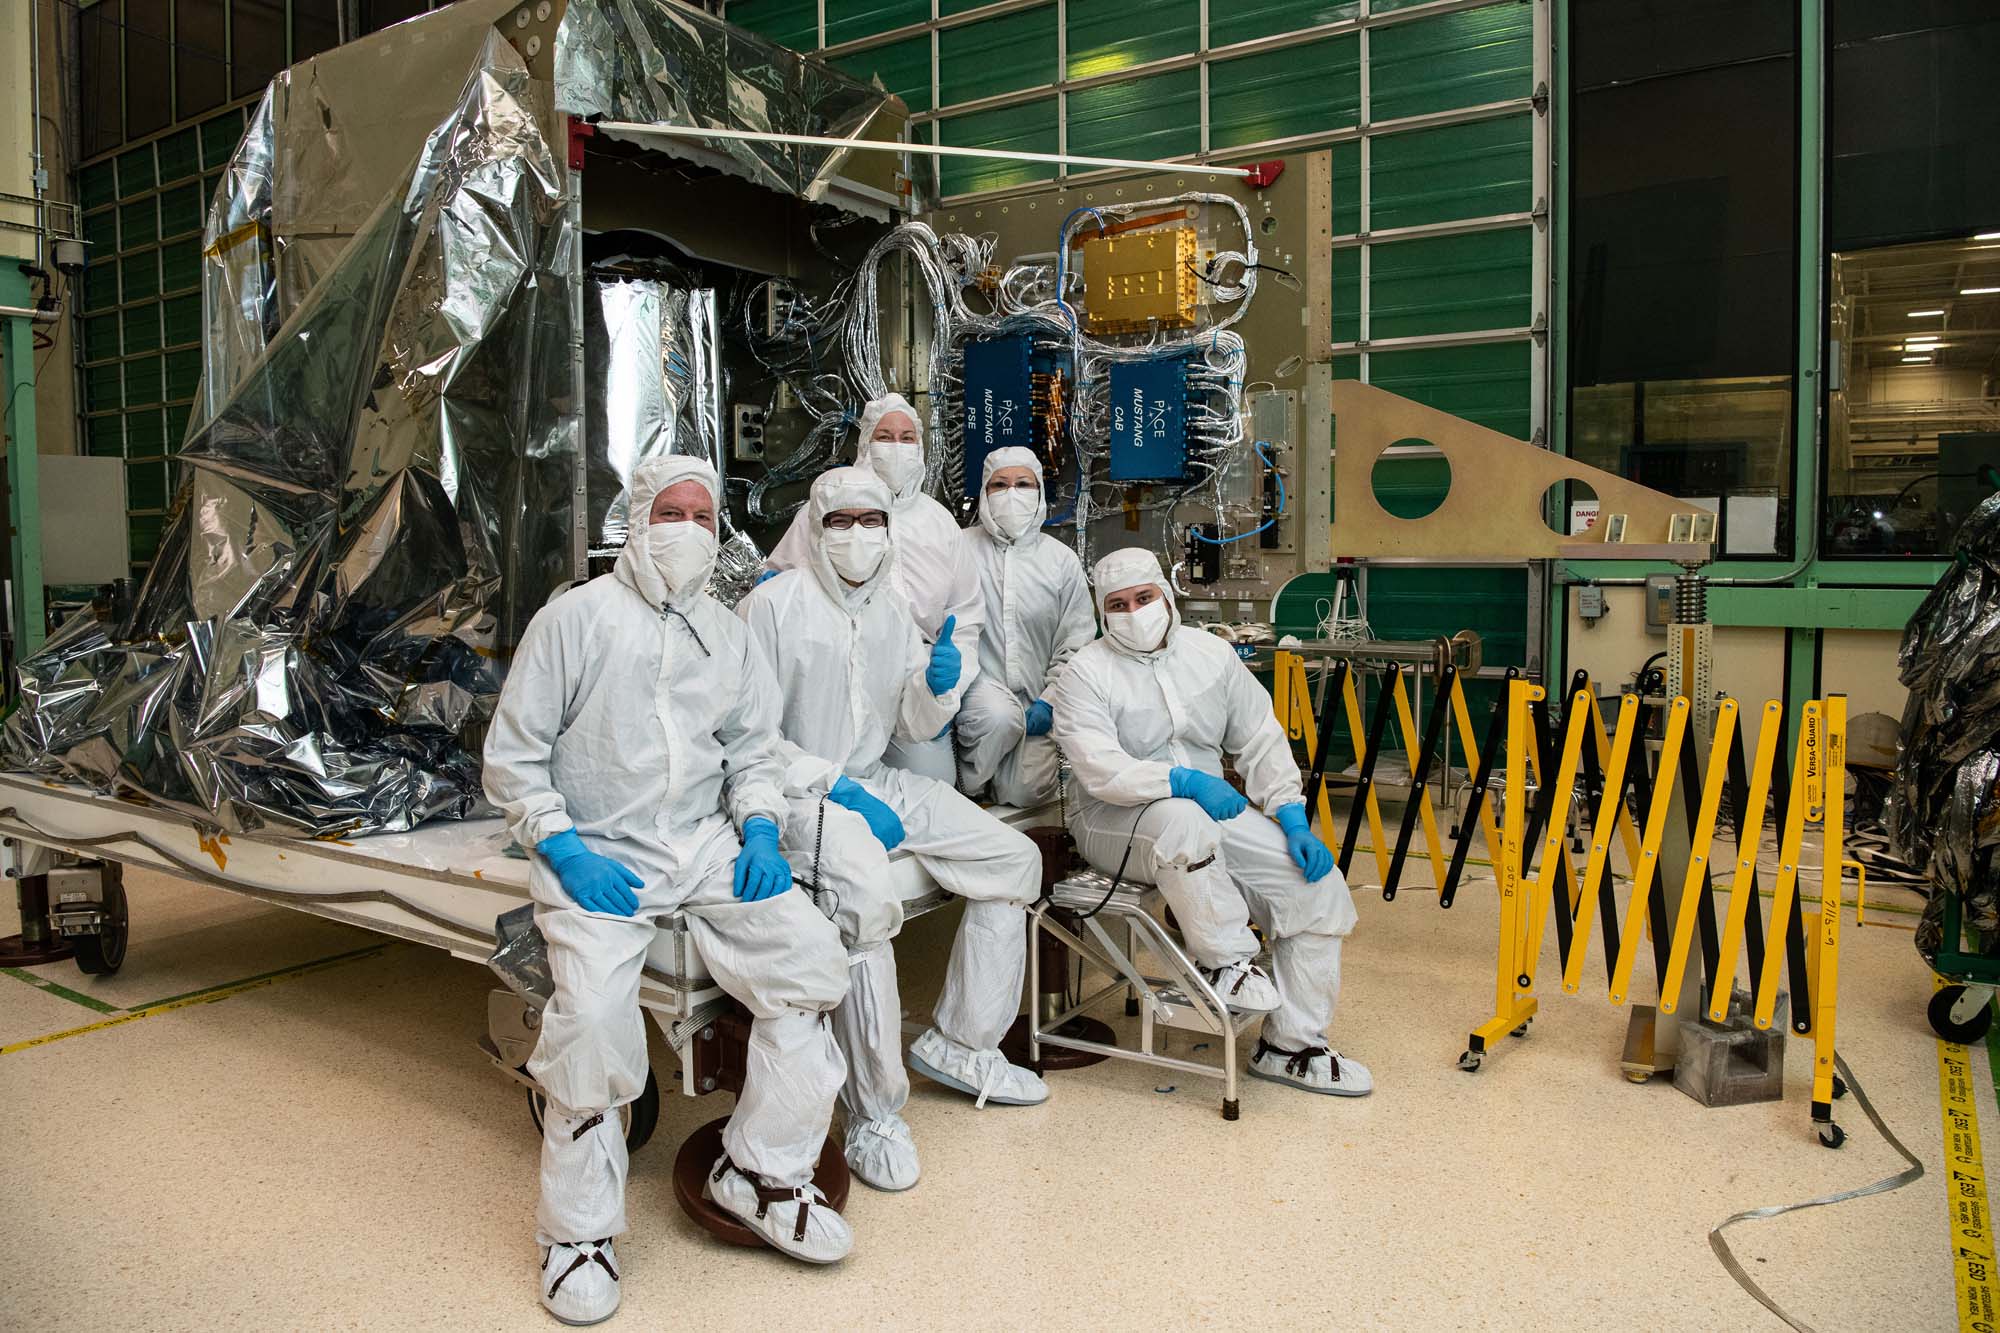
Members of PACE spacecraft integration and test team. Credit: Lambert, Barbara
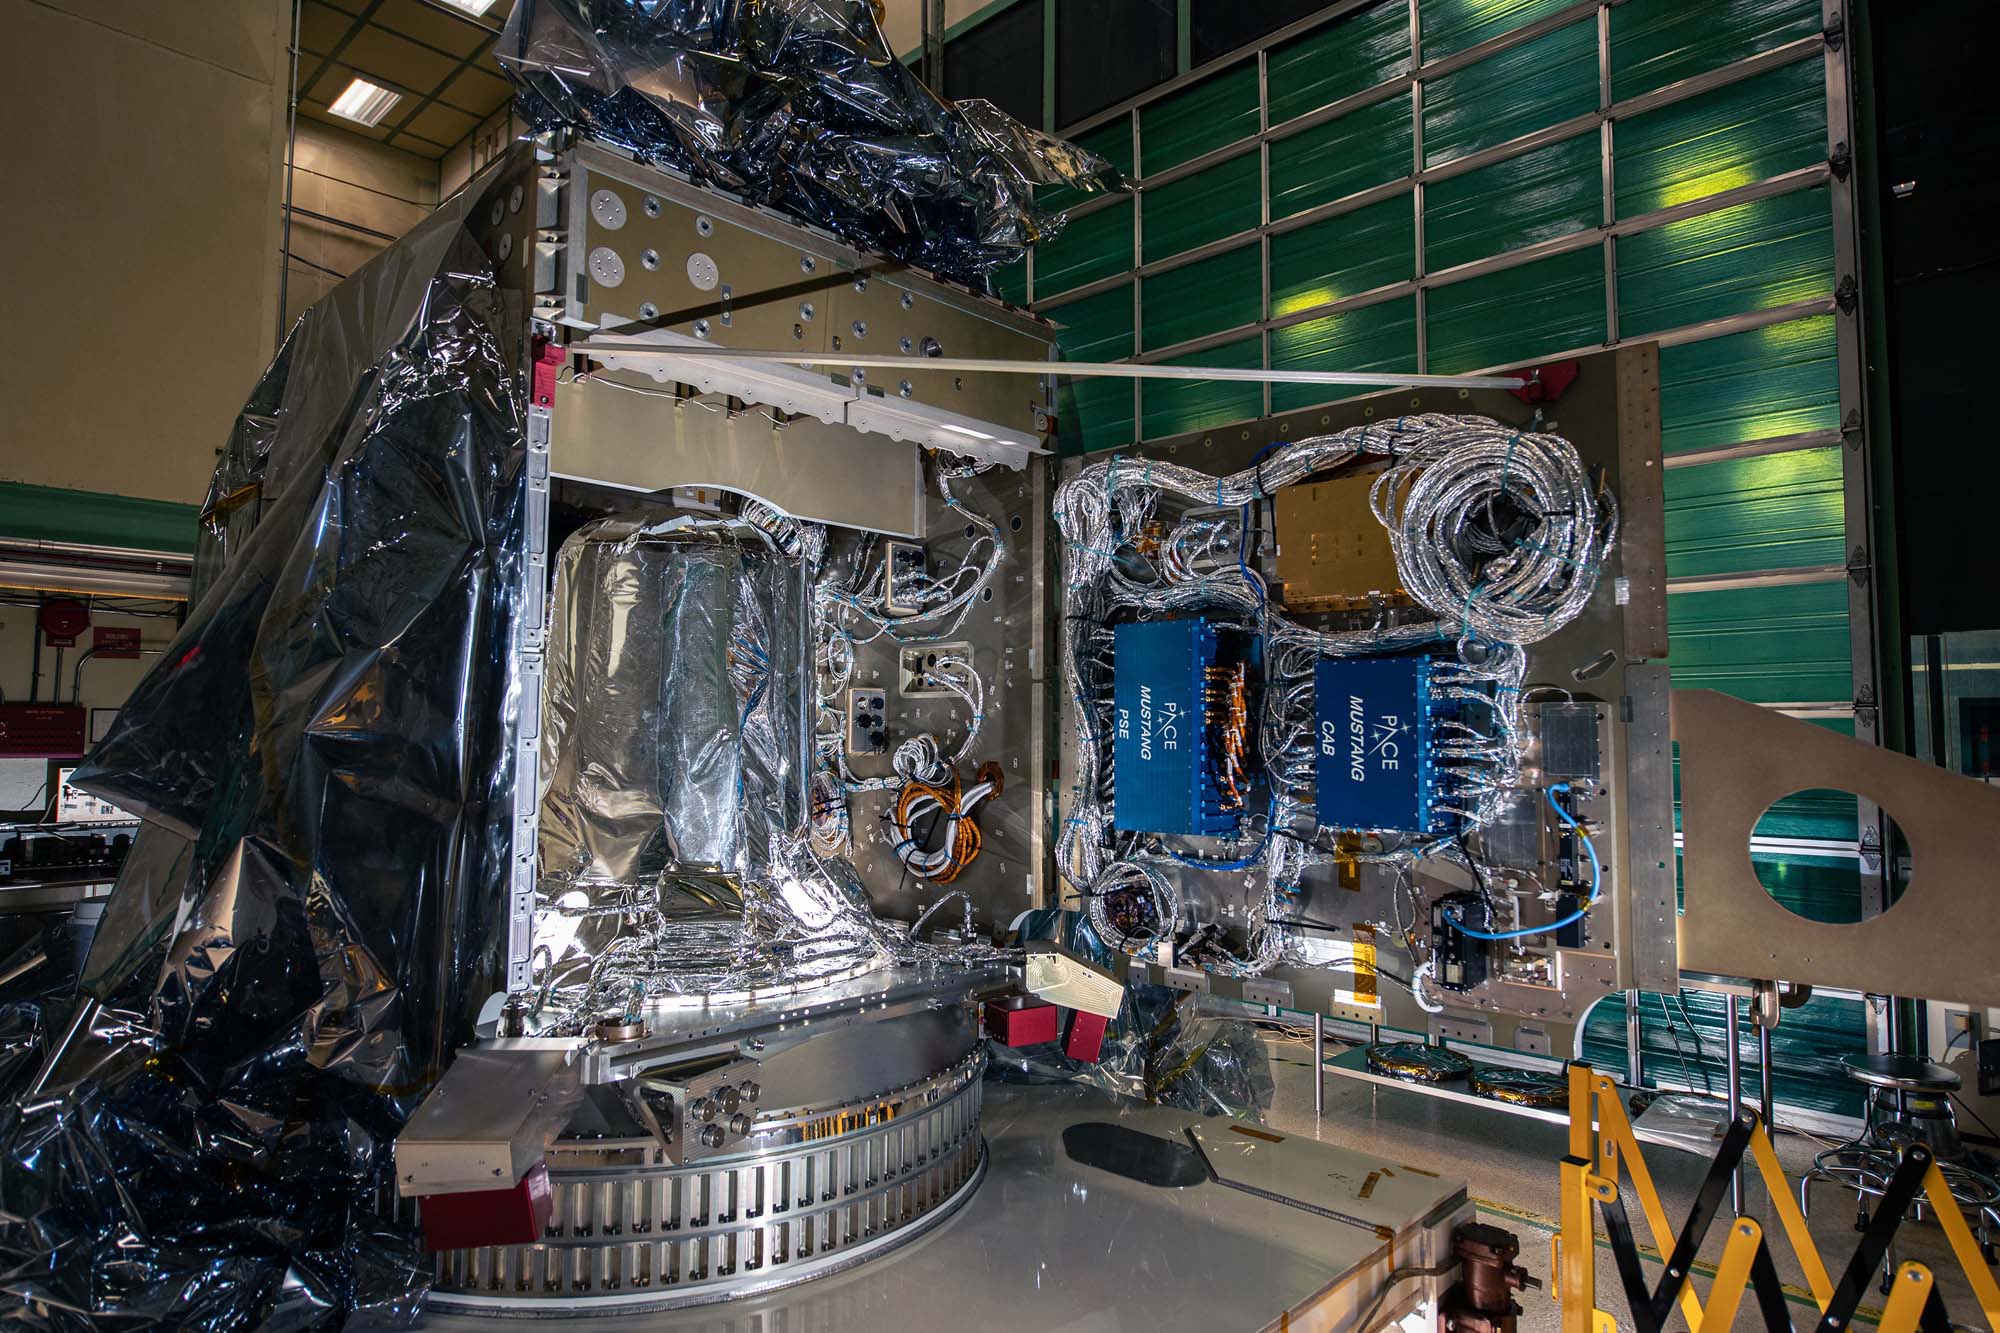
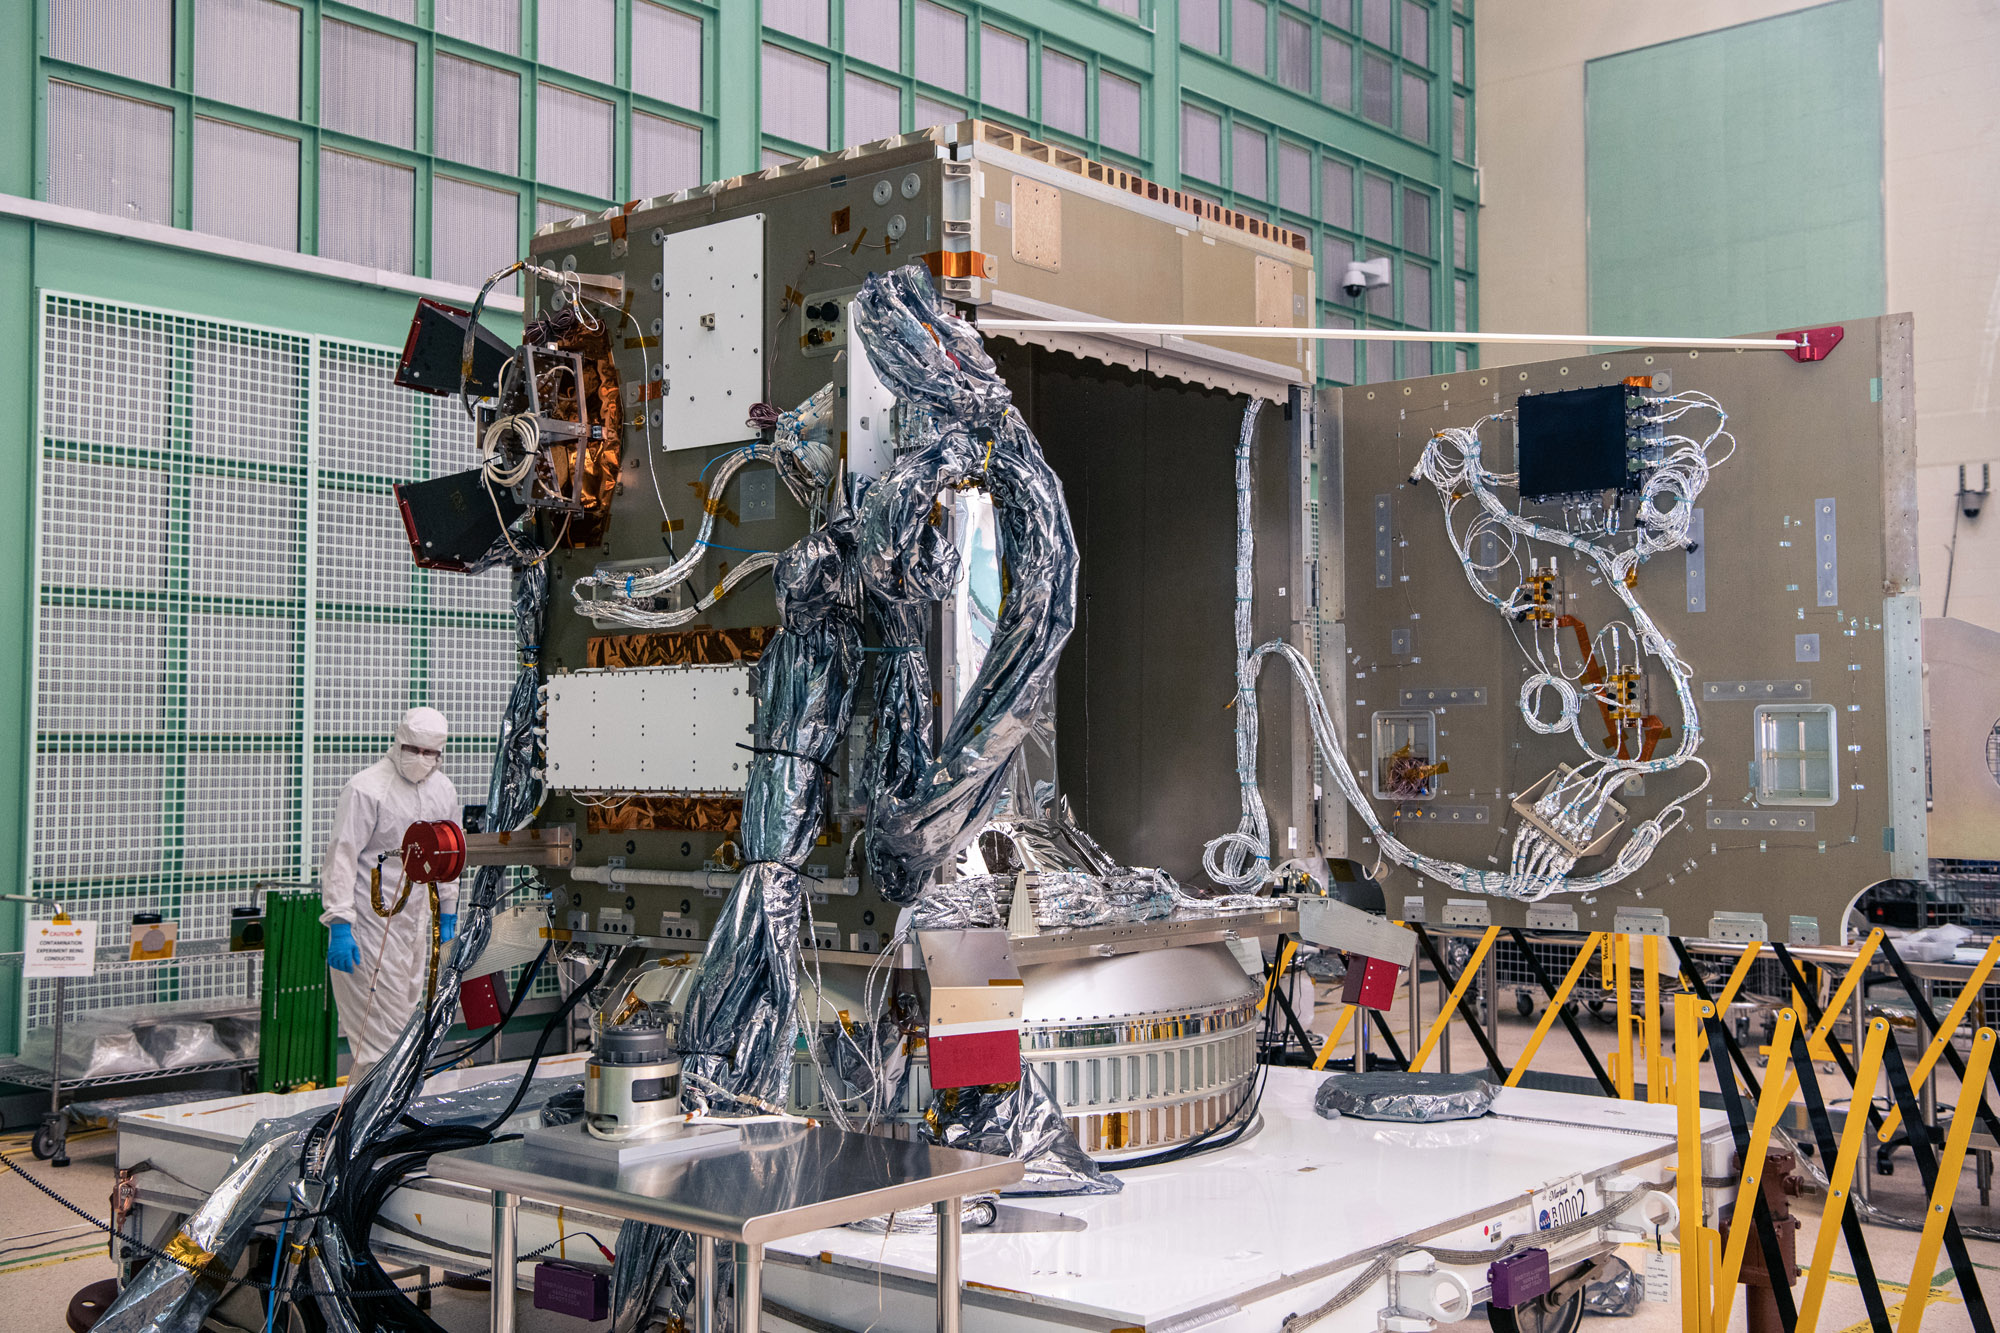
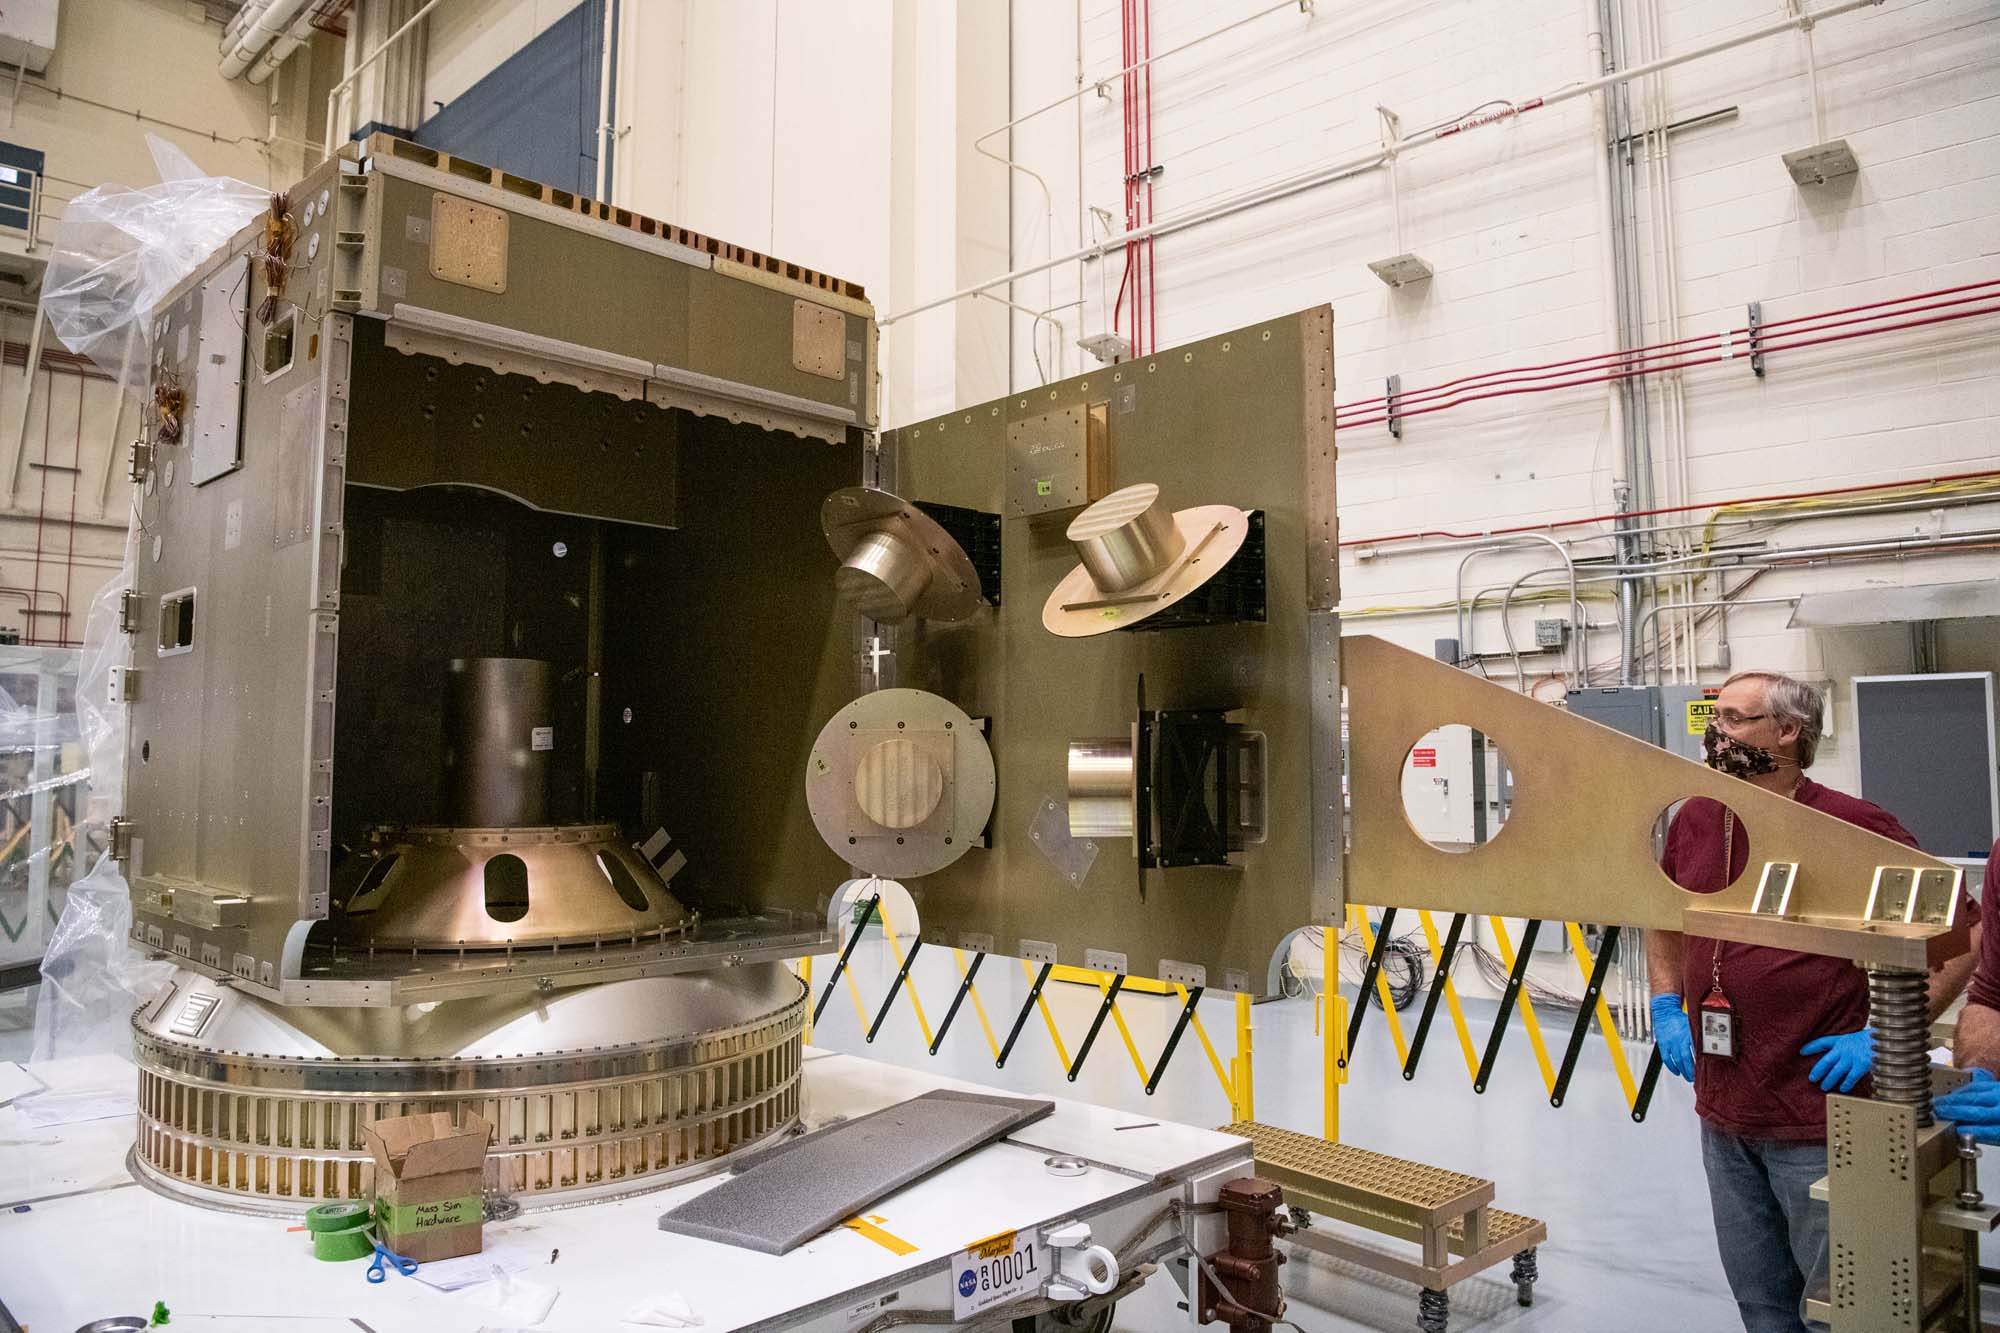
Open panel (-Y) on spacecraft bus. Blue electronics boxes are for power system and attitude control electronics. Credit: Lambert, Barbara
Installing qual battery on flight spacecraft bus. Credit: Henry, Dennis (Denny)
Panel (-Y) being installed on the spacecraft structure. Credit: Henry, Dennis (Denny)
Panel (-Y) being installed on the spacecraft structure. Credit: Henry, Dennis (Denny)
PACE spacecraft bus structure. Credit: Henry, Dennis (Denny)
Assembling PACE spacecraft bus structure. Credit: Henry, Dennis (Denny)
Panel (+Y) installed on the PACE spacecraft bus. Credit: Henry, Dennis (Denny)
Installing panel (+Y) on the PACE spacecraft bus. Credit: Henry, Dennis (Denny)
Assembling PACE spacecraft bus structure. Propulsion tank is in the middle. Credit: Henry, Dennis (Denny)
View inside the PACE spacecraft bus structure. Credit: Henry, Dennis (Denny)
Installing the top of the PACE spacecraft bus structure. Credit: Henry, Dennis (Denny)
Checking the top of the PACE spacecraft bus structure. Credit: Henry, Dennis (Denny)
Installing of panel (-Z) onto the PACE propulsion module deck. Credit: Henry, Dennis (Denny)
Panel (-Z) installed on the PACE propulsion module deck. Credit: Henry, Dennis (Denny)
PACE spacecraft bus structure with -Z panel on propulsion module deck. Credit: Henry, Dennis (Denny)
Assembling PACE spacecraft bus (+Z and -Z panels) using keel lift. Credit: Henry, Dennis (Denny)
Installing the passive ring and propulsion module onto the PACE observatory dolly. Credit: Henry, Dennis (Denny)
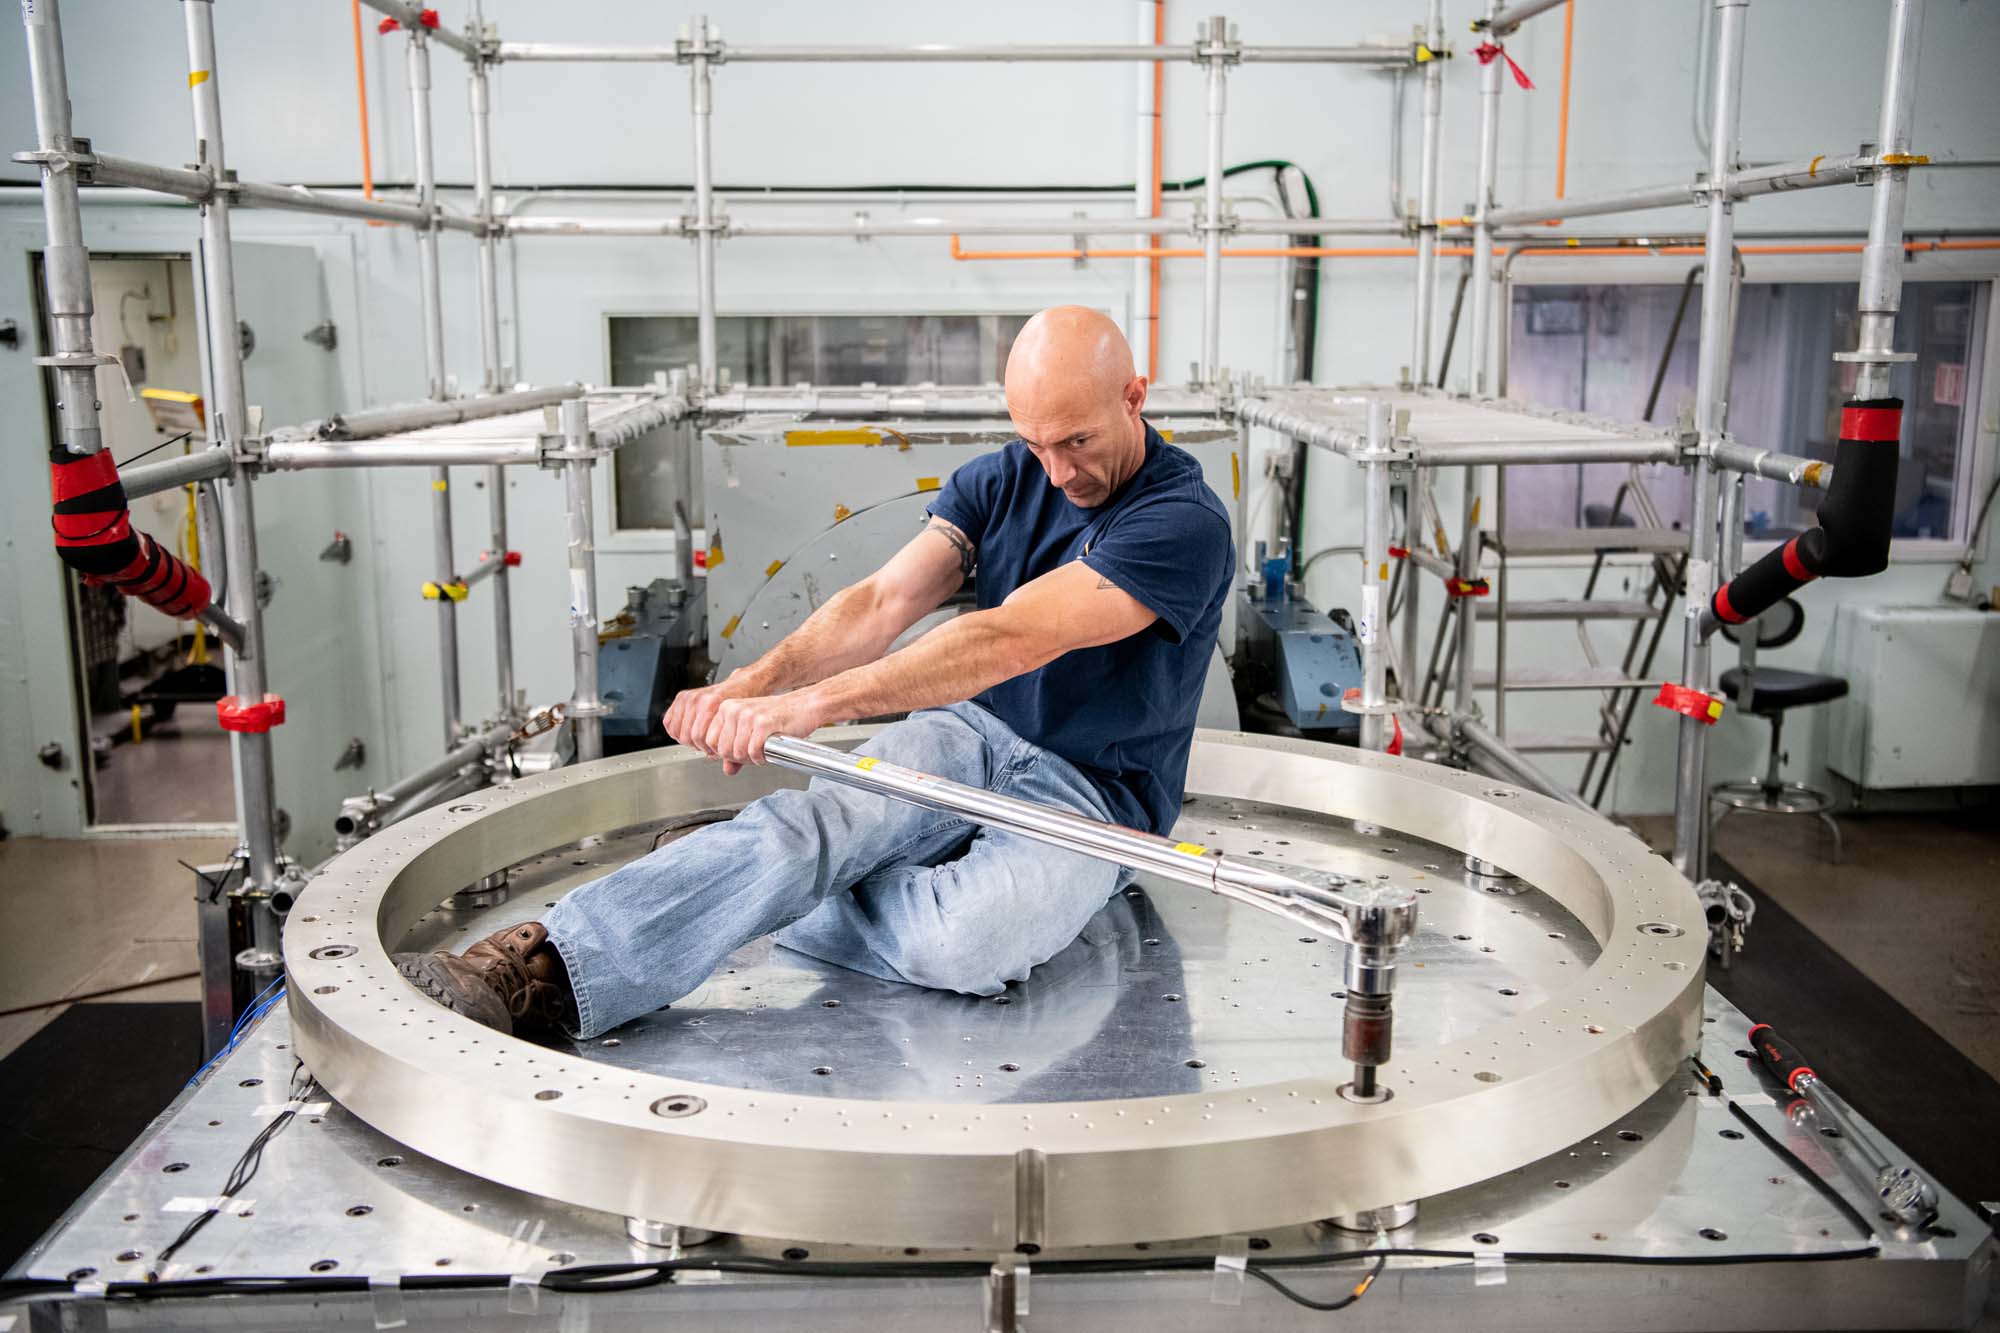
Lifting points proof test for spacecraft transport between facilities. Credit: Henry, Dennis (Denny)
PACE assembly for structural testing. Credit: Henry, Dennis (Denny)
Installing torque circular connectors during panel integration. Credit: Henry, Dennis (Denny)
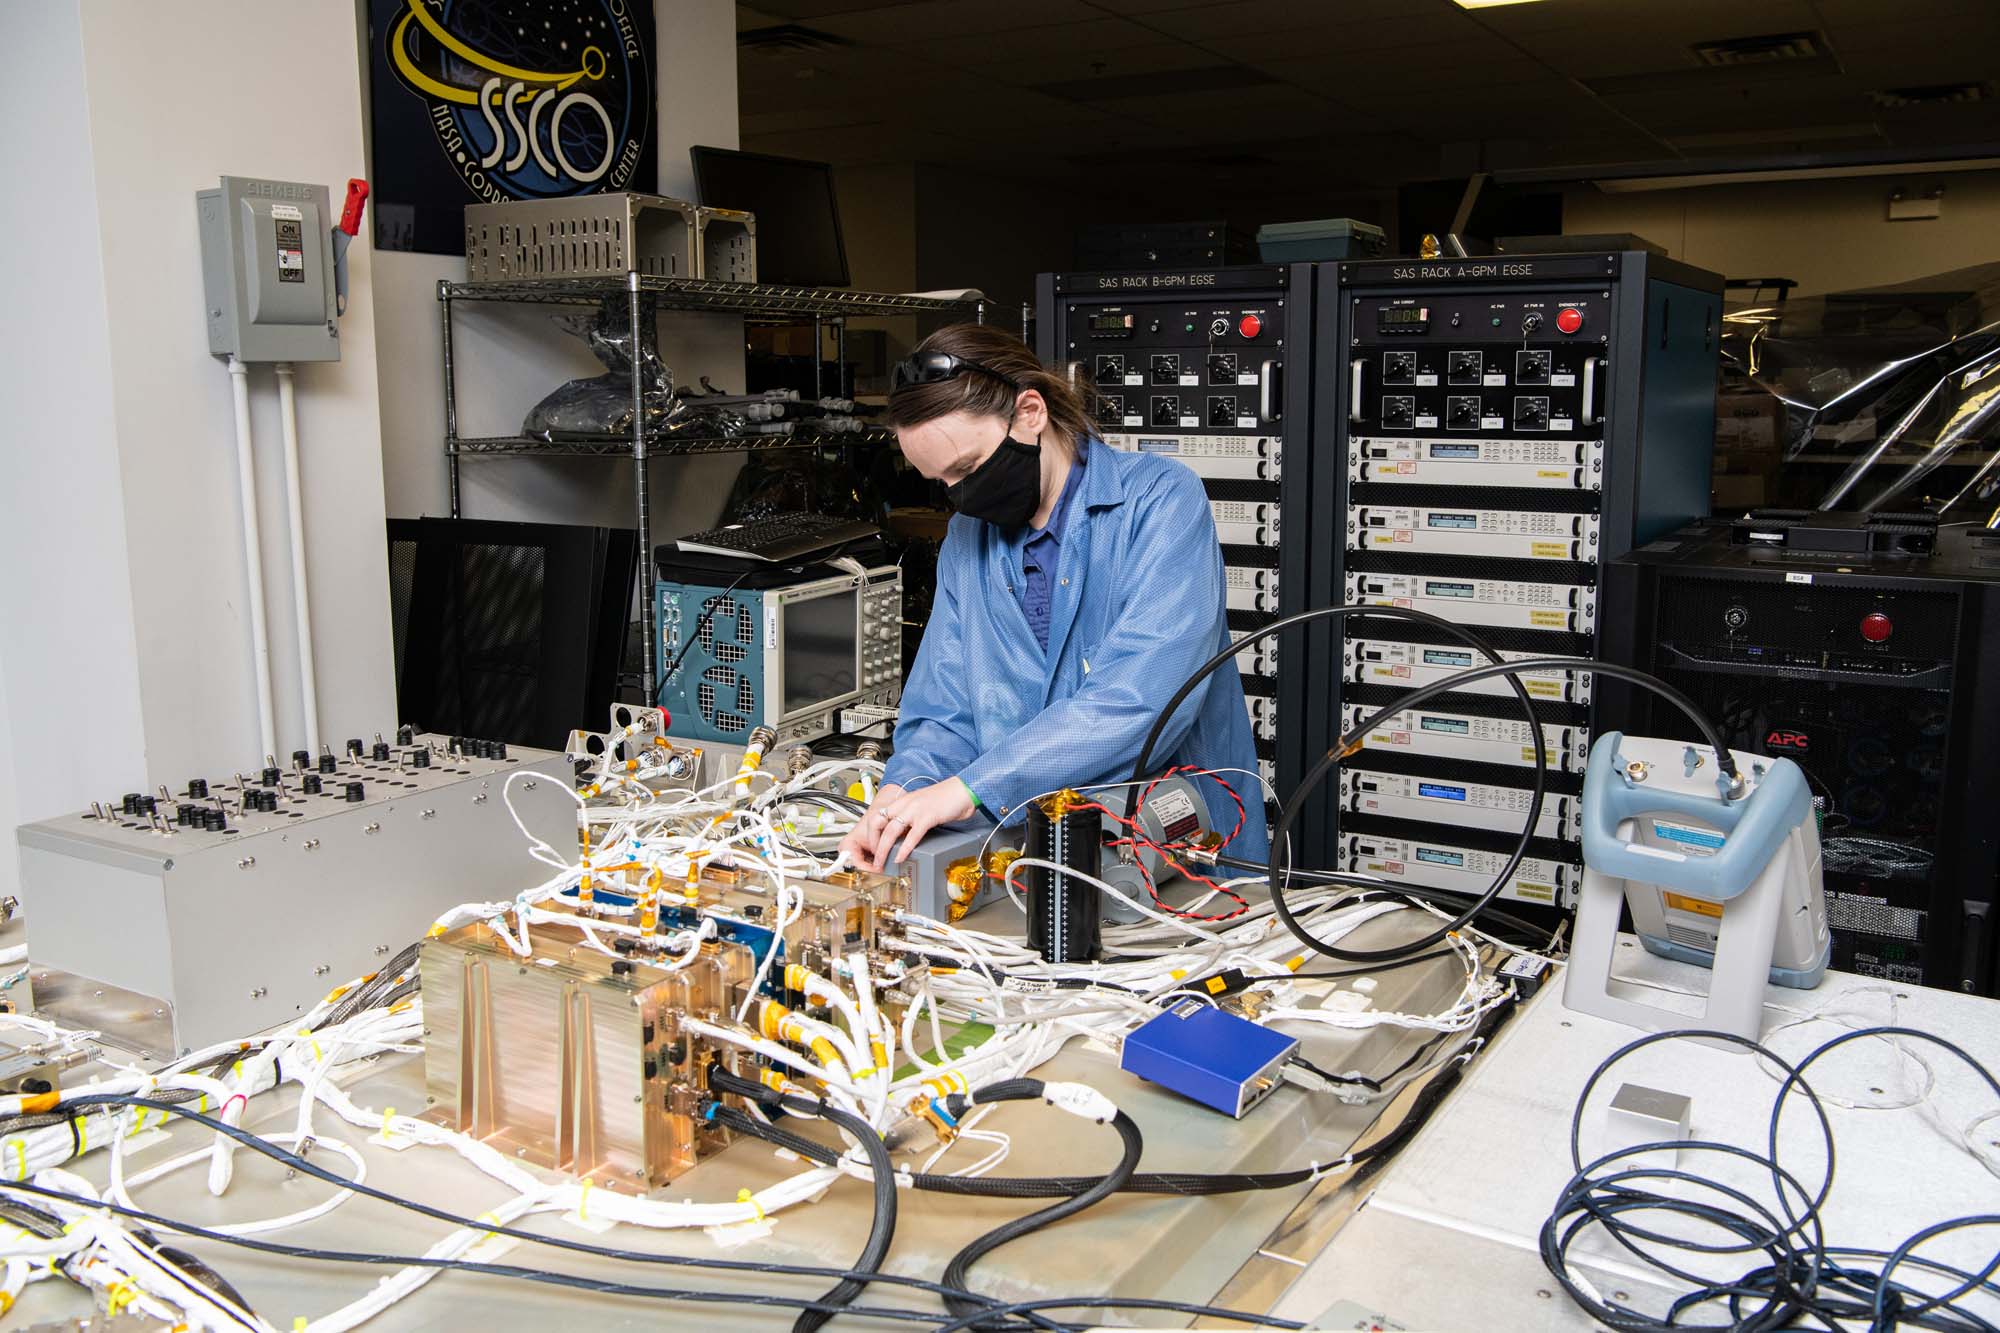
Performing electrical integration of engineering test unit's Ka-band transmitter. Credit: Henry, Dennis (Denny)
Electrical integration of engineering's test unit Ka-band transmitter. Credit: Henry, Dennis (Denny)

PACE Team / Group photo December 2021. Credit: NASA
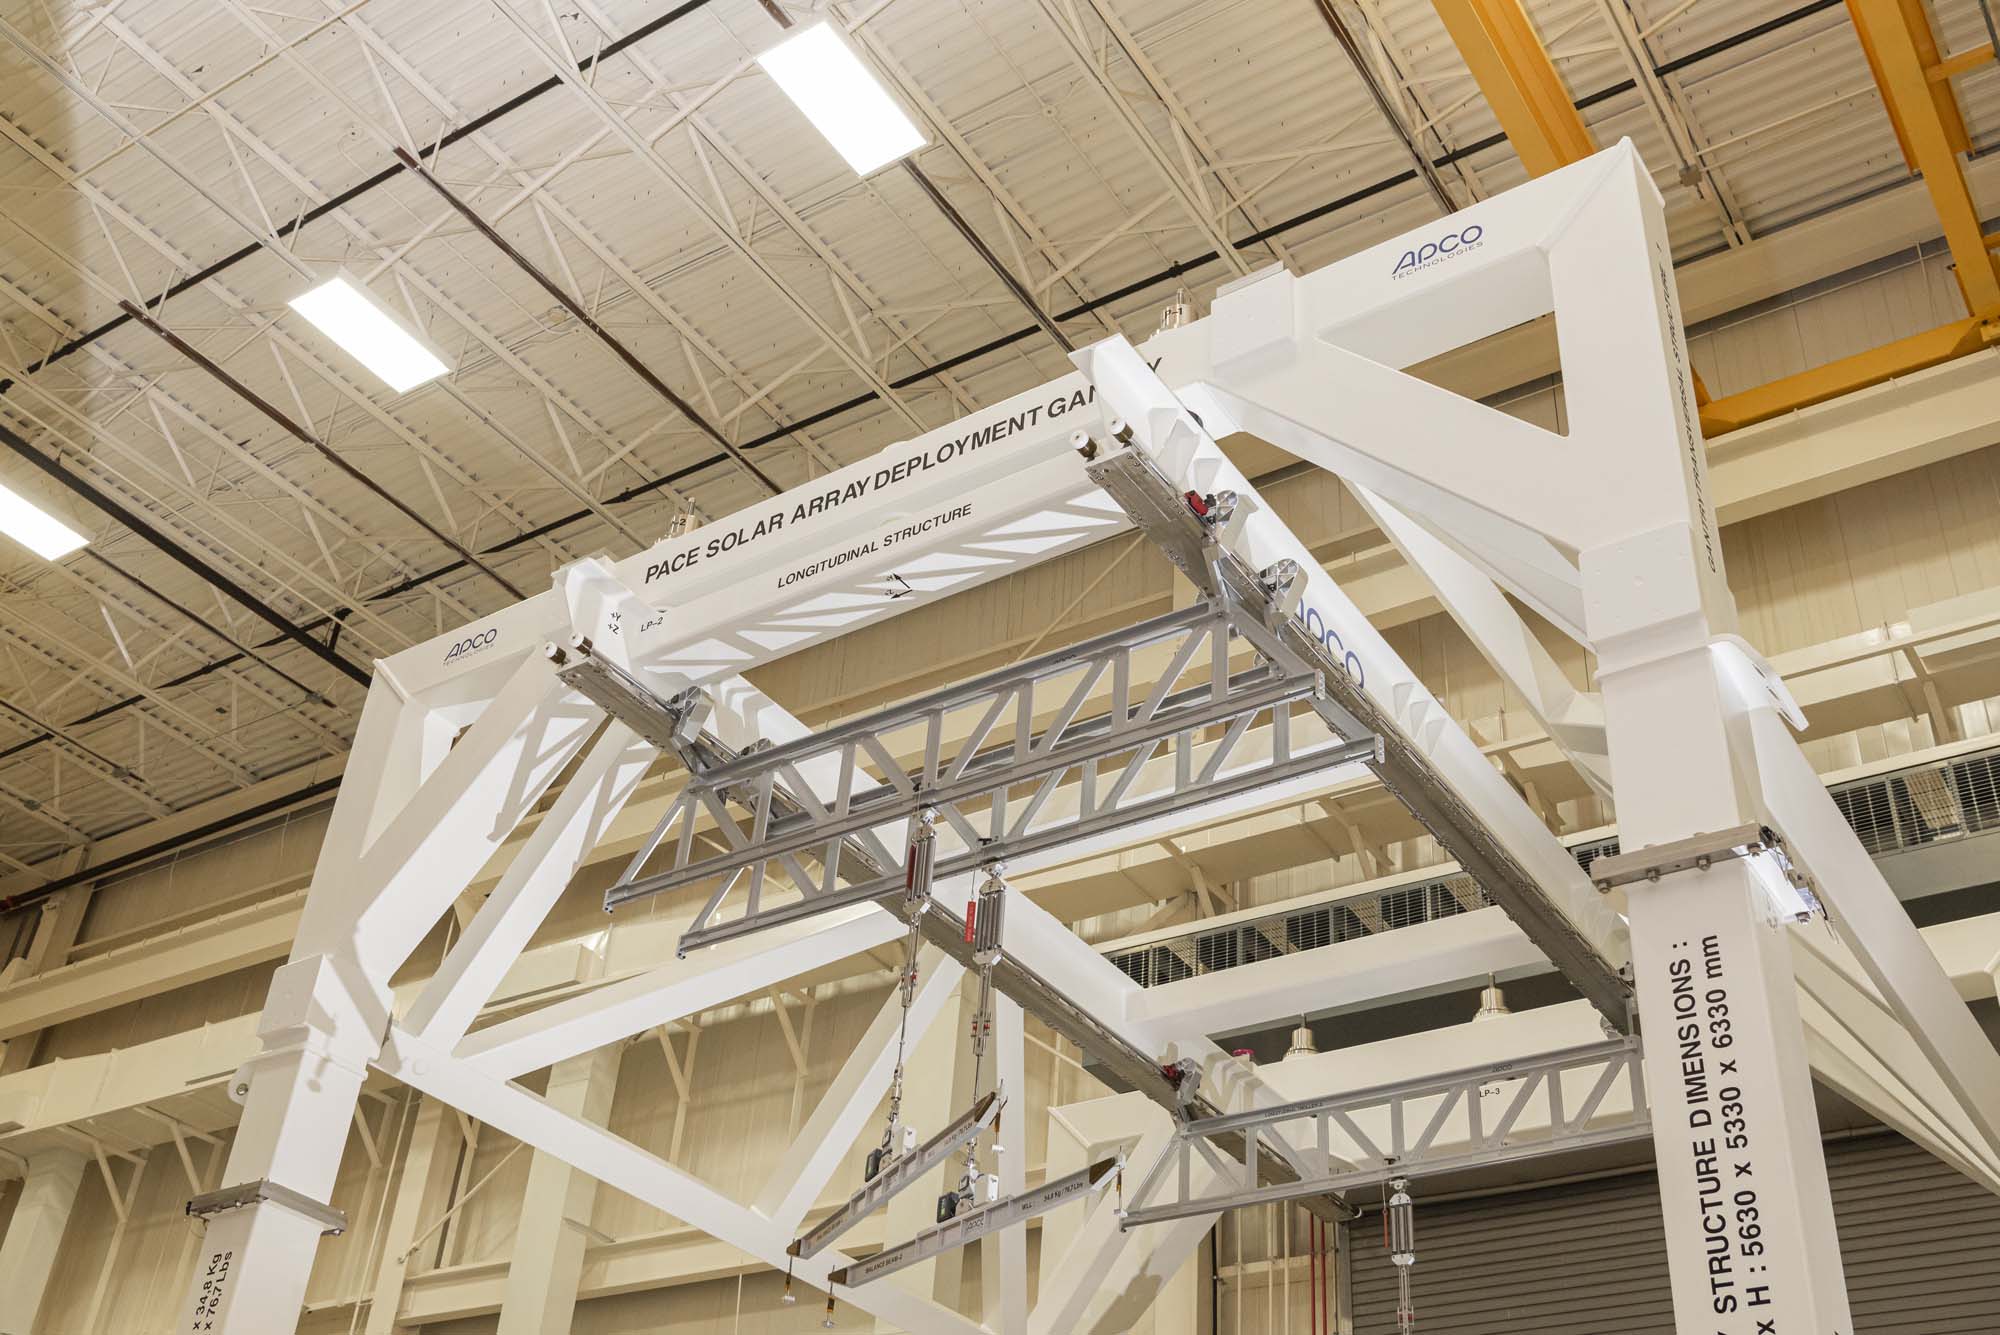
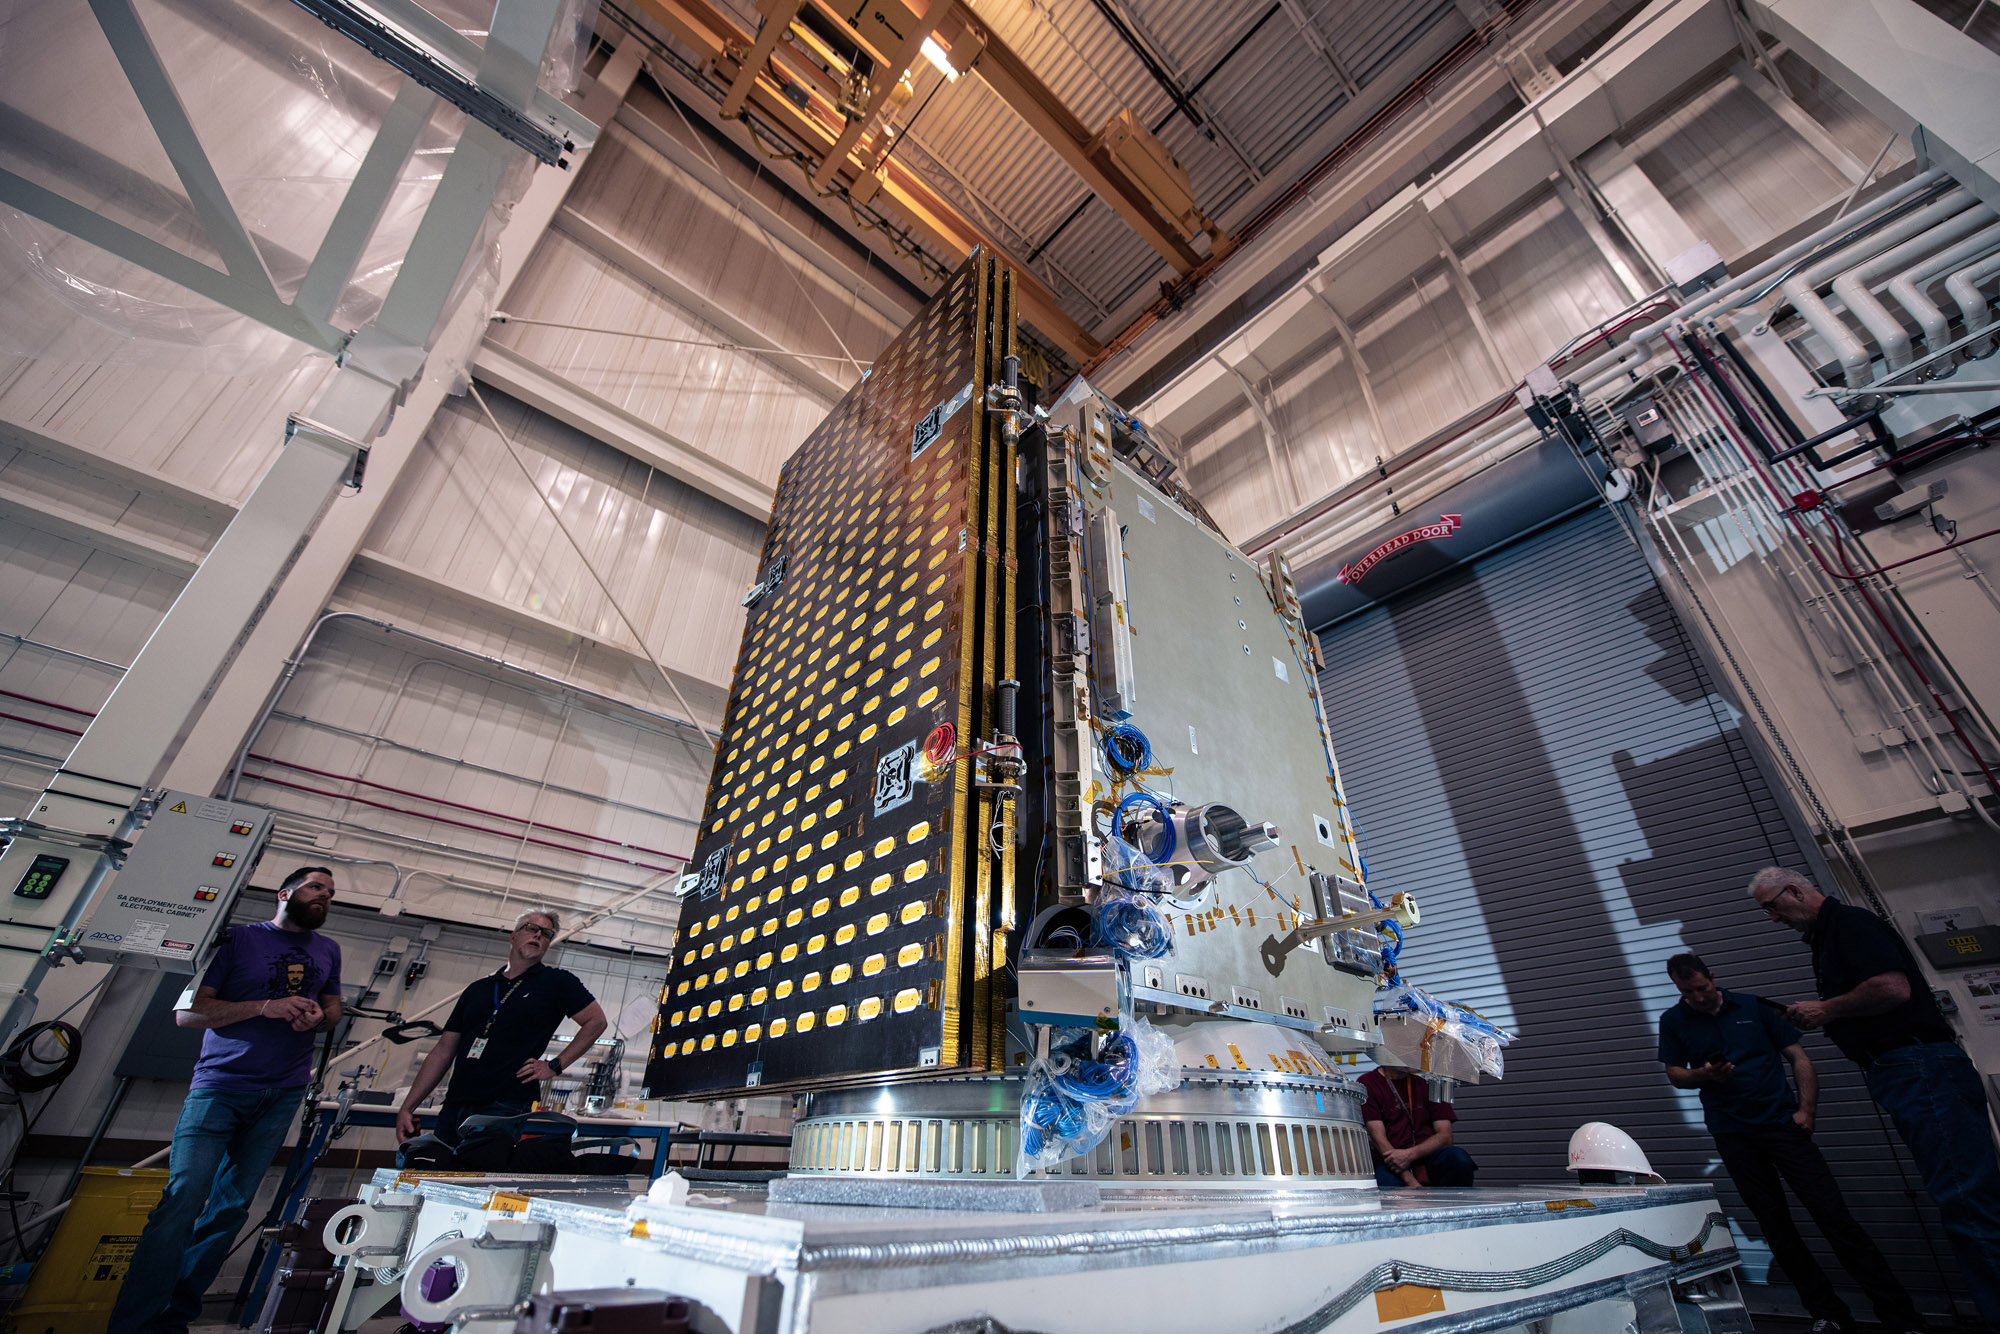
PACE solar array deployment gantry. Credit: Guinto, Michael
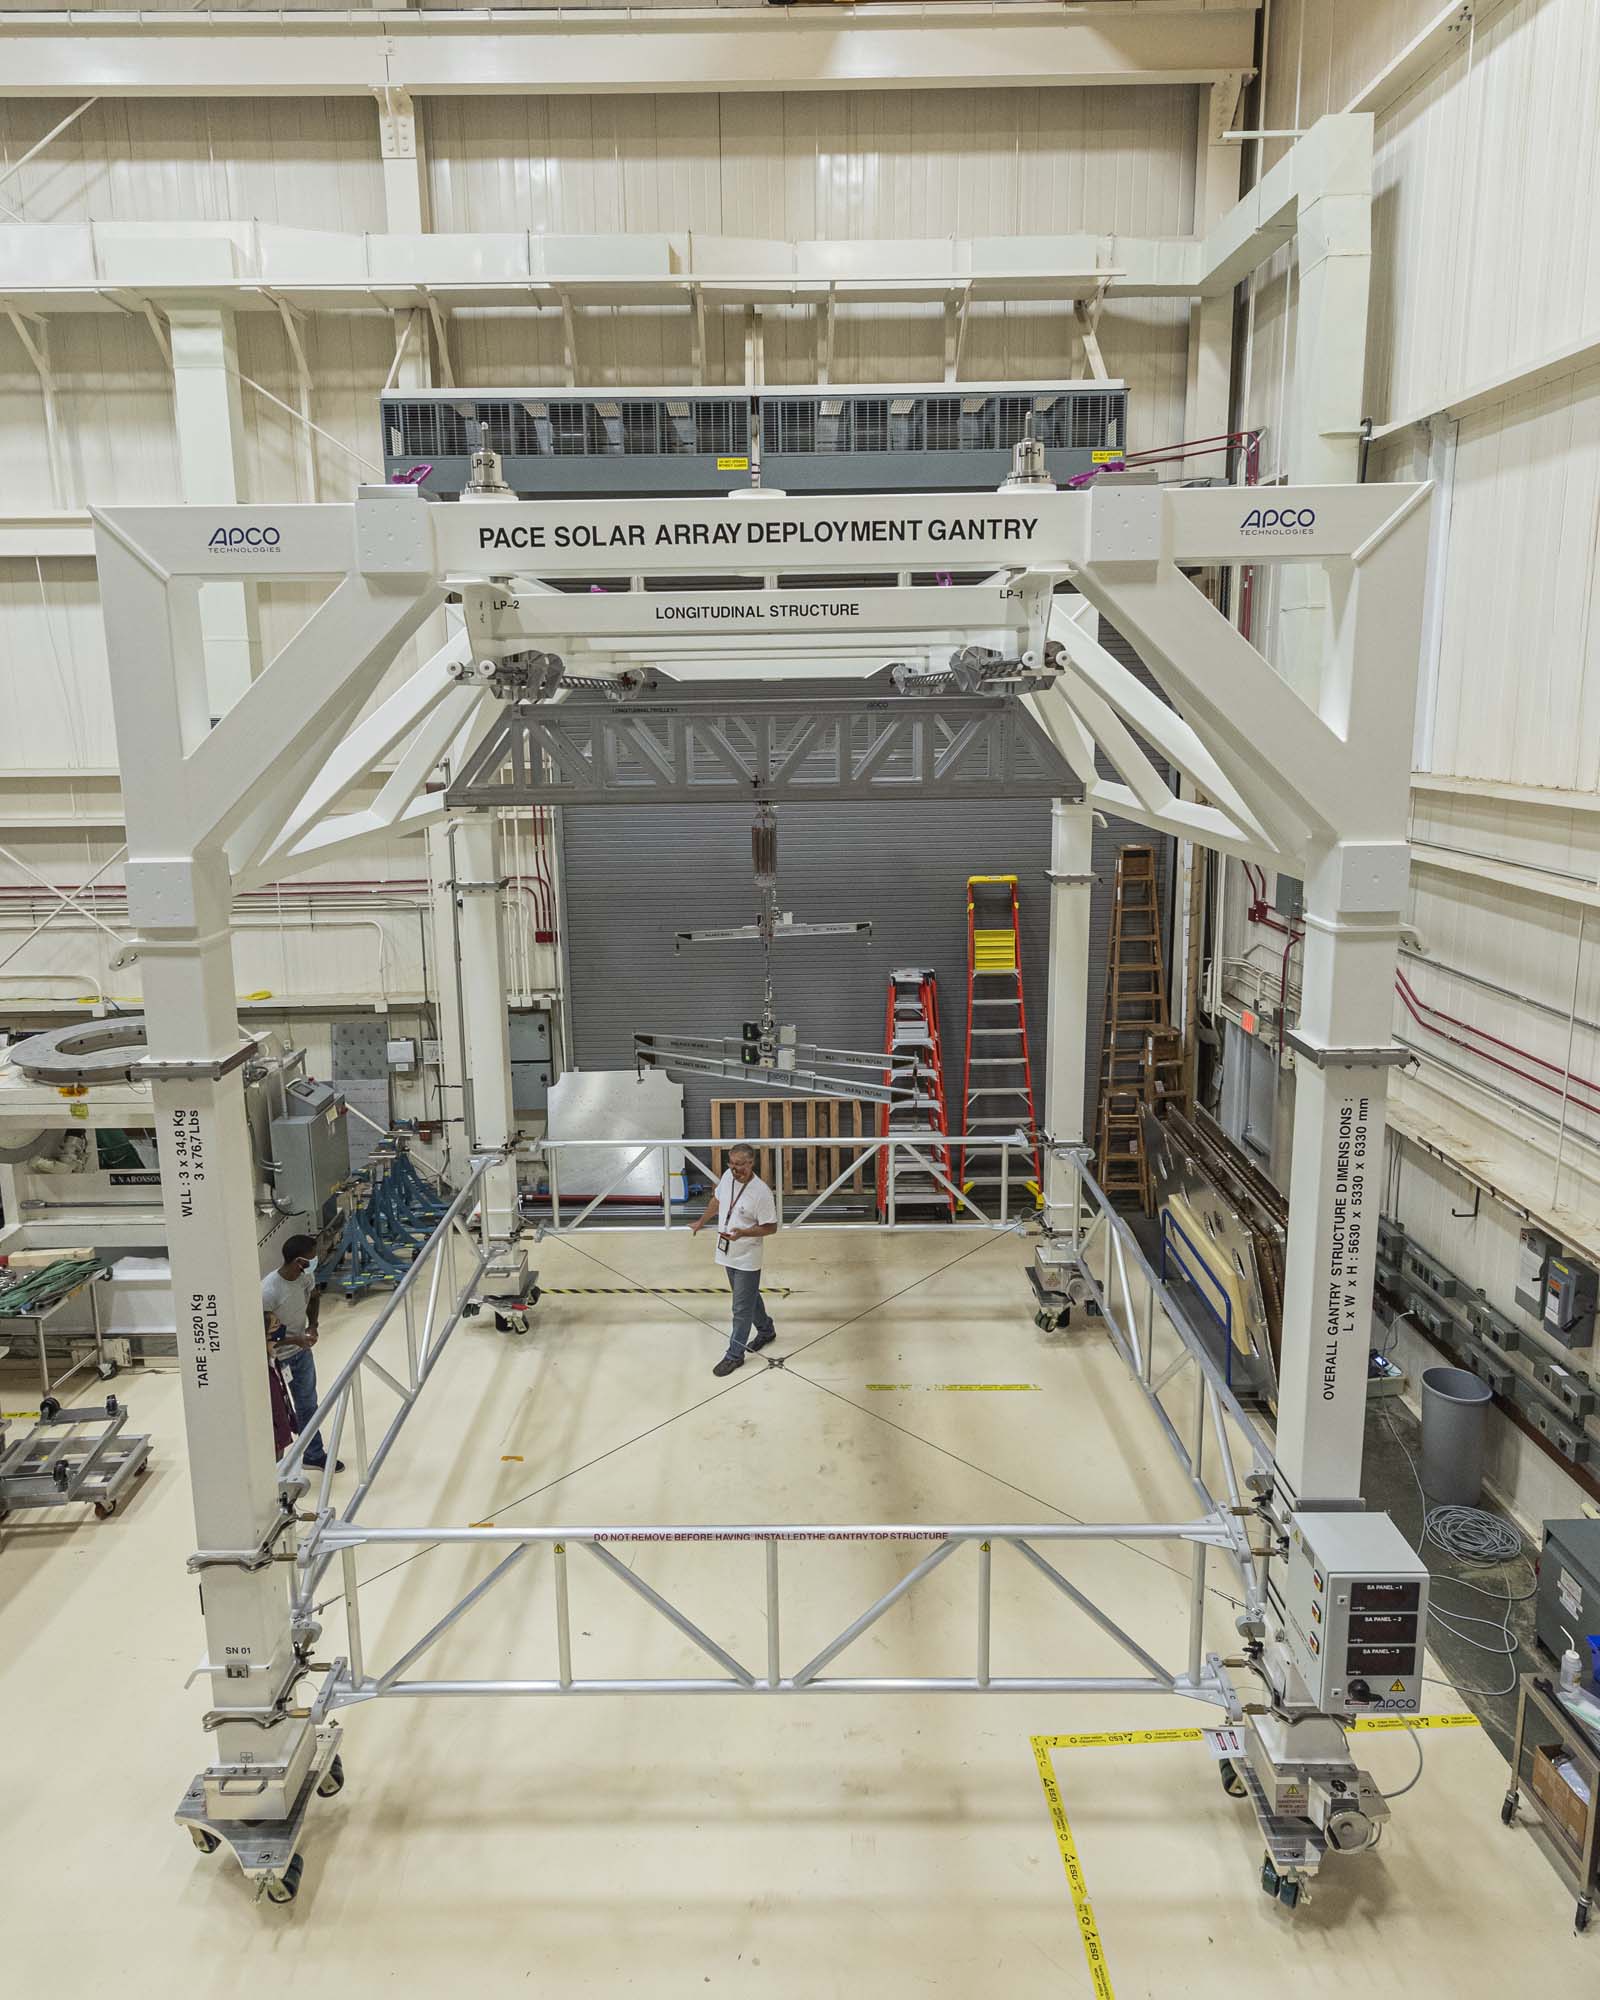
PACE solar array deployment gantry. Credit: Guinto, Michael
Installing tilt and solar array drive electronics to a PACE spacecraft panel (-Y). Credit: Henry, Dennis (Denny)
Installing GPS receiver box to a PACE spacecraft panel (-Z). Credit: Henry, Dennis (Denny)
Installing stimulators on PACE course sun sensors. Credit: Henry, Dennis (Denny)
Performing electrical integration of flight power system electronics and attitude control electronics box. Credit: Henry, Dennis (Denny)
Lift fixture within thermal vacuum chamber. Credit: Seixal, John
Installed multilayer insulation thermal blankets on PACE propulsion module. Credit: Lambert, Barbara
Qualification of the spacecraft bus structure strength. Credit: Henry, Dennis (Denny)
Installing the flight propellant tank into the frustum. Credit: Dennis Henry
Assembling the structure, installing the mass simulators and tilt platform/solar array strength test fixtures, and assessing and demonstrating the panel G-Negation system functionality. Credit: Dennis Henry
Inspecting attitude control electronics box telemetry for fluctuations registered during testing. Credit: Henry, Dennis (Denny)
Testing observatory lifting points and pull strength of tilt platform, solar array, SPEXone, HARP2, and bus star tracker interfaces. Credit: Henry, Dennis (Denny)
Lift of PACE spacecraft into the testing modal facility. Credit: Henry, Dennis (Denny)
Spacecraft structure with mass simulators, tilt platform & solar array strength test fixtures. Credit: Henry, Dennis (Denny)
Mass simulation assembly structure. Install of tilt platform/solar array strength test fixtures.
Credit: Henry, Dennis (Denny)
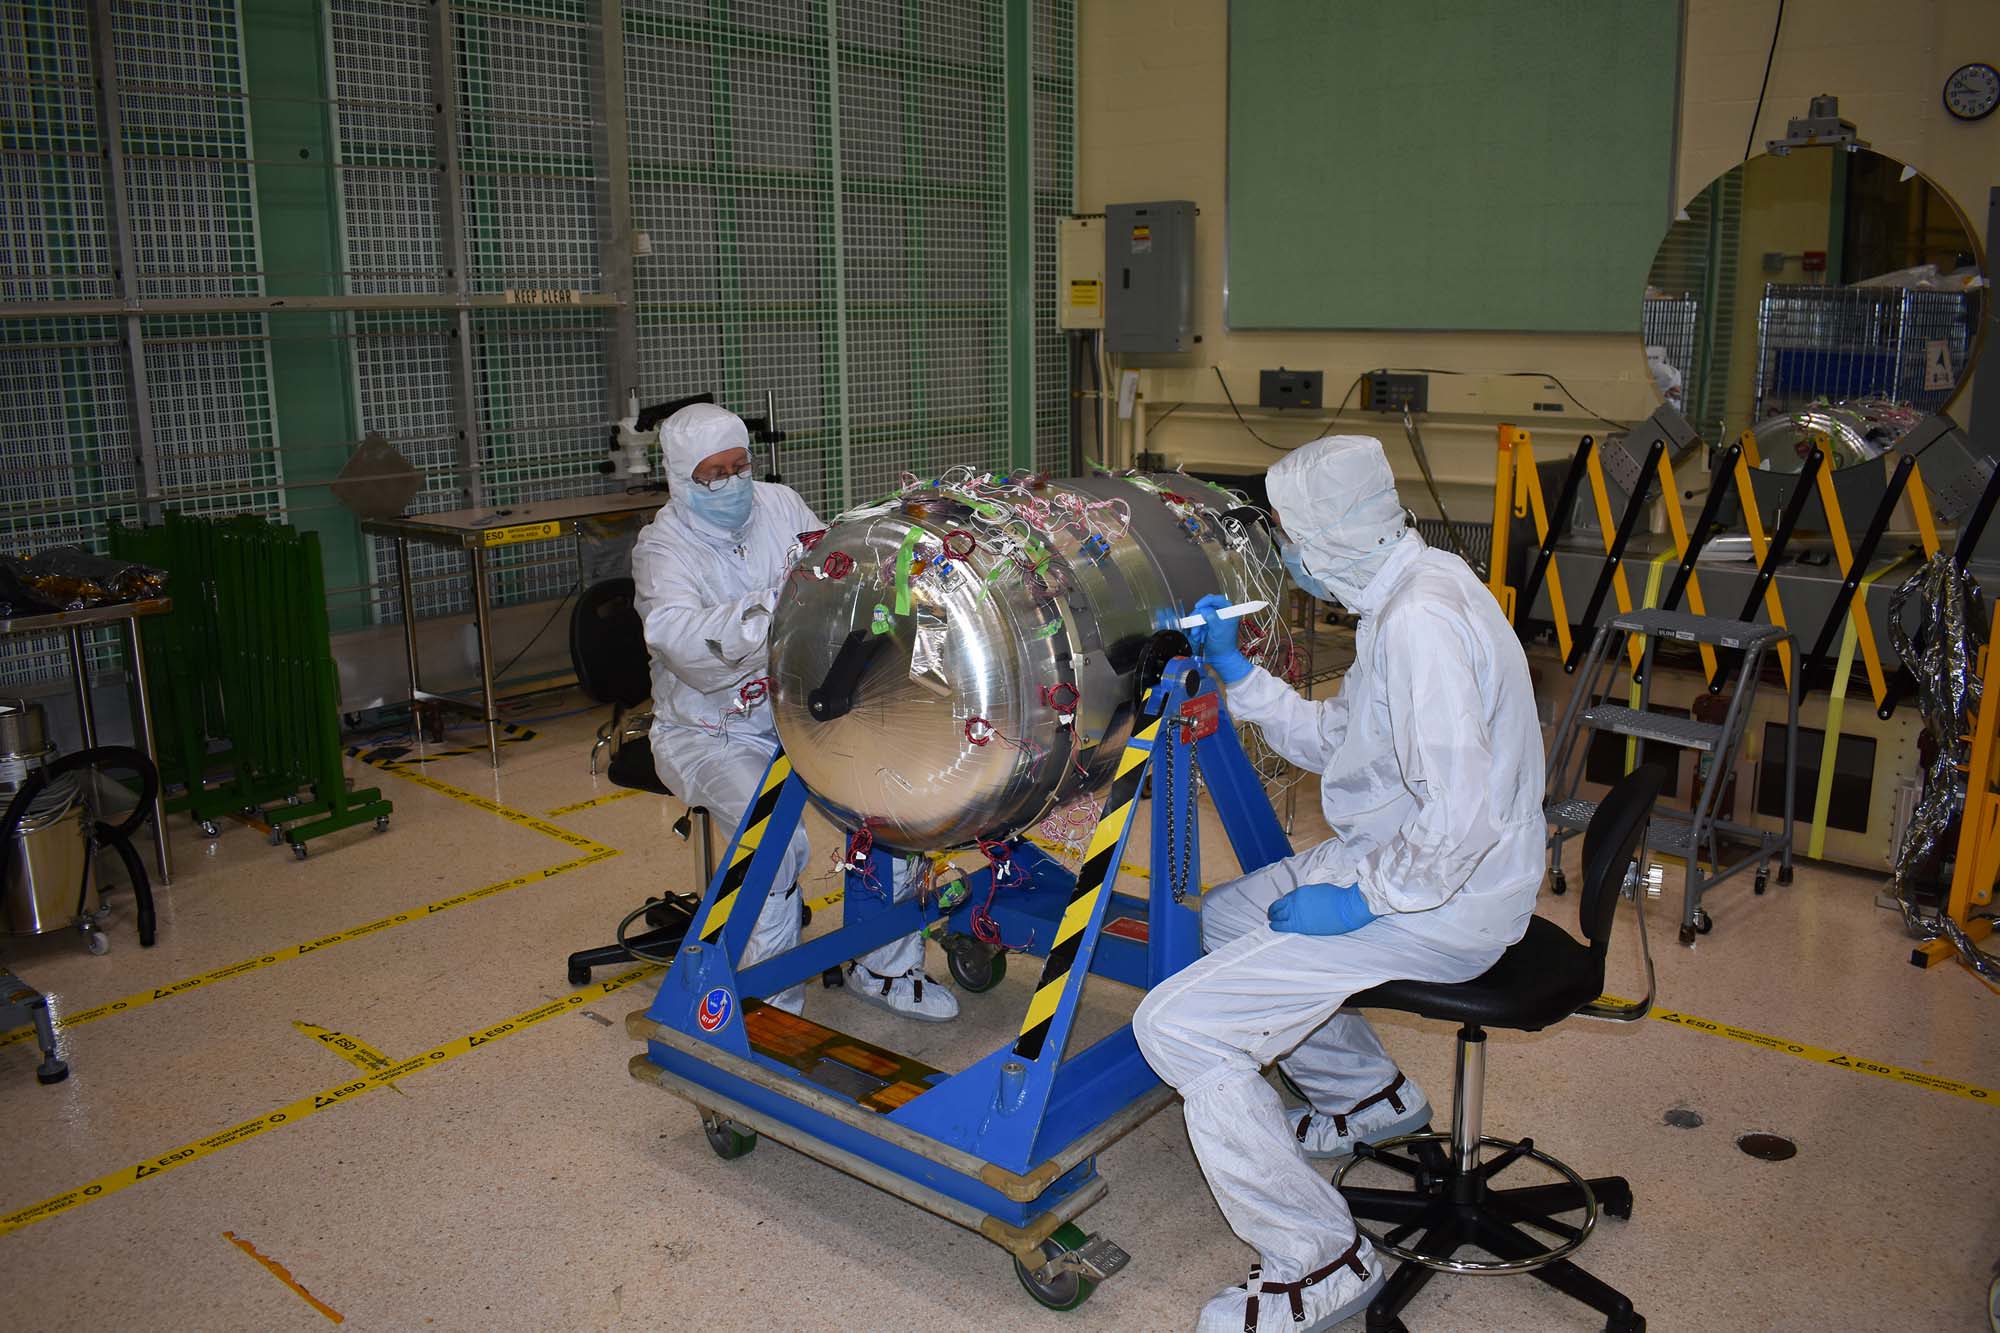
Thermal integration of PACE propulsion tank.
Inertial reference unit electromagnetic interference testing procedure. Credit: Henry, Dennis (Denny)
Installing the ETU SDA onto the Turnover Dolly.
NASA Technician Andrew Scharmann verifies correct spring deflection to properly preload the depolarizer optic into the Flight Depolarizer Mount Assembly.
ETU SDA Post Delivery Acceptance Testing side view.
ETU SDA Post Delivery Acceptance Testing front view.
ETU SDA in its shipping container for post delivery to Goddard Space Flight Center.
PACE Spacecraft VIEW ALL »

SPEXone in thermal vacuum chamber (Leiden, Holland) - thermal vacuum test complete. Credit: NASA
Installation of Existing SPEXOne MLI Blankets and Build and Install SPEX Bottom Blanket; SPEXone after MLI Blanket install. Credit: NASA
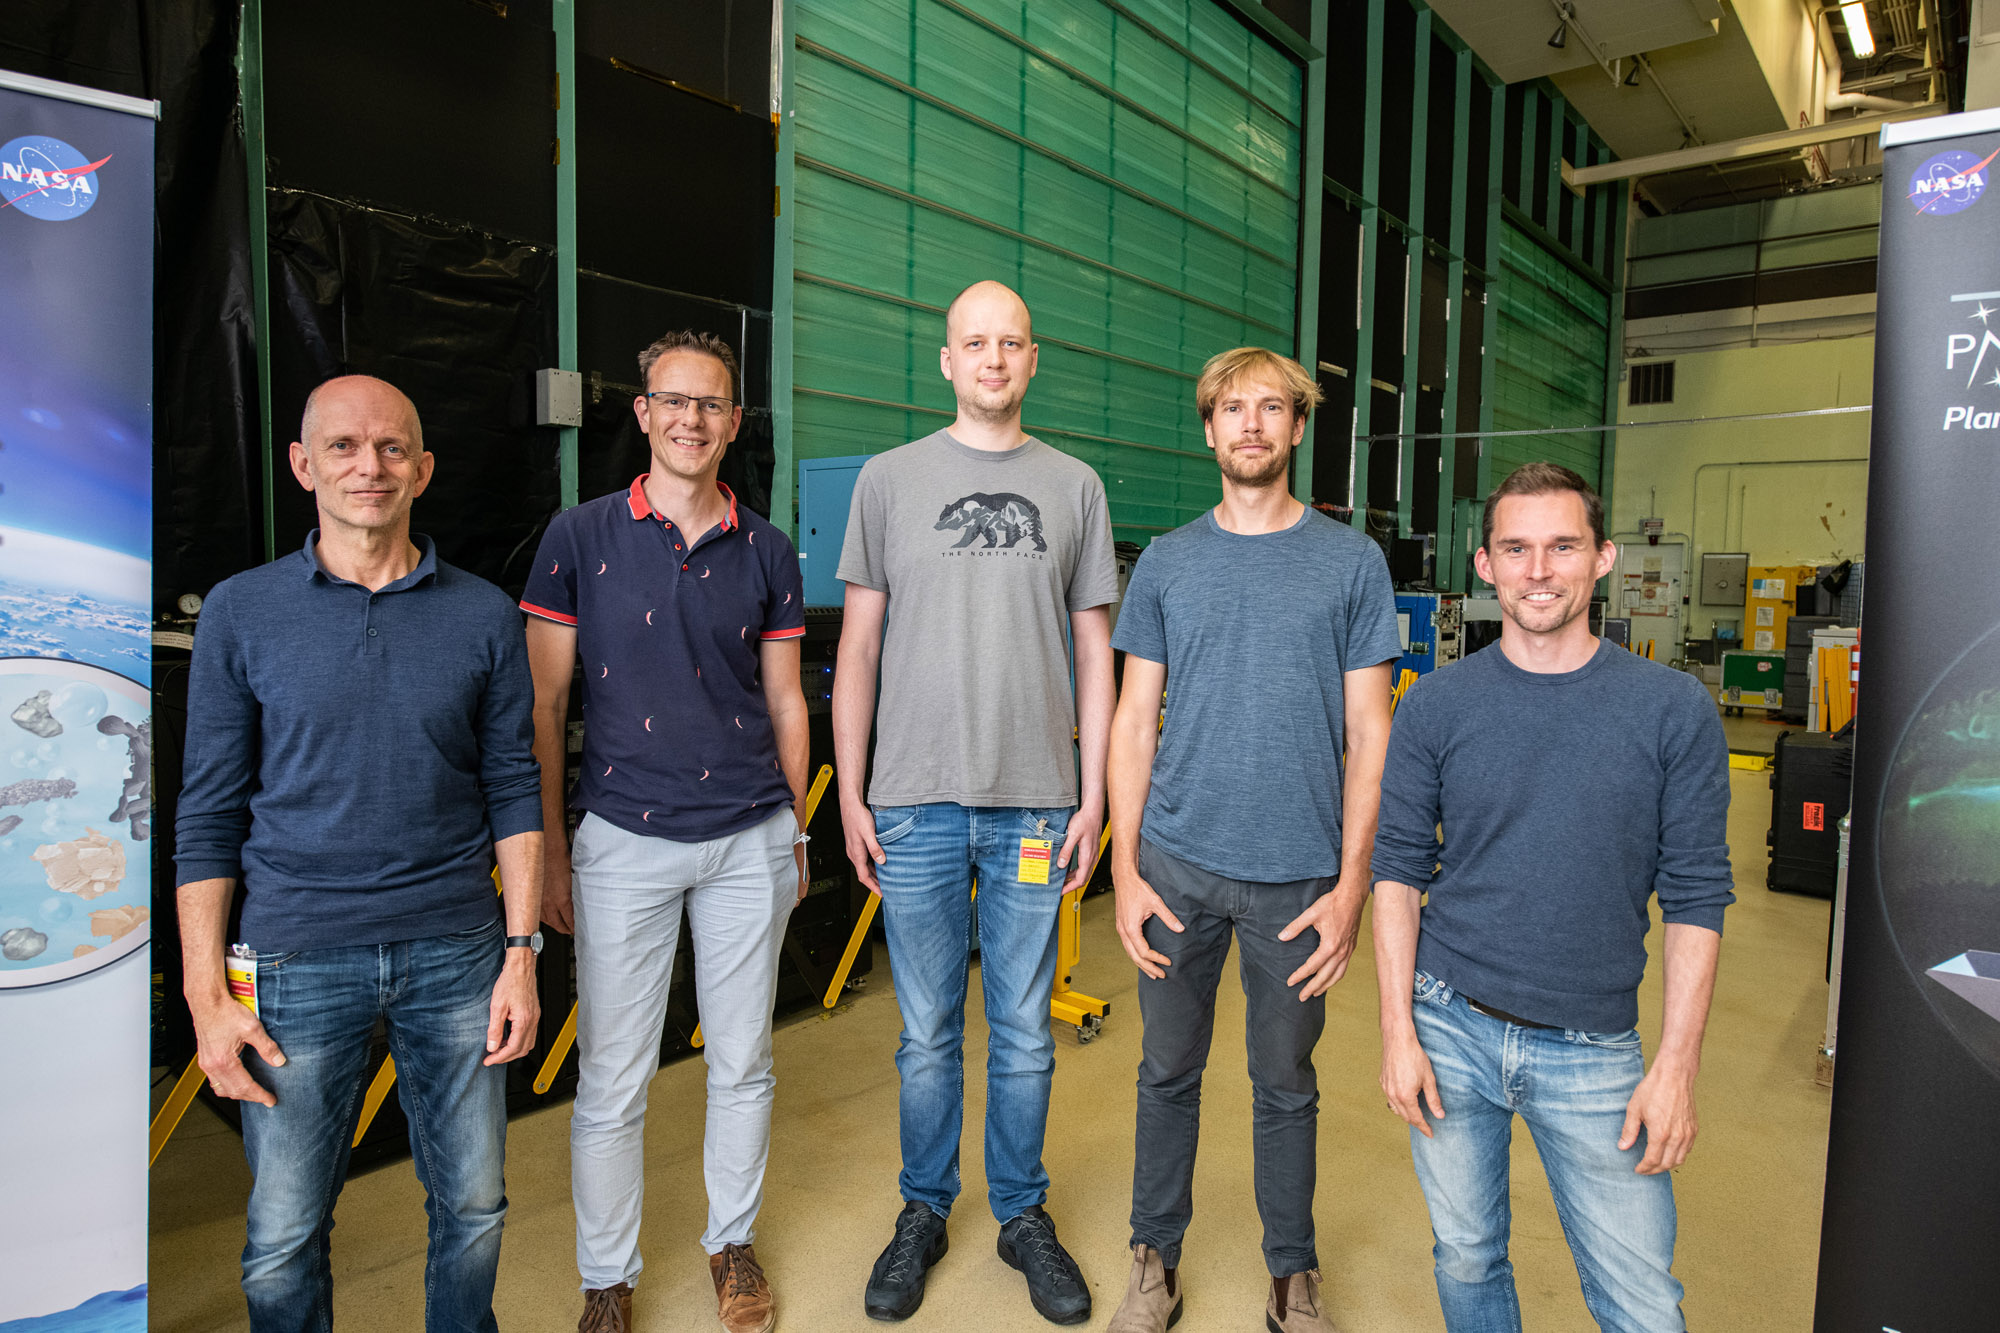
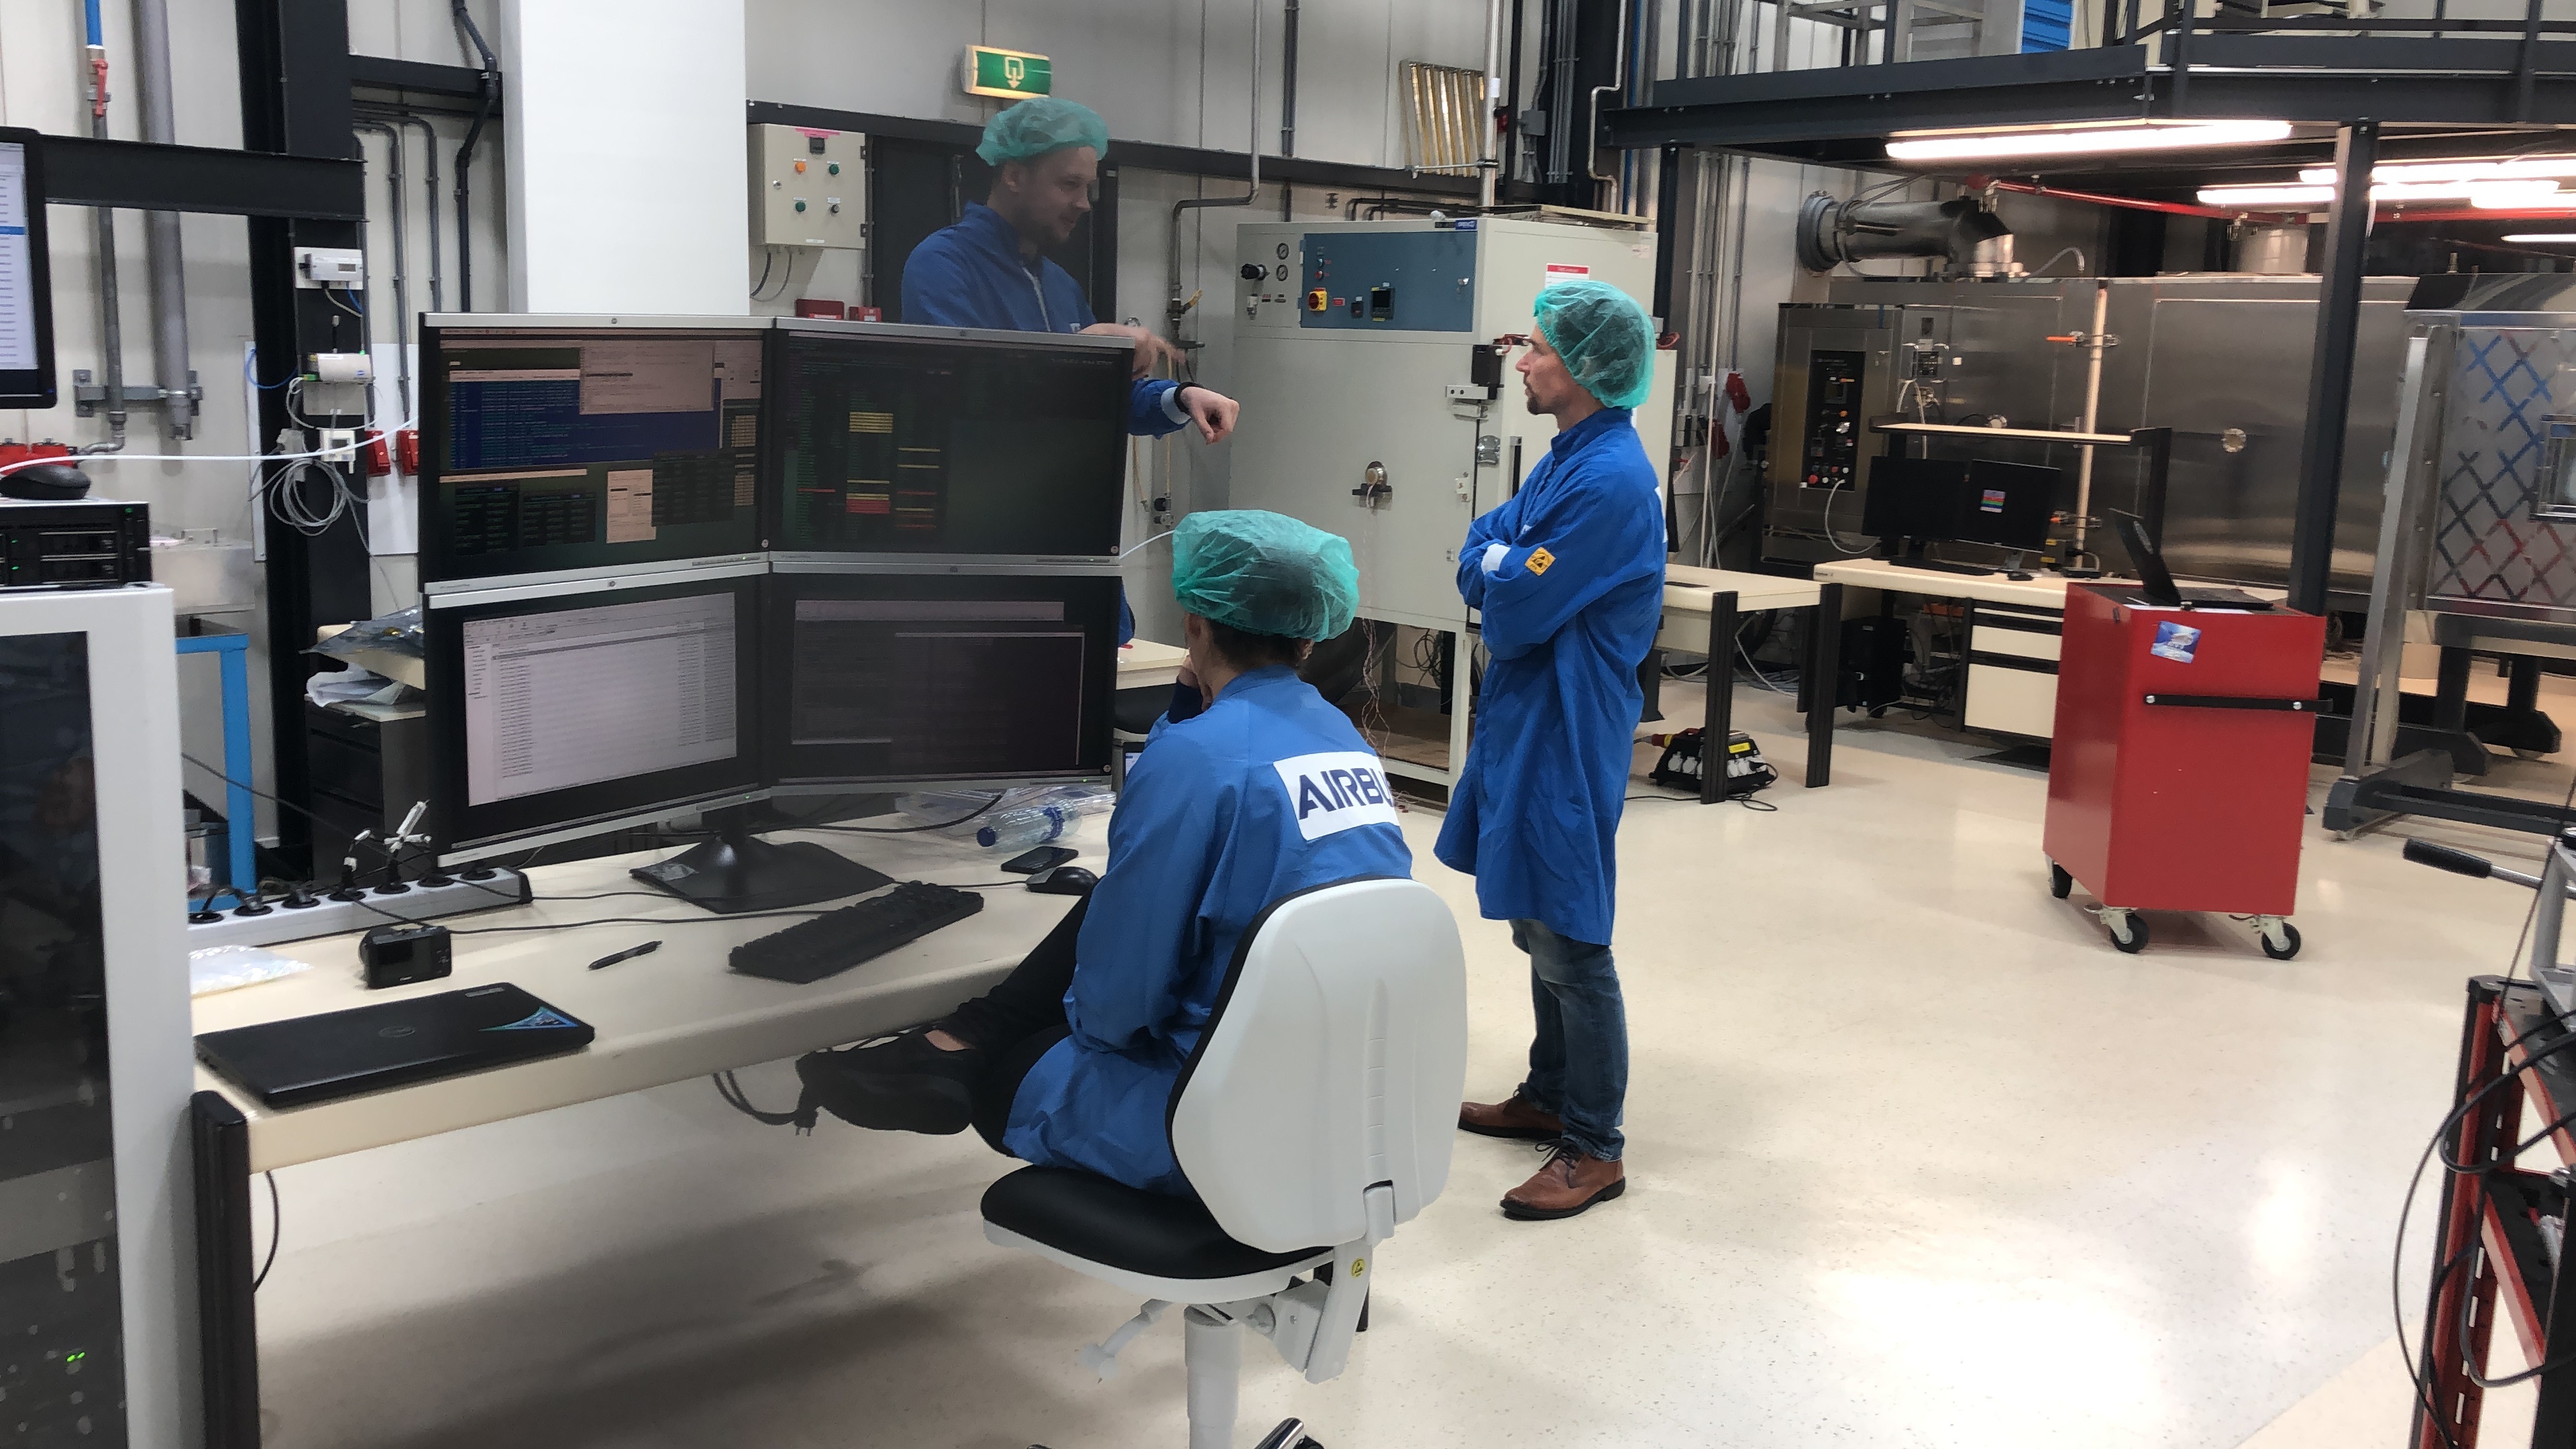
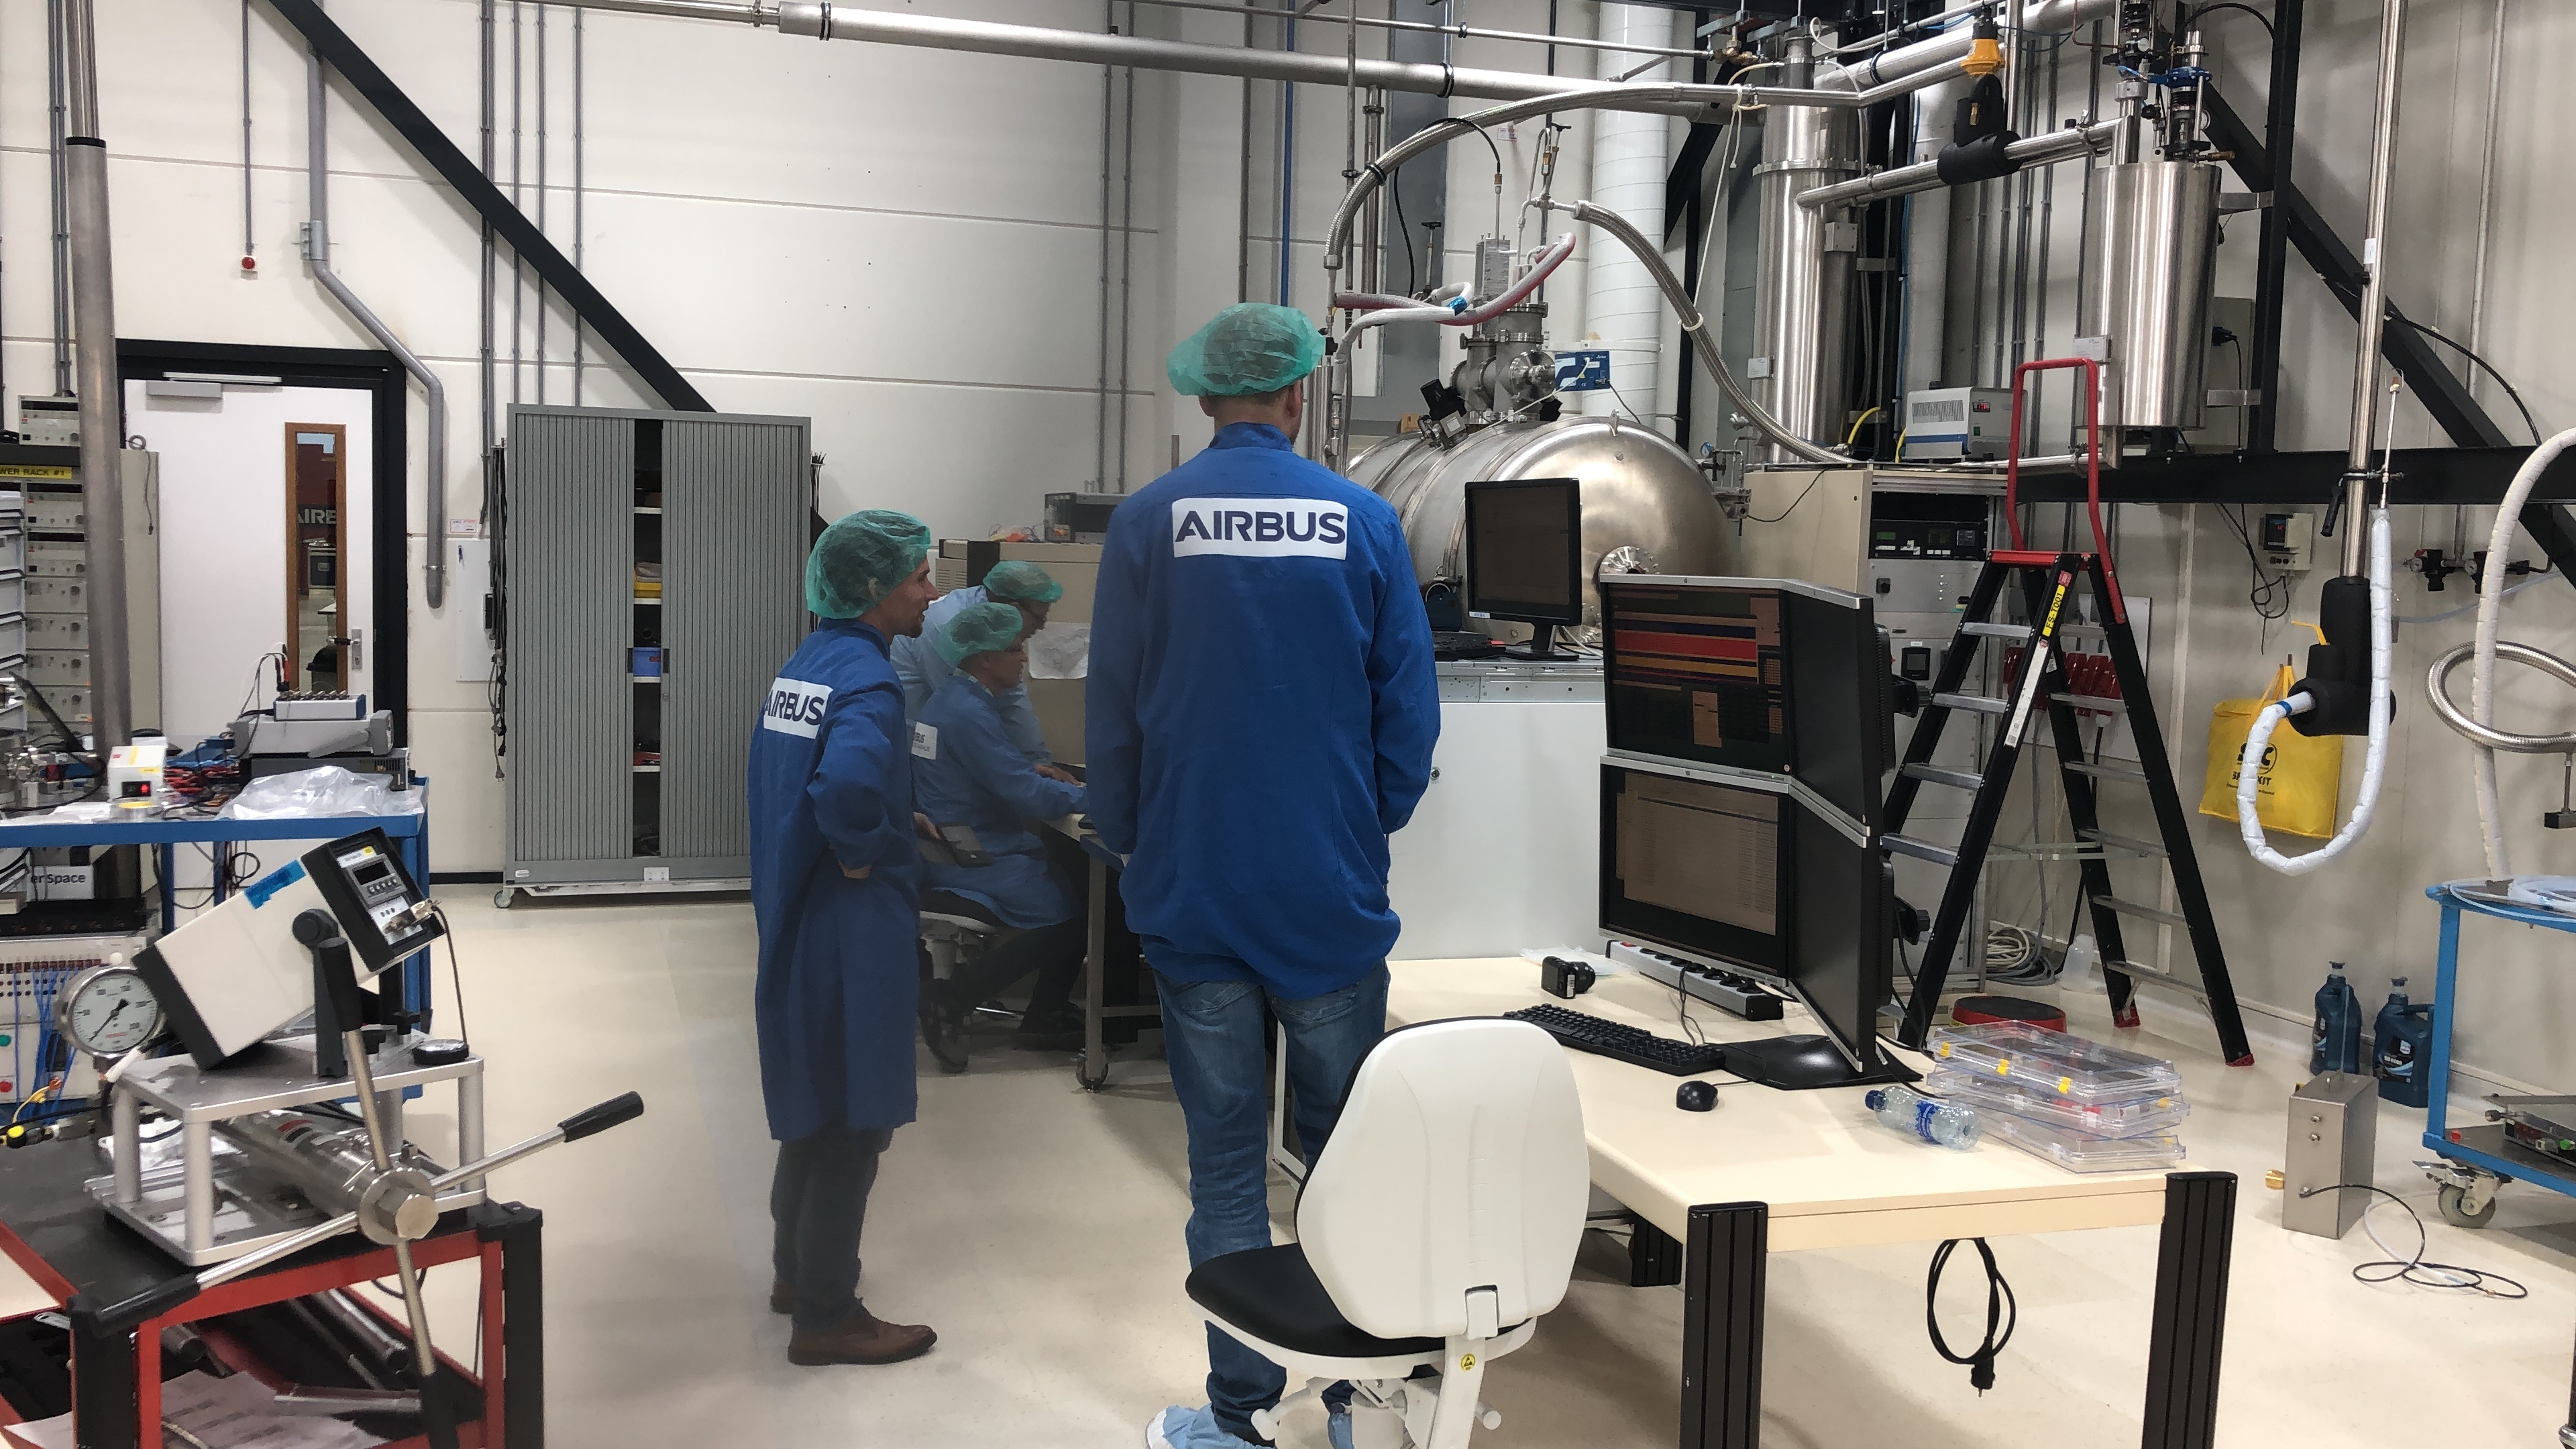
SPEXone team photos and PACE Control room. Credit: NASA
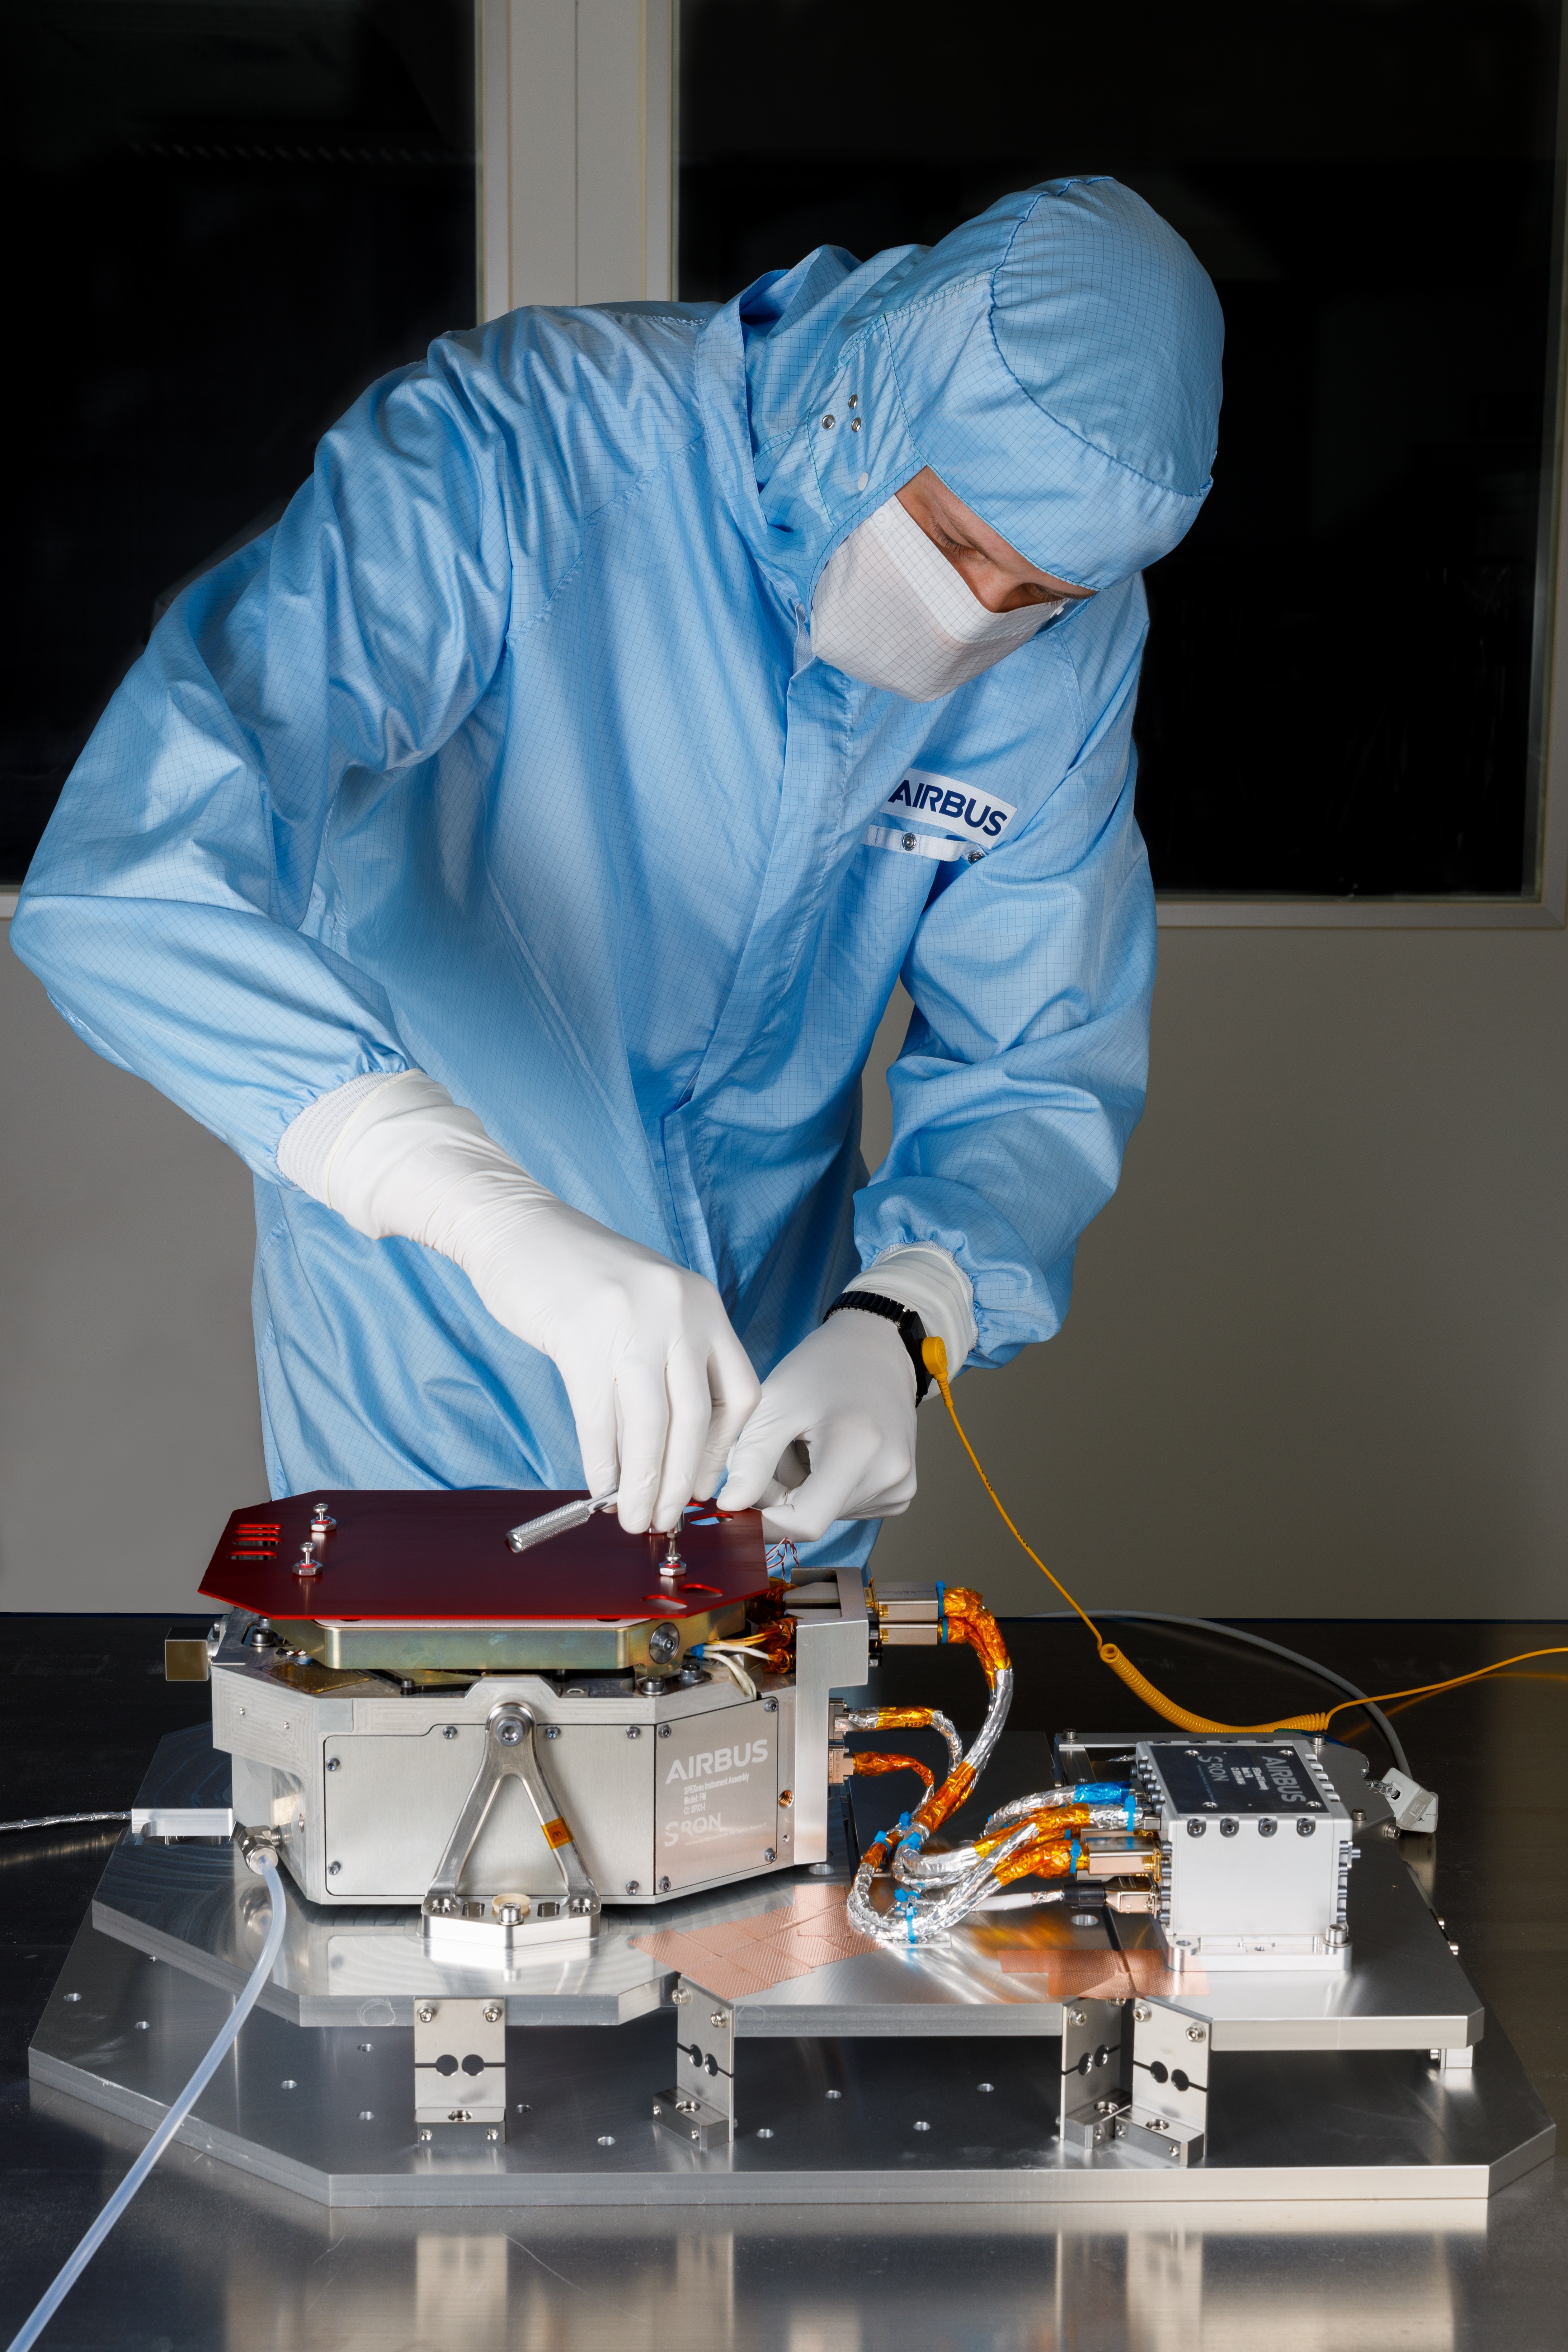
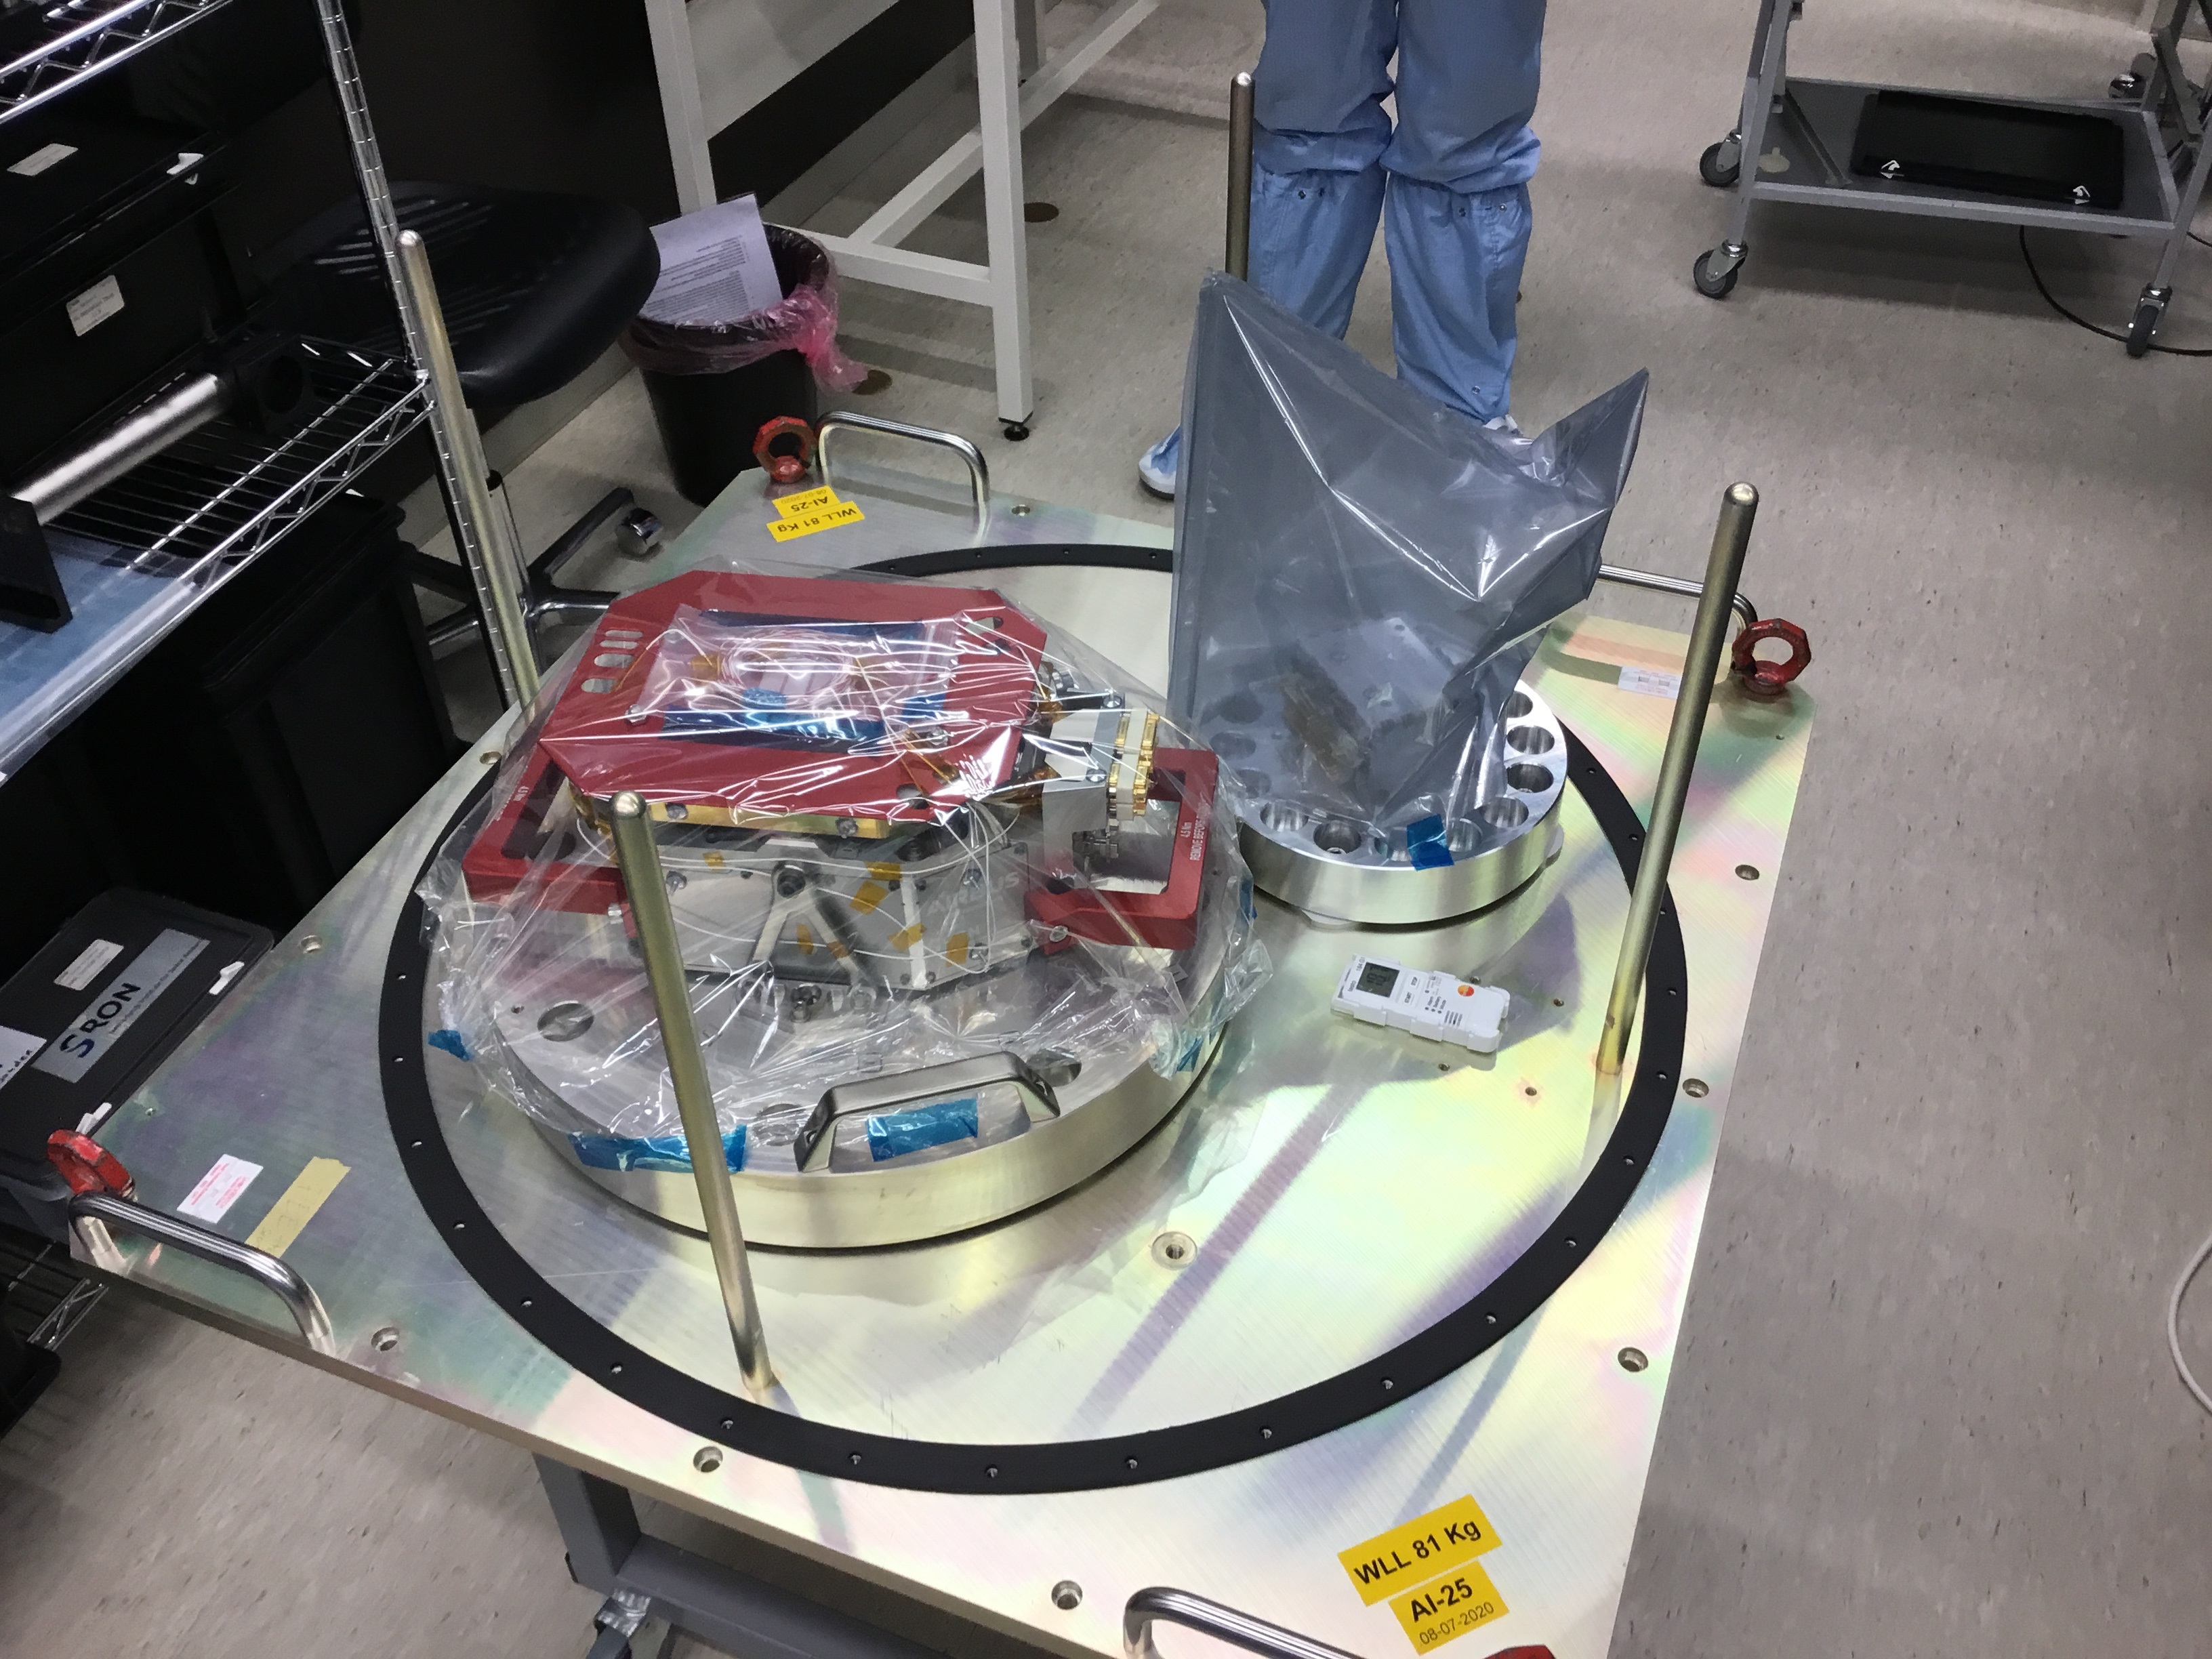
SPEXone instrument mid-point testing; SPEXone is a compact, optical satellite instrument that will characterize aerosols from low Earth orbit as part of the NASA PACE mission. SPEXone has been developed by a Dutch consortium consisting of SRON Netherlands Institute for Space Research and Airbus Defence and Space Netherlands, supported by opto-mechanical expertise from TNO. SRON and Airbus DS NL are responsible for the design, manufacturing and testing of the instrument. The scientific lead is in the hands of SRON. SPEXone is a public-private initiative, funded by the Netherlands Space Office (NSO), the Netherlands Organization of Scientific Research (NWO), SRON and Airbus DS NL Credit: NASA
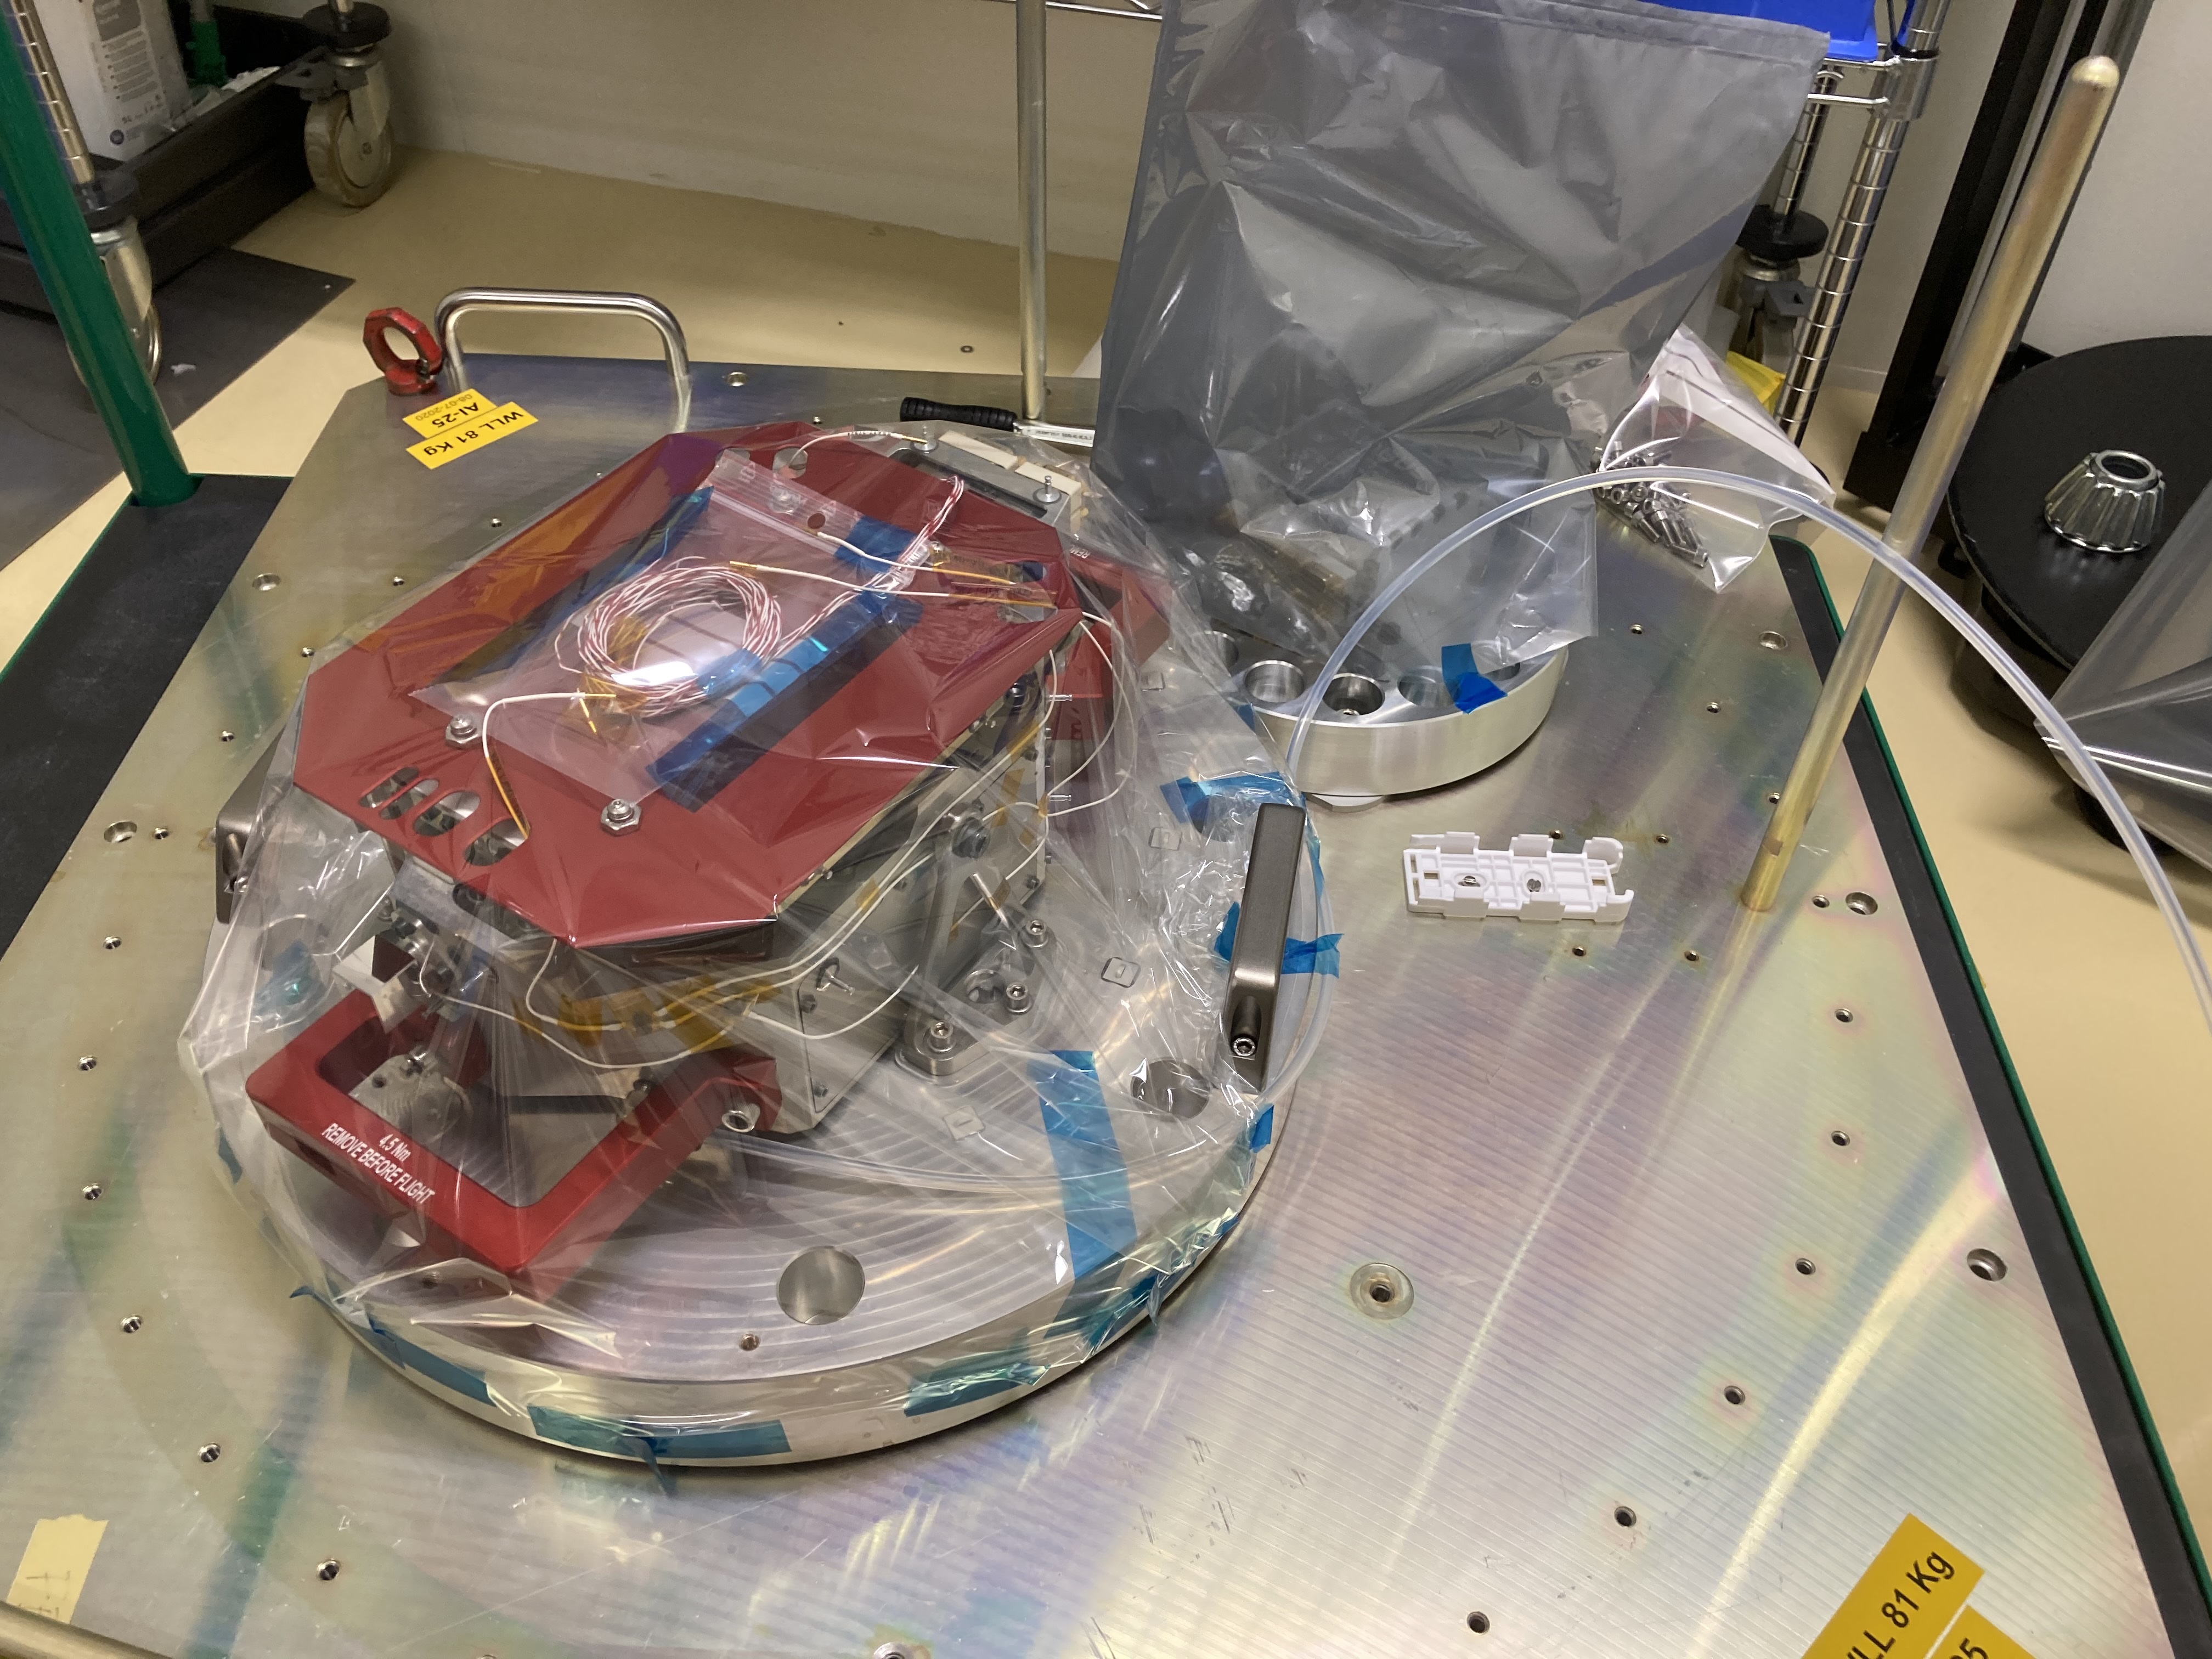
SPEXone on the vibration table in Toulouse, France following vibration testing. Credit: Andre Dress
Thermal Vacuum Chamber (TVAC) testing of SPEXone. Credit: Andre Dress

SPEXone in the thermal vacuum chamber (Leiden, Holland) following thermal vacuum testing. Credit: Andre Dress
A technician prepares the SPEXone flight instrument for vibration testing. Credit: Andre Dress
The SPEXone thermal vacuum test facility in the Netherlands. Credit: Andre Dress
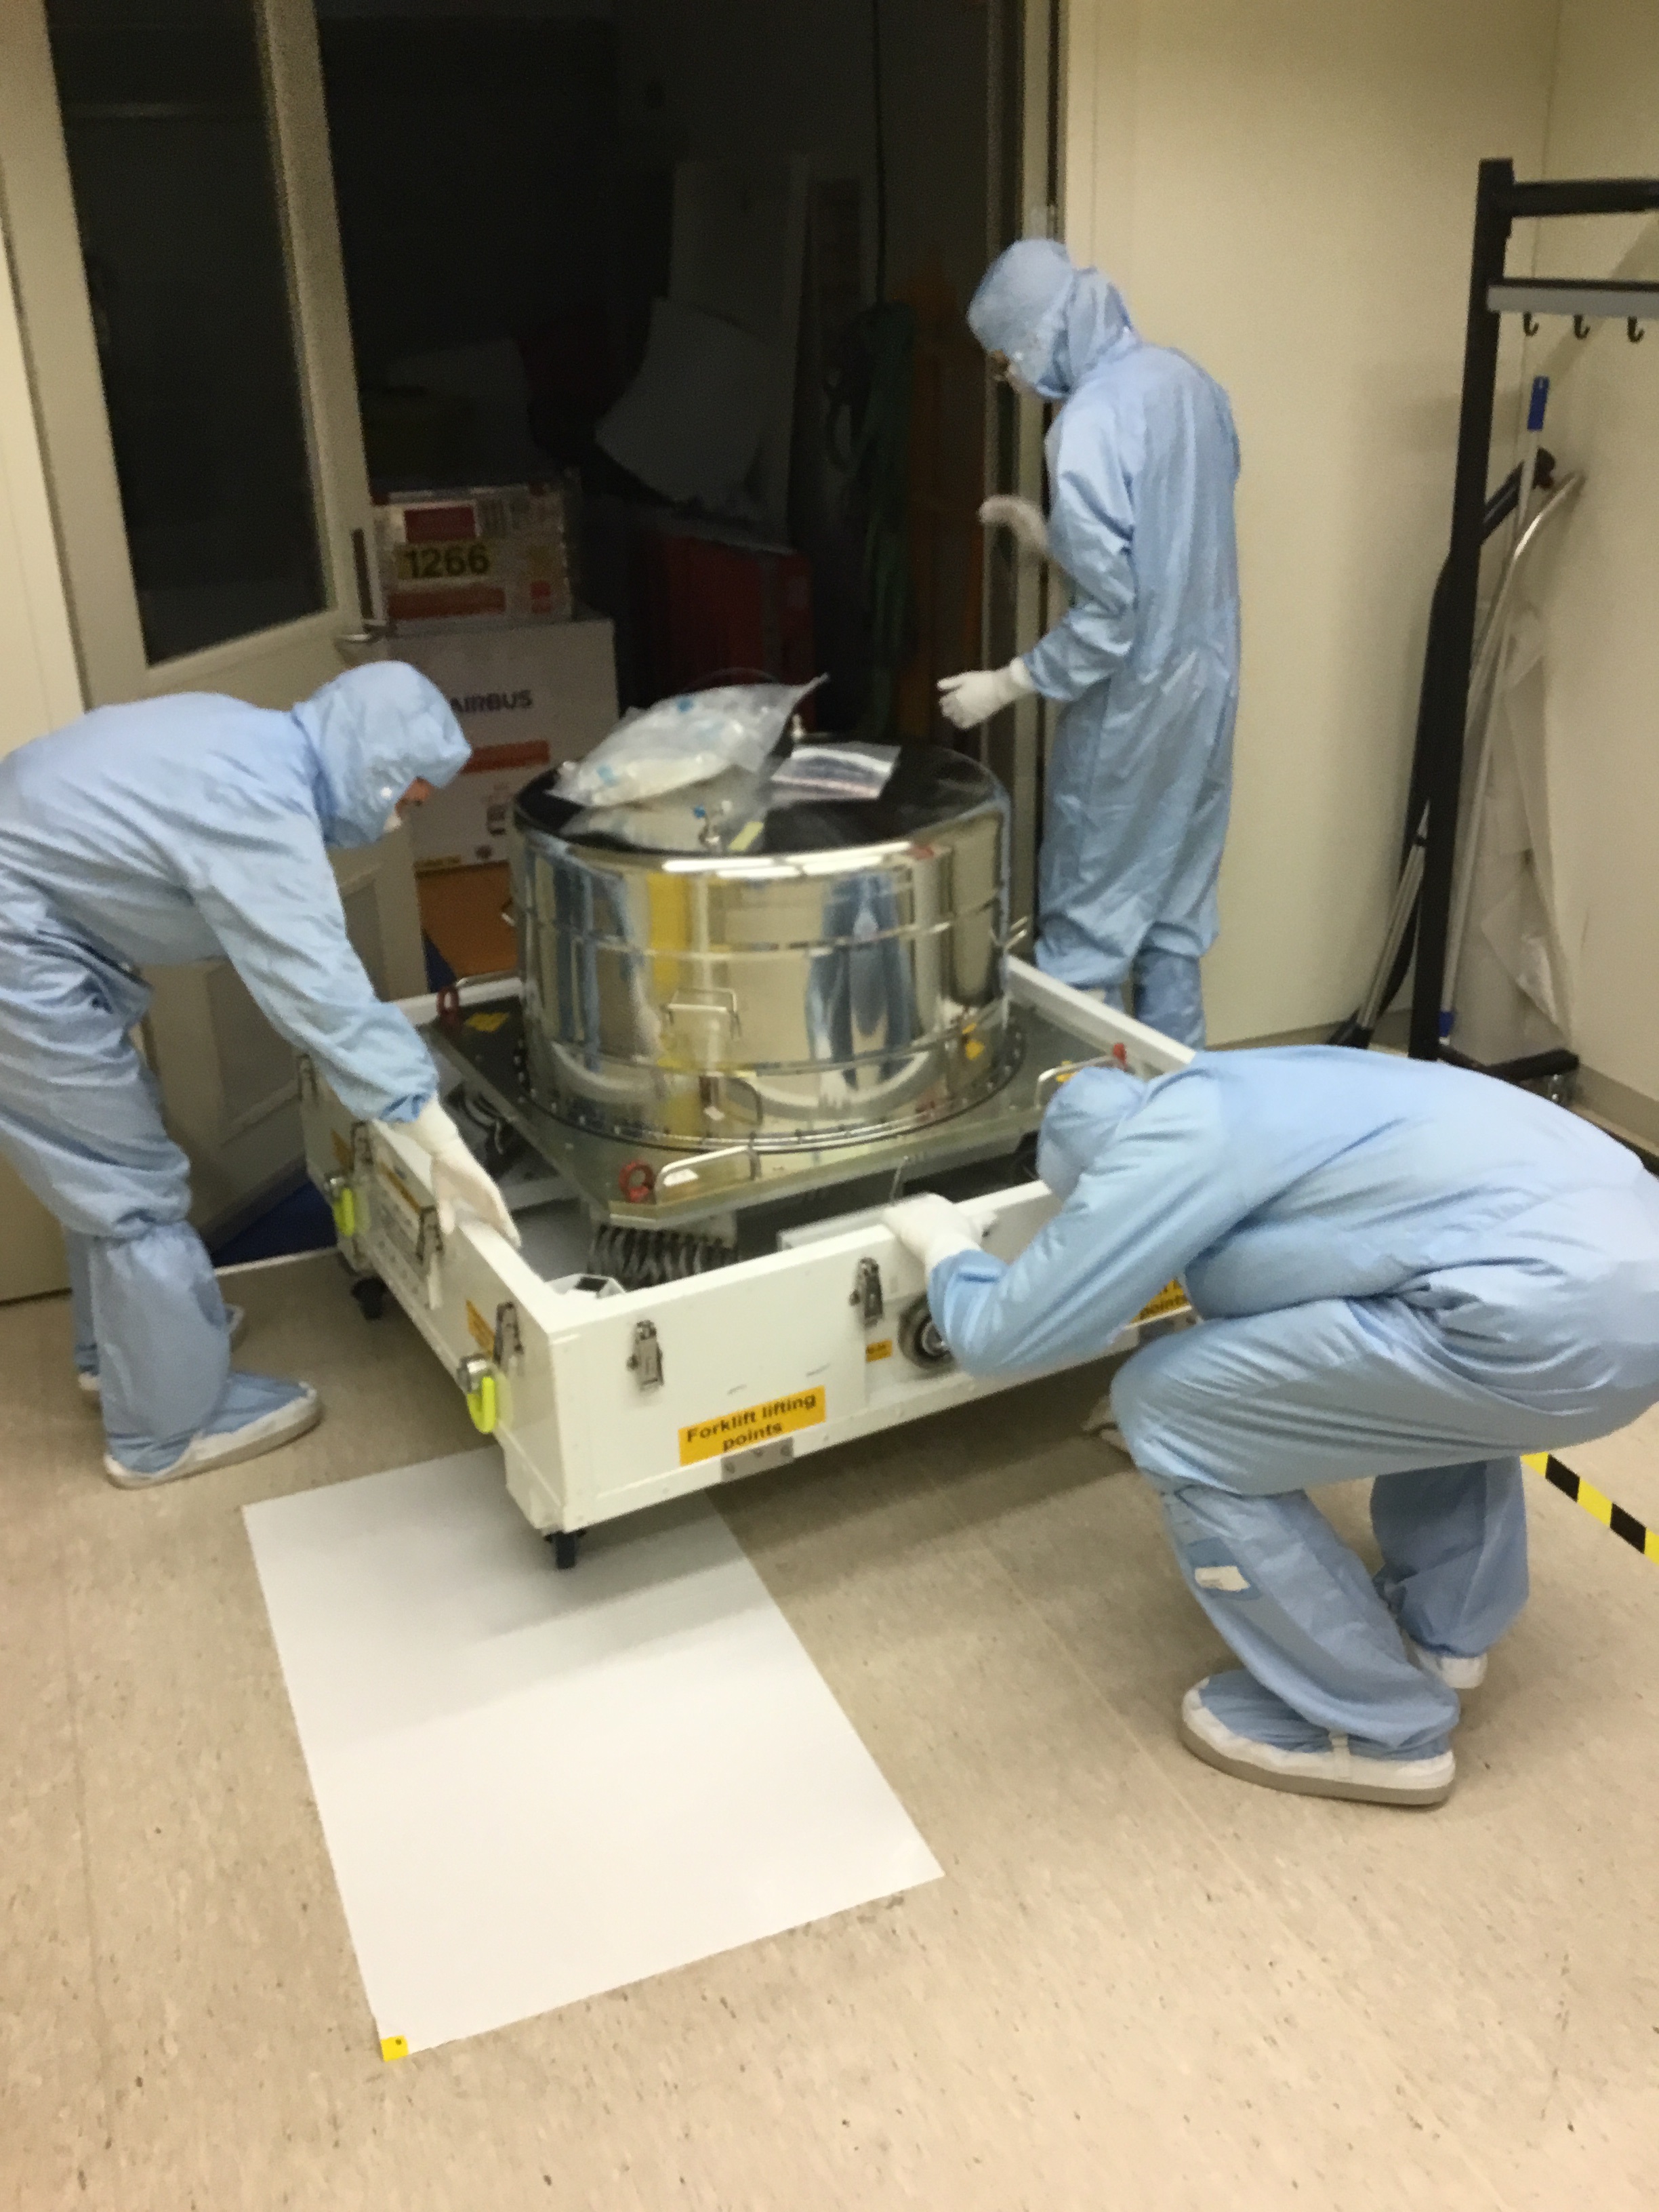
SPEXone unpacked at SRON. Credit: Andre Dress
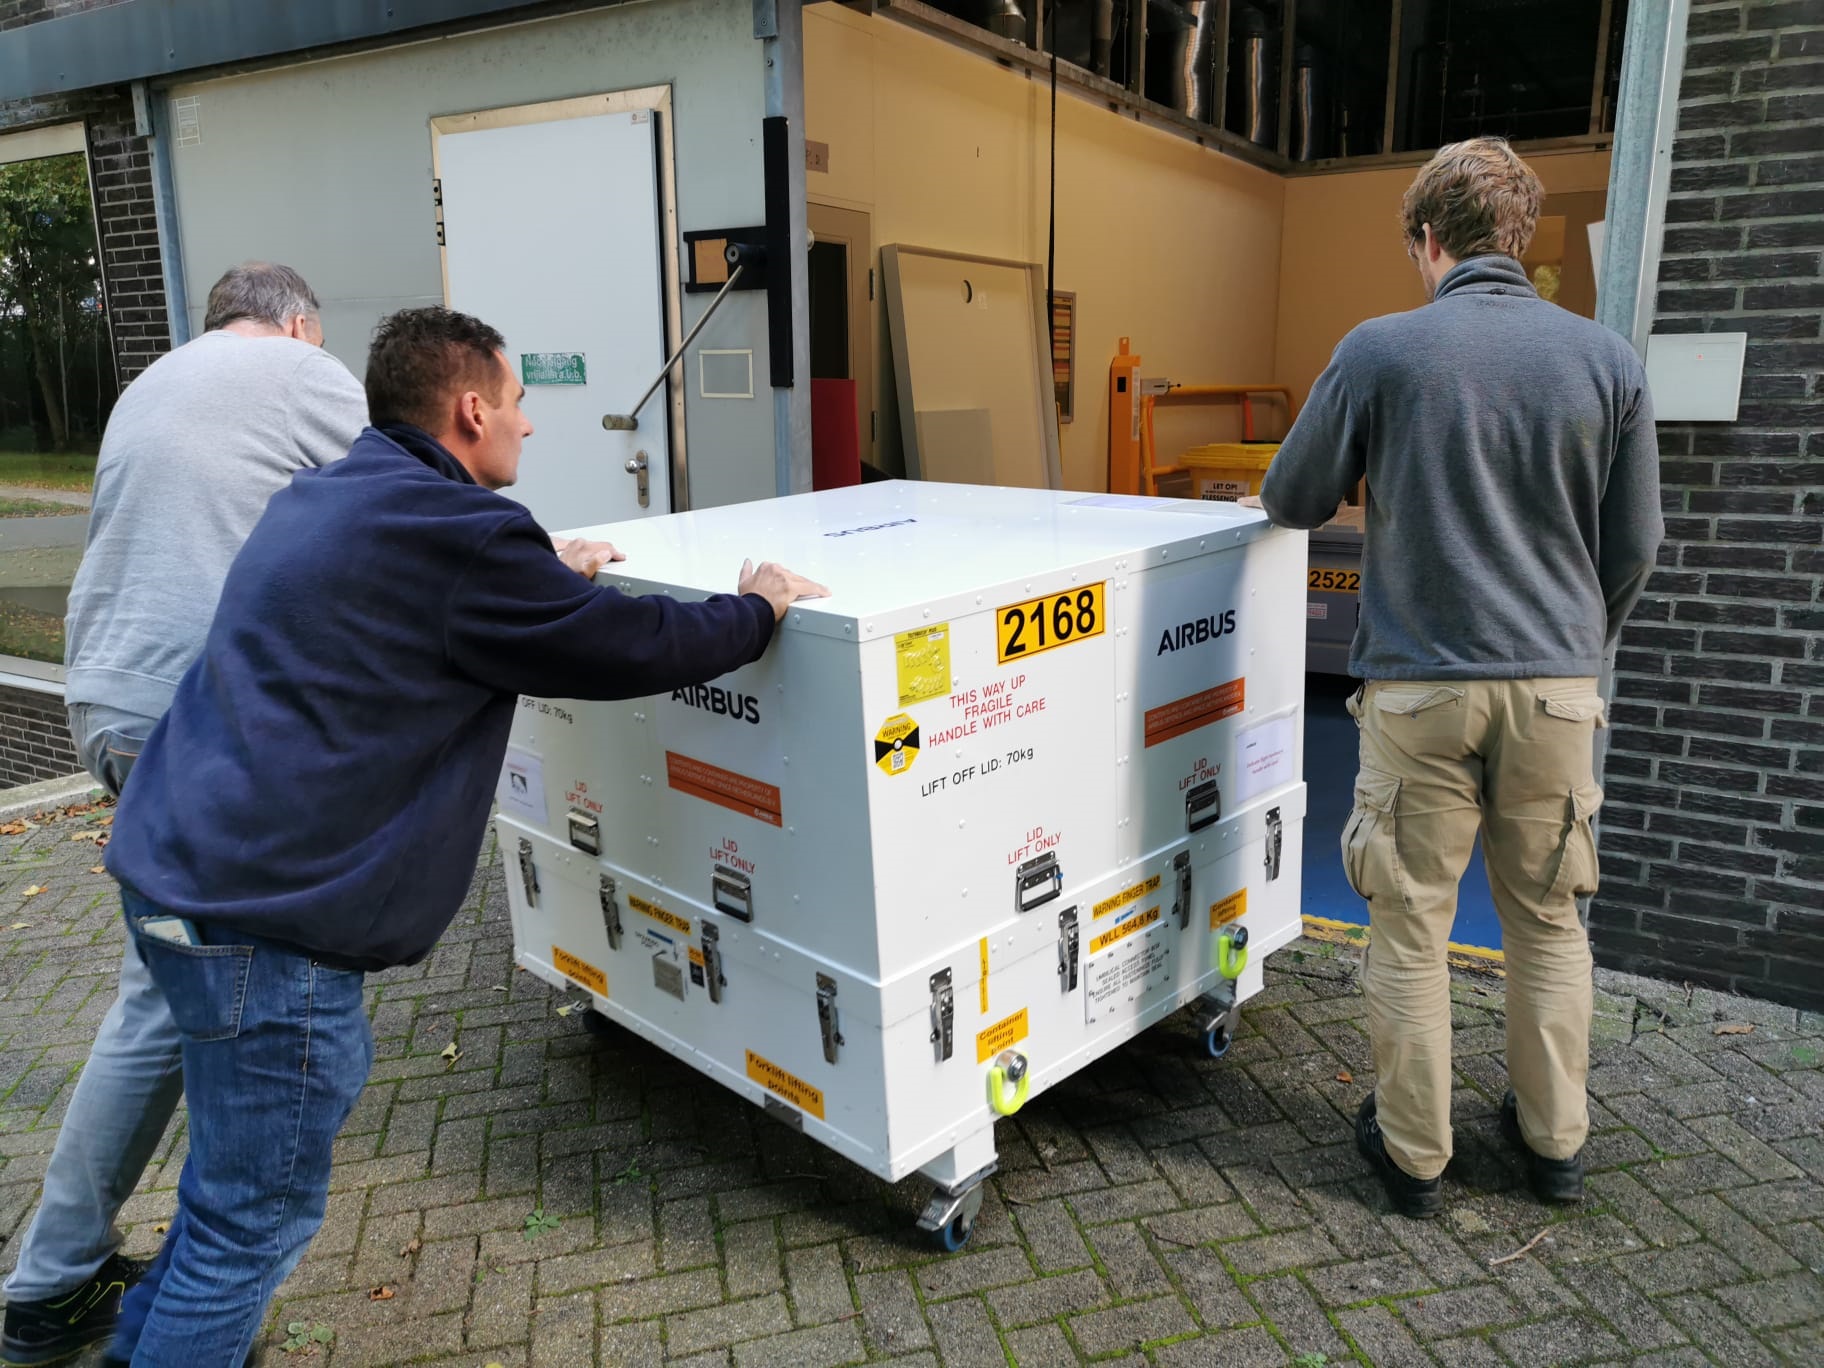
SPEXone arriving at SRON in its shipping container, post environmental testing. Credit: Andre Dress
SPEXone in its container as it arrives for transport to the SRON Clean Room. Credit: Andre Dress
SPEXone VIEW ALL »
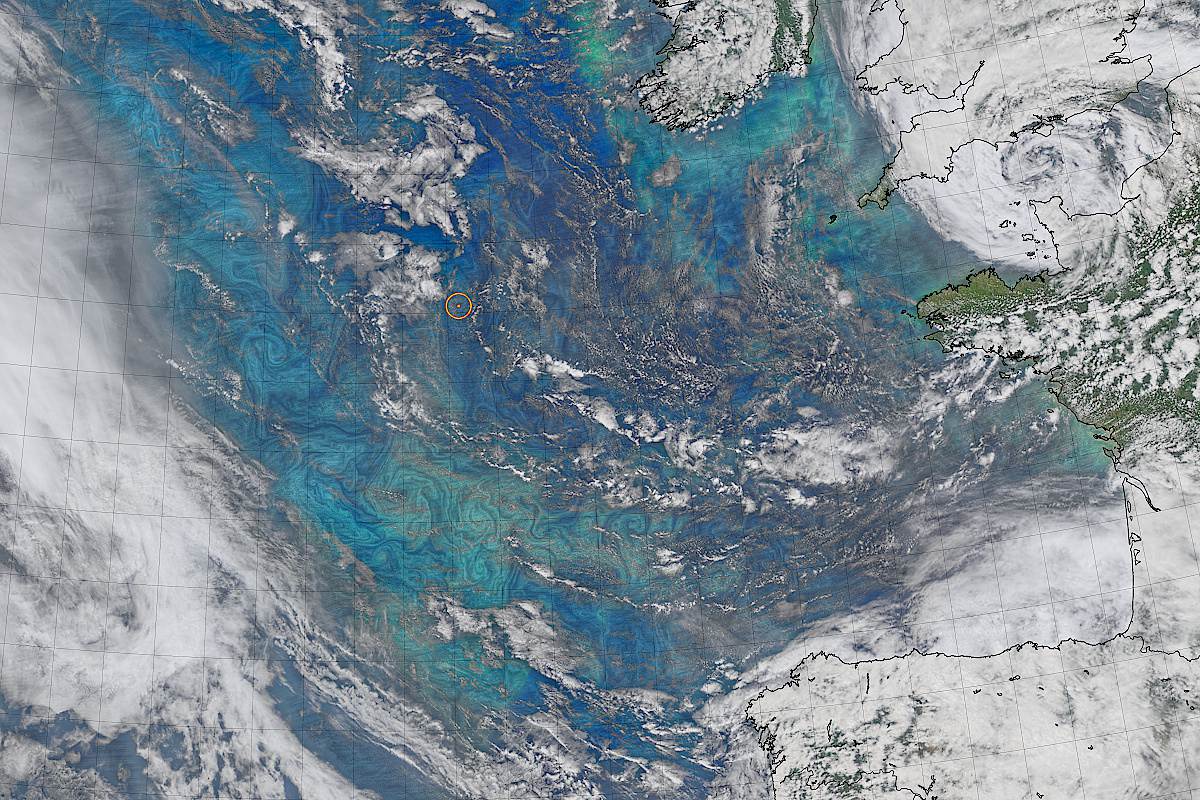
On May 13, 2021, EXPORTS researchers aboard three ships (Discovery, James Cook, and Sarmiento de Gamboa) were taking advantage of sunny weather and calmer seas to collect samples. All three ships were at the location marked by the dot in the orange circle. Credit: NASA Ocean Color Image Gallery
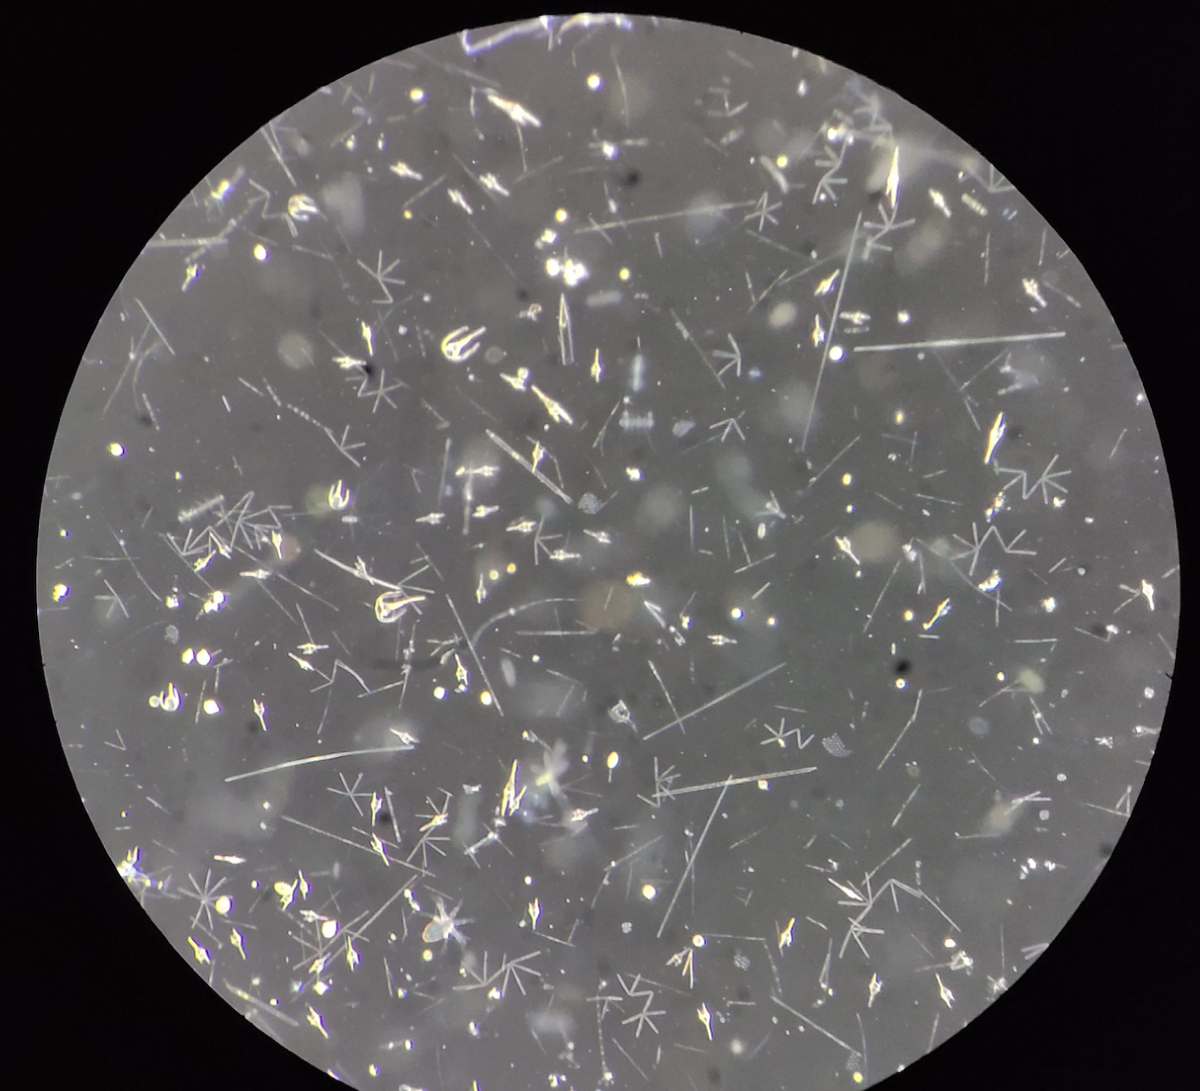
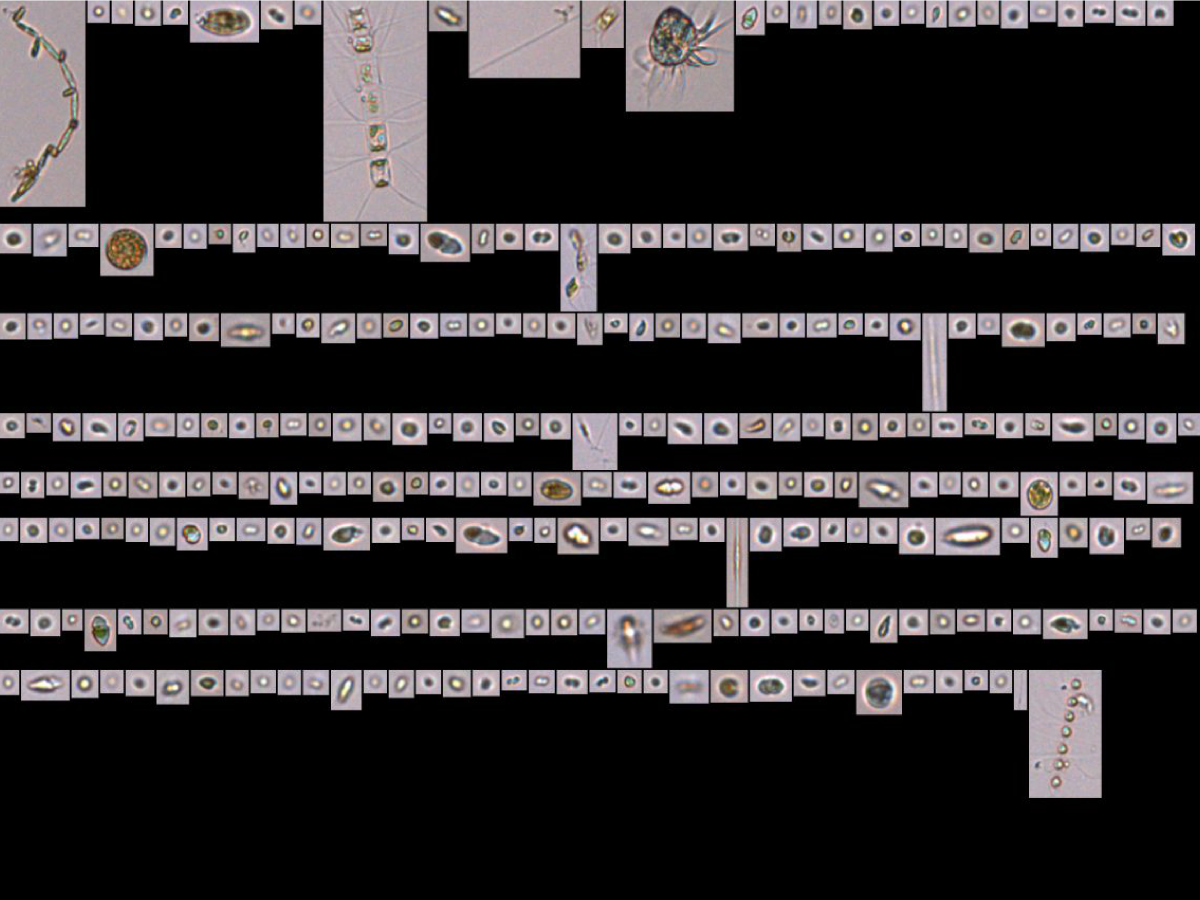
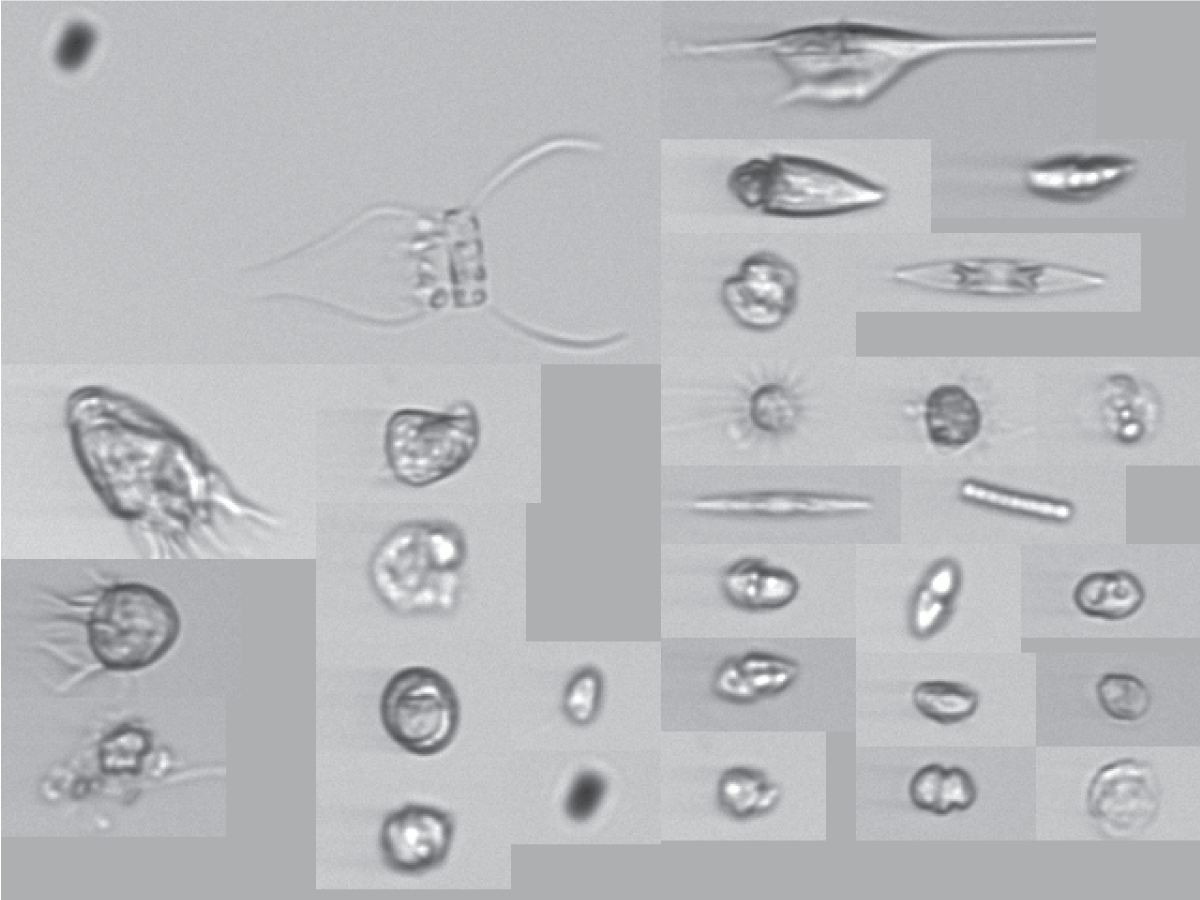
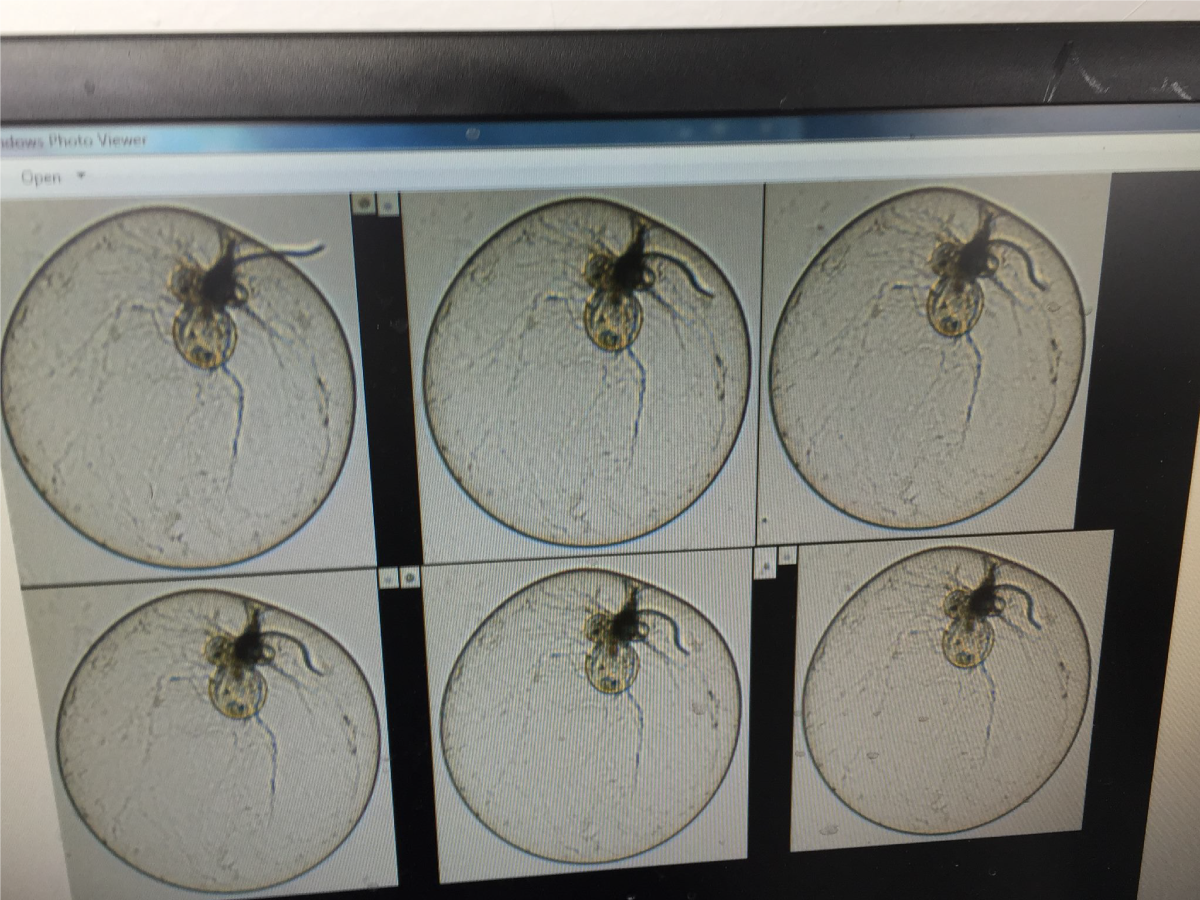
Diverse plankton from surface waters seen under a microscope. It is so concentrated that you don't need to zoom to identify the species. Credit: Laura Holland/ University of Rhode Island
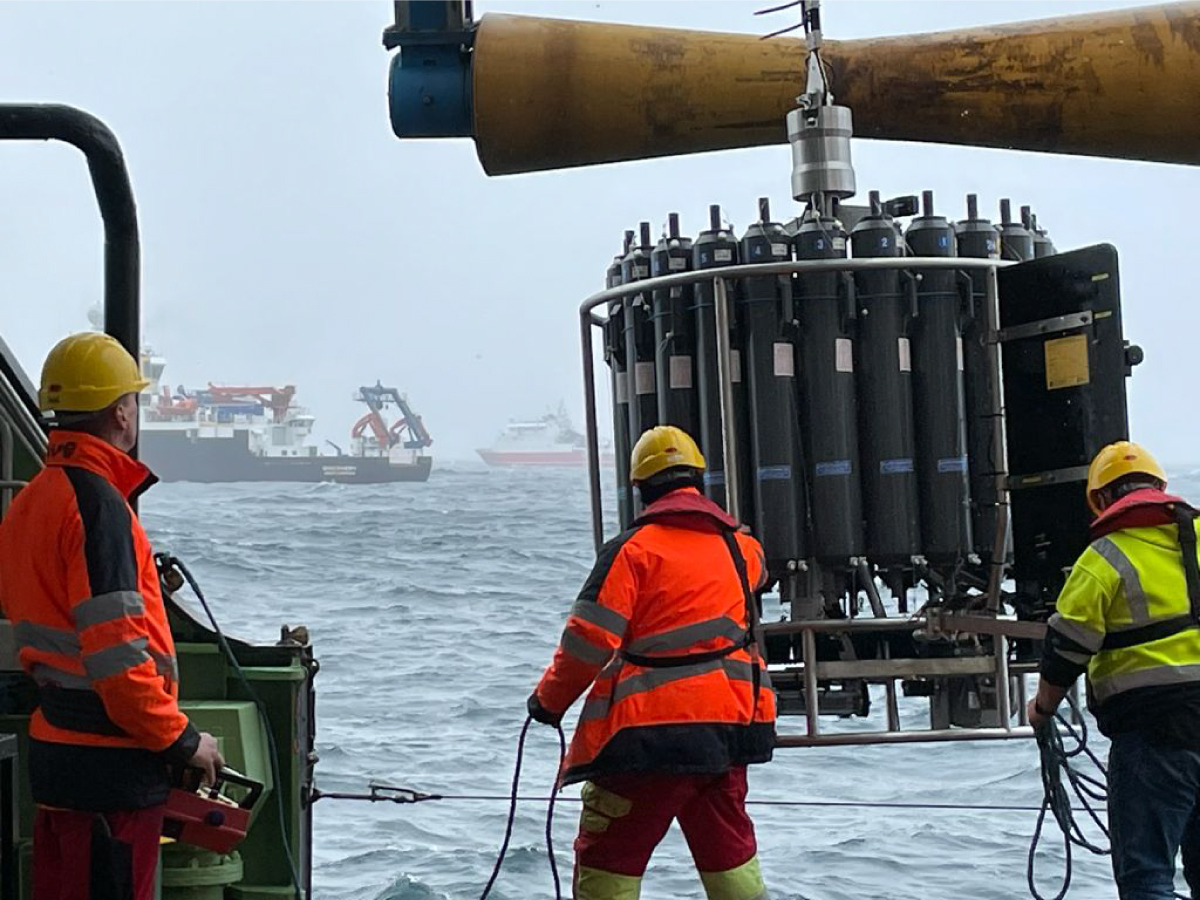
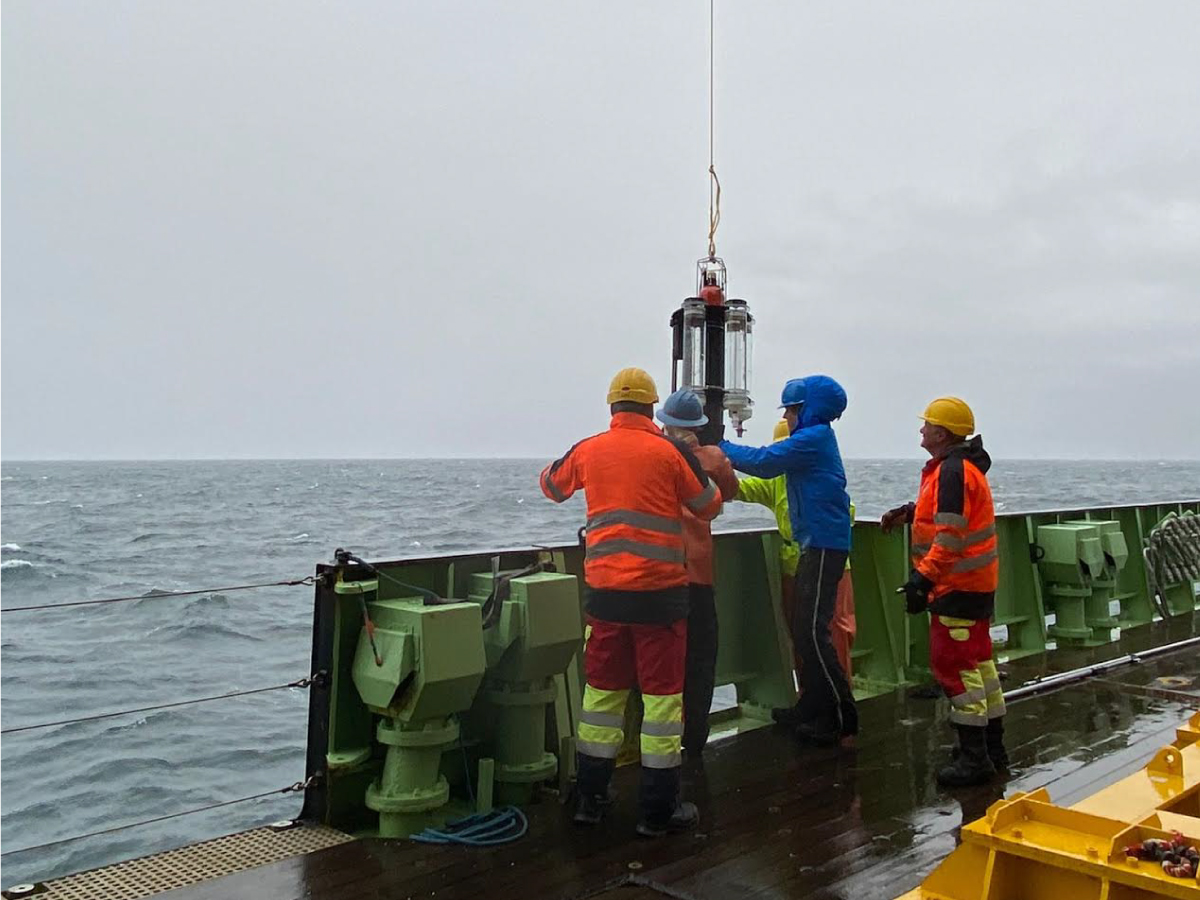
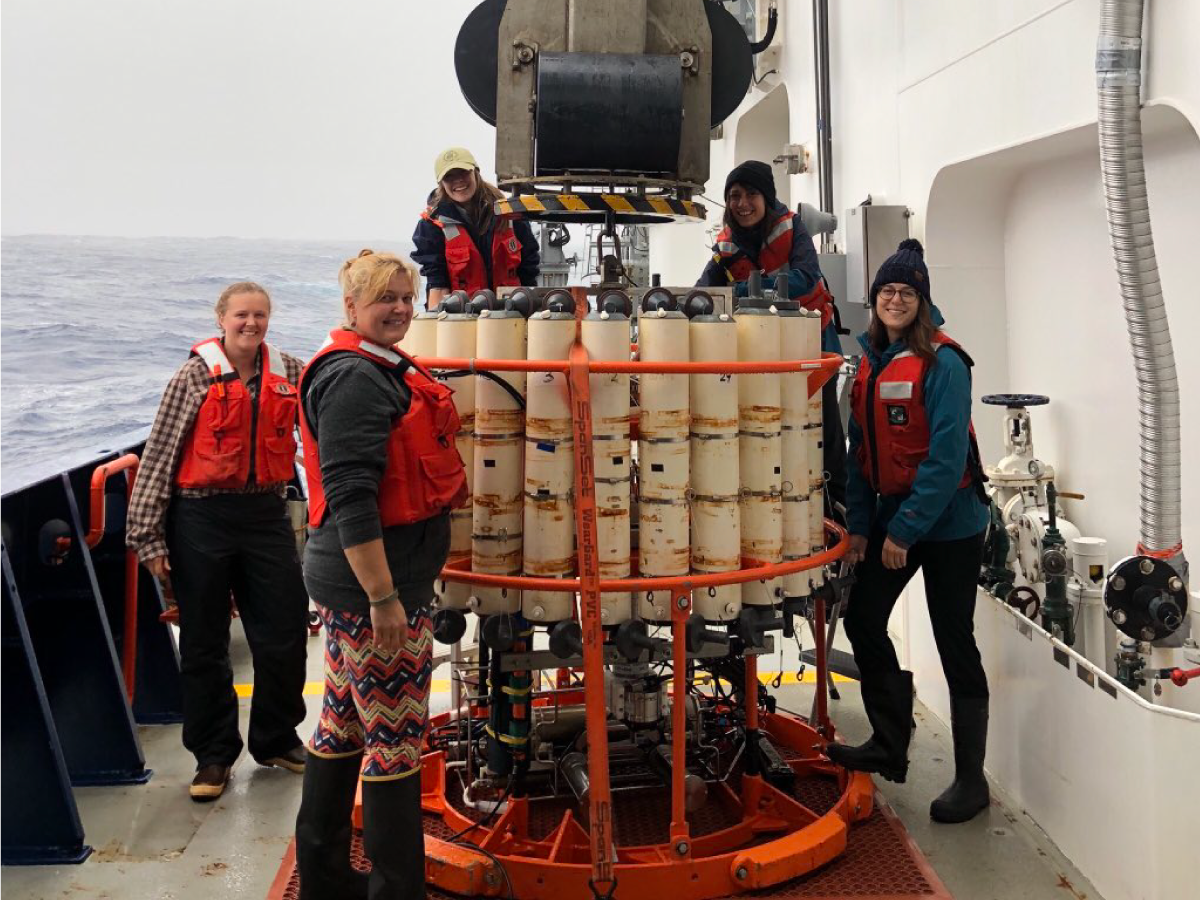
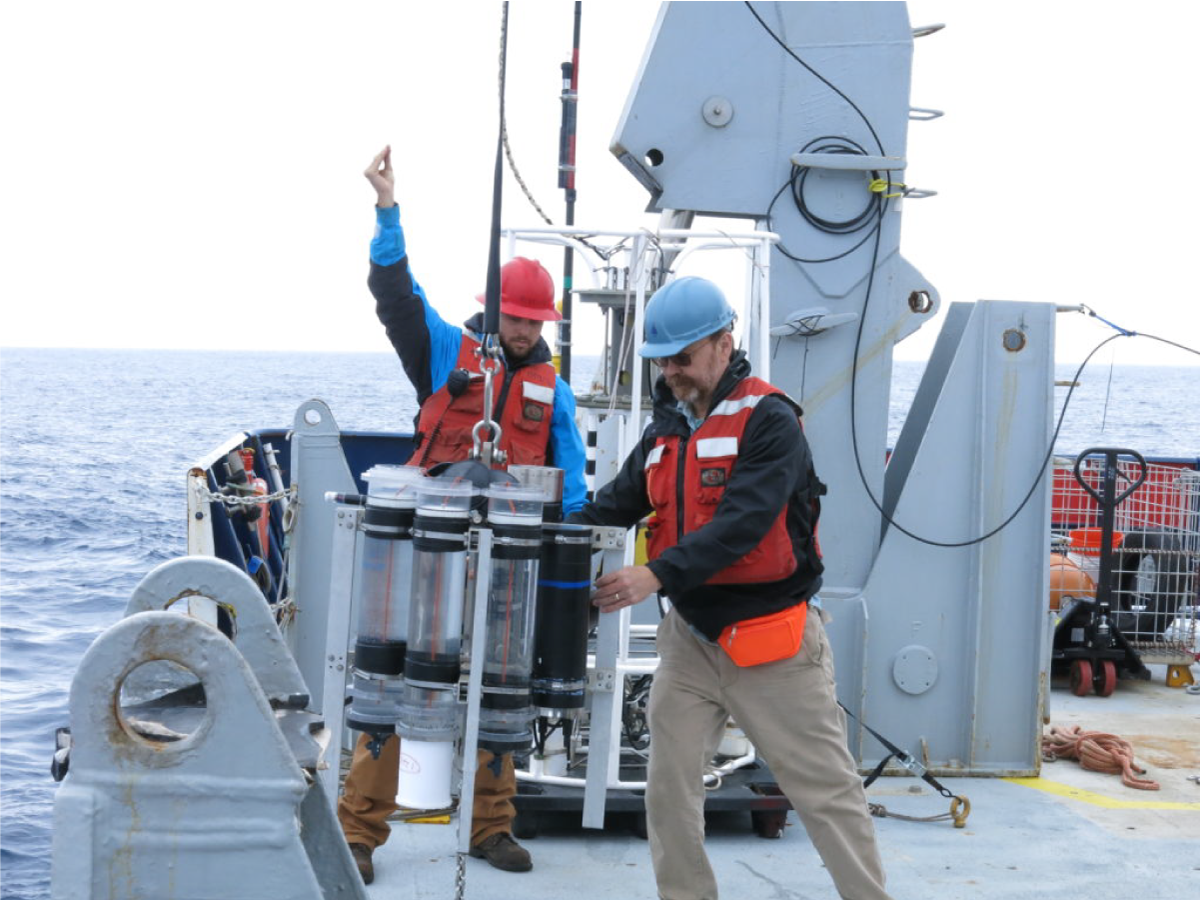
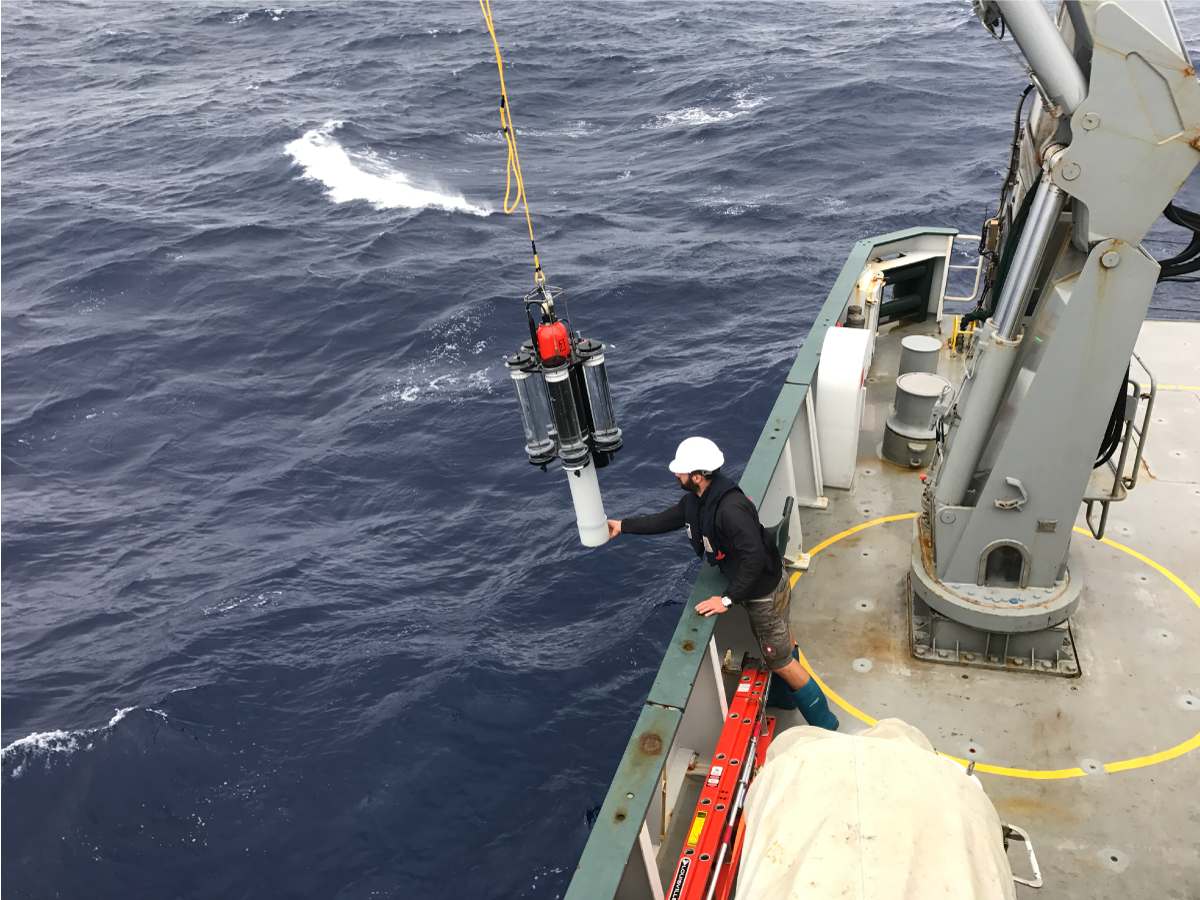
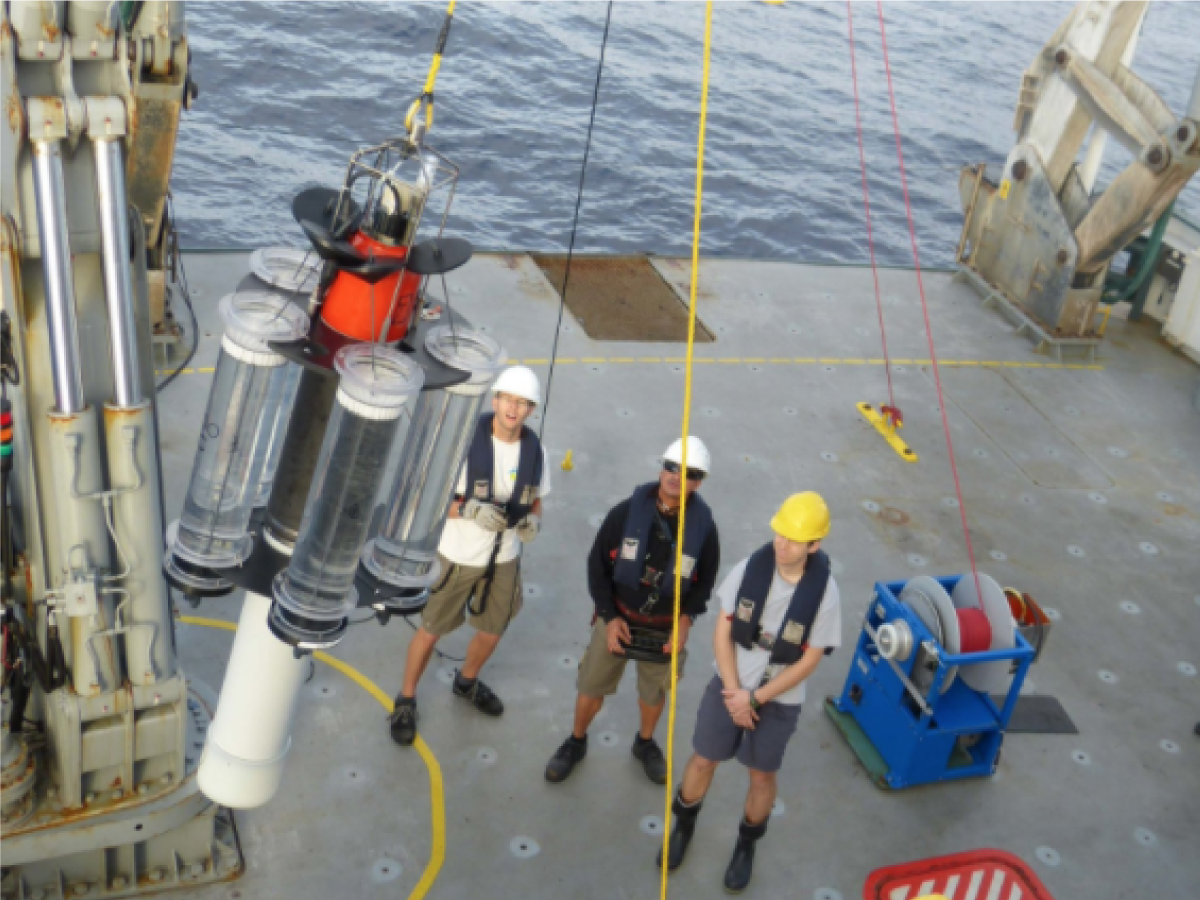
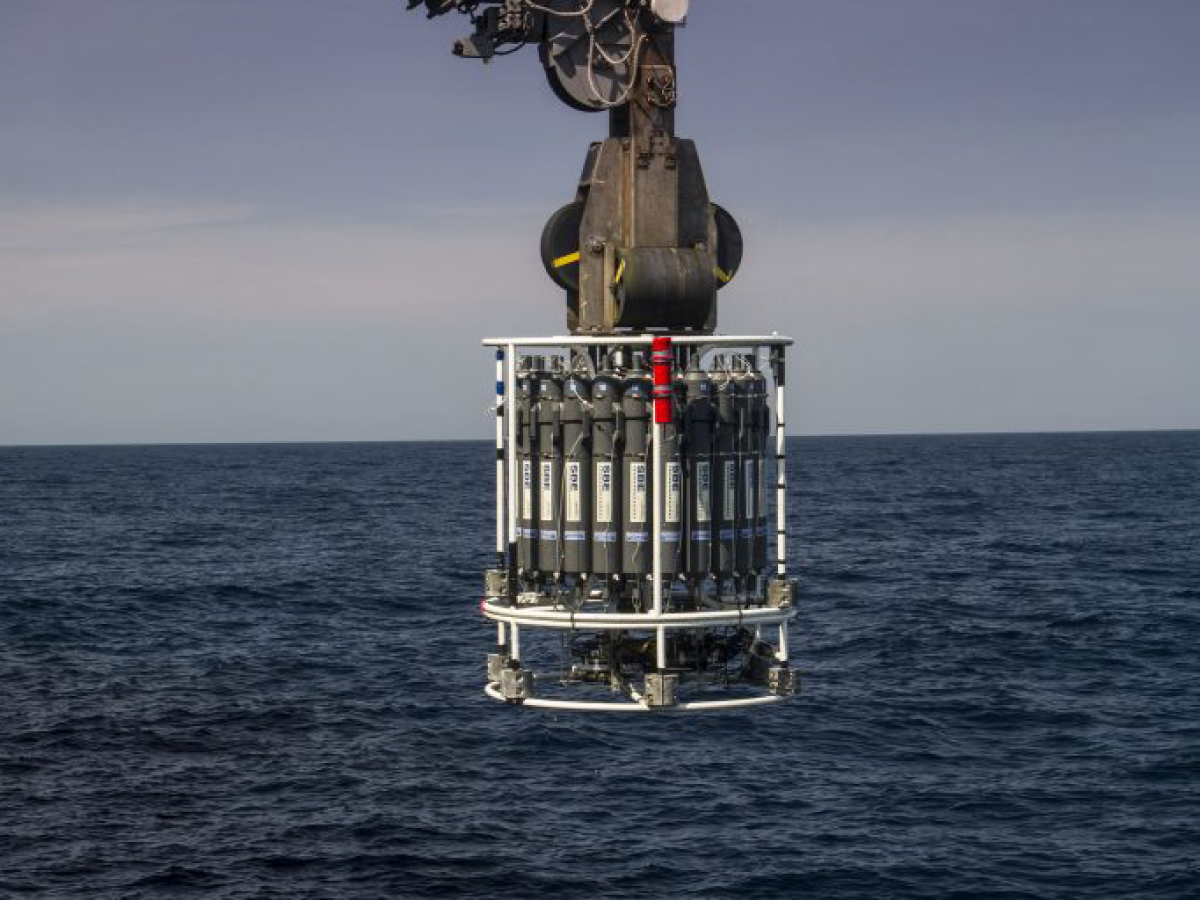
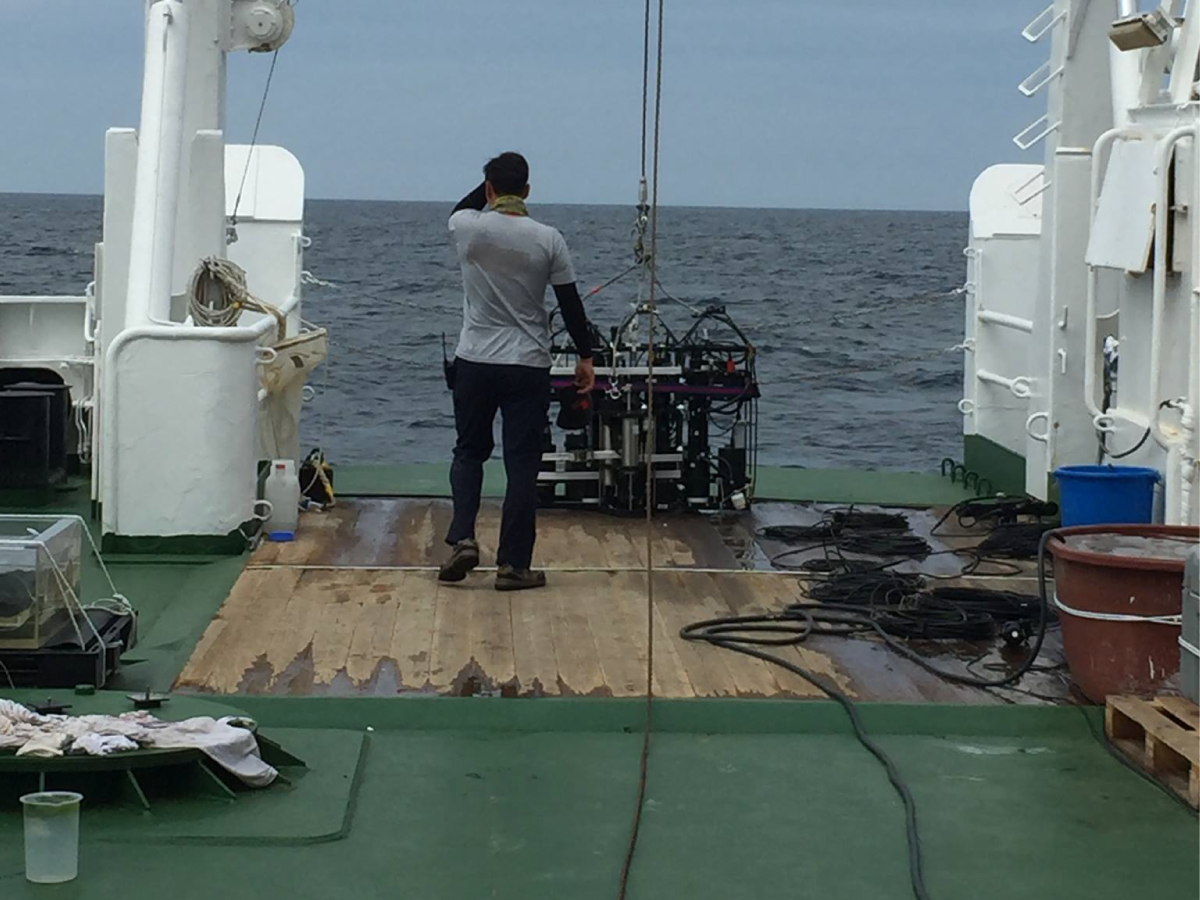
Scientists on the RRS James Cook deploy a sampling rosette. This type of platform allows for the collection of water samples and other information from ocean depths. The RRS Discovery and R/V Sarmiento de Gamboa can be seen in the distance deploying the same instrumentation. Credit: Deborah Steinberg
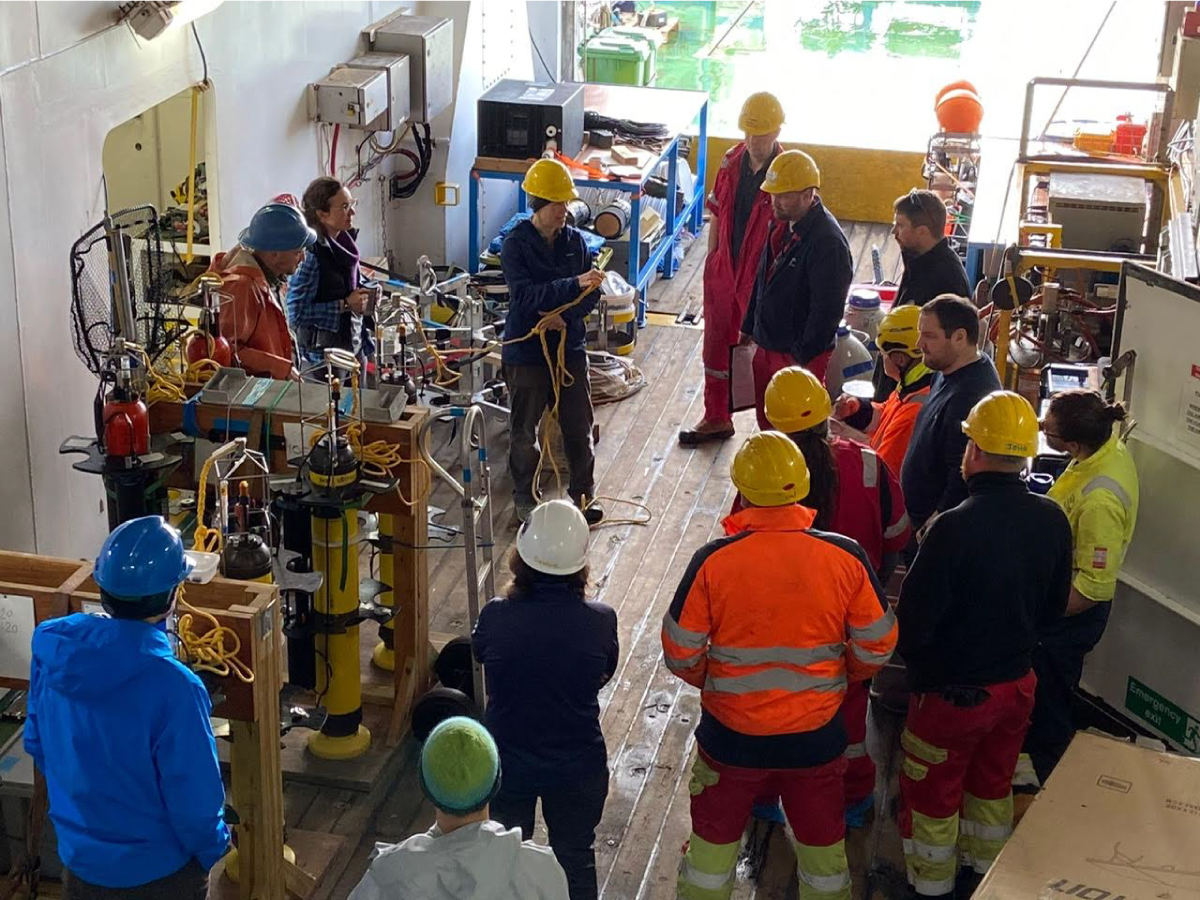
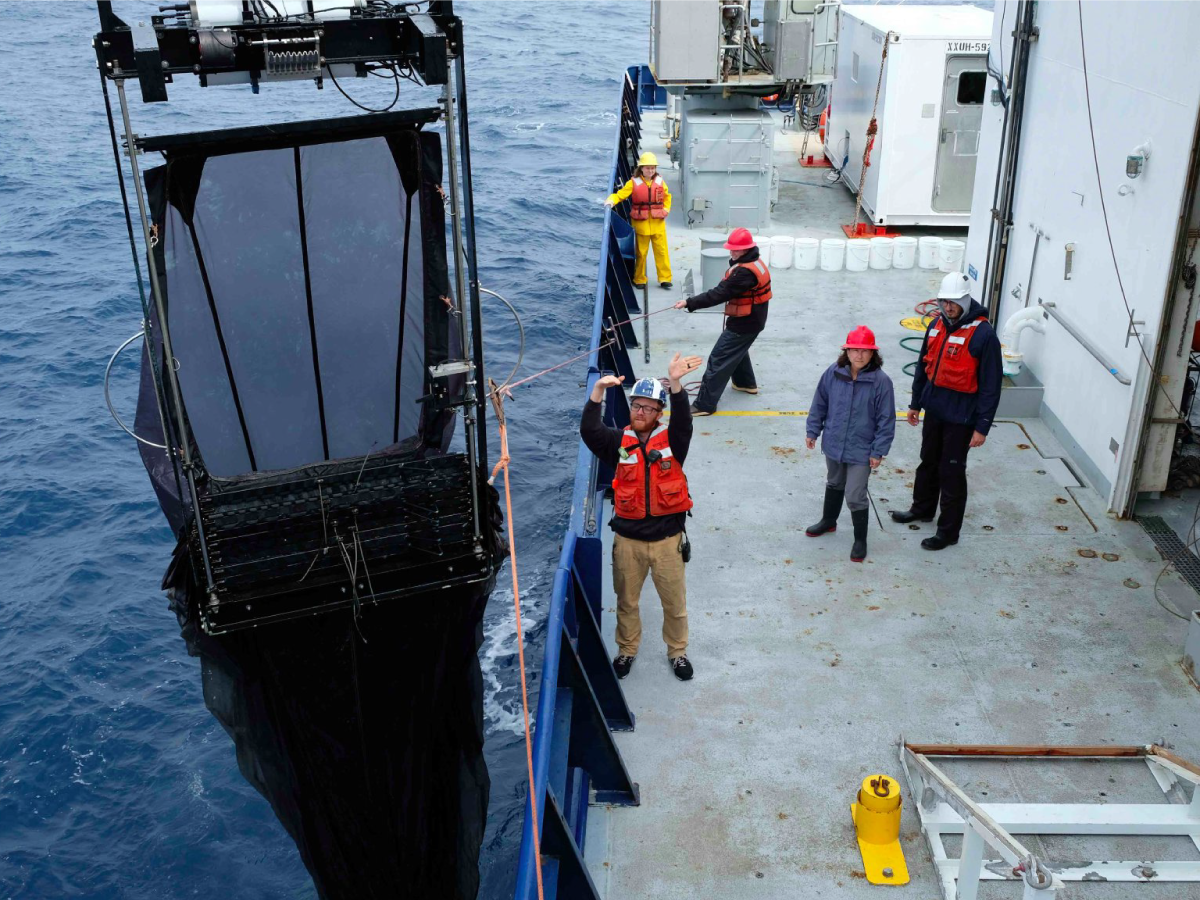
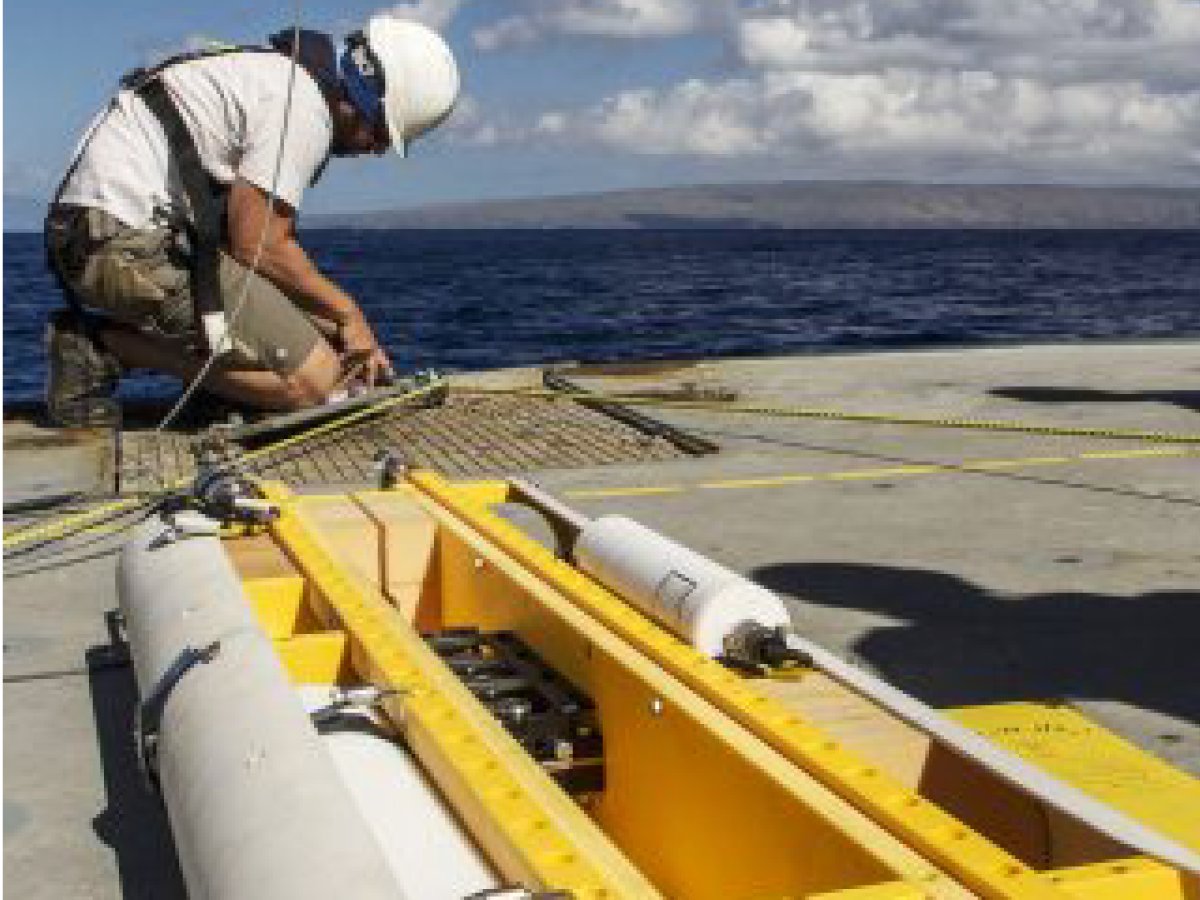
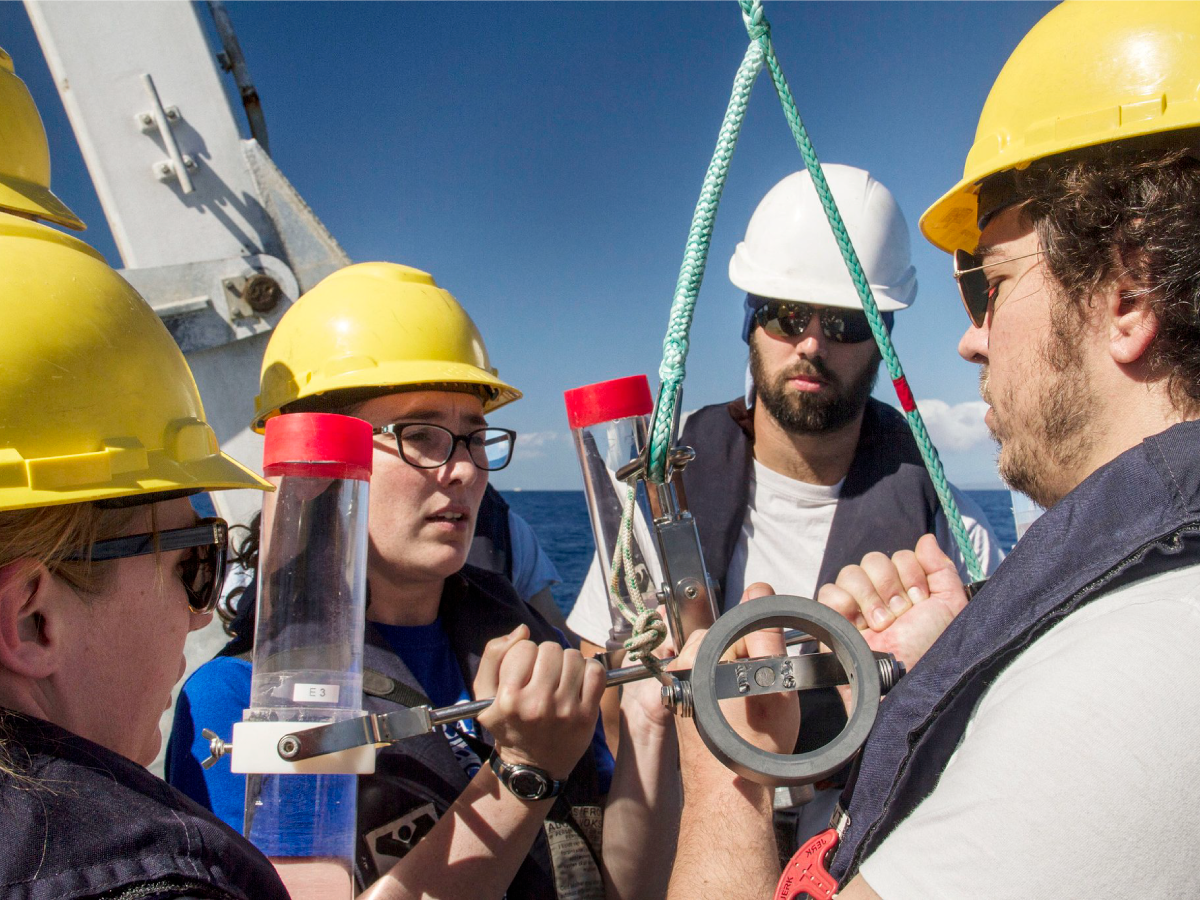
Scientists aboard the RRS James Cook prepare a test deployment of sediment traps. Credit: Lee Karp-Boss
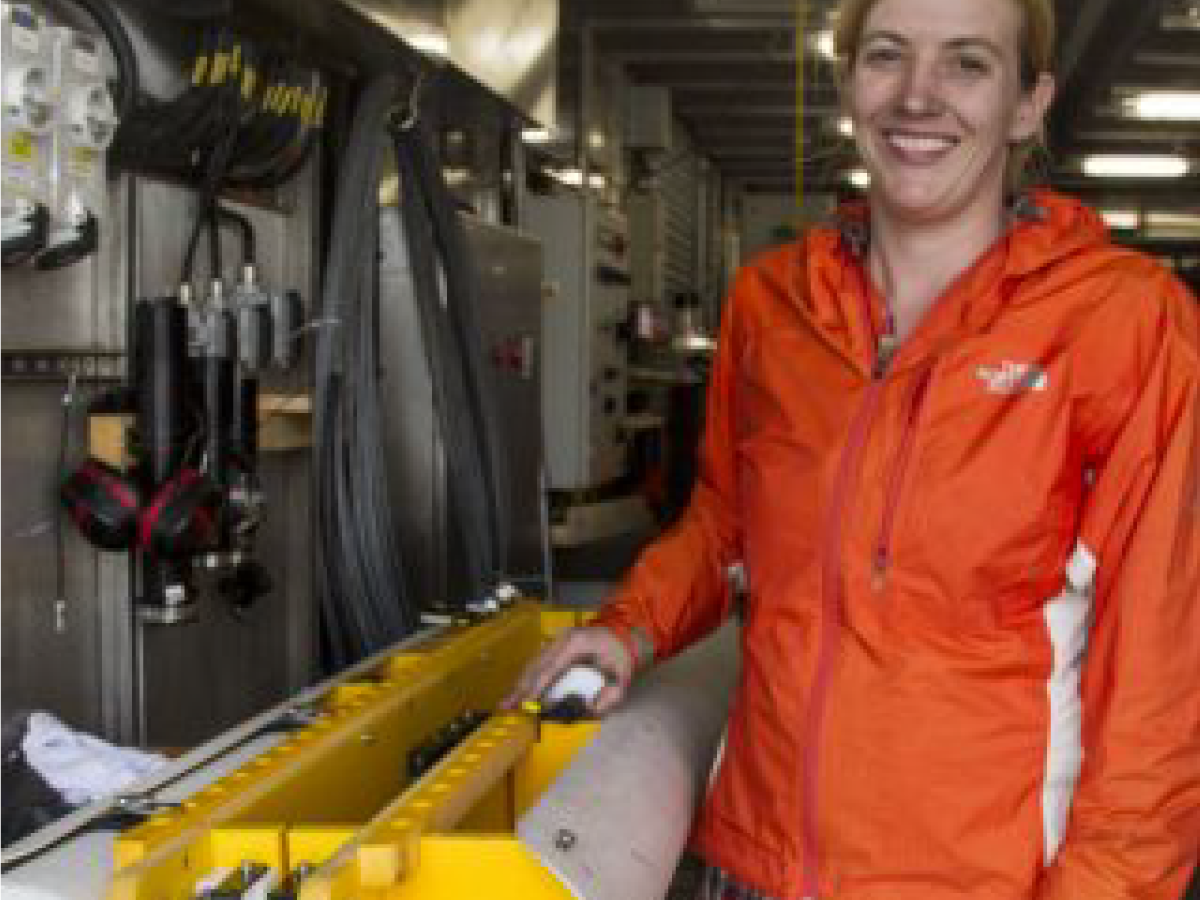
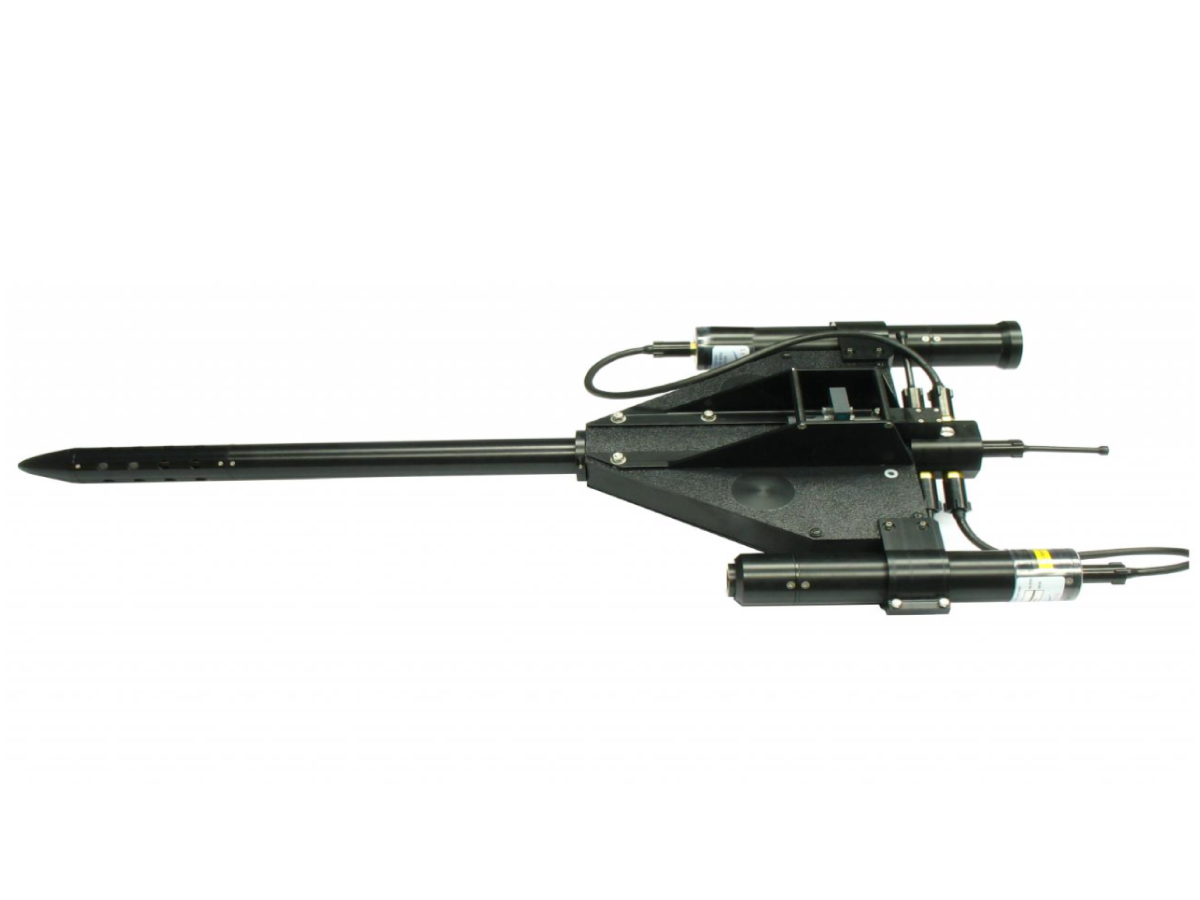
Deployment of a Wirewalker from the RRS James Cook. The wirewalker is an autonomous, rapid, wave-powered profiling system with bio-optical instruments that provides useful insights about phytoplankton physiology and oceanographic conditions. Credit: Deborah Steinberg
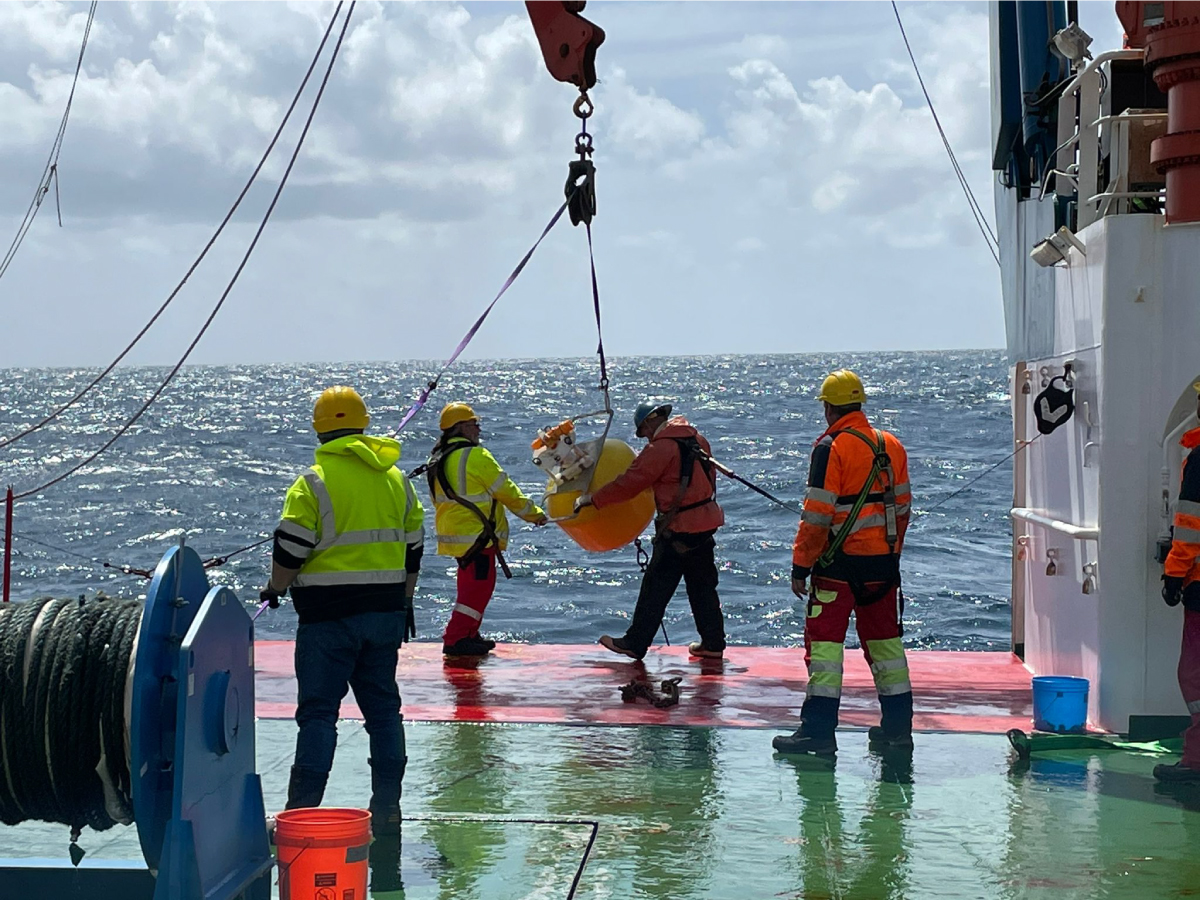
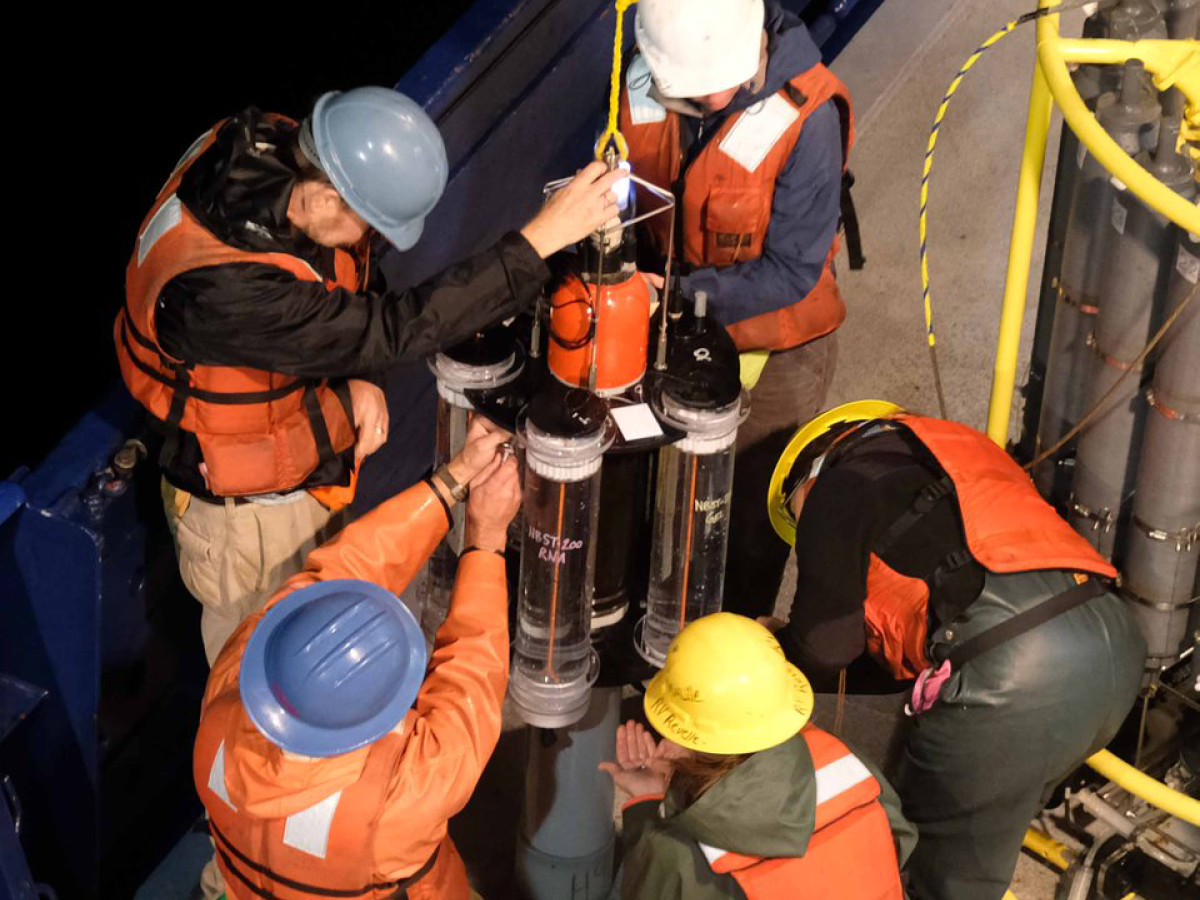
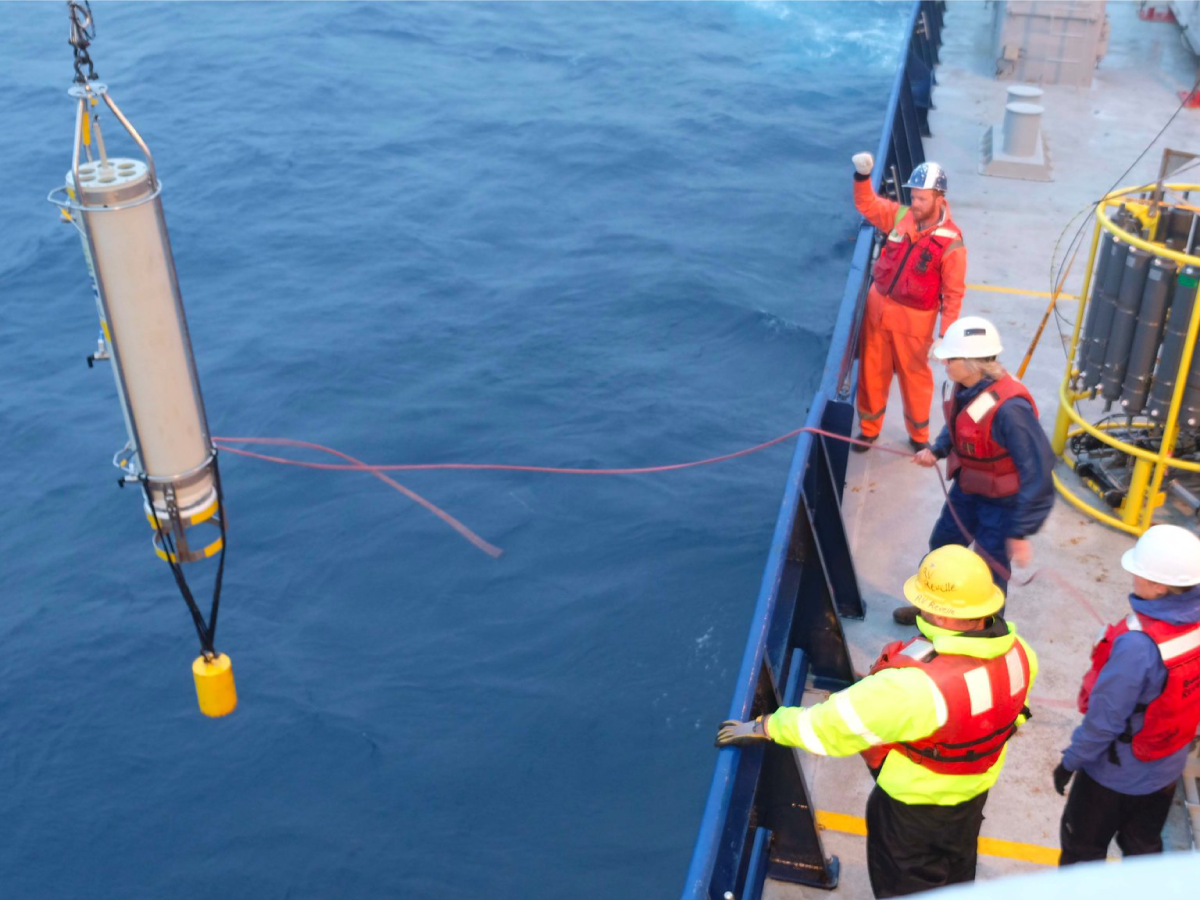
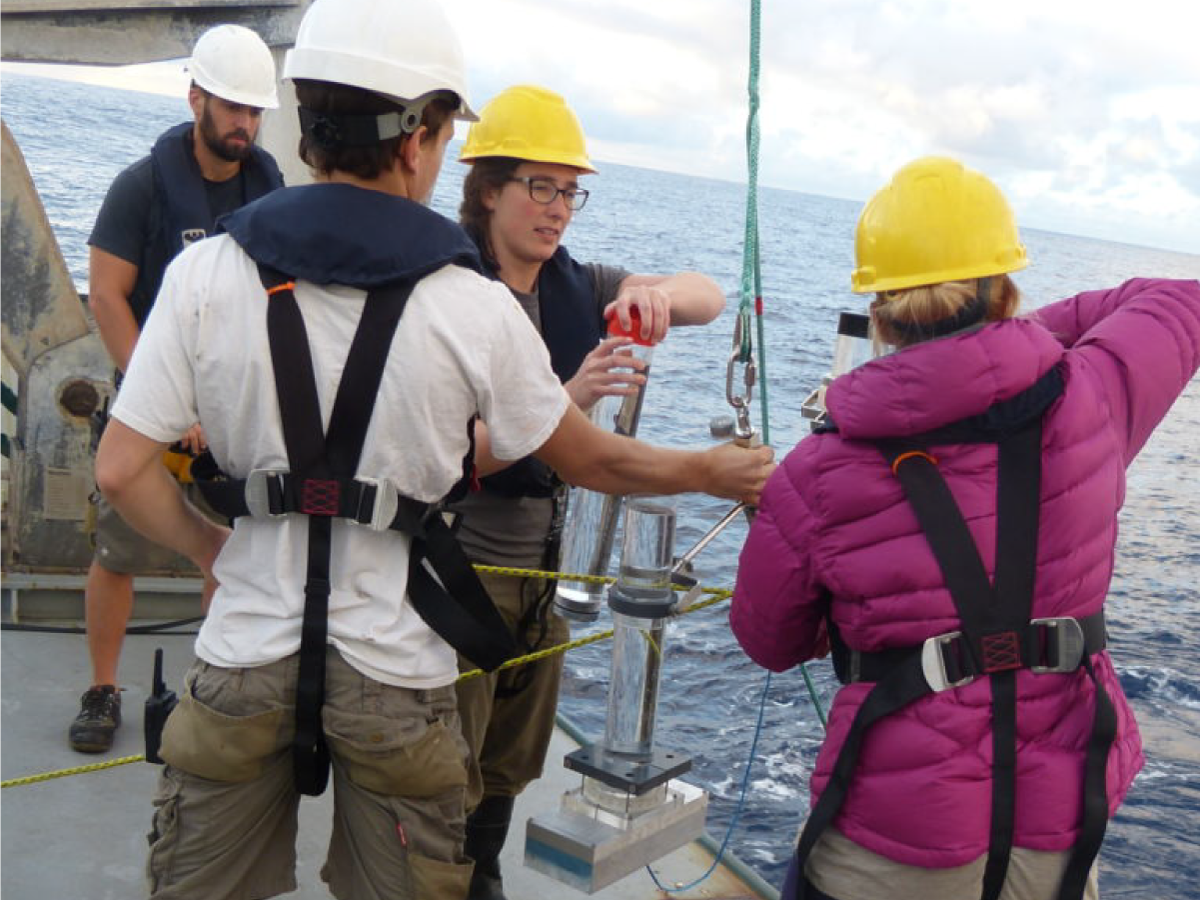
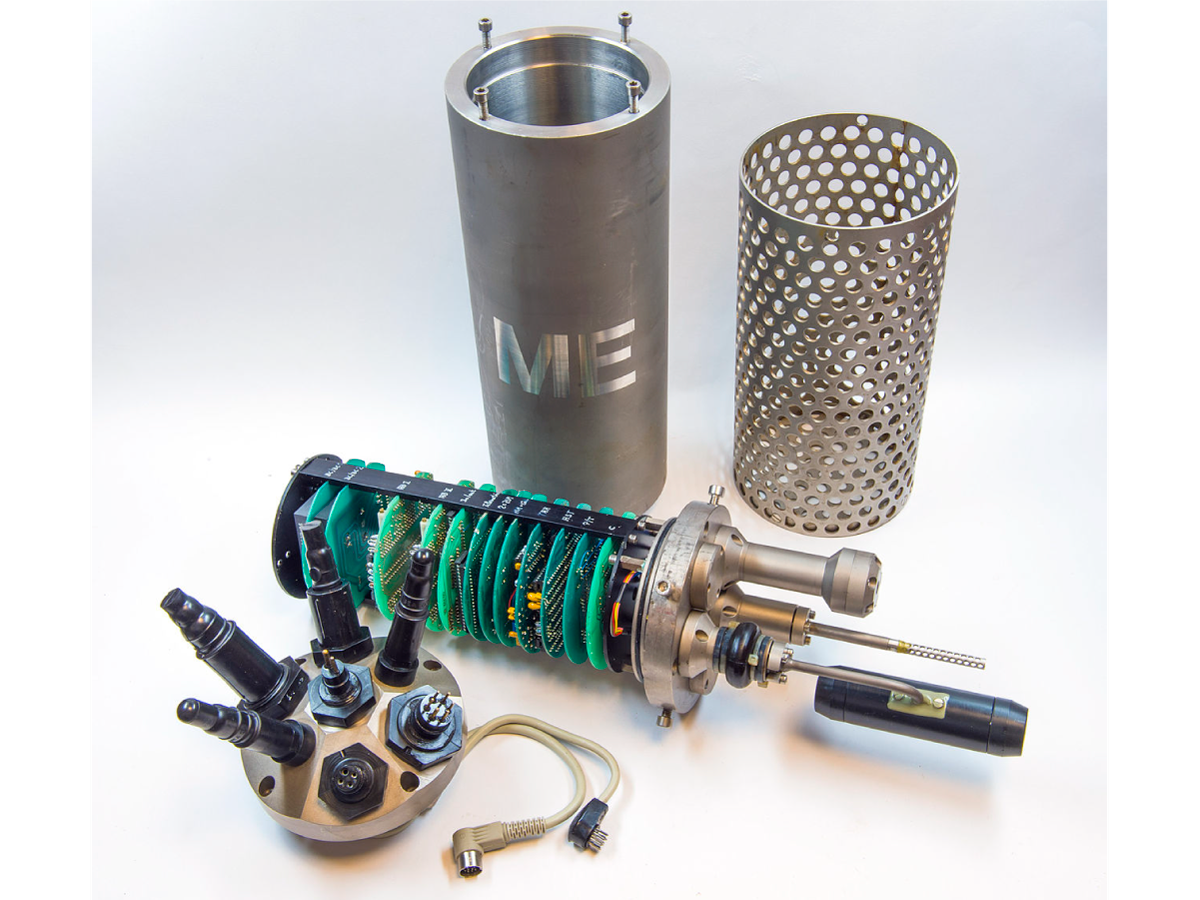
Meg Estapa (University of Maine) on the RRS James Cook successfully recovers the first Neutrally Buoyant Sediment Trap (NBST). NBST's open at discrete depths, trapping sinking particles and providing an estimate of how much carbon is exported to the deeper ocean. Credit: Lee Karp-Boss
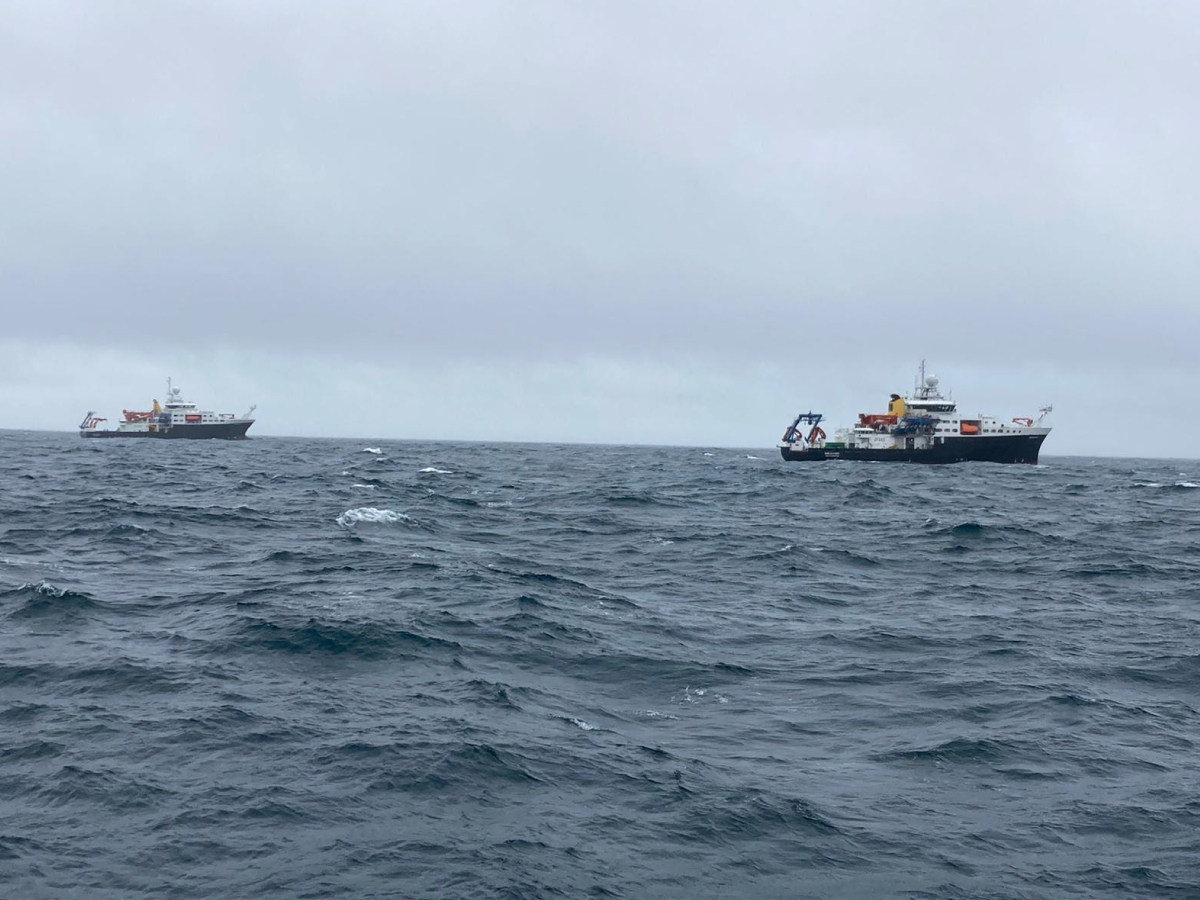
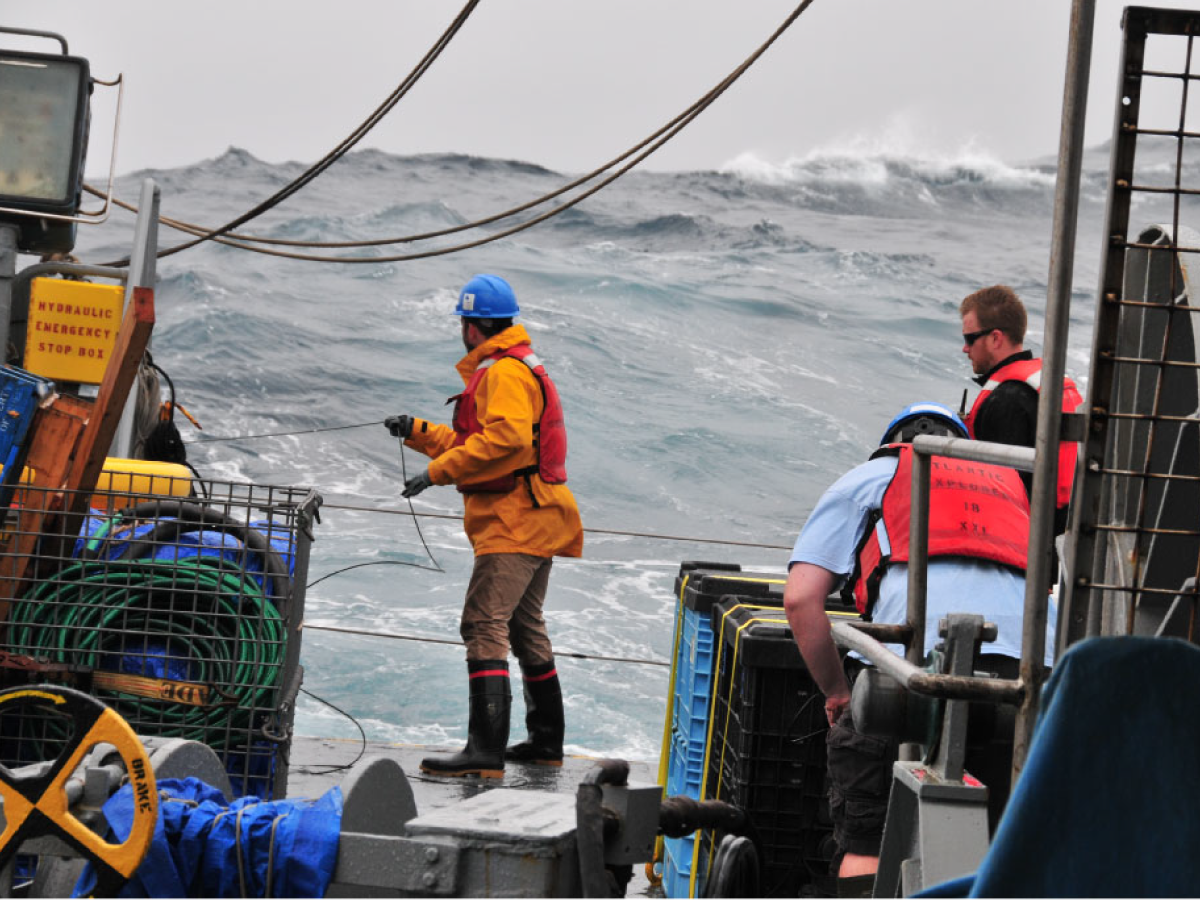
Scientists on the RRS Discovery and RRS James Cook simultaneously perform a one-of-a-kind maneuver to deploy and test similar equipment. Credit: Joel Llopiz
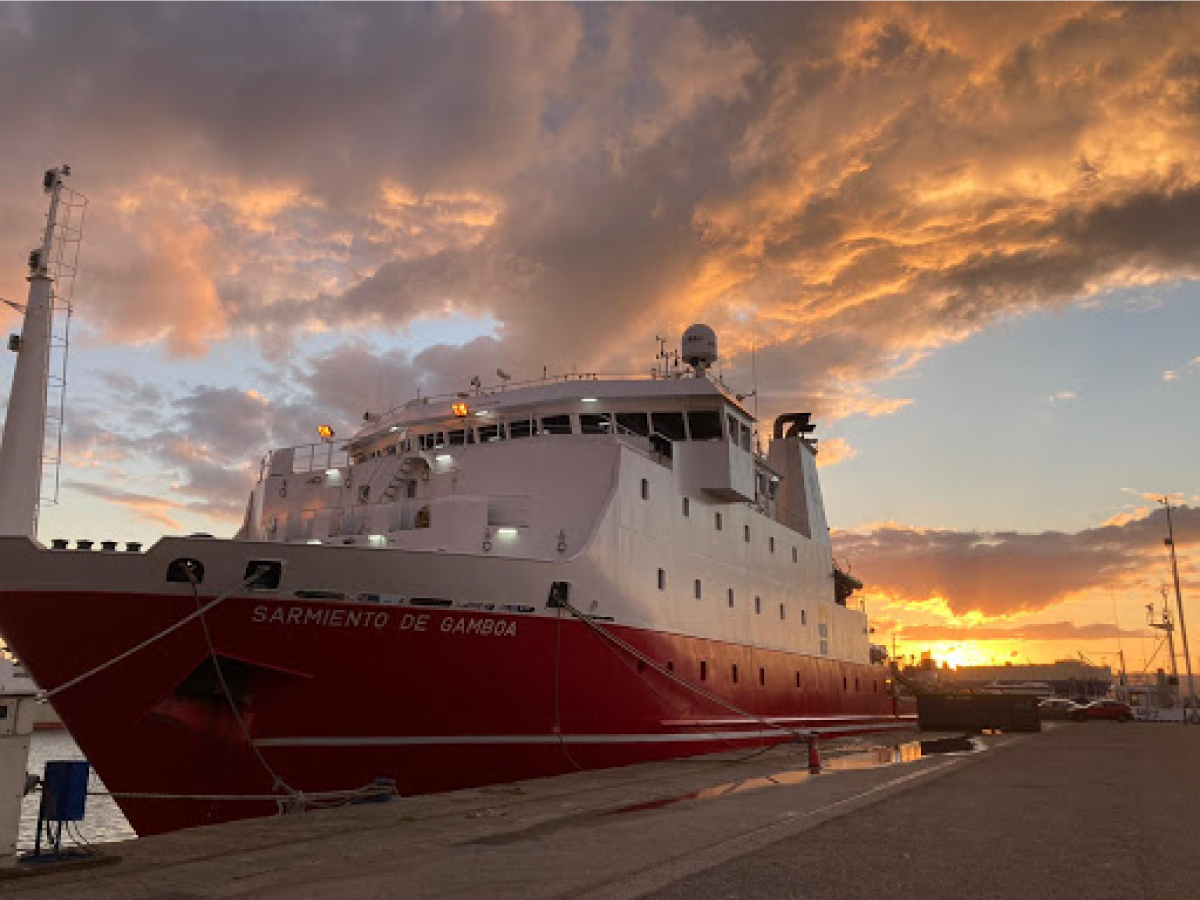
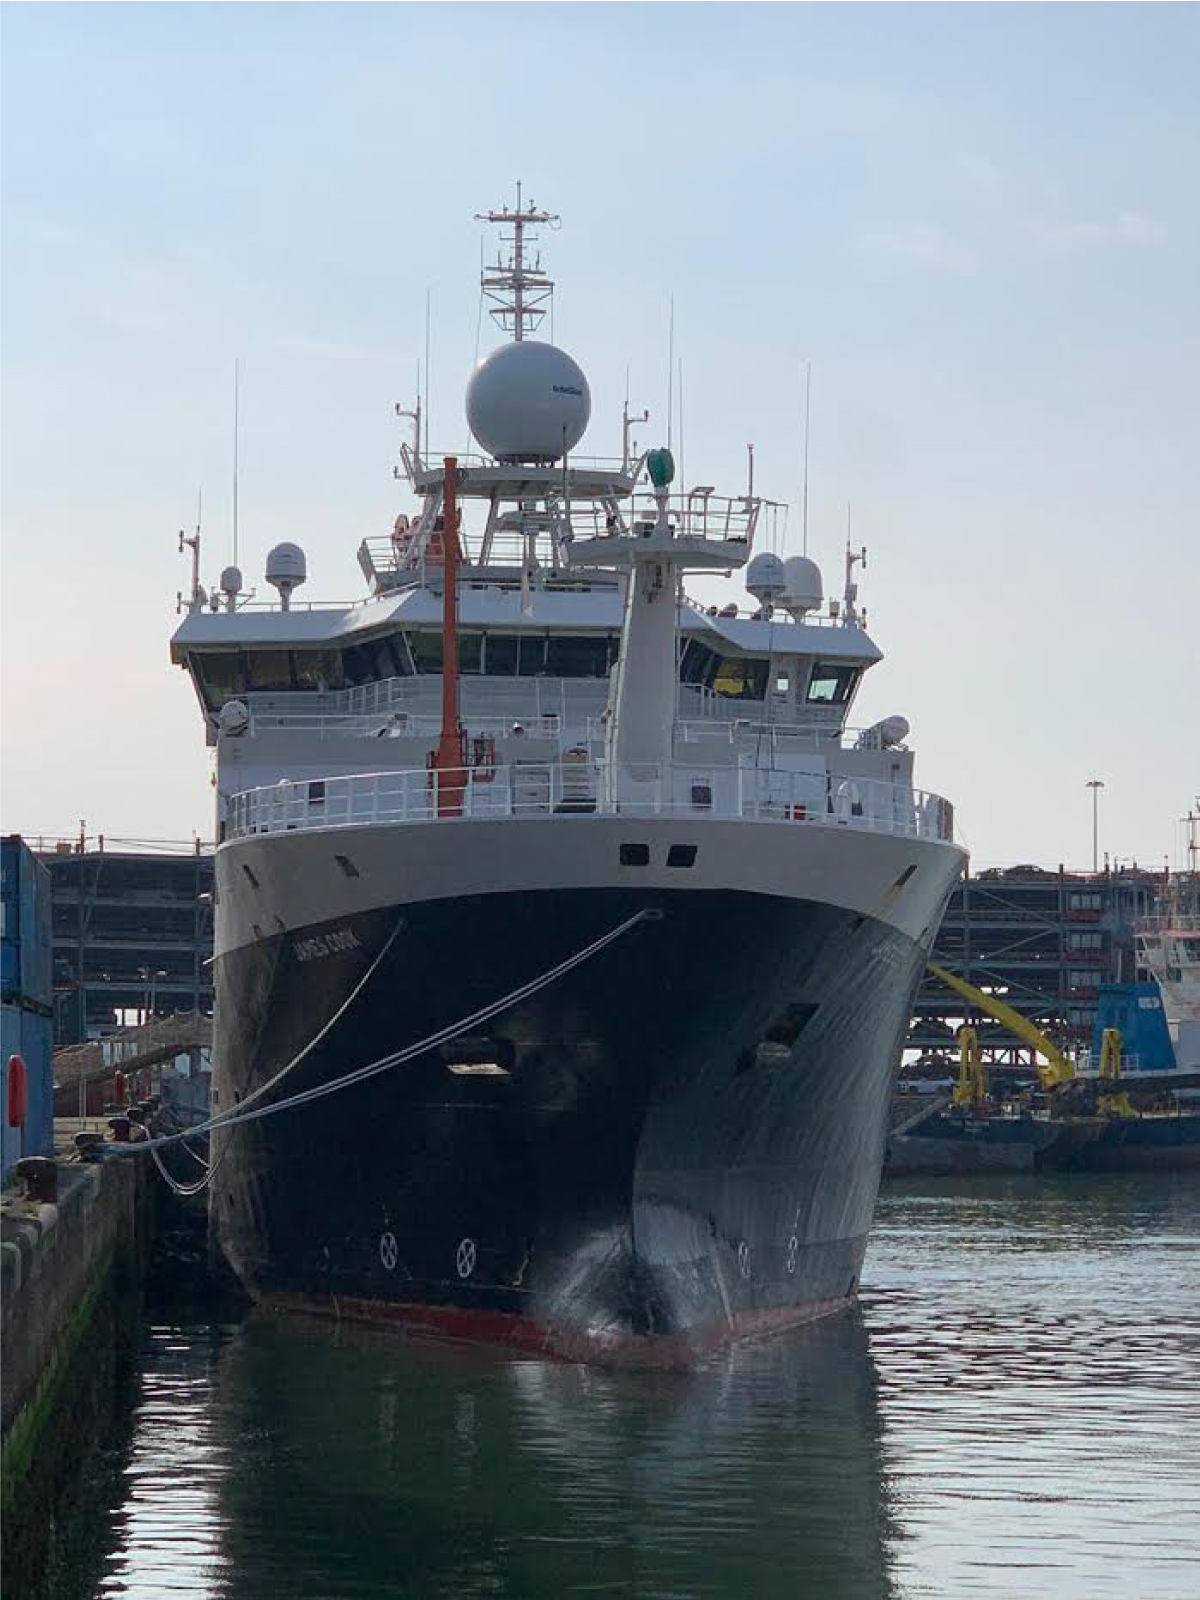
The Sarmiento de Gamboa docked in Vigo, Spain before the launch of WHOI's Dive and Discover Expedition 17. The R/V Sarmiento de Gamboa will join the RSS James Cook and the RSS Discovery as part of NASA's EXPORTS mission operating in the same location. Credit: Michelle Cusolito
WHOI scientists and crew board the R/V Sarmiento de Gamboa on April 29 after 14 days in quarantine. Credit: Ken Buesseler
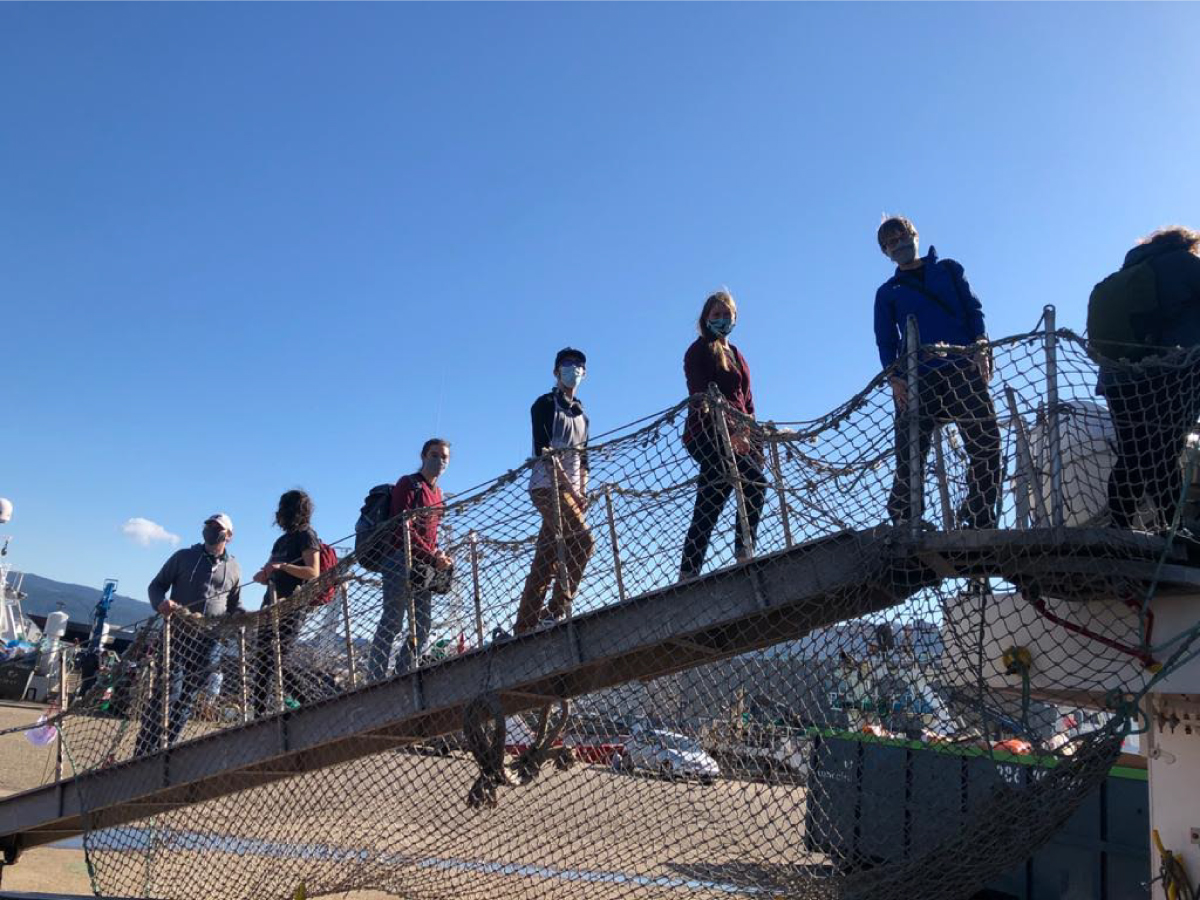
The RRS James Cook docks in Southampton, UK before sailing for the EXPORTS North Atlantic field campaign. Credit: Hannah Gossner
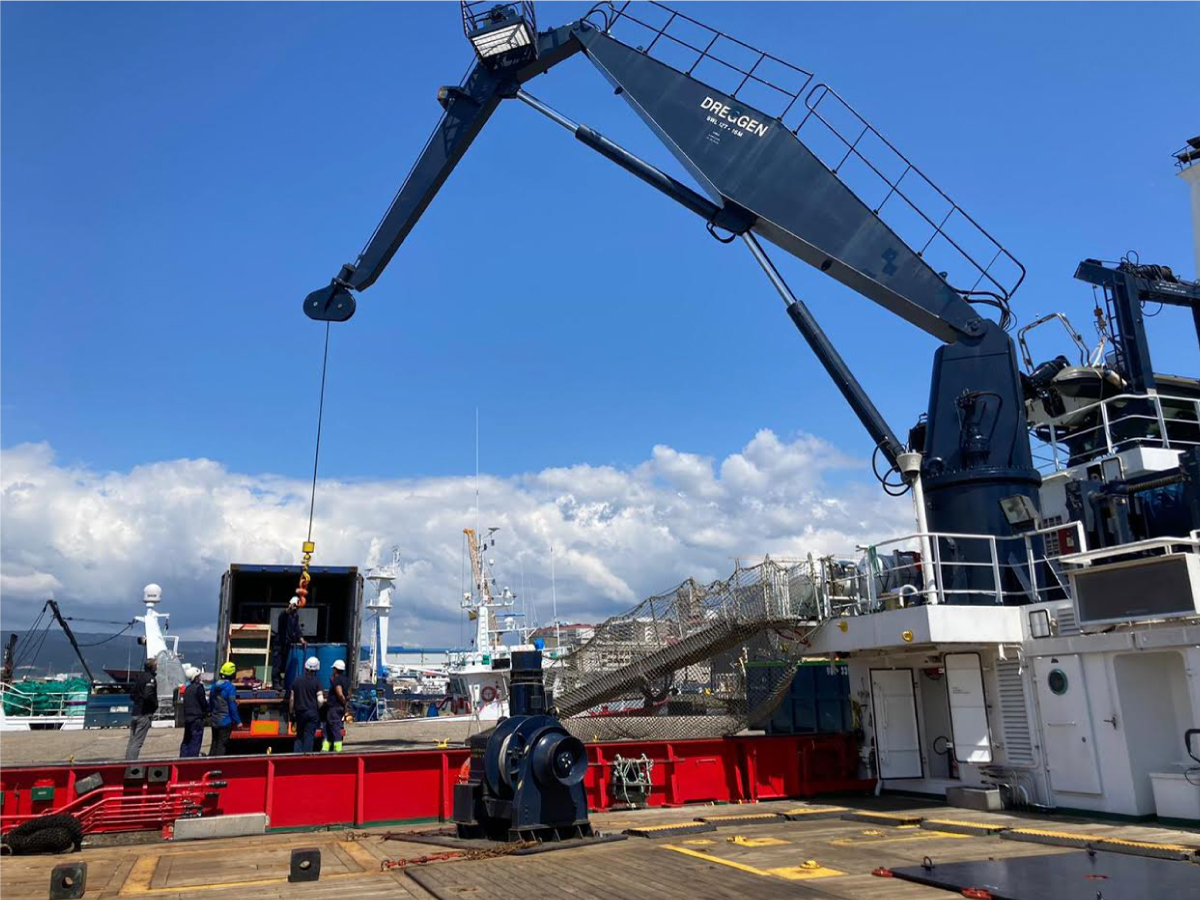
Instruments are loaded onto the R/V Sarmiento de Gamboa in preparation for WHOI's Dive and Discover Expedition 17. Credit: Michelle Cusolito
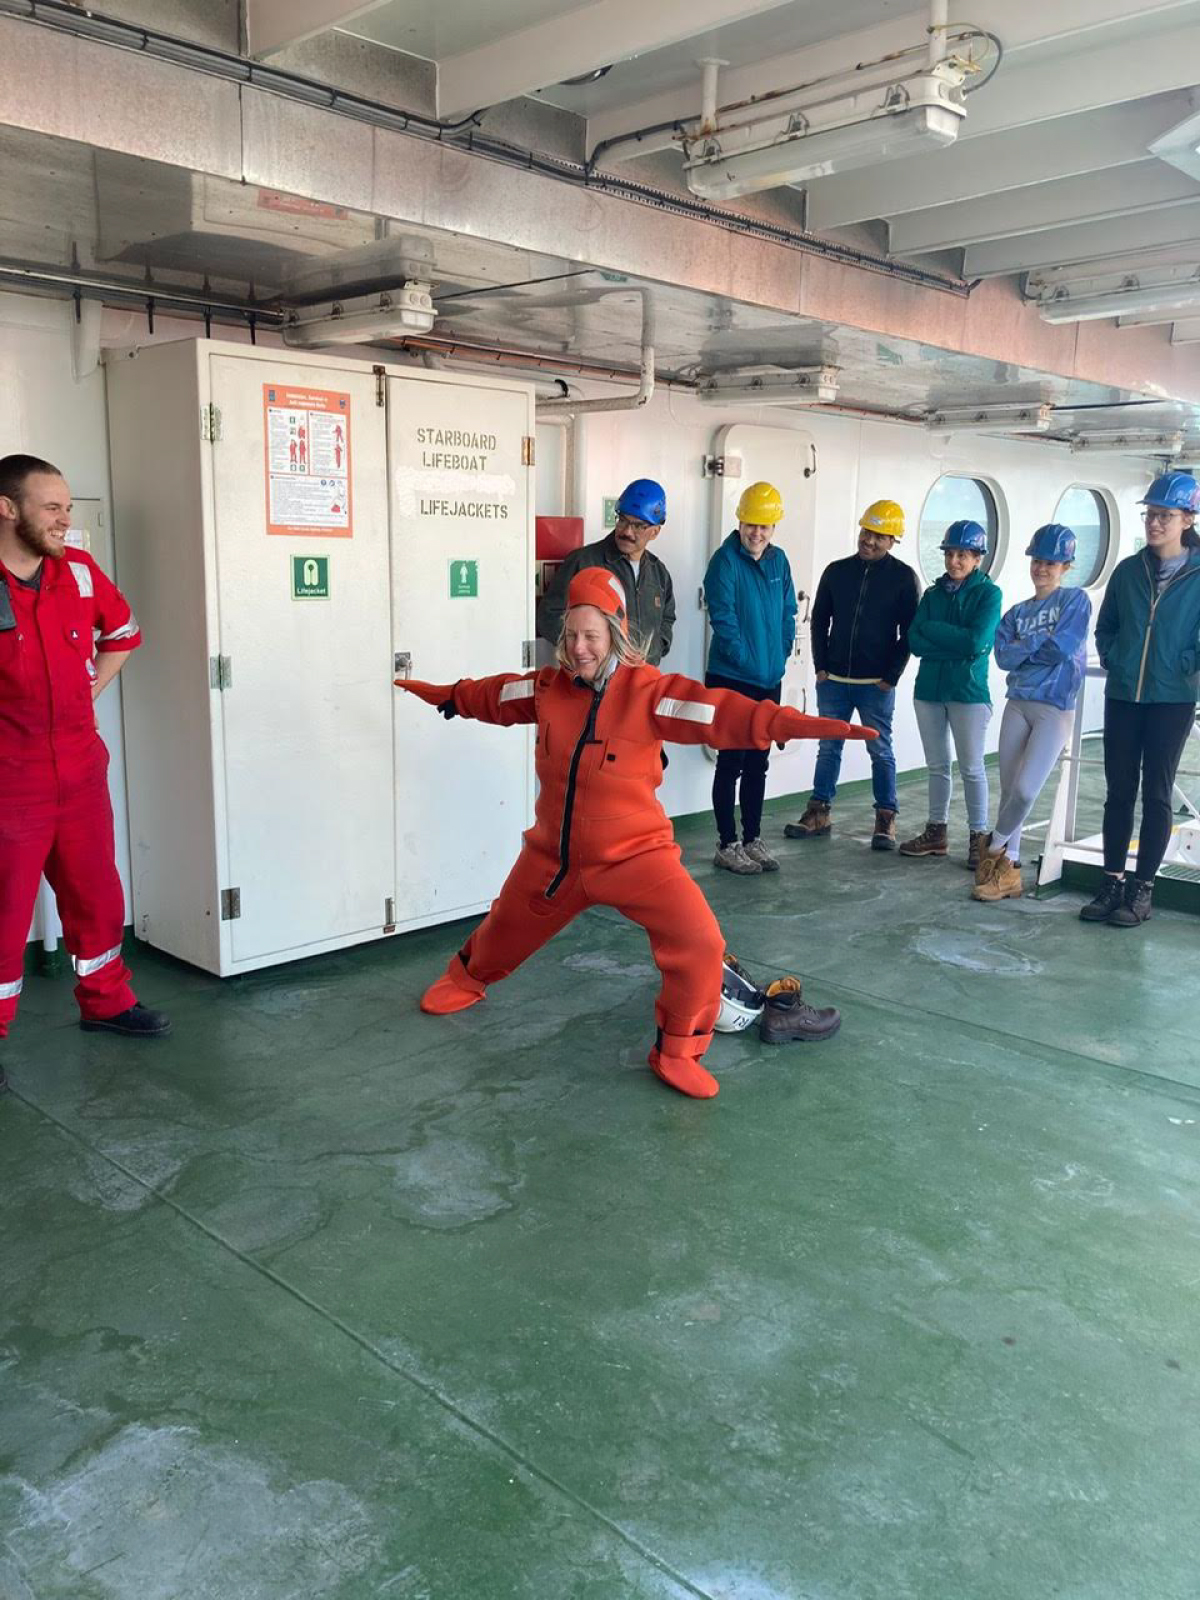
Boat/immersion suit drill onboard the RRS Discovery. Credit: Chelsea Nicole
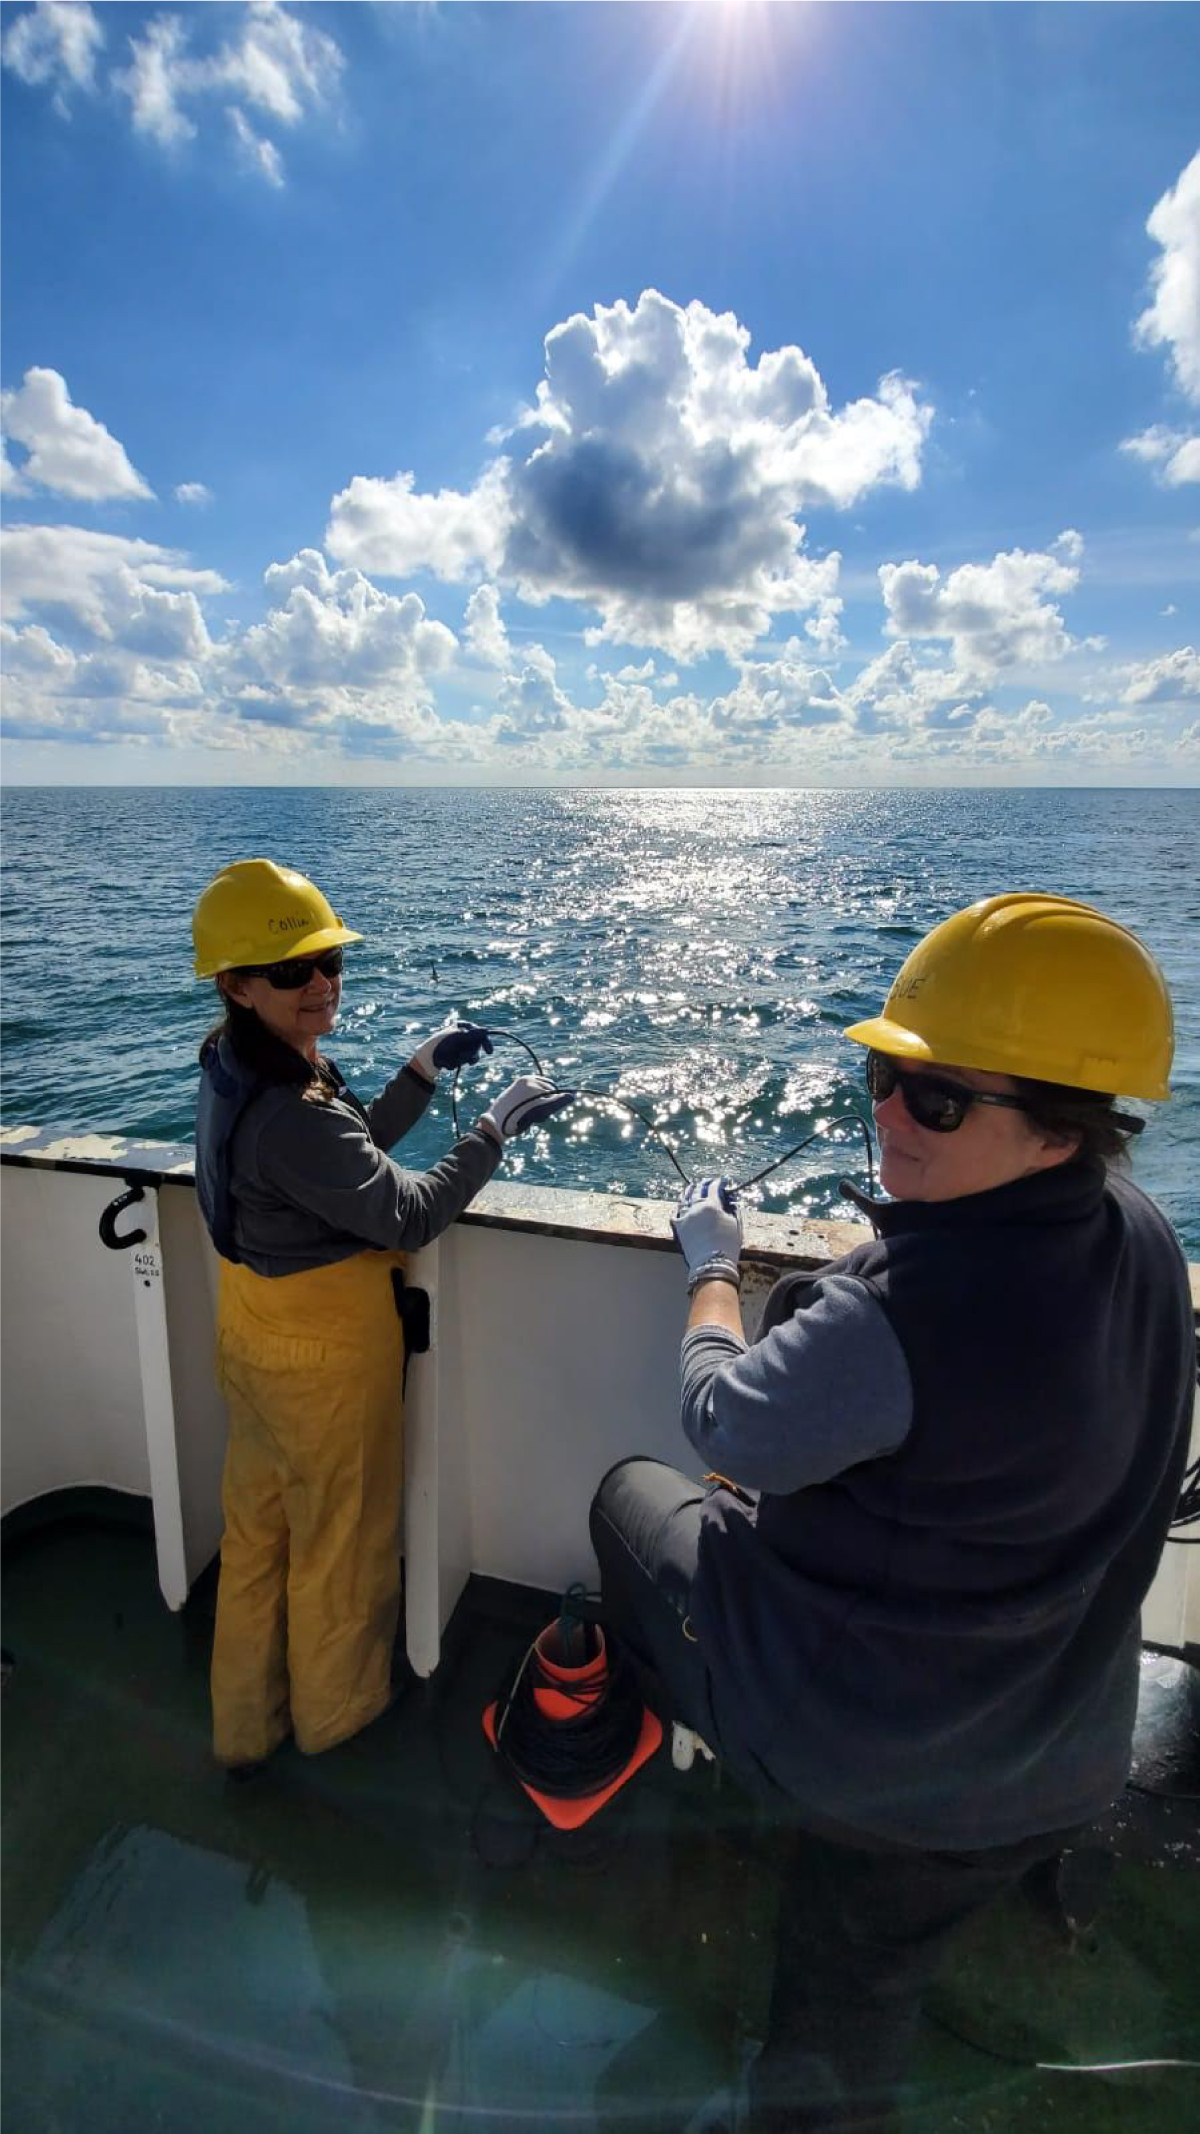
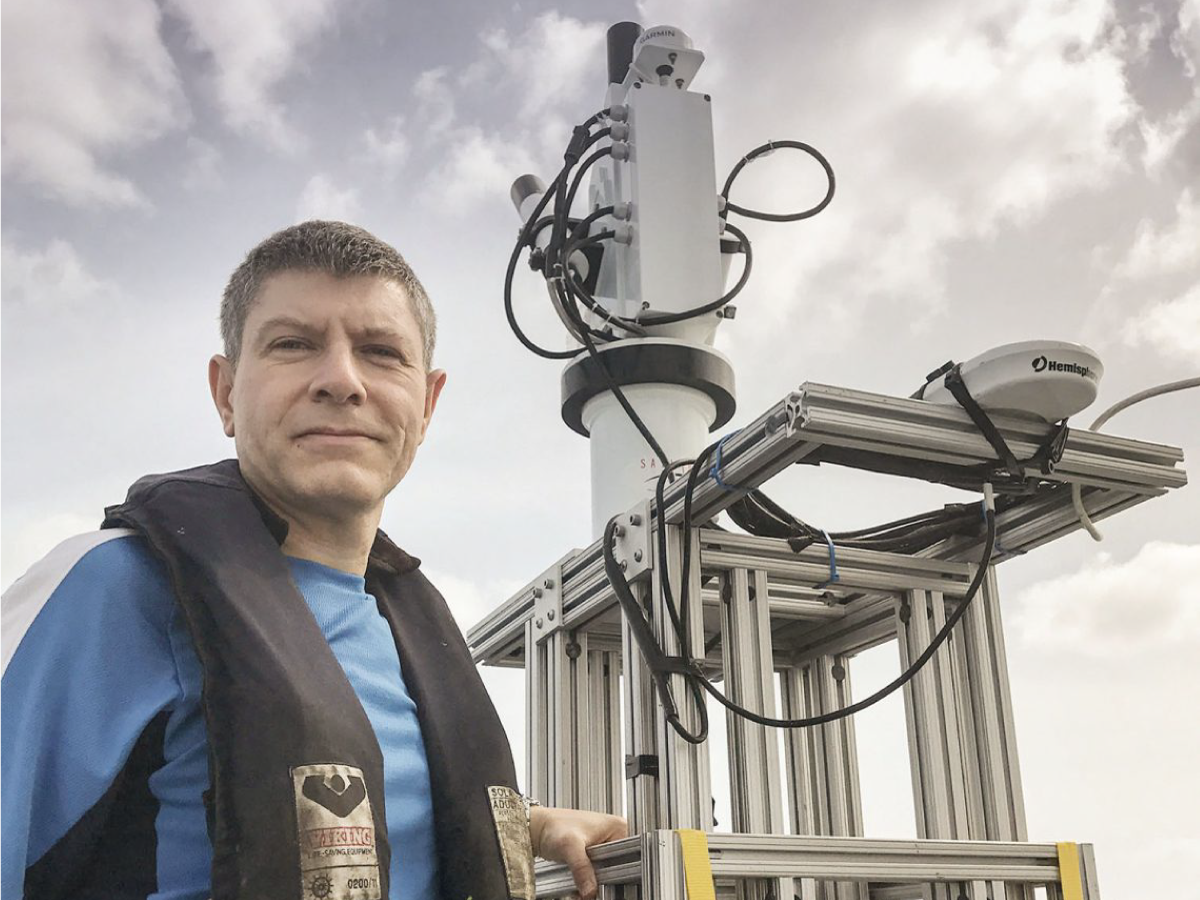
Collin Roesler and Susan Drapeau deploy the HTSRB - also known as the Hester-B or Hyperspectral Tethered Spectral Radiometer Buoy - which carries a sensor used to measure the optical properties of water. Credit: Taylor Crockford
EXPORTS Field Campaign, Spring 2021 VIEW ALL »

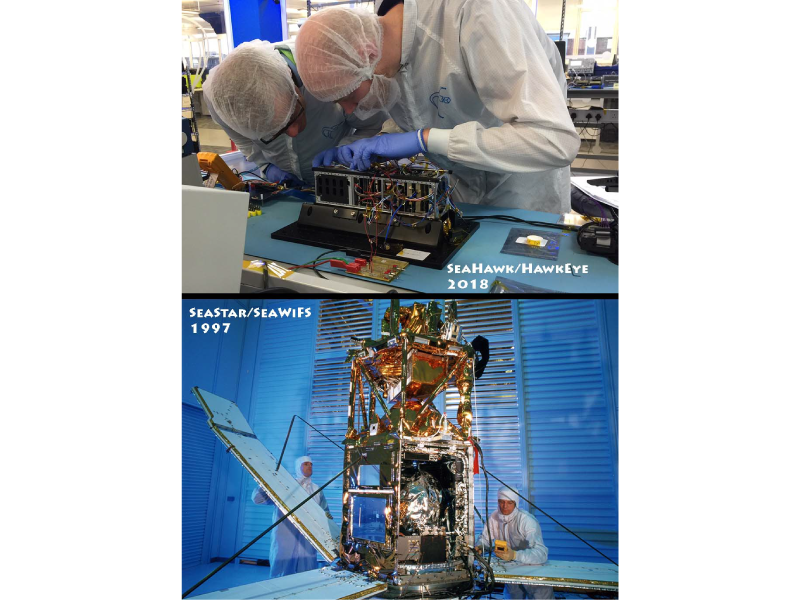
Ocean color sensing - then and now. The SeaStar/SeaWIFS instrument, launched in 1997 (bottom) is compared to the SeaHawk/HawkEye mission (top). Credit: NASA GSFC
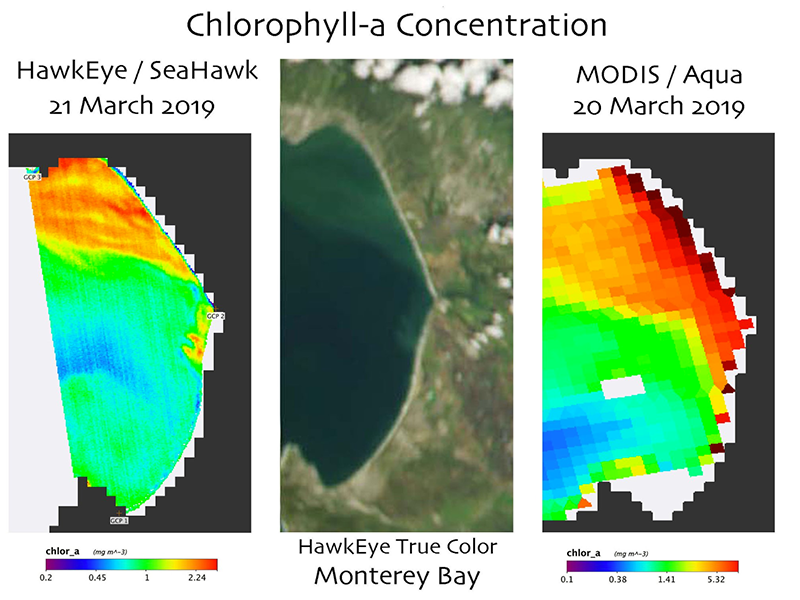
Left: Scaled chlorophyll-a retrievals for Monterey Bay, as measured by the HawkEye sensor on Seahawk. Center: A true color image of Monetery Bay, captured by HawkEye. Right: Chlorophyll-a data measured by MODIS/Aqua one day earlier. Credit: NASA GSFC
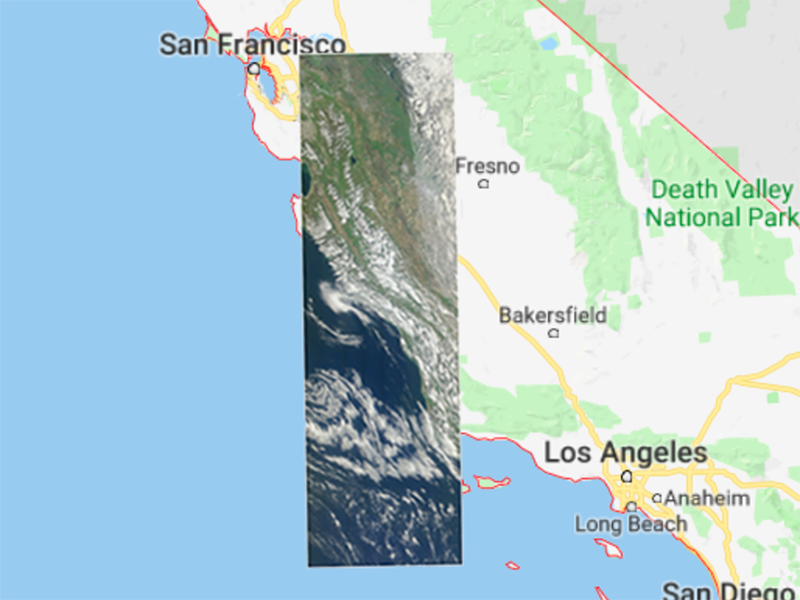
The first SeaHawk image, captured by the HawkEye sensor on March 21, 2019 from an altitude of 588 km, superimposed on a map of California. Credit: NASA GSFC
Scientists and engineers celebrate after the launch of SeaHawk on December 3, 2018. Credit: Gene Feldman (NASA GSFC)
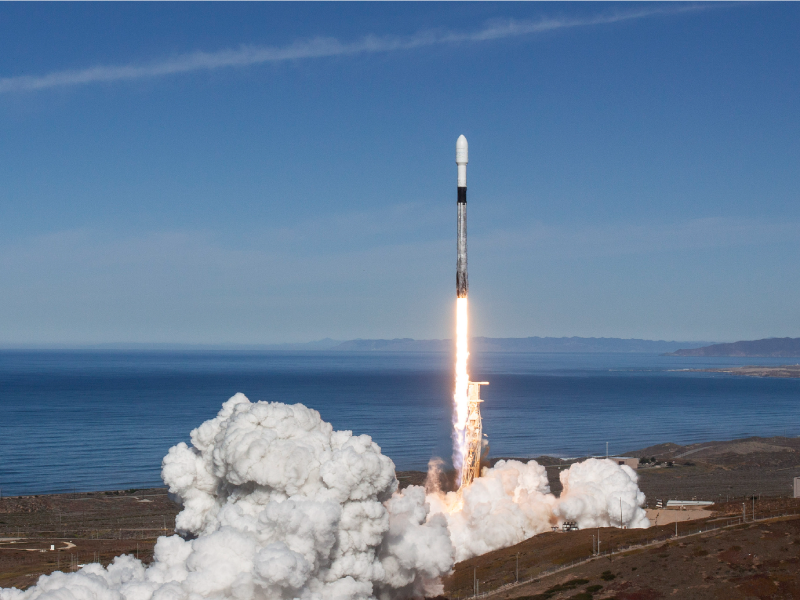
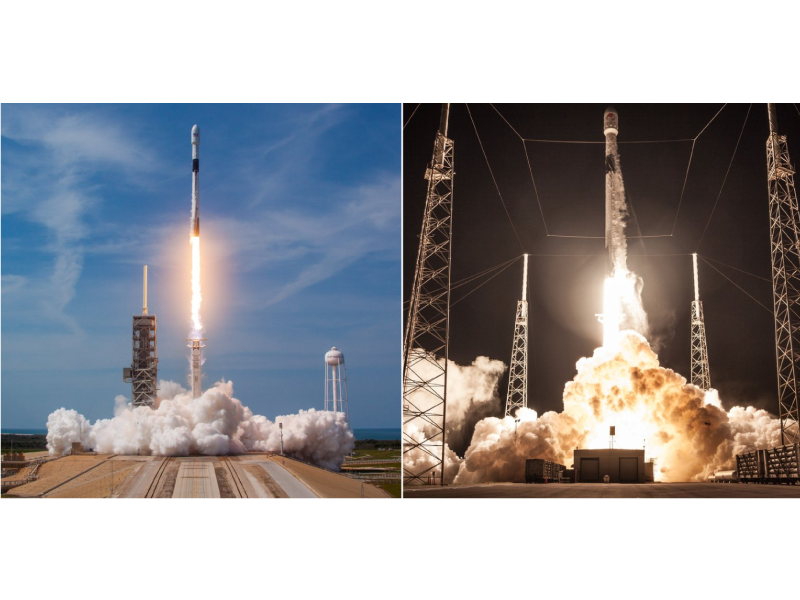
Spaceflight's SpaceX Falcon 9 rocket lifts off from Vandenberg AFB for a sun-synchronous low earth orbit, carrying SeaHawk and 63 other satellites. Credit: SpaceX
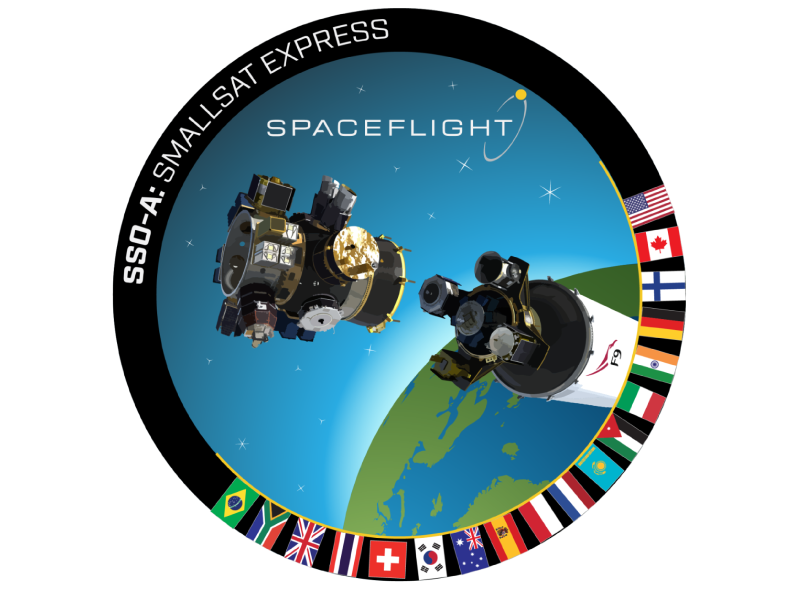
The SSO-A Smallsat Express will be the largest single rideshare mission launched from a U.S.-based vehicle. The SSO-A Smallsat Express will carry 49 CubeSats, including SeaHawk, and 15 MicroSats from 34 countries. Credit: Spaceflight Industries
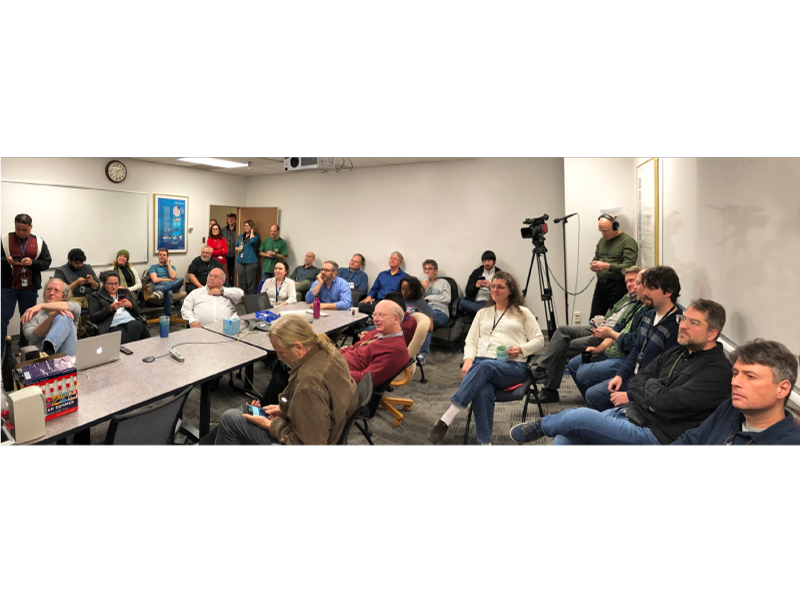
GSFC researchers and engineers await the launch of Sun Industry's Sun-Synchronous Orbit A (SSO-A) SmallSat Express. Credit: NASA GSFC
A SpaceX Falcon 9 First Stage booster successfully completes a static test fire on November 16, 2018. Credit: SpaceX
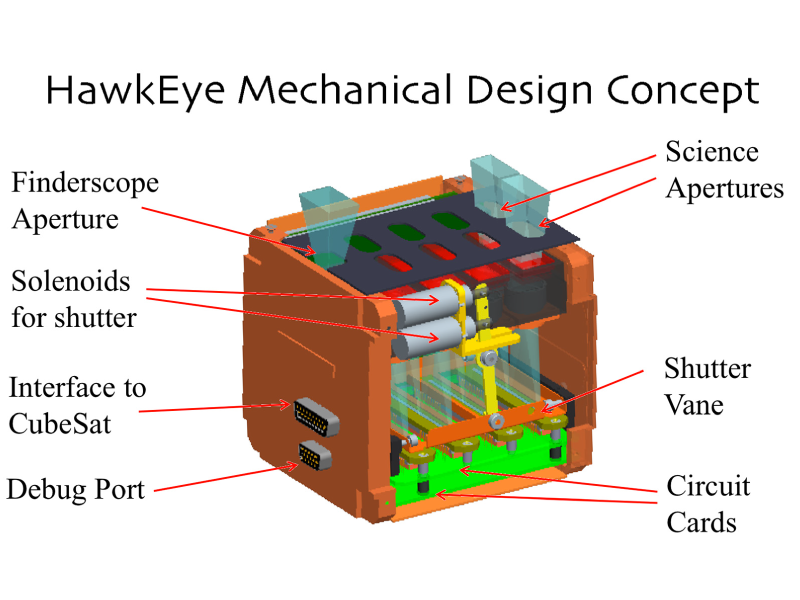
The mechanical design concept for the HawkEye Ocean Color Sensor. Credit: NASA GSFC
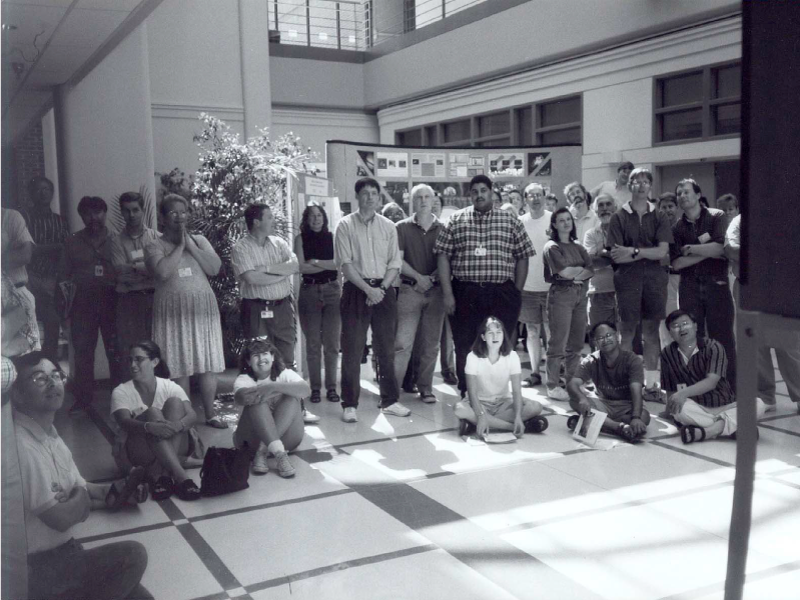
In 1997, scientists and engineers from Goddard Space Flight Center (GSFC) watch the launch of the Sea-Viewing Wide Field-of-View Sensor (SeaWiFs), NASA's revolutionary ocean color mission and the precursor to Hawkeye. Credit: NASA GSFC
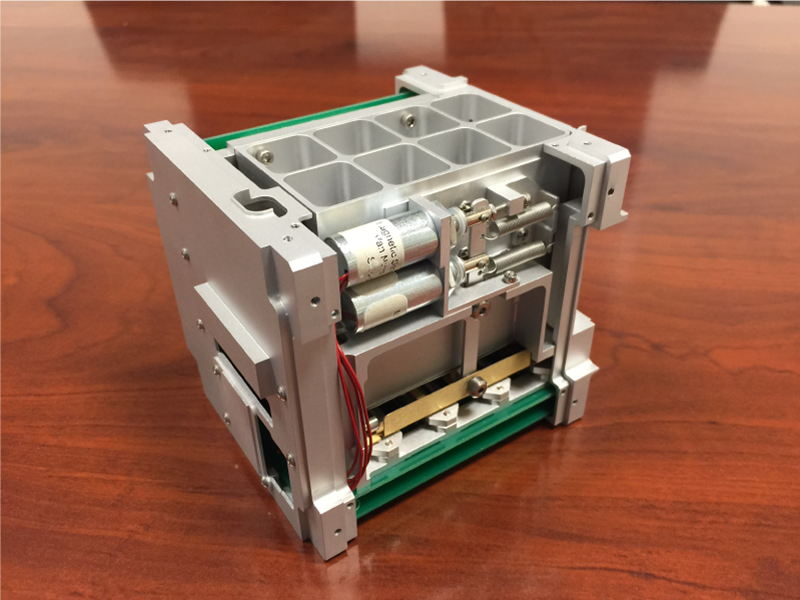
SeaHawk mechanical components assembled for fit check testing. Credit: Clyde Space
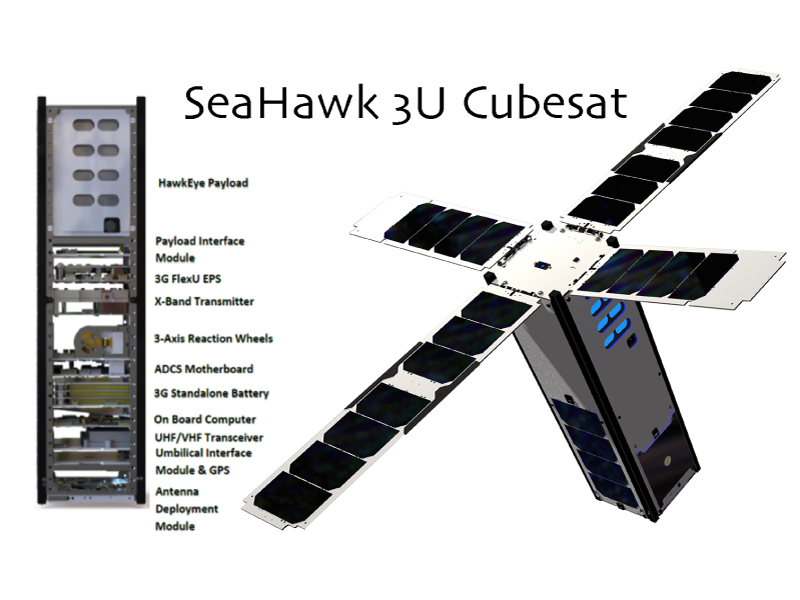
Overview of SOCON's first spacecraft - the SeaHawk CubeSat satellite. Manufactured by Clyde Space Ltd, the Seahawk CubeSat will carry HawkEye, a high spatial resolution, multispectral, ocean color sensor built by Cloudland Instruments, LLC. Credit: NASA GSFC
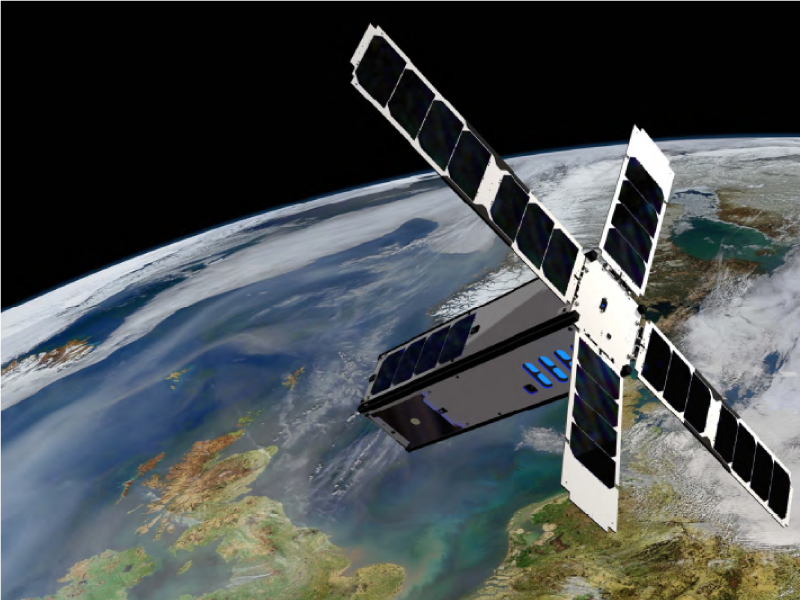
SOCON is a partnership for development and proof-of-concept for a low-cost, miniaturized, multispectral ocean color imager capable of flight on an autonomous nanosatellite (CubeSat). Credit: NASA GSFC
SOCON Field Campaign VIEW ALL »

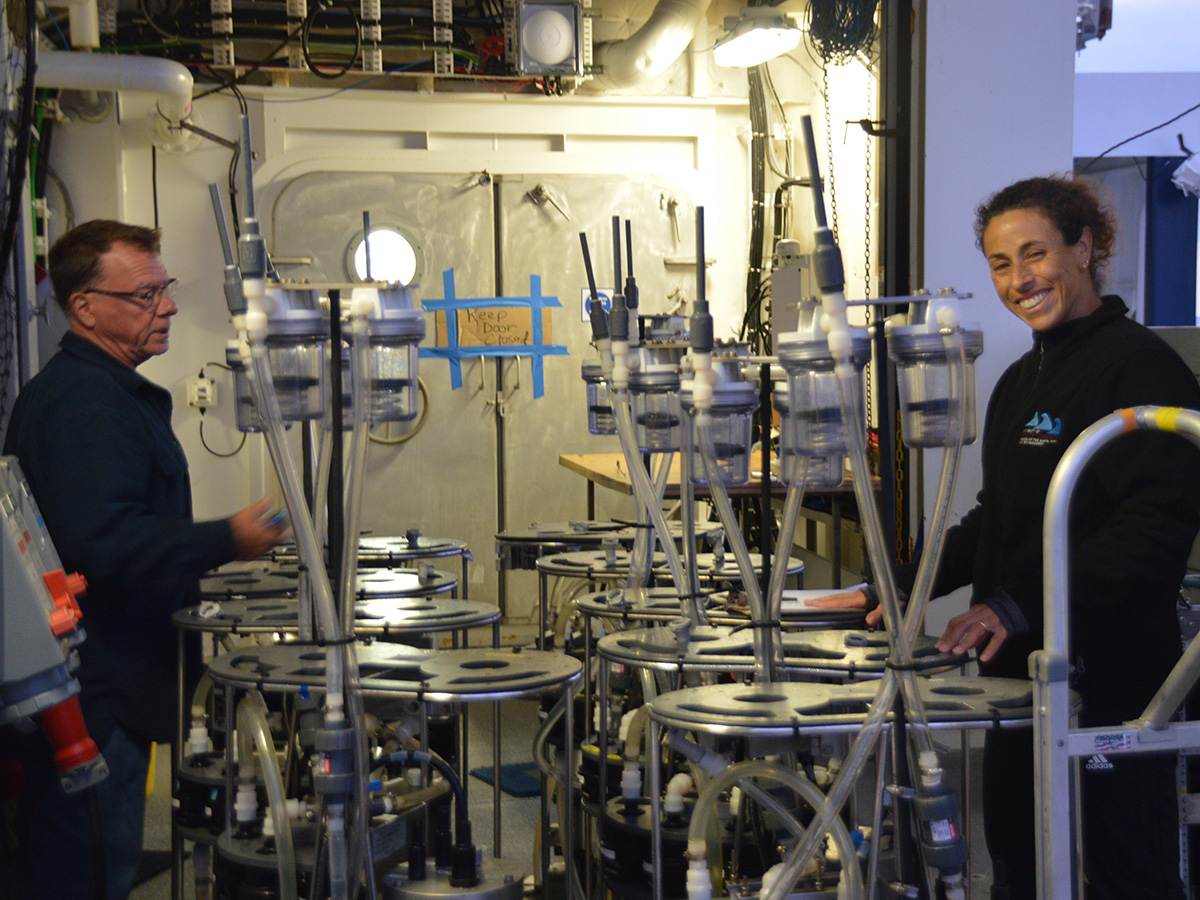
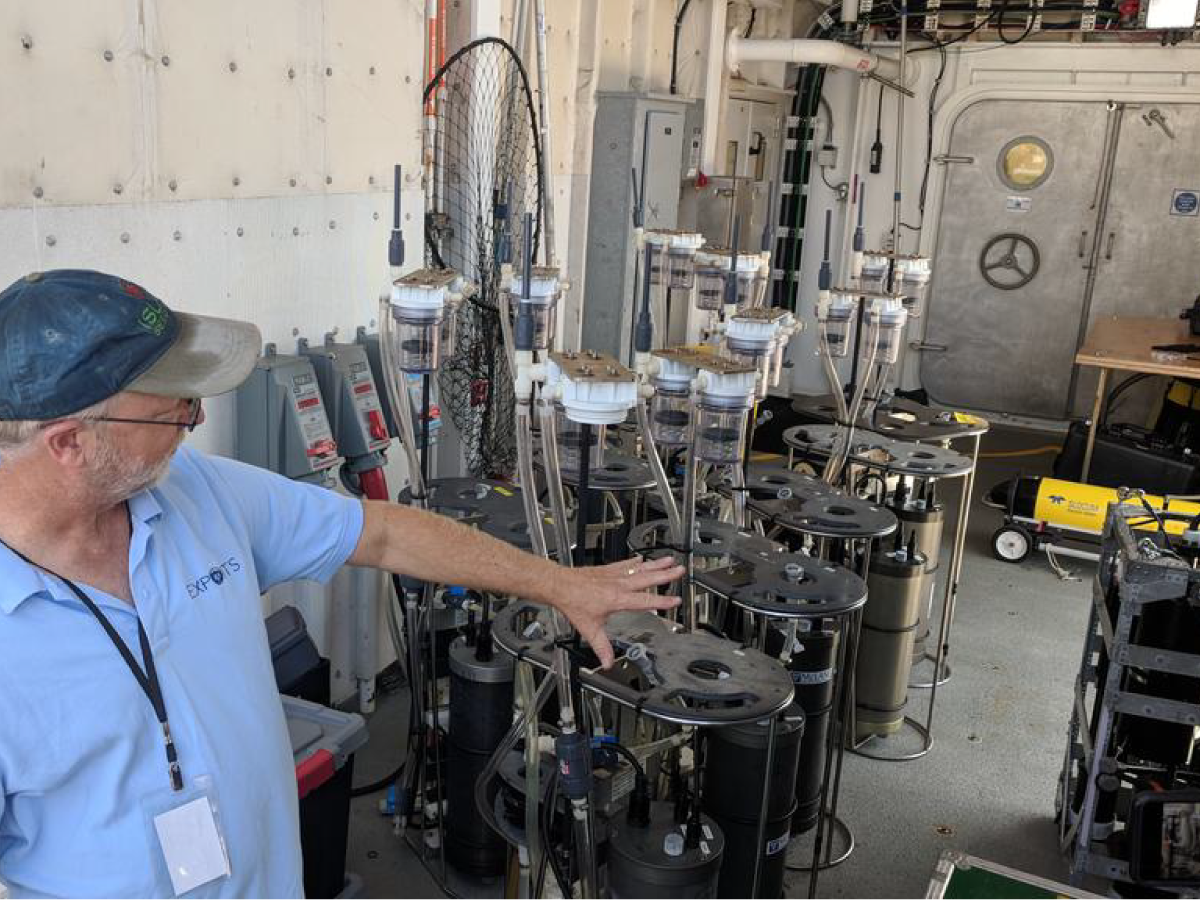
Steve Pike and Claudia Benitez-Nelson prepare filtration pumps for deployment. Samples are collected at specific depths and analyzed for microbial activity, pigments, and carbon soon after collection to minimize particle decay. Credit: Montserrat Roca Marti
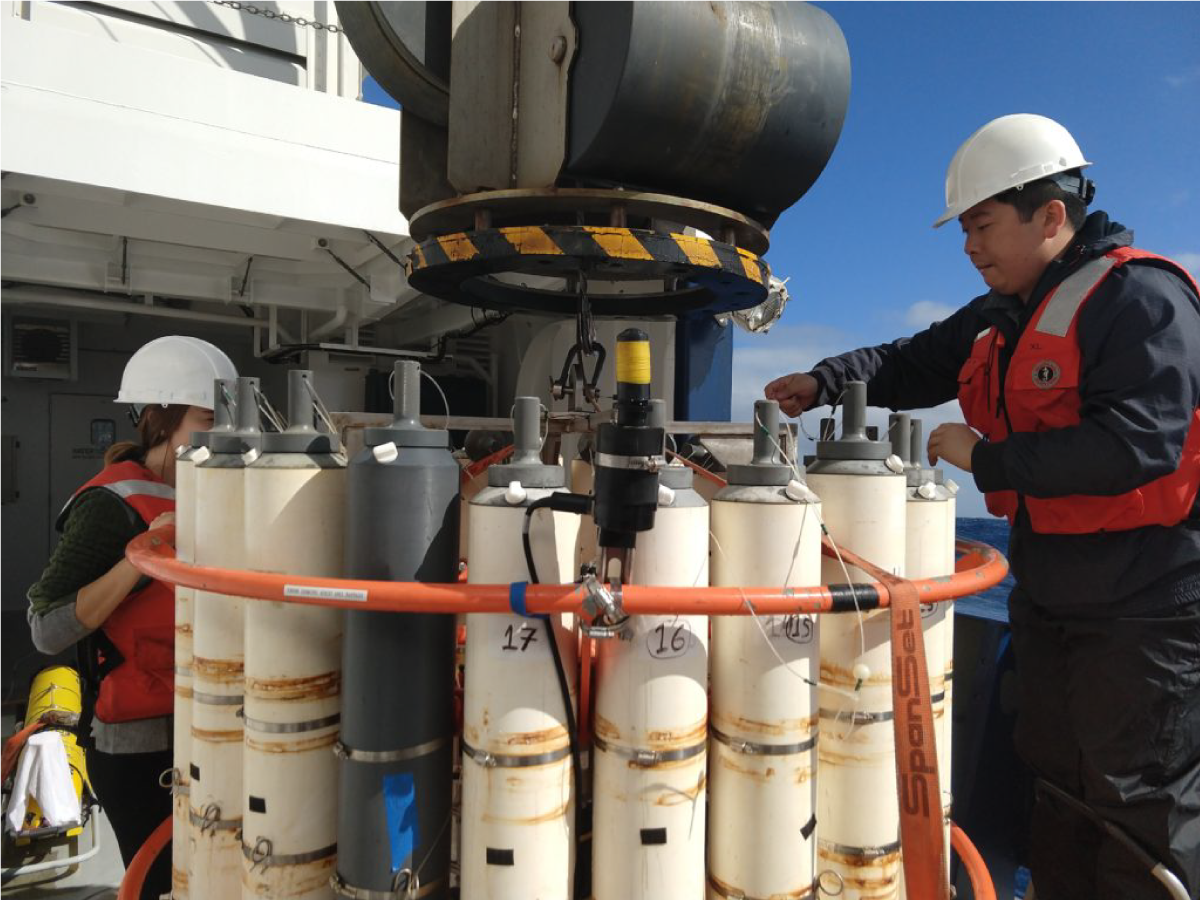
Scientist Yuanheng Xion (UND) readies Niskin bottles before a CTD is cast in the Gulf of Alaska. Credit: Abigale Wyatt (Princeton University)
Researchers bring an NBST onto the deck of the R/V Roger Revelle. Credit: NASA
Scientists prepare to recover one of eleven NBSTs deployed during the EXPORTS cruise. Credit: NASA
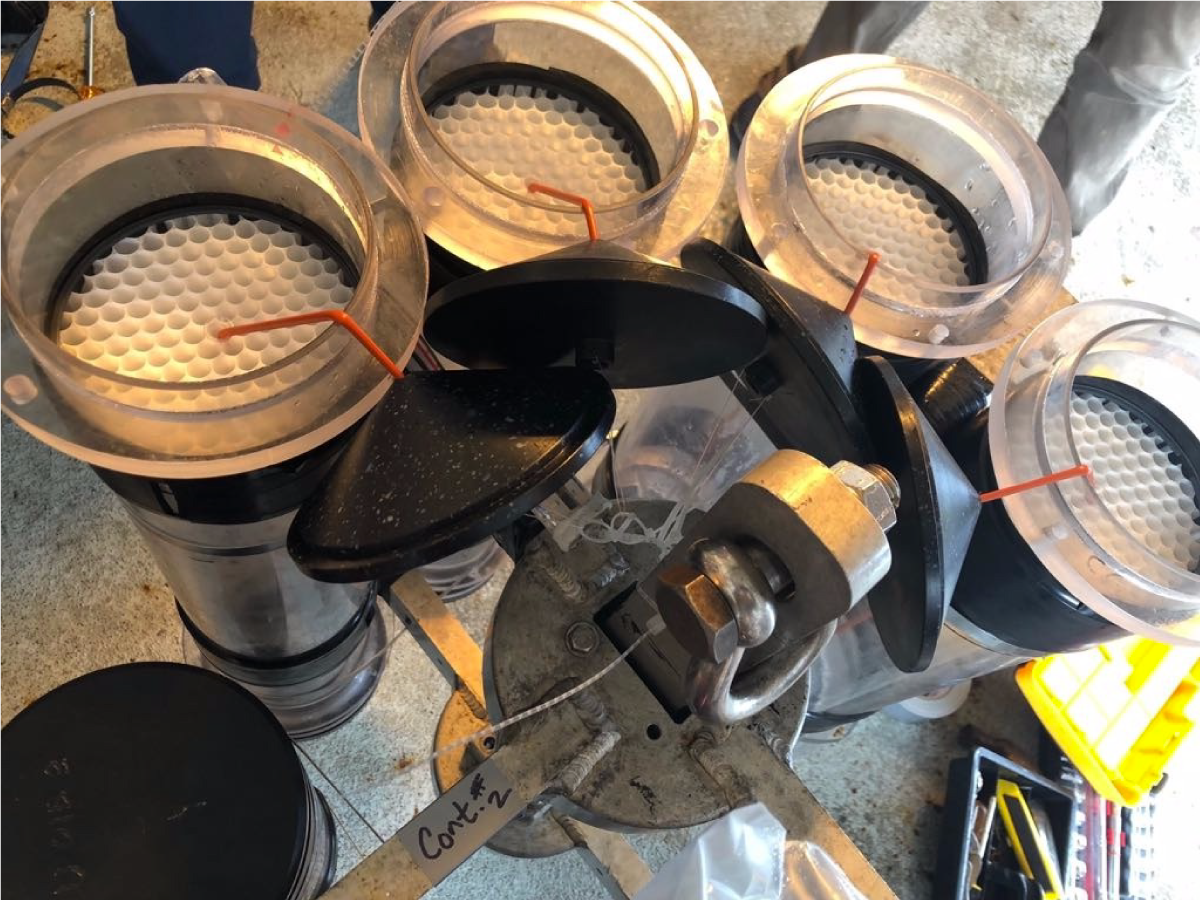
The tops of NBSTs showing the opening through which marine snow - organic material falling from above - drifts. Credit: David Siegel (UCSB)
Scientists prepare to deploy a Conductivity, Temperature, and Depth (CTD) sensor, which generates a vertical profile of the water column (surface to bottom). Discrete water samples are collected for analysis via a rosette of Niskin bottles. Credit: NASA
At right, Marine Chemist Ken Buesseler (WHOI) deploys a sediment trap from the R/V Roger Revelle. Credit: Alyson Santoro (UCSB)
The Multiple Opening/Closing Net and Environmental Sensing System (MOCNESS) is deployed off the bow of the R/V Roger Revelle. This specialized net, which incorporates many different smaller nets, is towed behind a vessel, and enables the collection of plankton throughout the water column. Credit: NASA
The EXPORTS team deploys a Marine Snow Catcher after several days of rough seas. These instruments sample water from the Twilight Zone - the focus of the cruise - so that scientists can better understand how phytoplankton and zooplankton impact carbon exported to the deep ocean. Credit: NASA
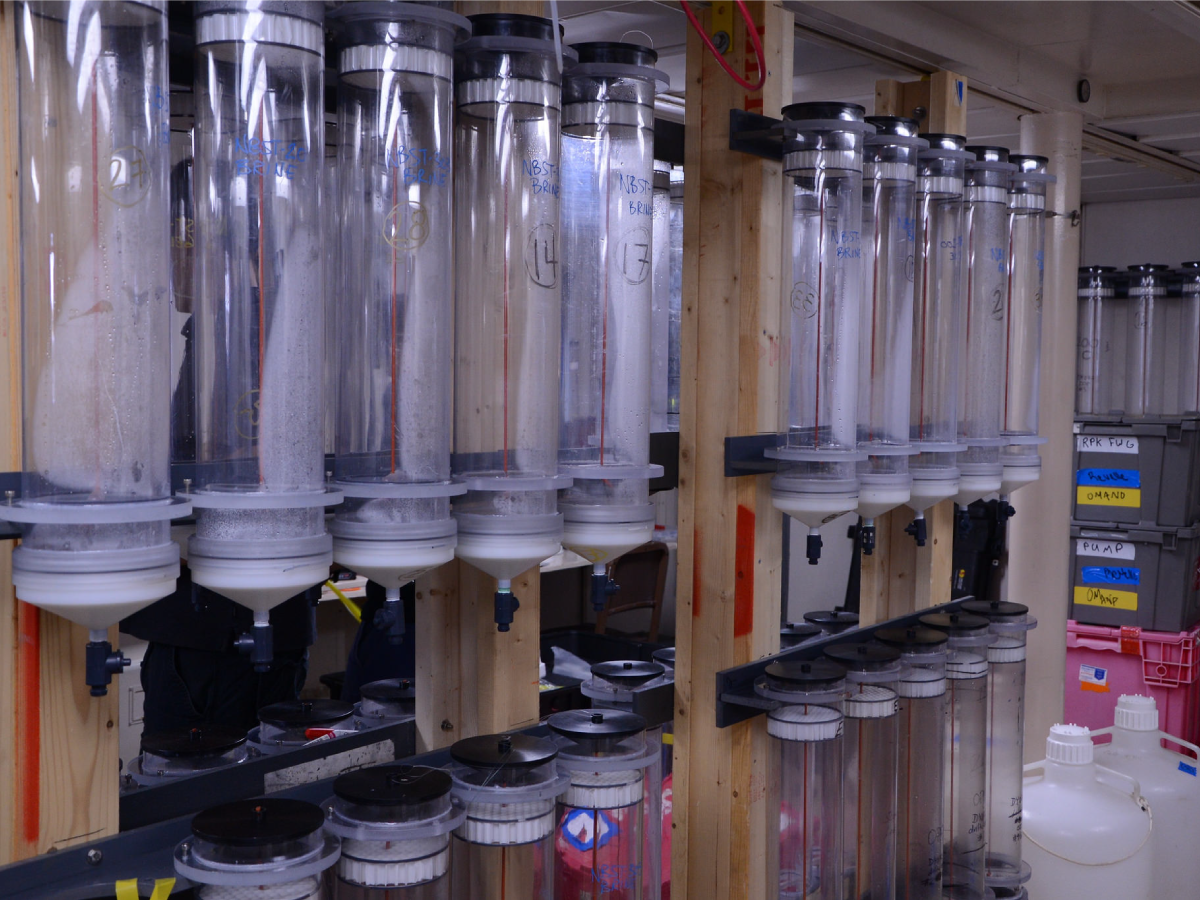
In the hydro lab on board the R/V Revelle, a row of sampling tubes await deployment. Credit: Katy Mersmann (NASA)
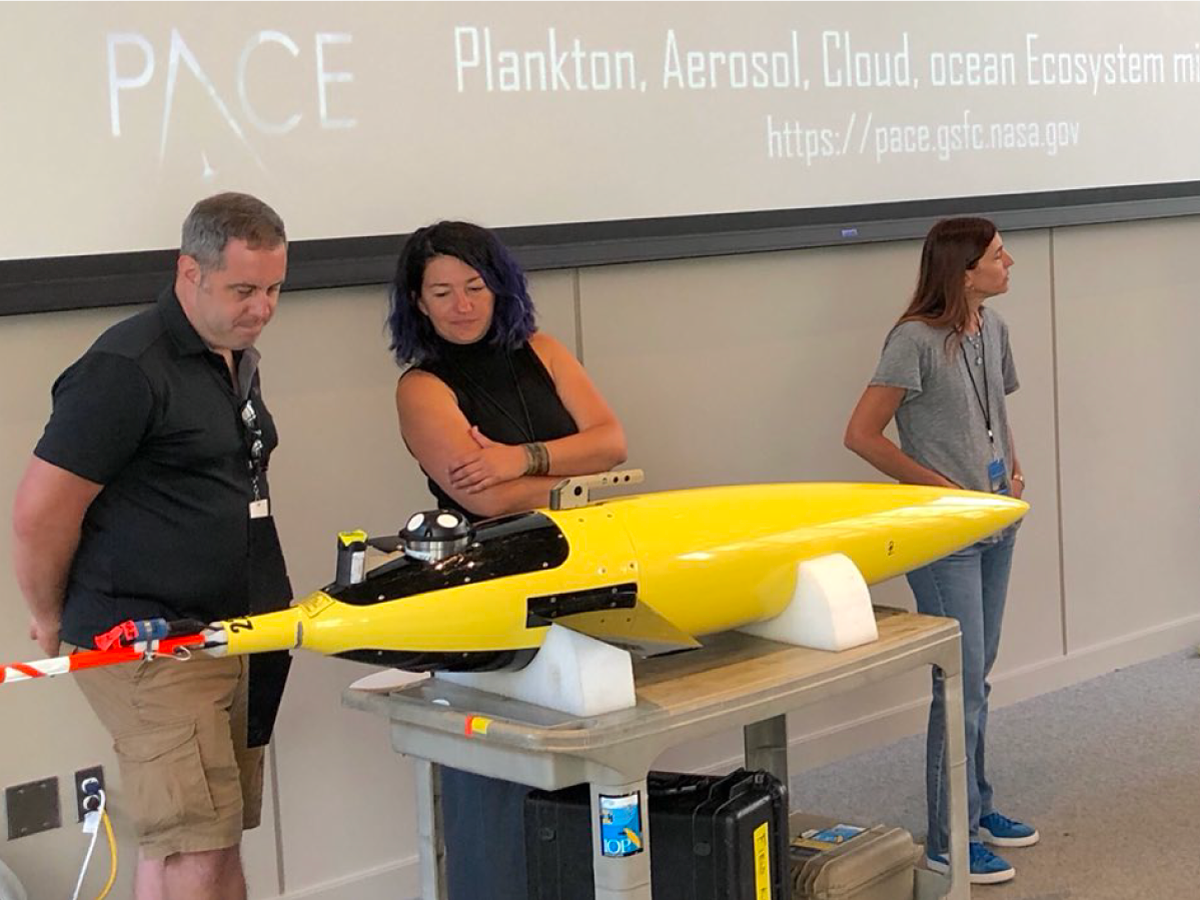
Dr. Norm Nelson, Co-chief Scientist of the R/V Sally Ride, gives the media a tour of the vessel prior to departing for the Pacific. Credit: NASA
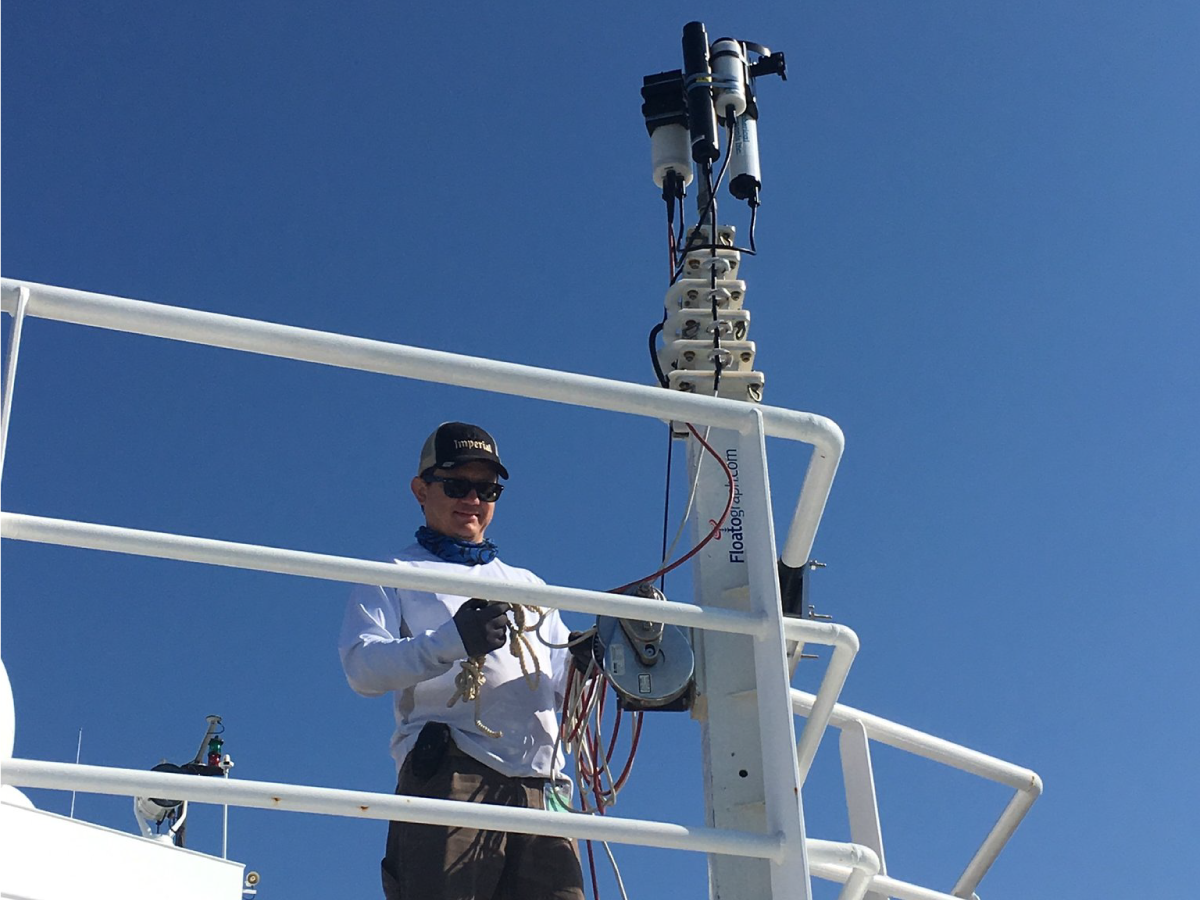
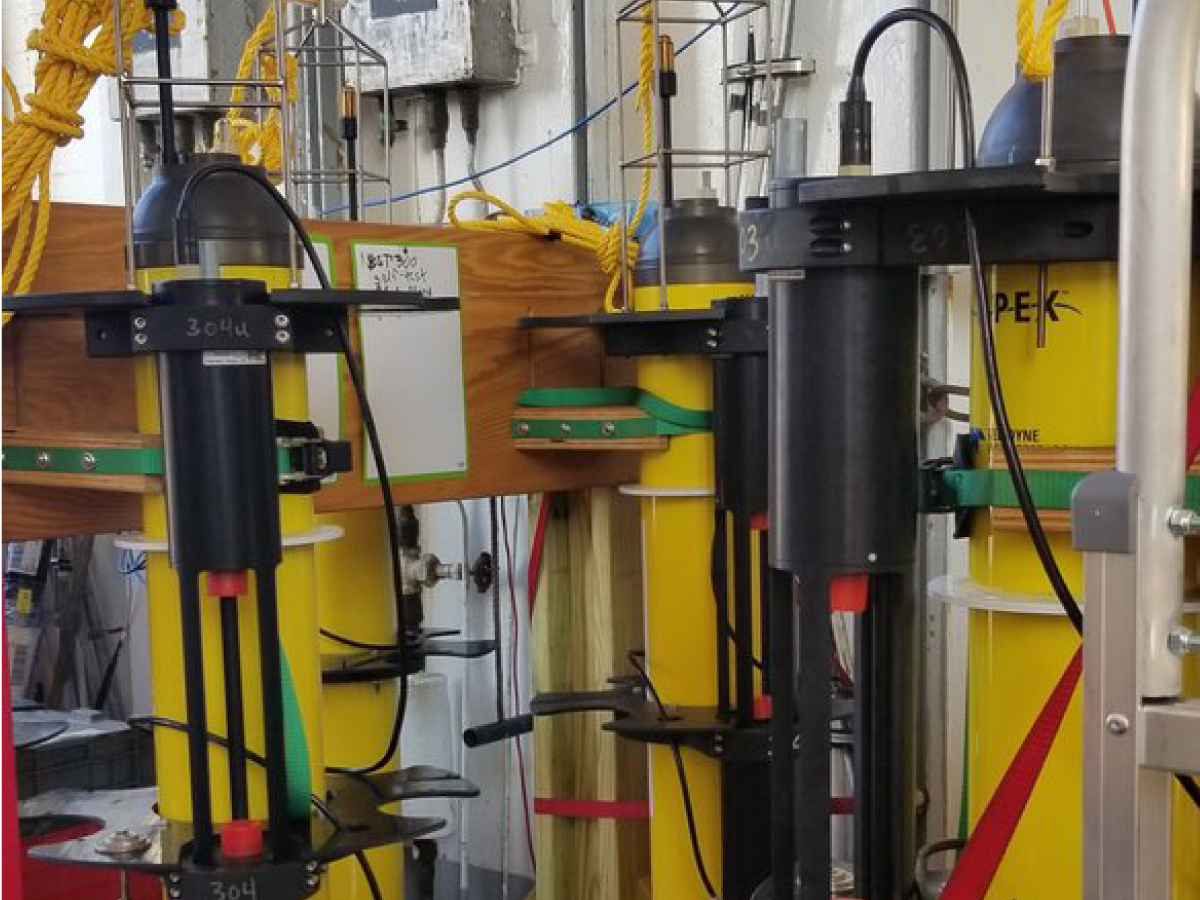
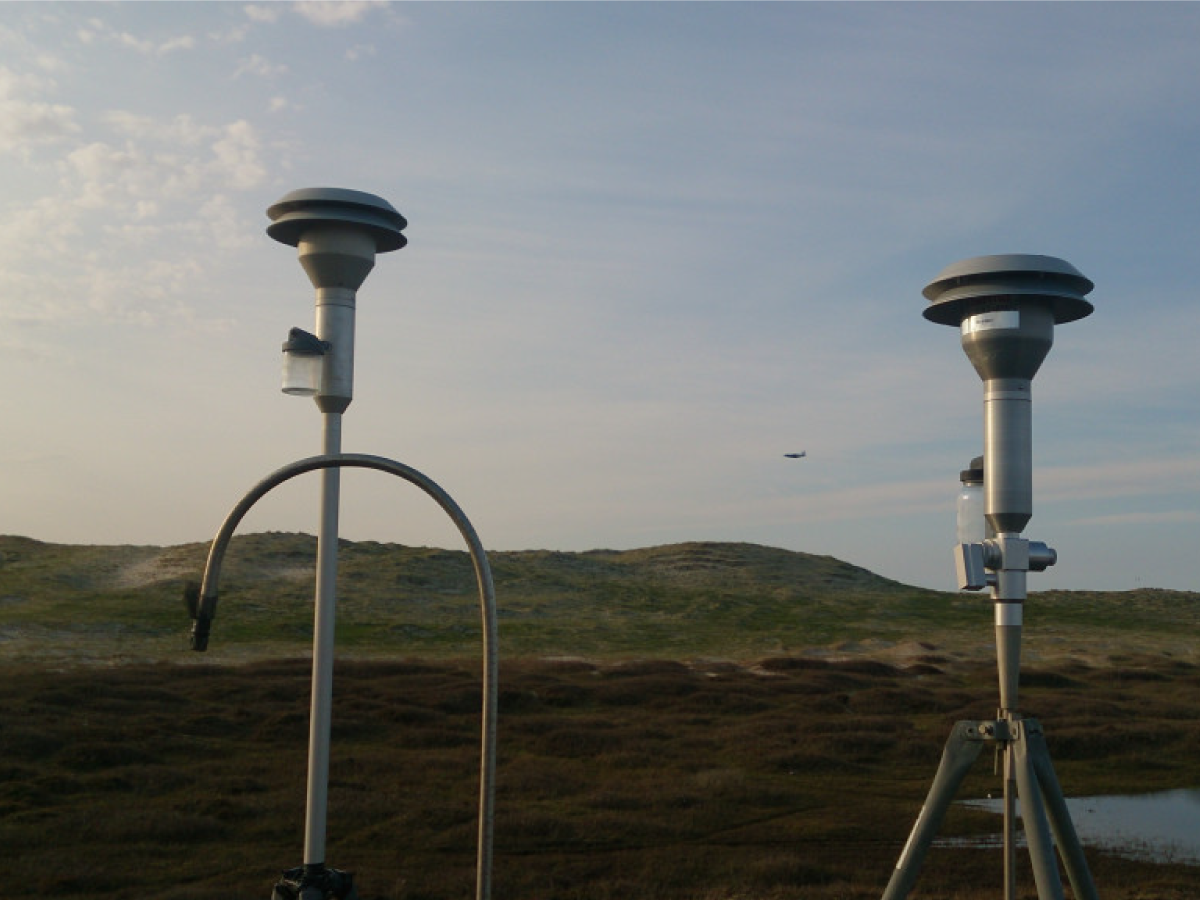
Ship-based radiometers (seen here attached to a deck rail) will collect hyperspectral data on ocean color. The hyperspectral measurements will be similar to those that will be collected during the PACE mission. Credit: NASA
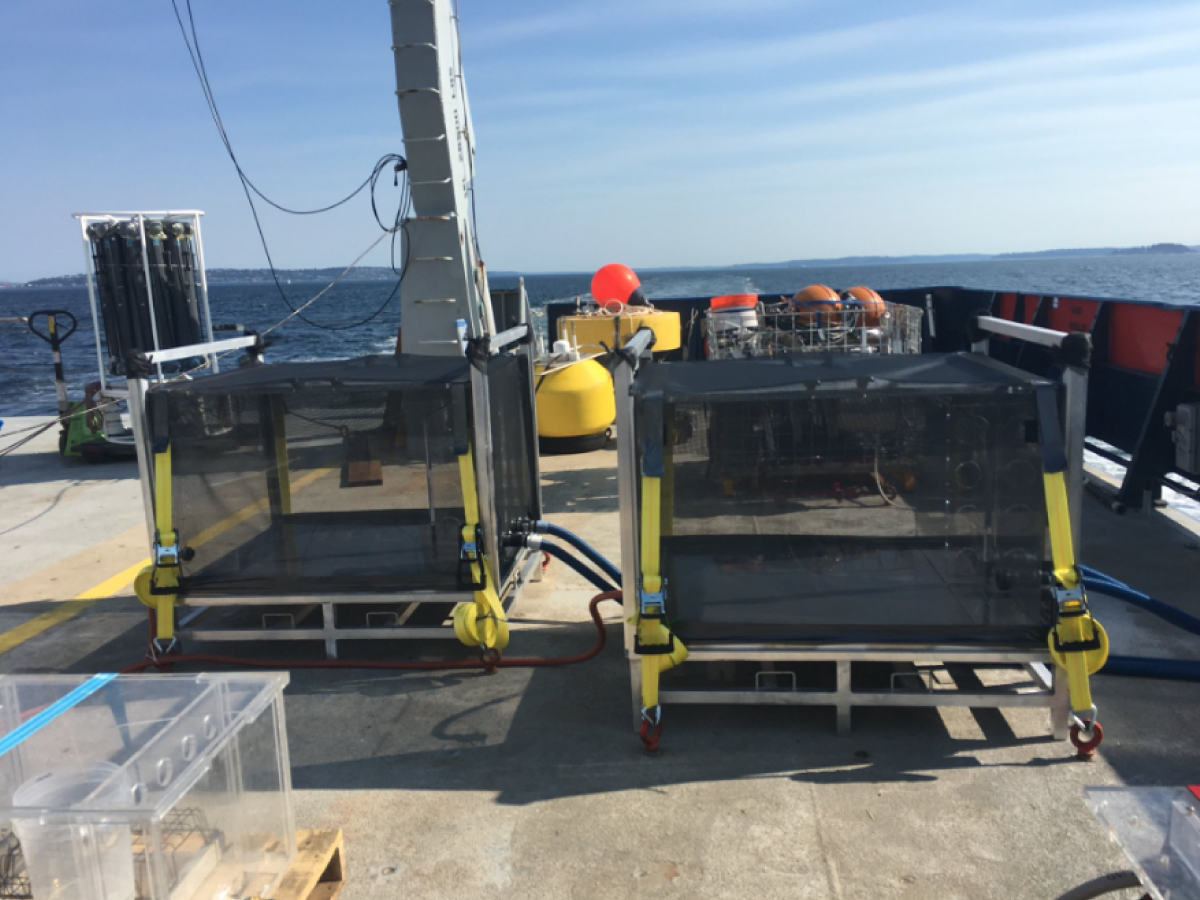
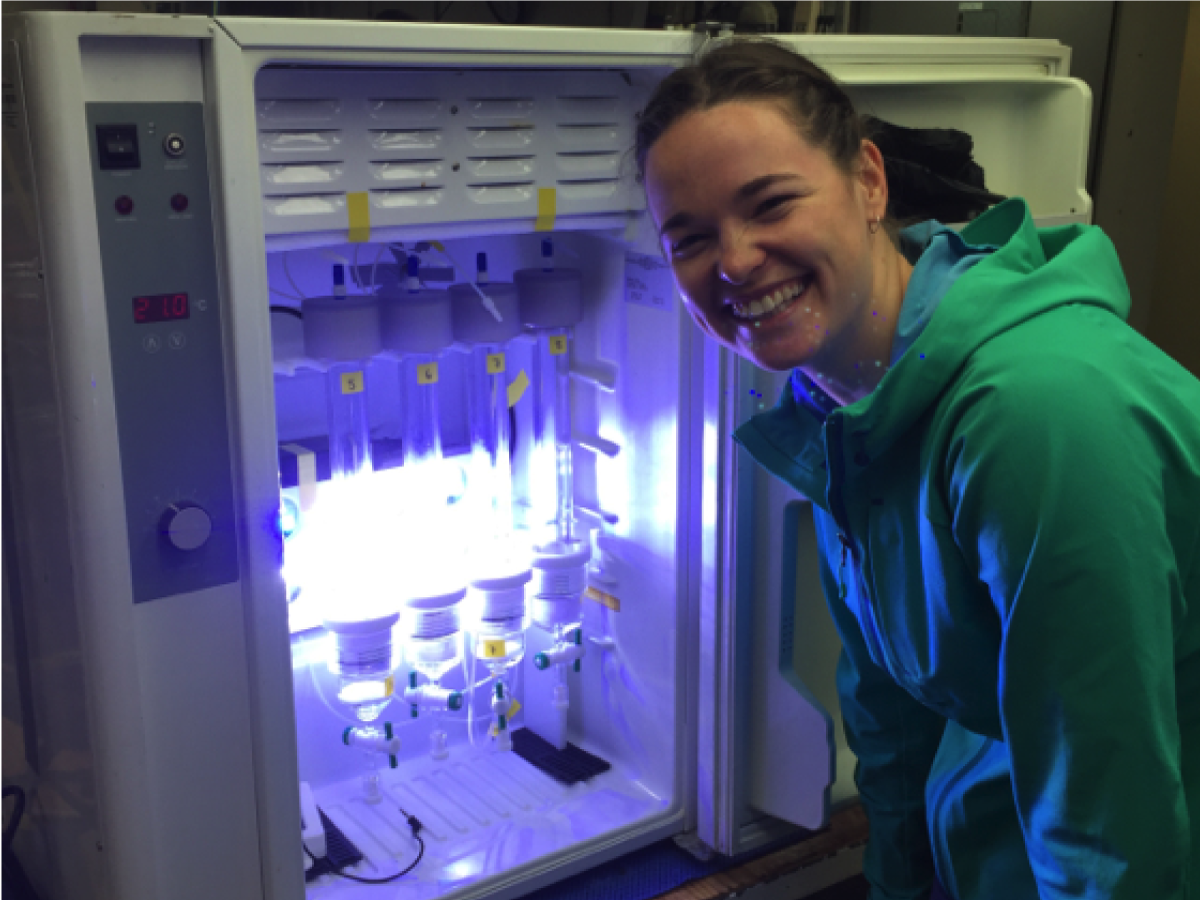
The boxes shown here are incubators for phytoplankton that will be used to study the response of plankton to different environmental conditions. Credit: NASA
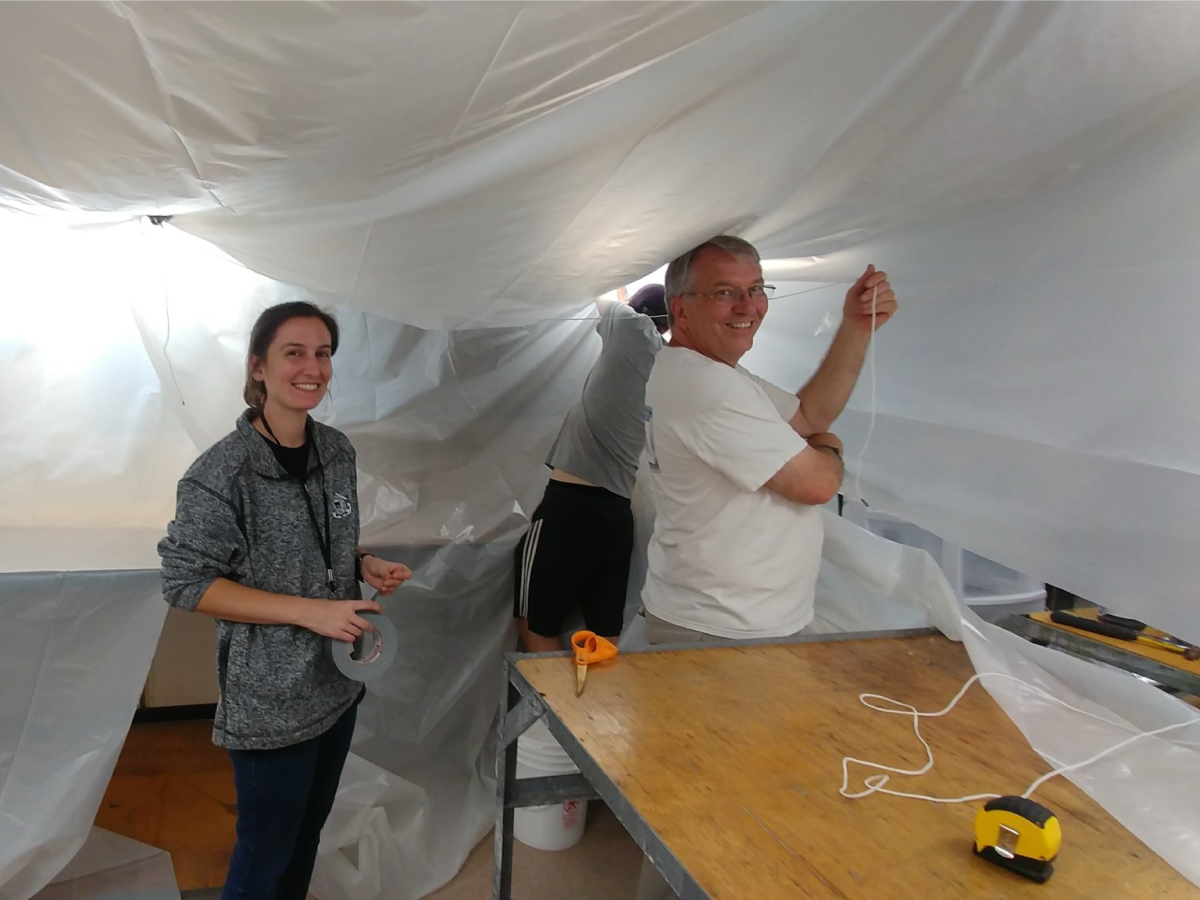
Before heading to the ocean's Twilight Zone, National Science Foundation and EXPORTS scientists build an enclosed, air-tight "bubble" in which to work. Credit: S. Burns (NASA)
Scientists affiliated with the EXPORTS field campaign discuss the upcoming mission. Credit: Michael Starobin (NASA)

A mosaic of plankton lovers: Members of the EXPORTS team are shown on digital trading cards, created by Dr. Kim Martini for a NASA social media event. Credit: Dr. Kim Martini (Sea-Bird Scientific, Deep Sea News)
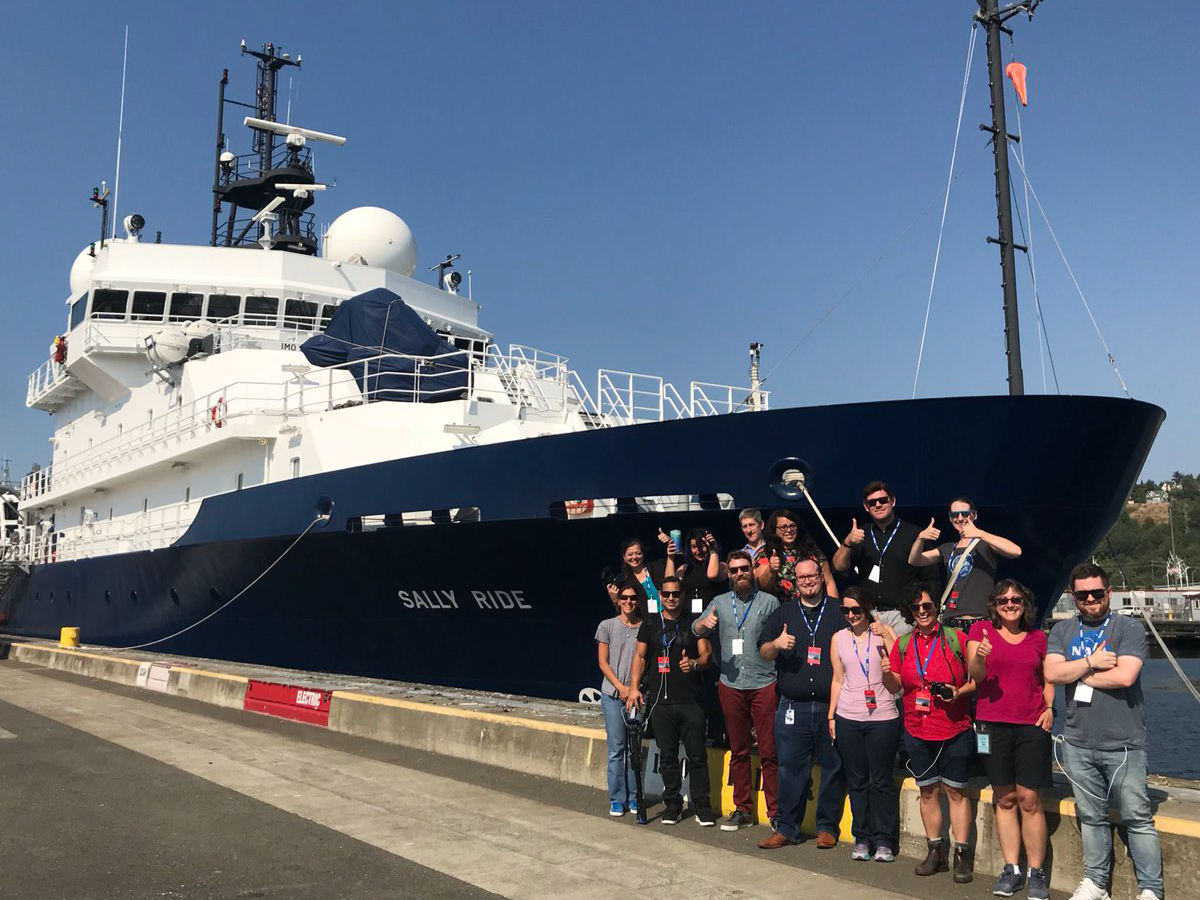
Participants from a NASA social media event pose by the R/V Sally Ride before it embarks on its August 2018 tour of the North Pacific. Credit: NASA
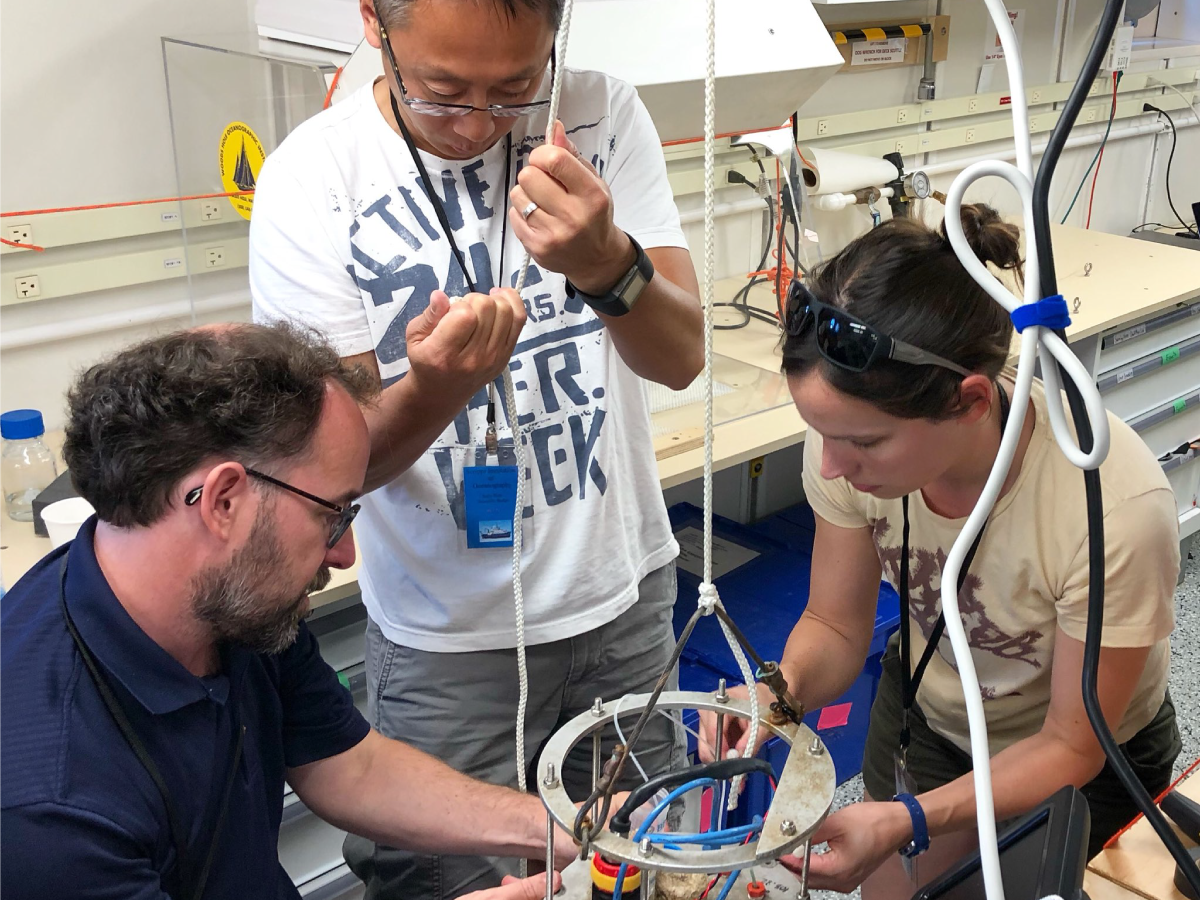
EXPORTS scientists prepare an IFC for operation on board the R/V Sally Ride. Credit: Michael Starobin (NASA)
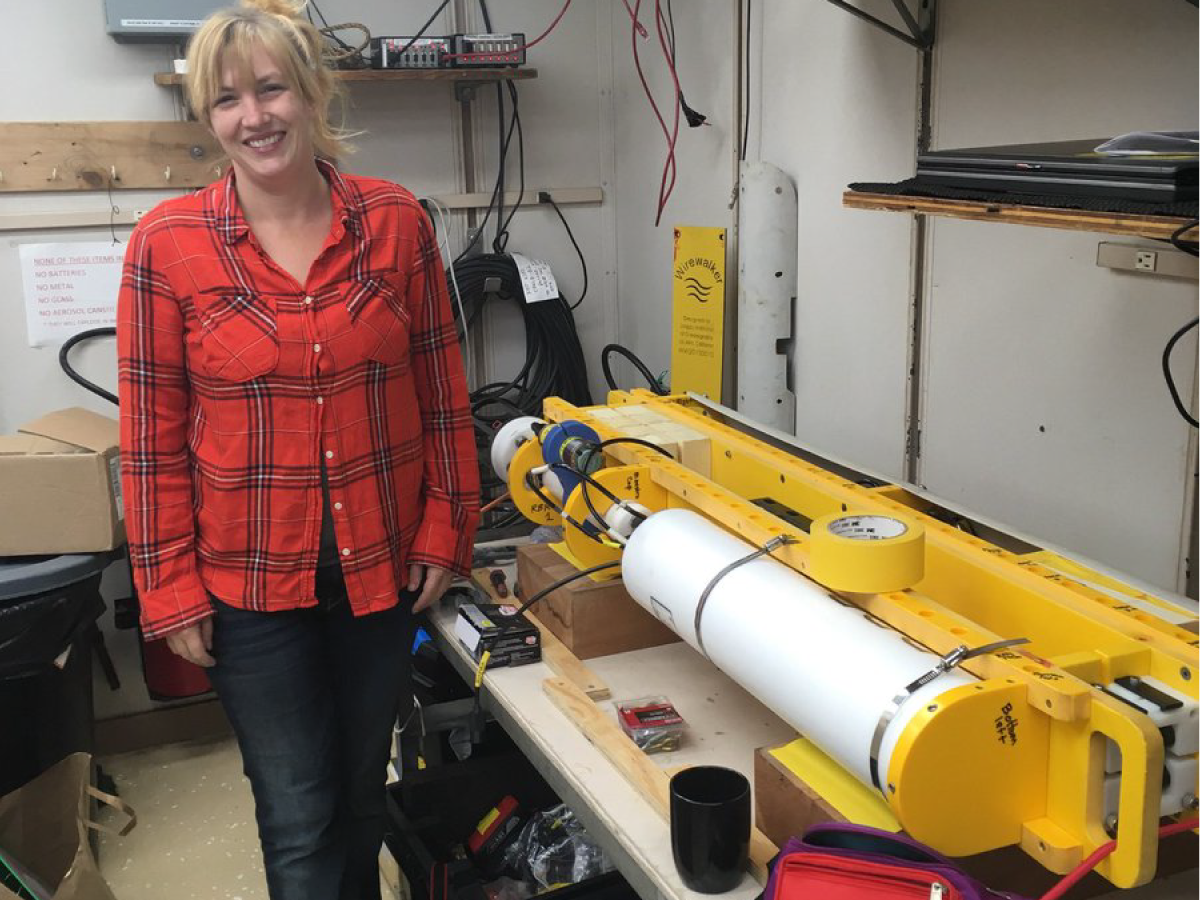
Dr. Melissa Omand (URI) assembles a Wirewalker, an autonomous platform used to collect high frequency data. Credit: NASA
Neutrally Buoyant Sediment Traps (NBSTs) are specially designed containers deployed in the water column to collect particles falling toward the sea floor. Credit: NASA
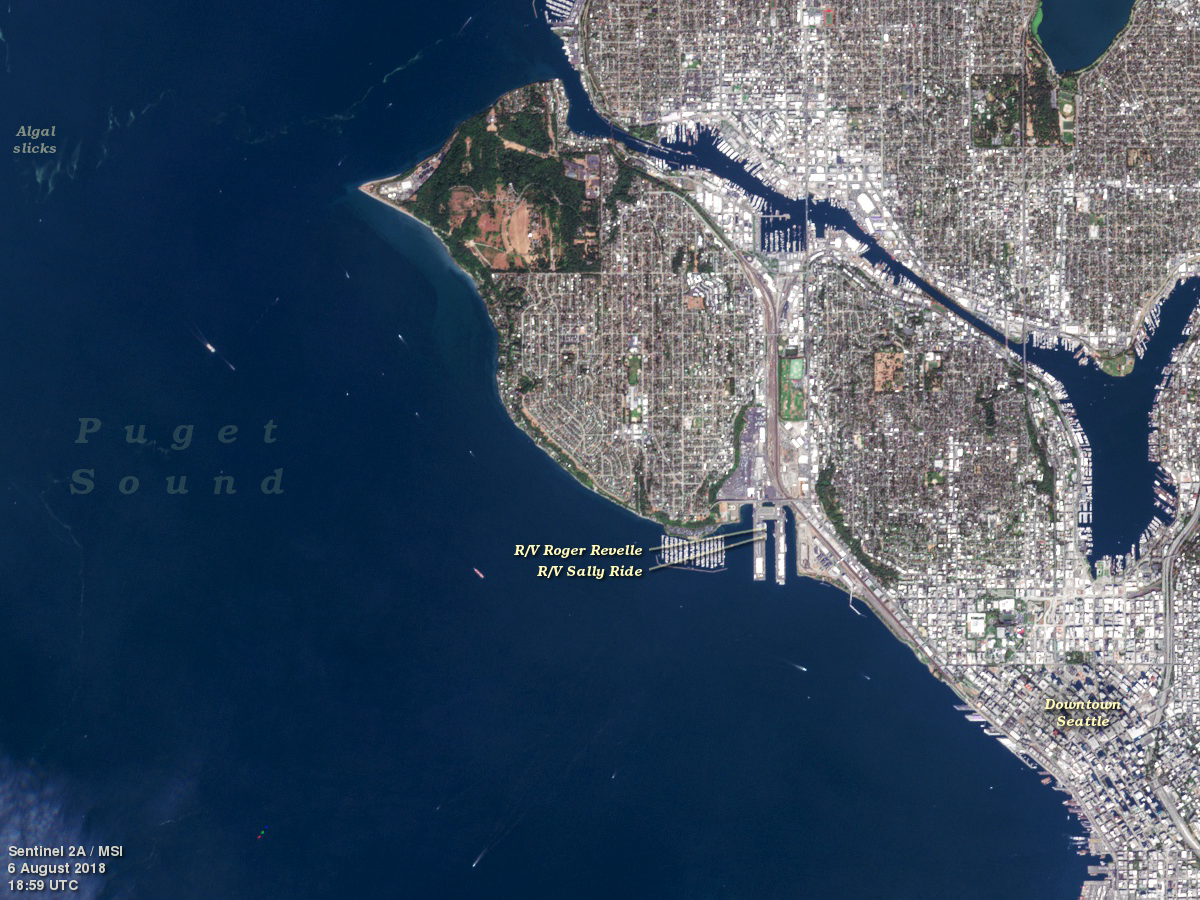
This Sentinel-2A view of Seattle, WA shows the R/V Sally Ride and the R/V Roger Revelle docked at Smith Cove. Credit: NASA
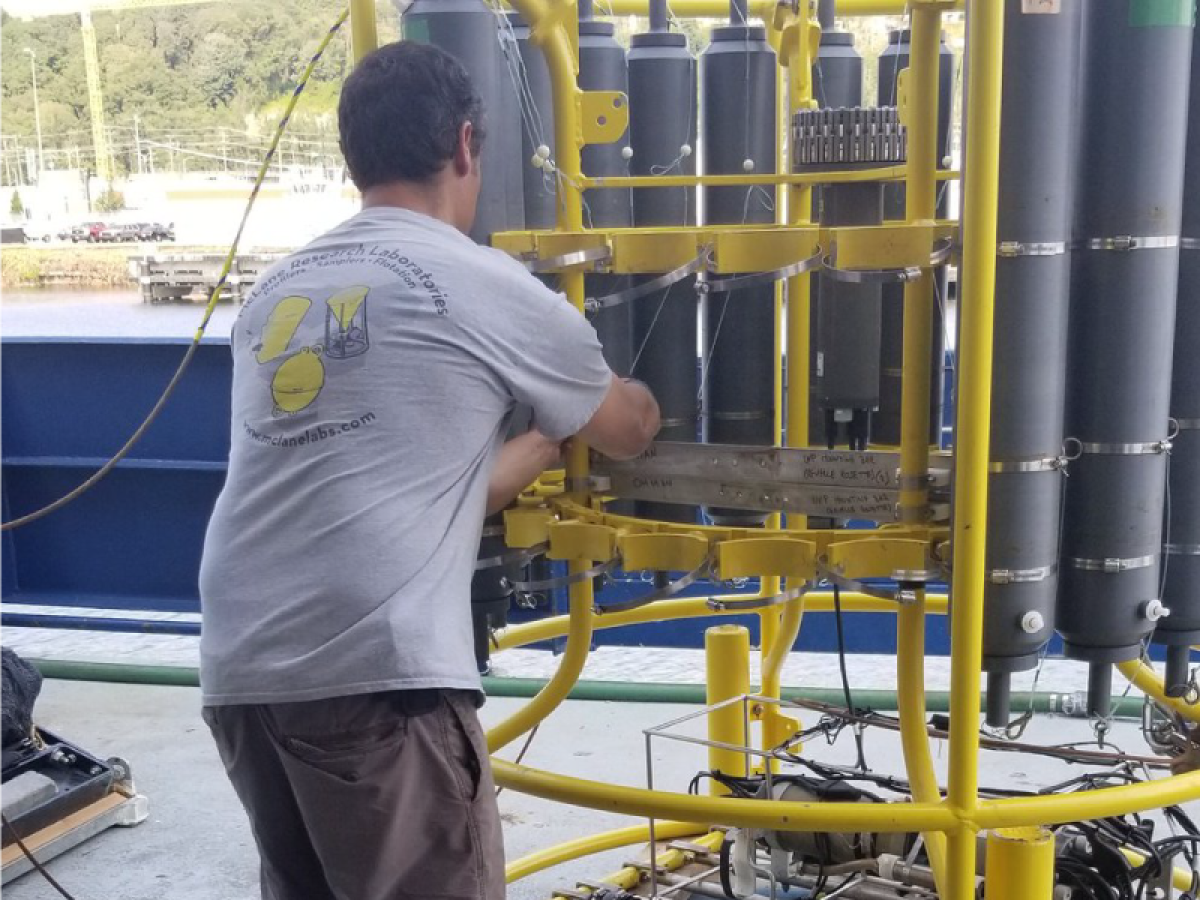
Dr. Emmanuel Boss (UMaine) readies an Underwater Vision Profiler, which will be used by scientists from UMaine and UA Fairbanks to collect water samples during the field campaign. Credit: NASA
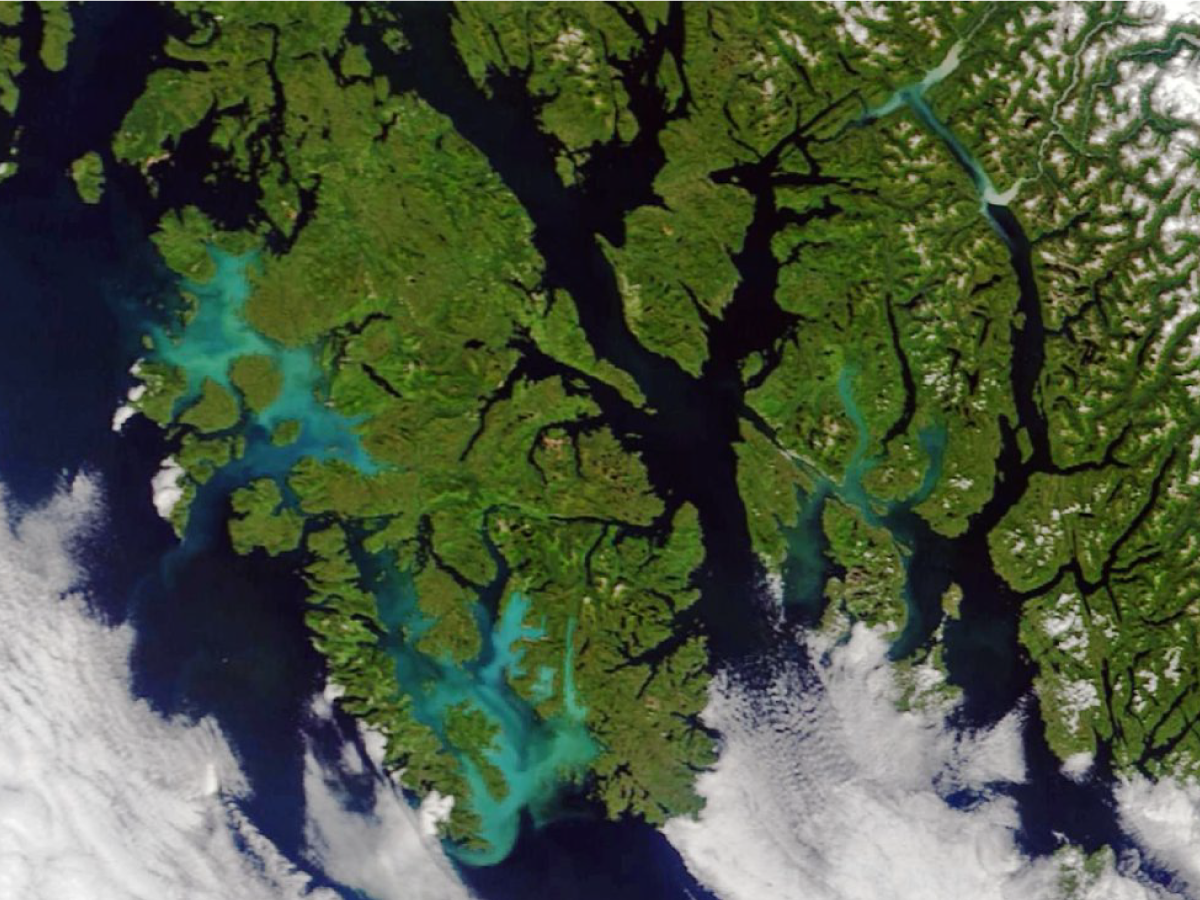
Milky blue water in this satellite view of Prince of Wales Island, AK is thought to be caused by a bloom of non-toxic phytoplankton known as coccolithophores. Credit: NASA
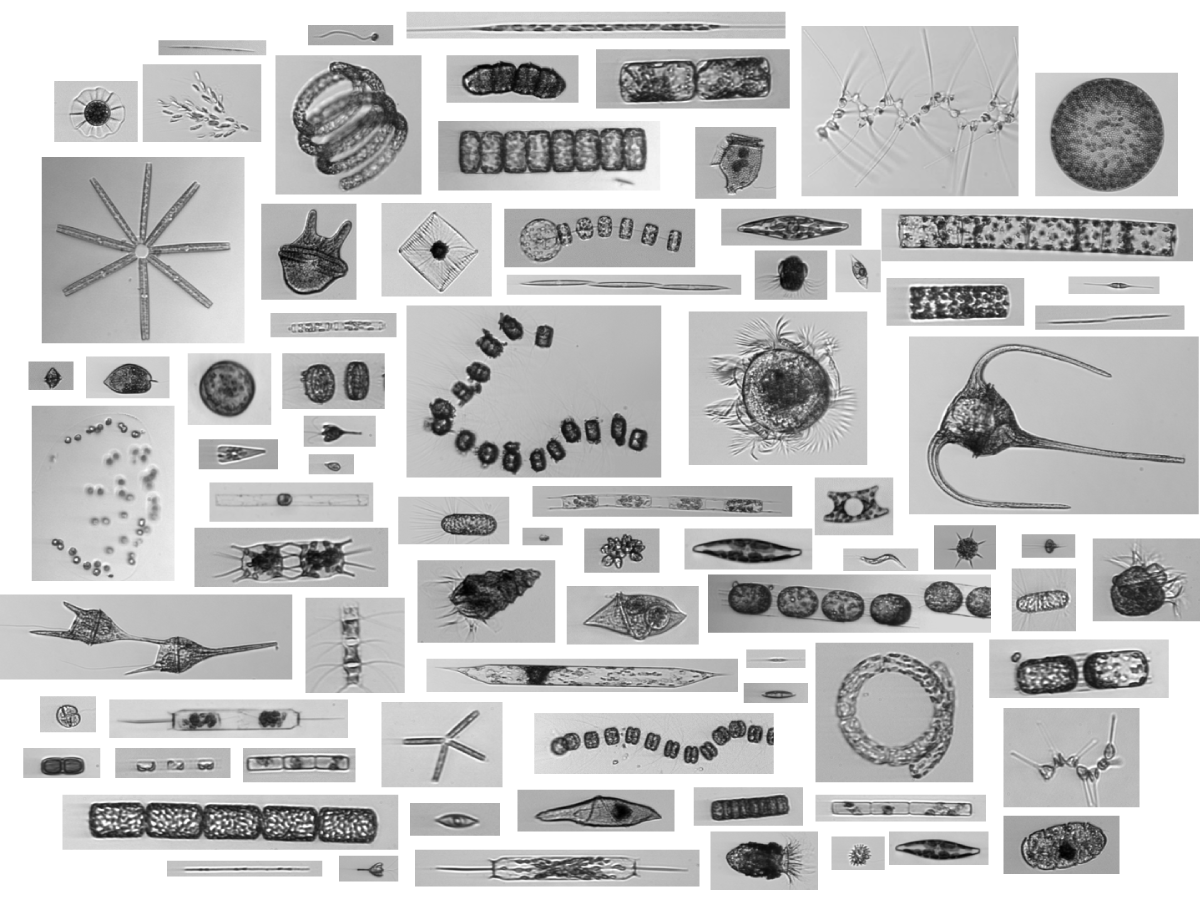
During the EXPORTS field campaign, the Imaging Flow Cytobot (IFC) will give scientists a continuous view of plankton diversity in the northeast Pacific. This collage represents just a small number of the plankton that inhabit Earth's ocean. Credit: Heidi Sosik (WHOI)
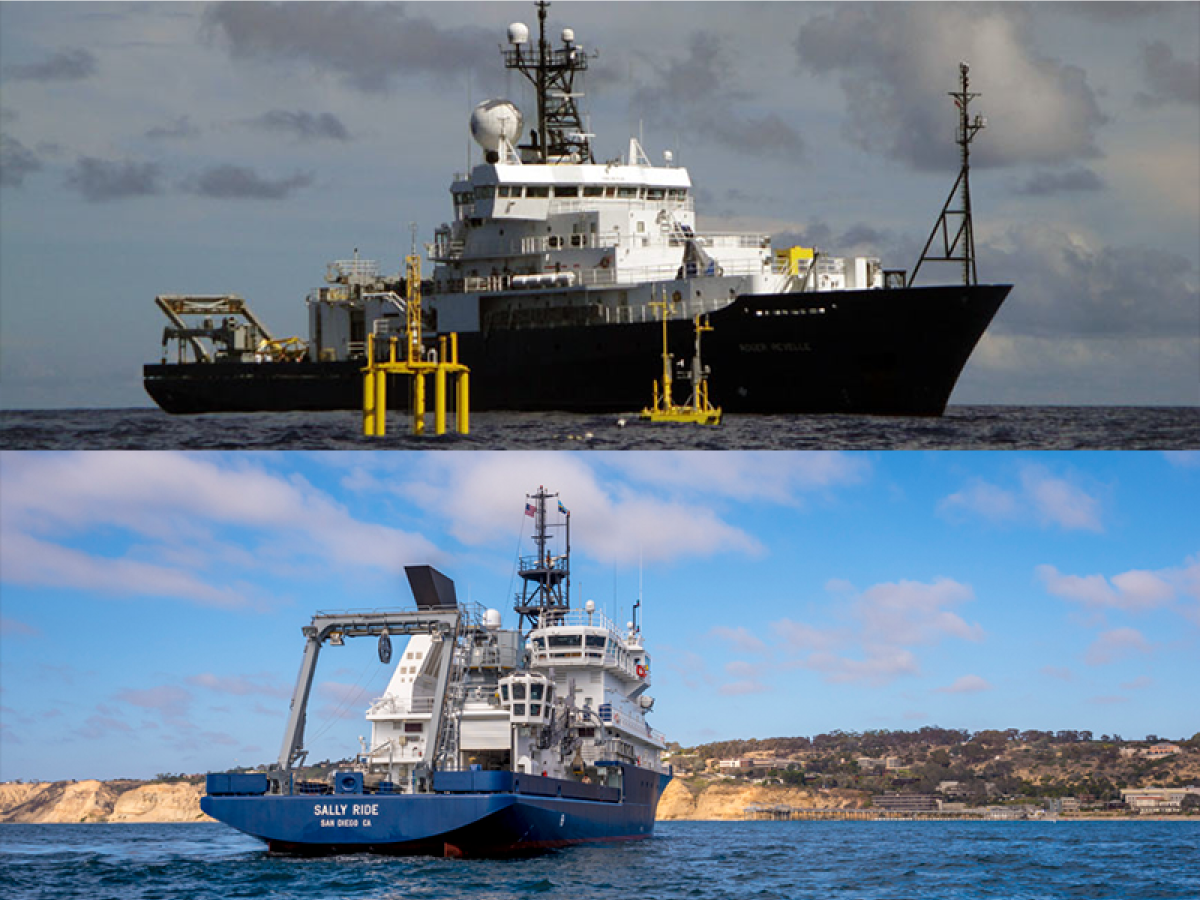
The first EXPORTS field deployment will be to the northeast Pacific Ocean in late summer 2018. The cruise will utilize two research vessels: The R/V Roger Revelle (top) and the R/V Sally Ride (bottom). Credit: Scripps Institution of Oceanography
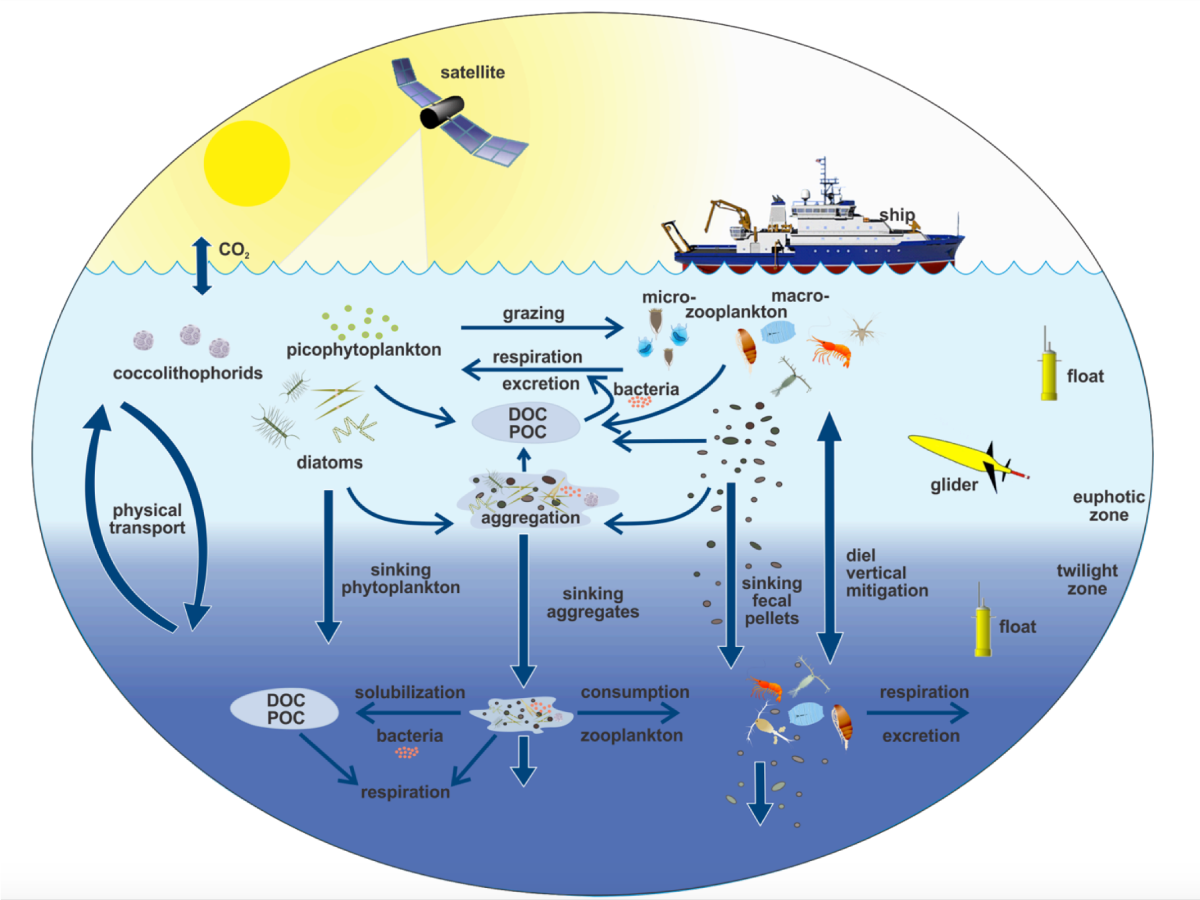
This illustration links the ocean biological pump and pelagic food web. Field campaigns such as EXPORTS utilize ships, satellites and autonomous vehicles to sample many parts of this system. Credit: Adapted from Siegel et al., 2016
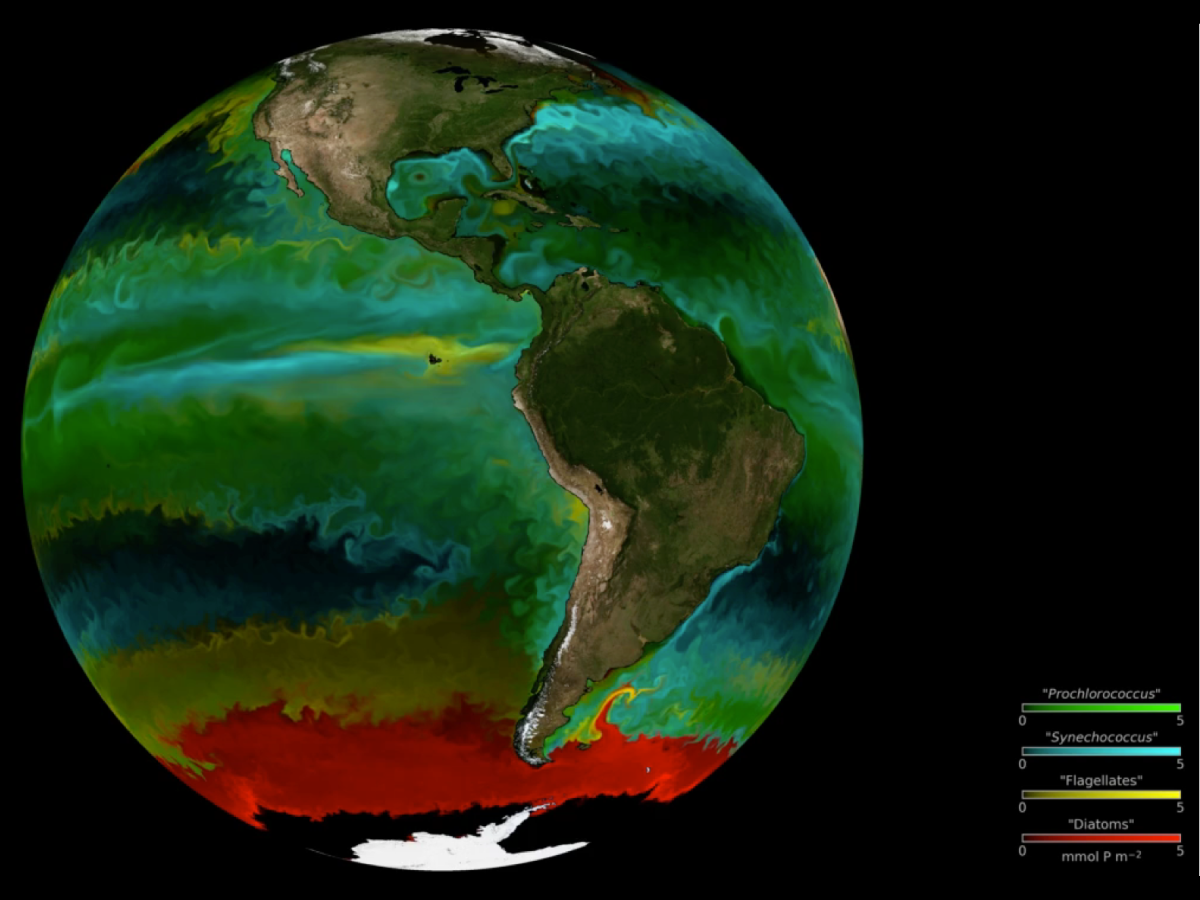
Understanding the location and characteristics of phytoplankton is key to discovering their role in the ocean ecosystem. The colors on this map represent different types of phytoplankton modeled by a high-resolution ocean and ecosystem model. Credit: The Darwin Project (MIT)
The goal of EXPORTS is to track the fate of ocean carbon and study its implications for Earth's carbon cycle. EXPORTS will use advanced ocean observing tools and satellite observations to build a more complete picture of these complex processes.
EXPORTS Field Campaign, August 2018 VIEW ALL »
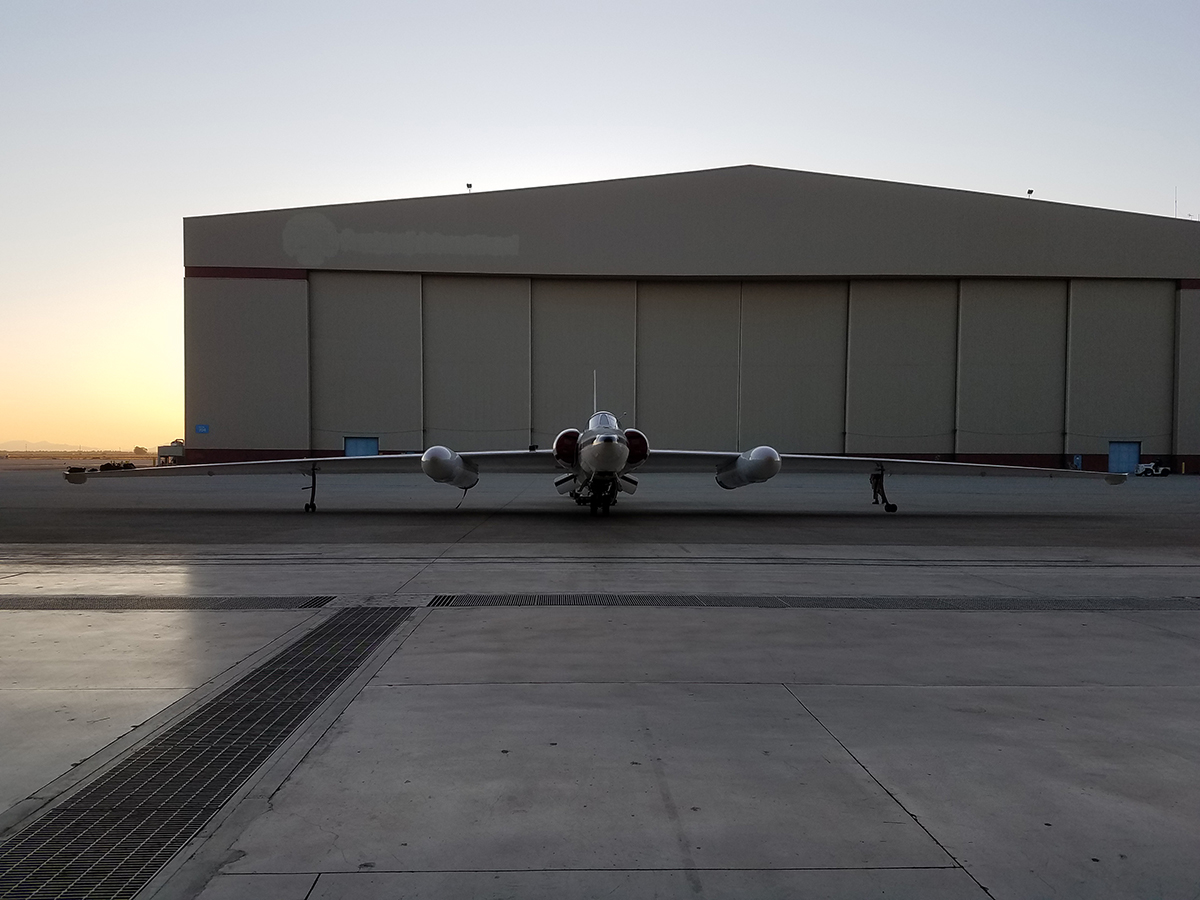
The ER-2 prepares to re-enter the hangar after a flight. Credit: NASA/Andrzej Wasilewski
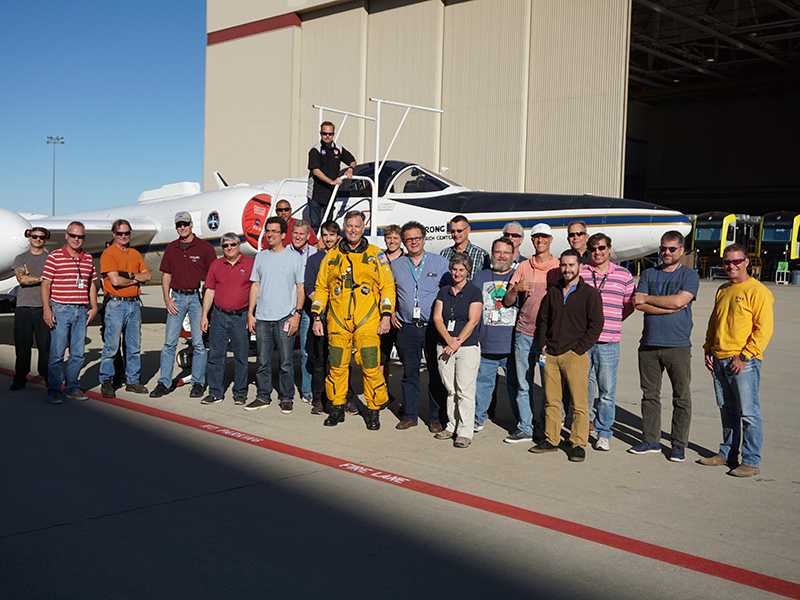
Some of the pilots, mechanics, engineers and scientists who participated in the ACEPOL field campaign. Credit: Kirk Knobelspiesse (NASA)
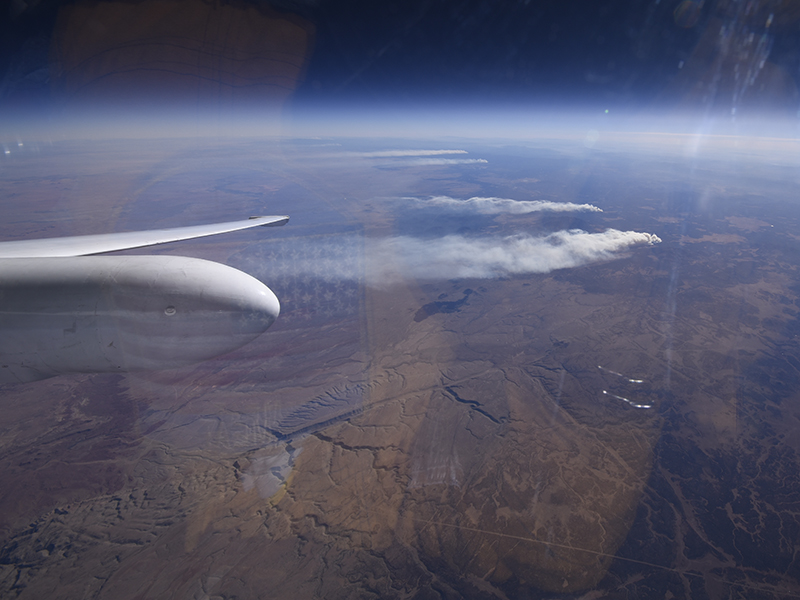
Smoke from prescribed fire treatment - conducted to remove timber slash, woody debris, grass, and brush - wafts over Arizona's Shoofly area. Credit: Stu Broce (NASA)
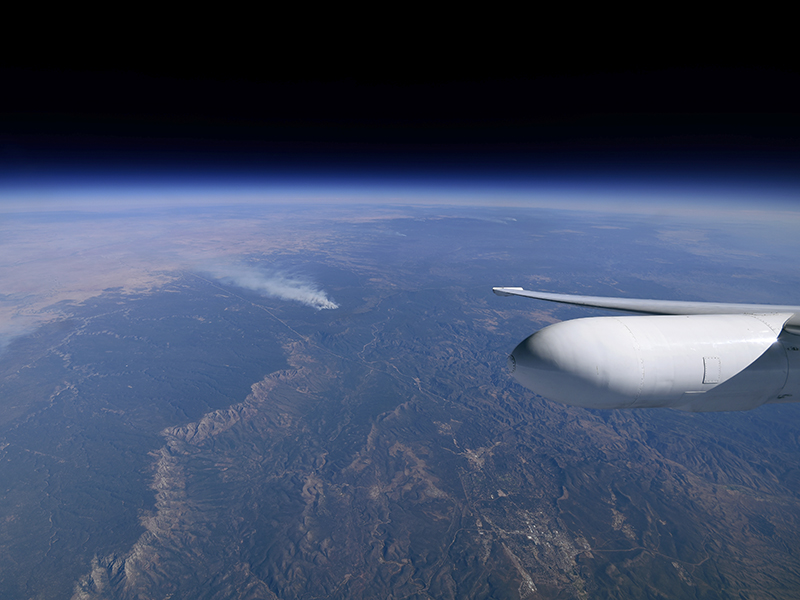
View from the ER-2 cockpit. Credit: Stu Broce (NASA)
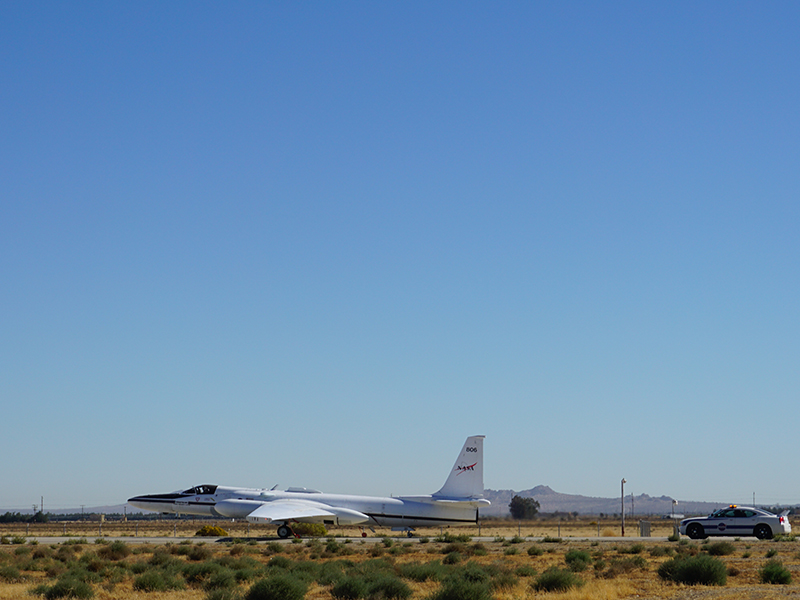
The ER-2 taxis to the runway, followed by its chase car. Credit: Kirk Knobelspiesse (NASA)
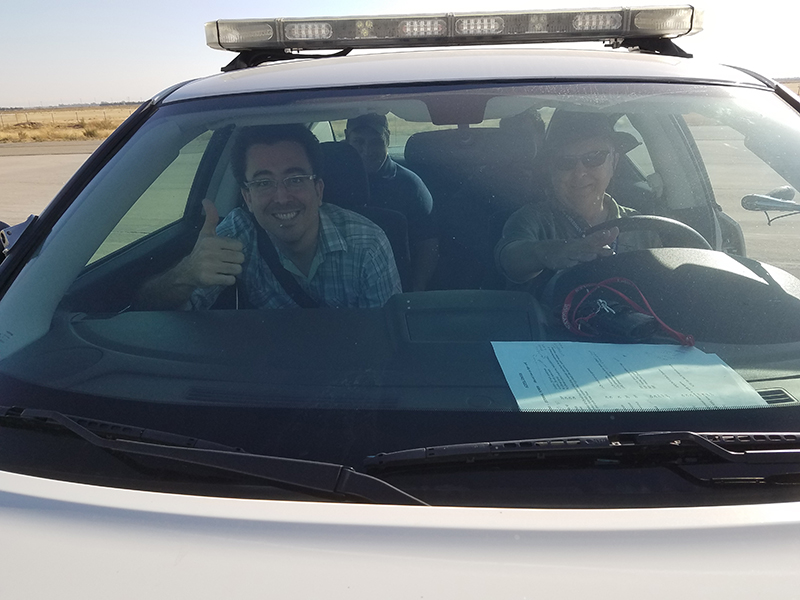
ACEPOL scientists and engineers in the chase car. Credit: Andrzej Wasilewski (NASA)
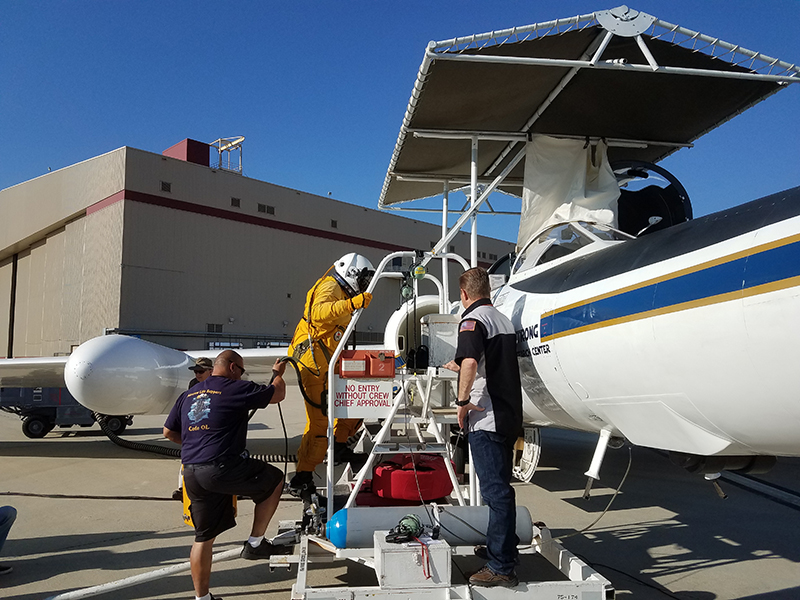
The ER-2 pilot boards the aircraft. Because of high flight altitudes, pressurized suits are required. Credit: Andrzej Wasilewski (NASA)
The NASA ER-2 chase car. Because ground visibility and stability are problematic during takeoff and landing, a chase car driven by a pilot accompanies the aircraft to the runway. Credit: Andrzej Wasilewski (NASA)
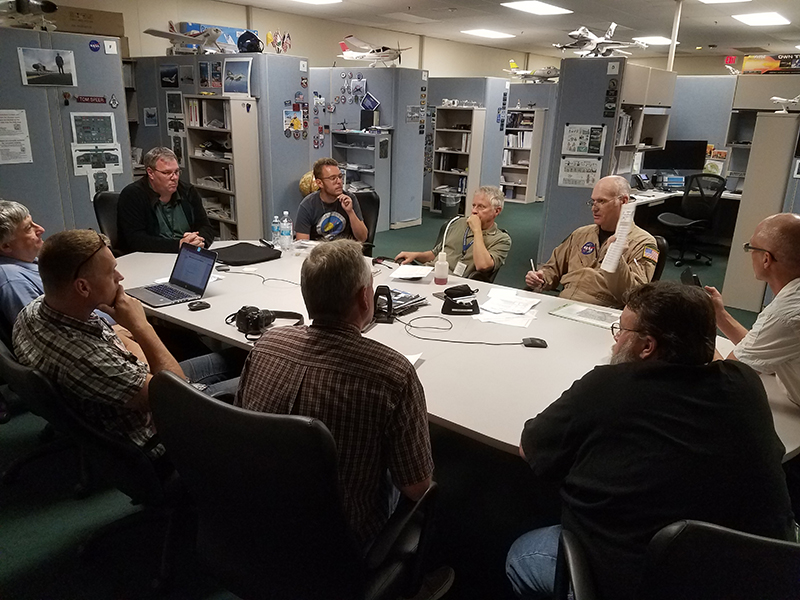
The ACEPOL team attends a briefing prior to flight. Credit: Andrzej Wasilewski (NASA)
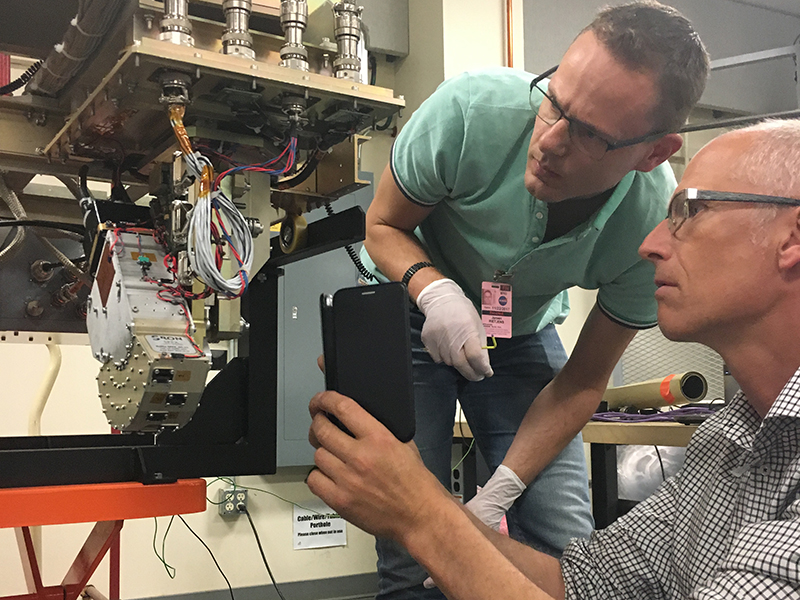
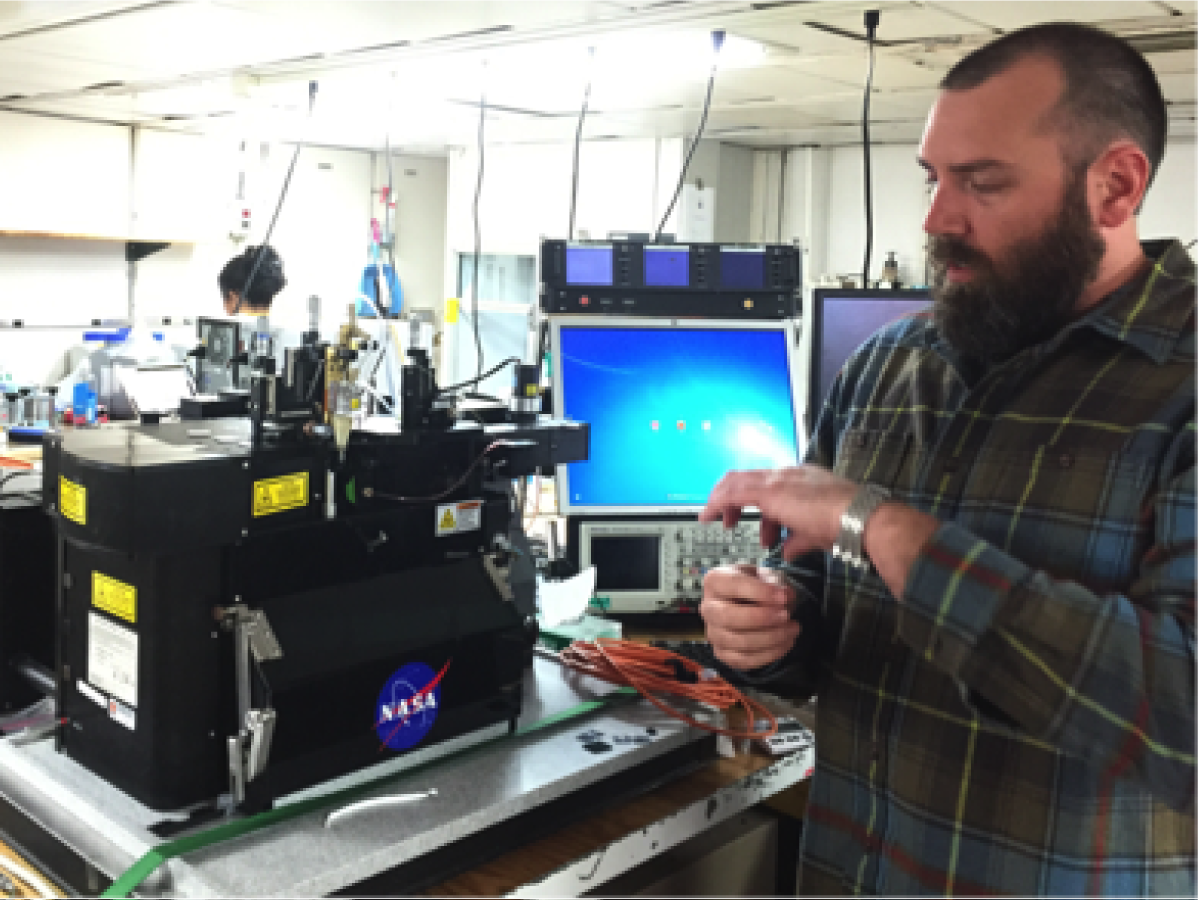
The ACEPOL mission is particularly relevant for PACE because it uses airborne versions of the HARP2 and SPEXone polarimeters. Here, the SPEX-Airborne team performs instrument tests. Credit: Kirk Knobelspiesse (NASA)
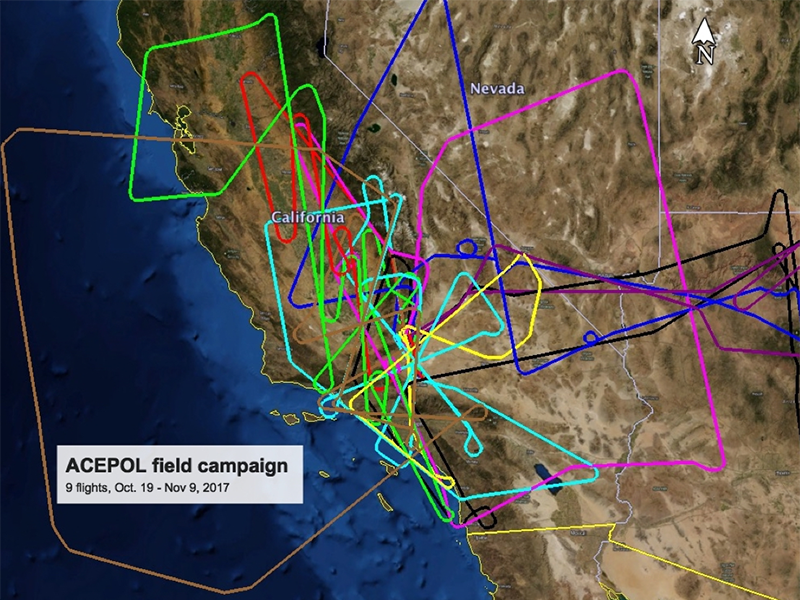
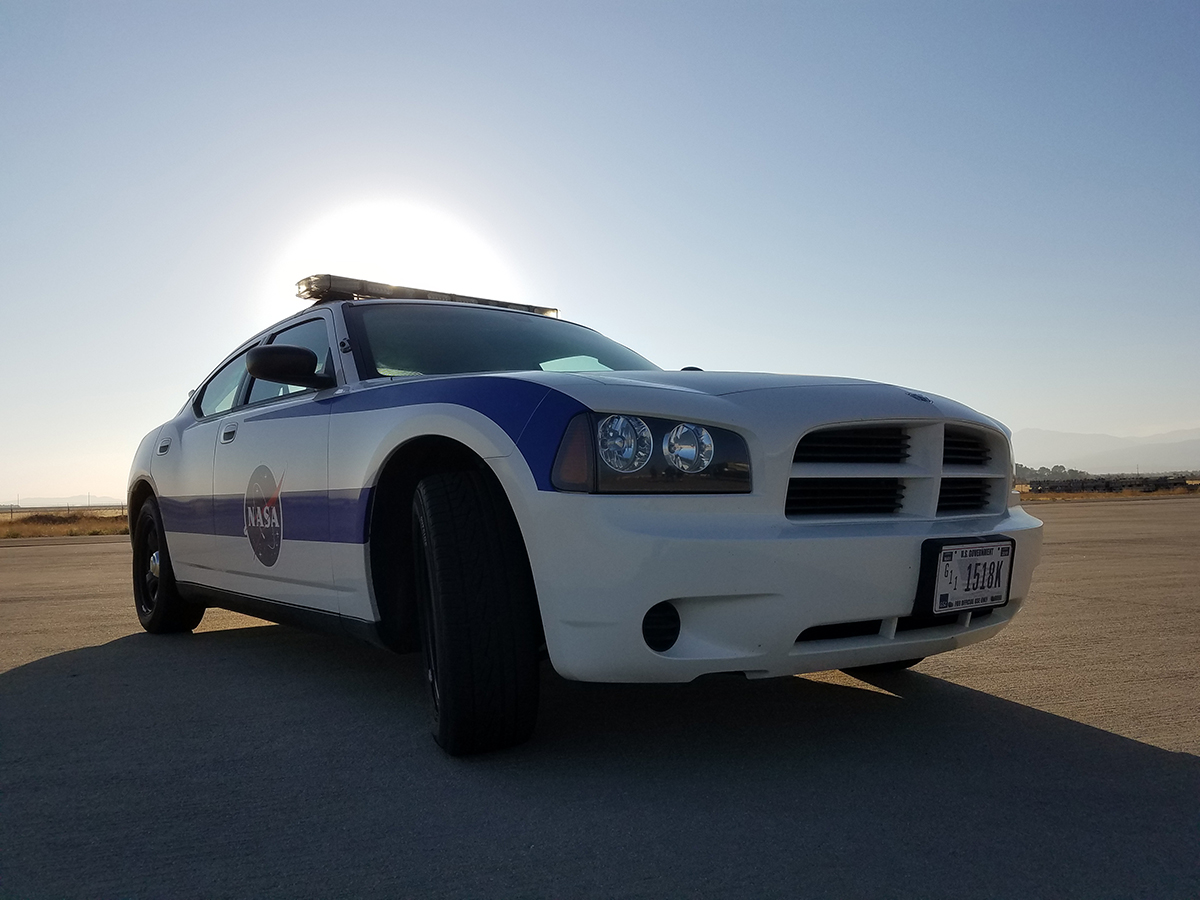
ER-2 flight tracks for the ACEPOL field campaign. NASA's high altitude, Lockheed ER-2 Earth resources aircraft are based at the Armstrong Flight Research Center on Edwards AFB. Credit: ACEPOL
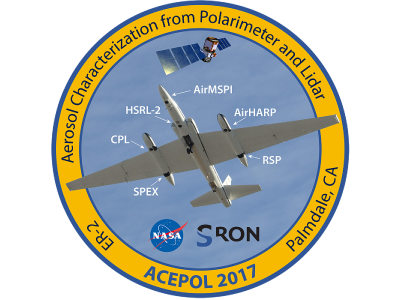
ACEPOL was launched in late 2017 to acquire data with advanced active and passive remote sensors. The data will be used to develop and assess algorithms for retrieving profiles of aerosol optical and microphysical properties. Credit: ACEPOL
ACEPOL Field Campaign VIEW ALL »

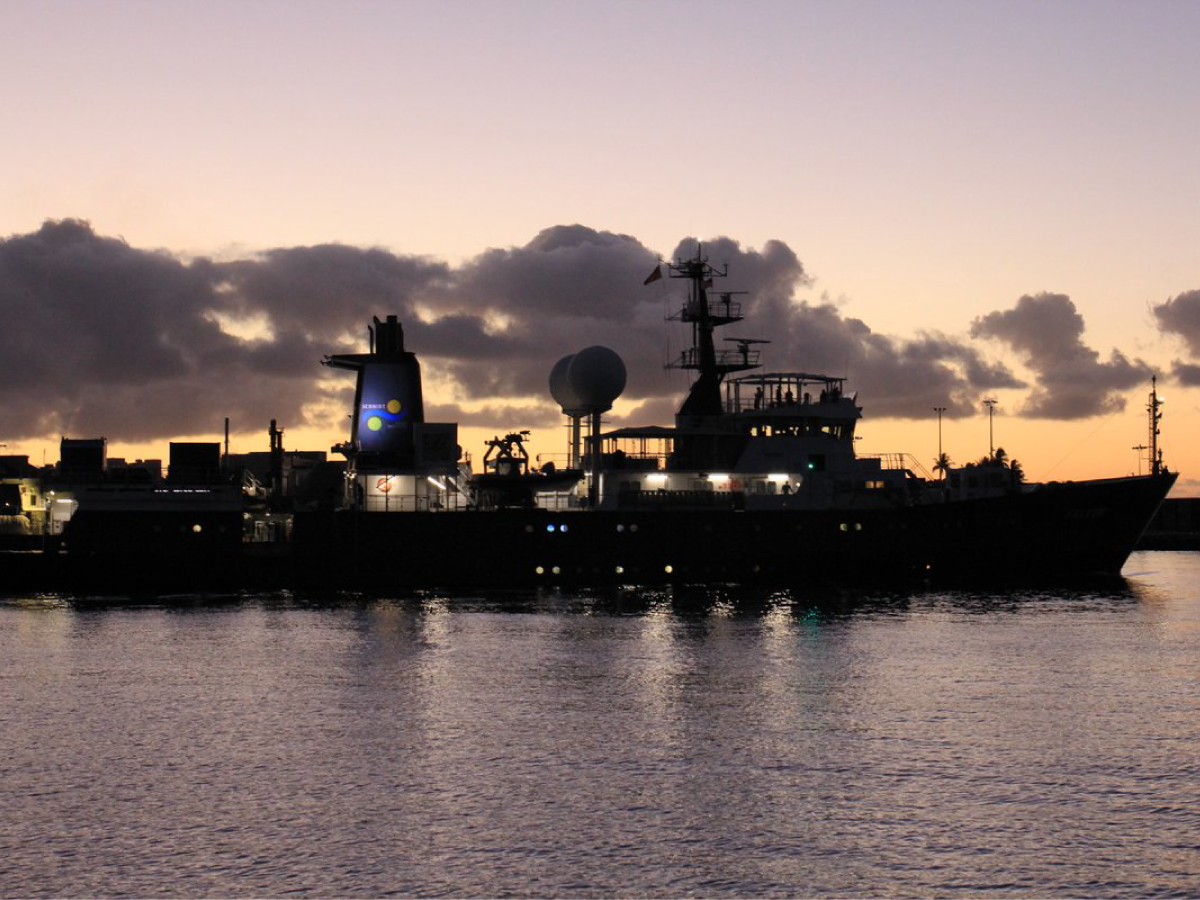
A view of the R/V Falkor at sunset. Credit: SOI
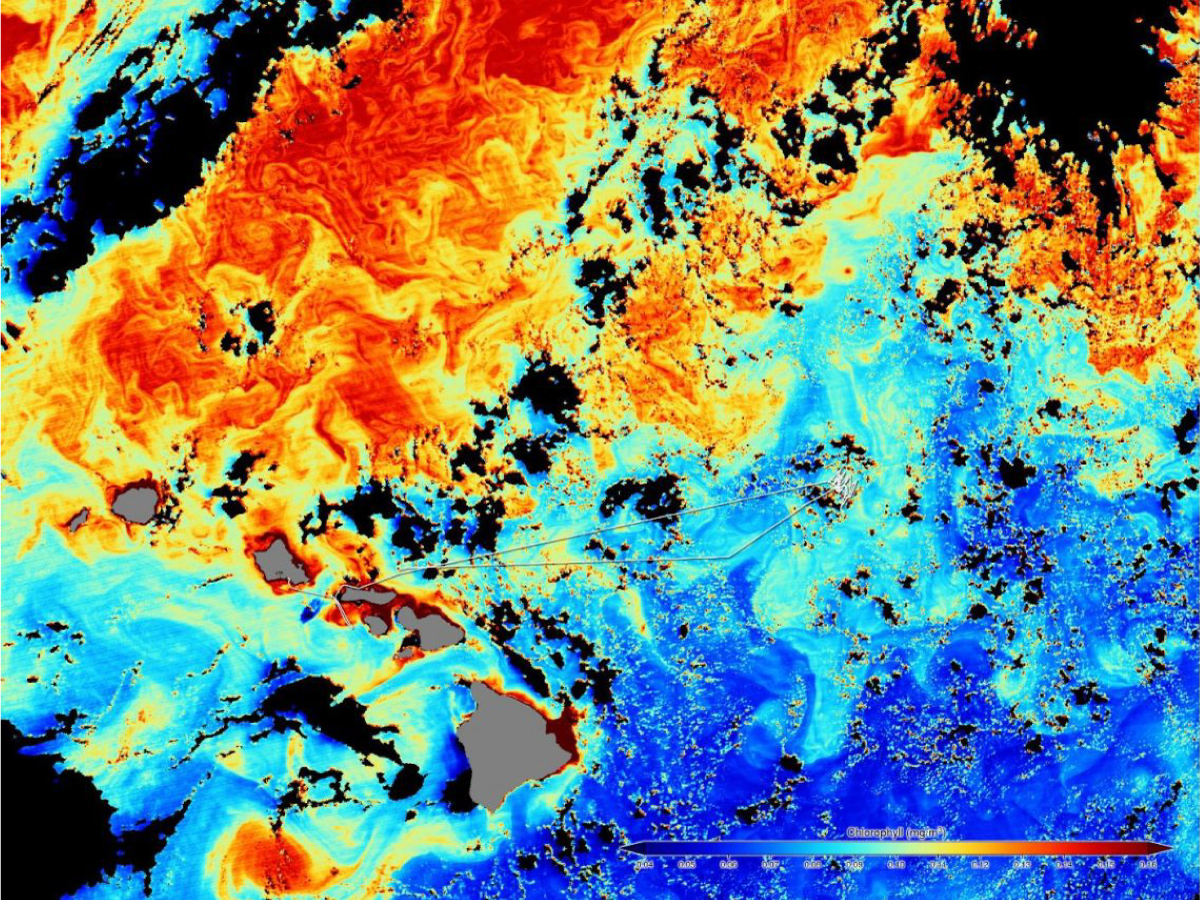
A satellite image shows the cruise track against a background of ocean color data. Colors indicate the amount of chlorophyll, where red is the highest and blue the is lowest. Credit: Norman Kuring (NASA)
Noah Walcutt (URI) inspects mangled sediment traps recovered from the first sampling site. Shark damage was later confirmed. Credit: Melissa Omand (URI)
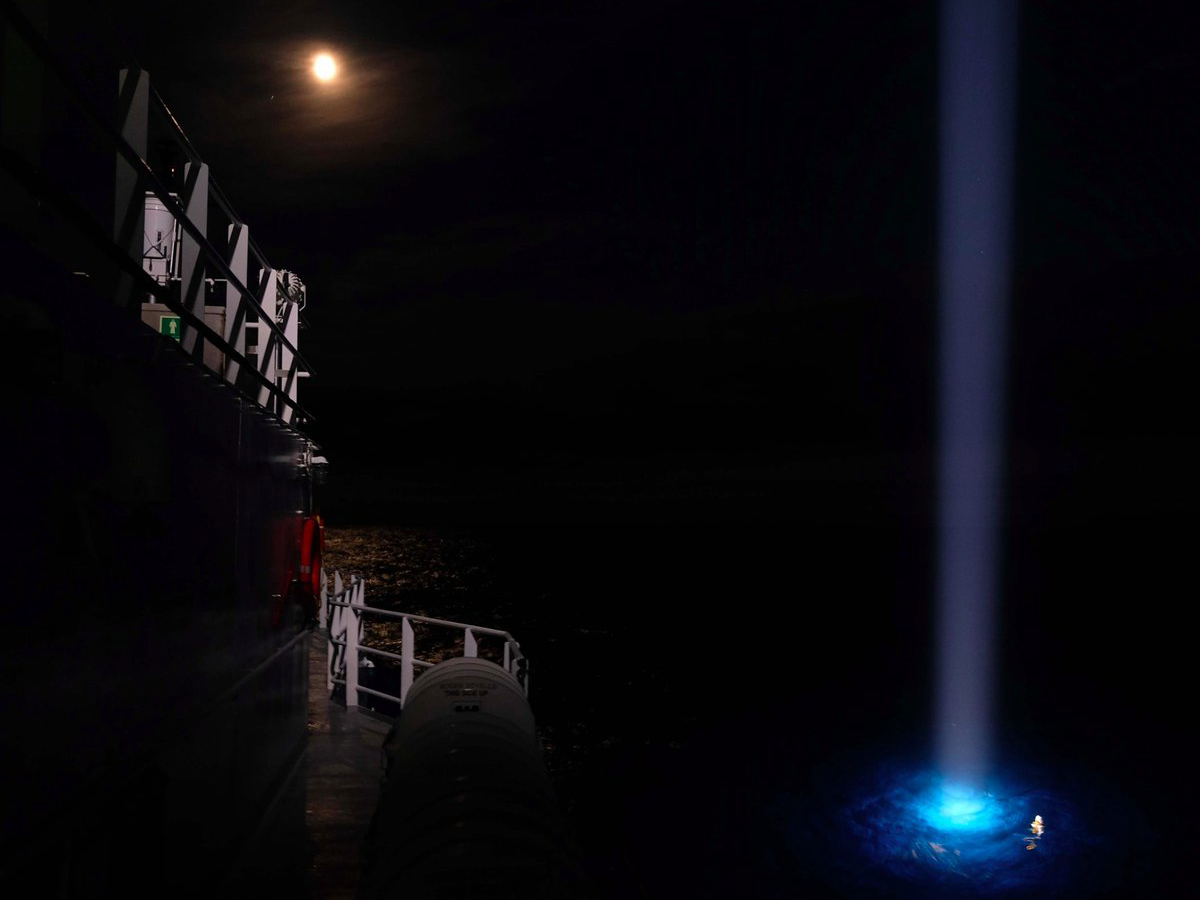
A rosette is recovered at night. Credit: NASA GSFC
Philipp Guenther retrieves sediment traps in heavy seas. Credit: Stephanie Schollaert Uz (NASA)
Working on the ocean presents many challenges, including the threat of rough seas, inclement weather, nosy vertebrates, and round-the-clock sampling. Credit: NASA GSFC
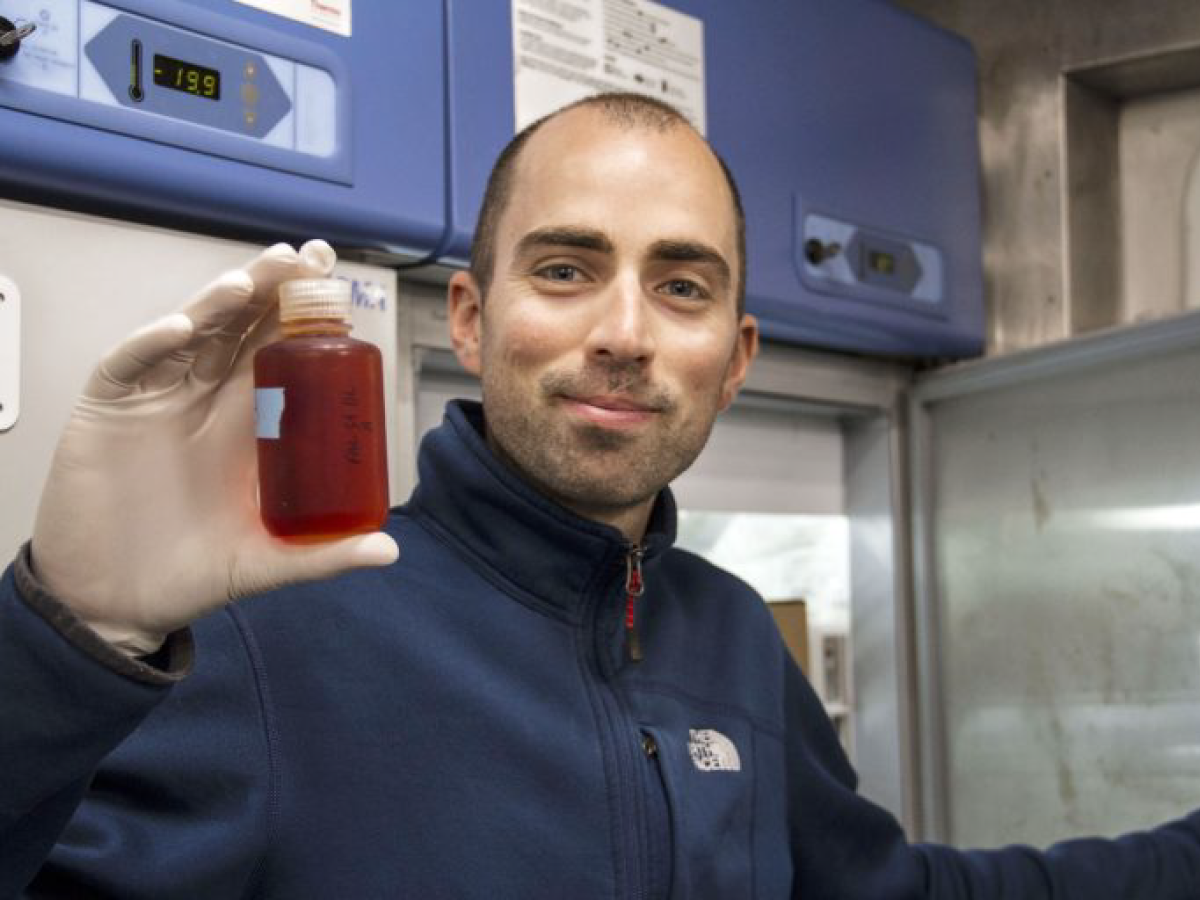
Nitrogen is a key nutrient at the very base of the food chain, and its availability directly impacts the global marine ecosystem. Biogeochemical Oceanographer Hugo Berthelot samples different geographical locations under varying weather conditions as part of his research on the nitrogen cycle. Credit: Schmidt Ocean Institute
Dr. Mannino measures biological process rates. Credit: Schmidt Ocean Institute
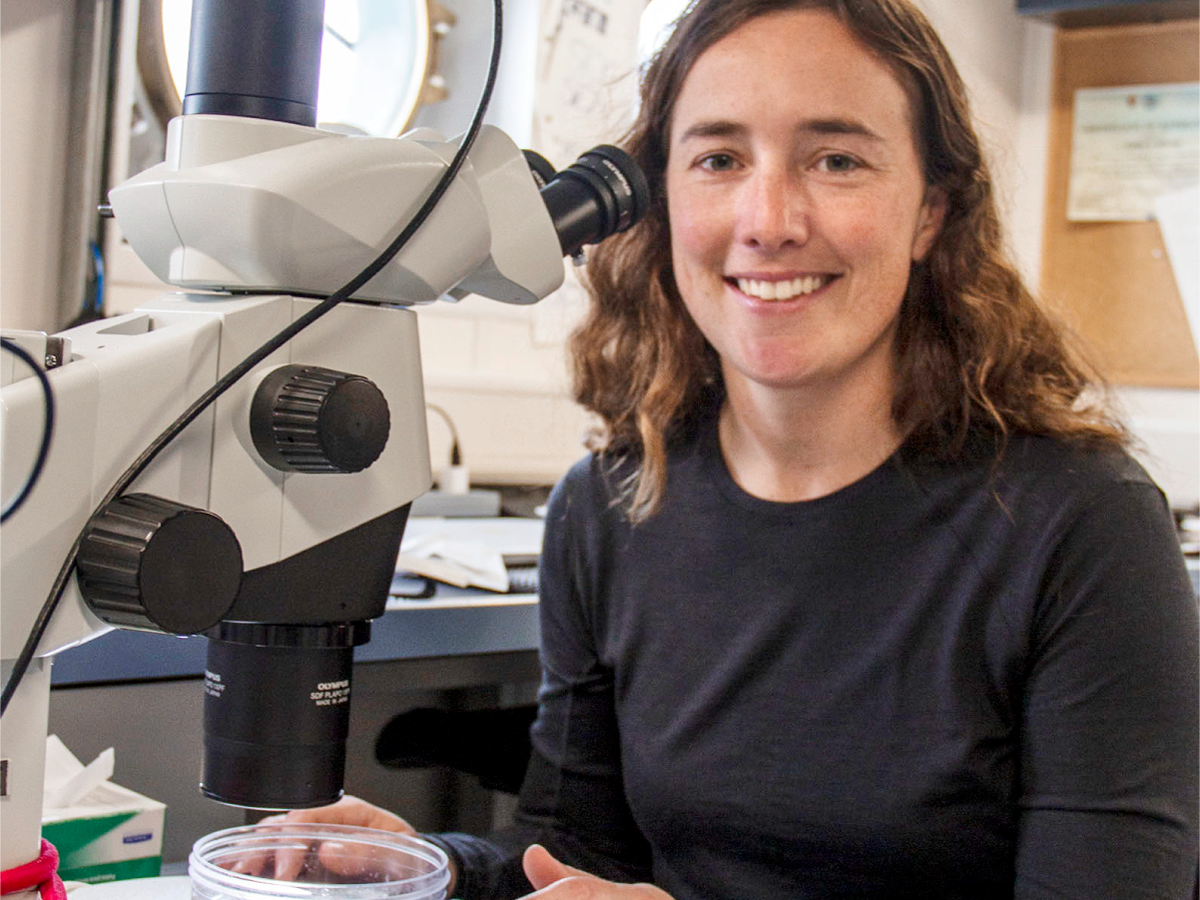
Oceanographyer Colleen Durking studies particle size and distribution. Credit: Schmidt Ocean Institute/Monika Naranjo Gonzalez
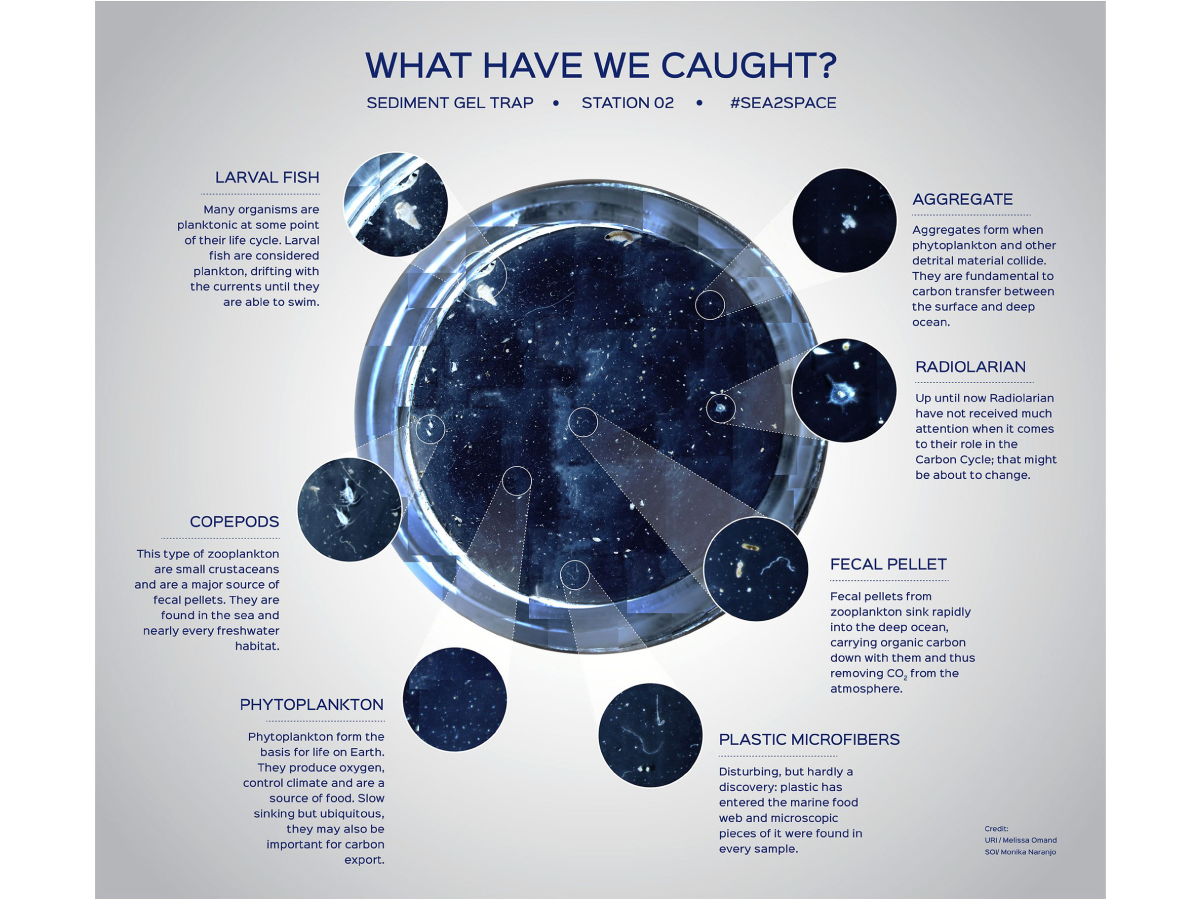
Composite image of the contents of one sediment gel trap created from a series of photographs taken with a microscope. Credit: SOI
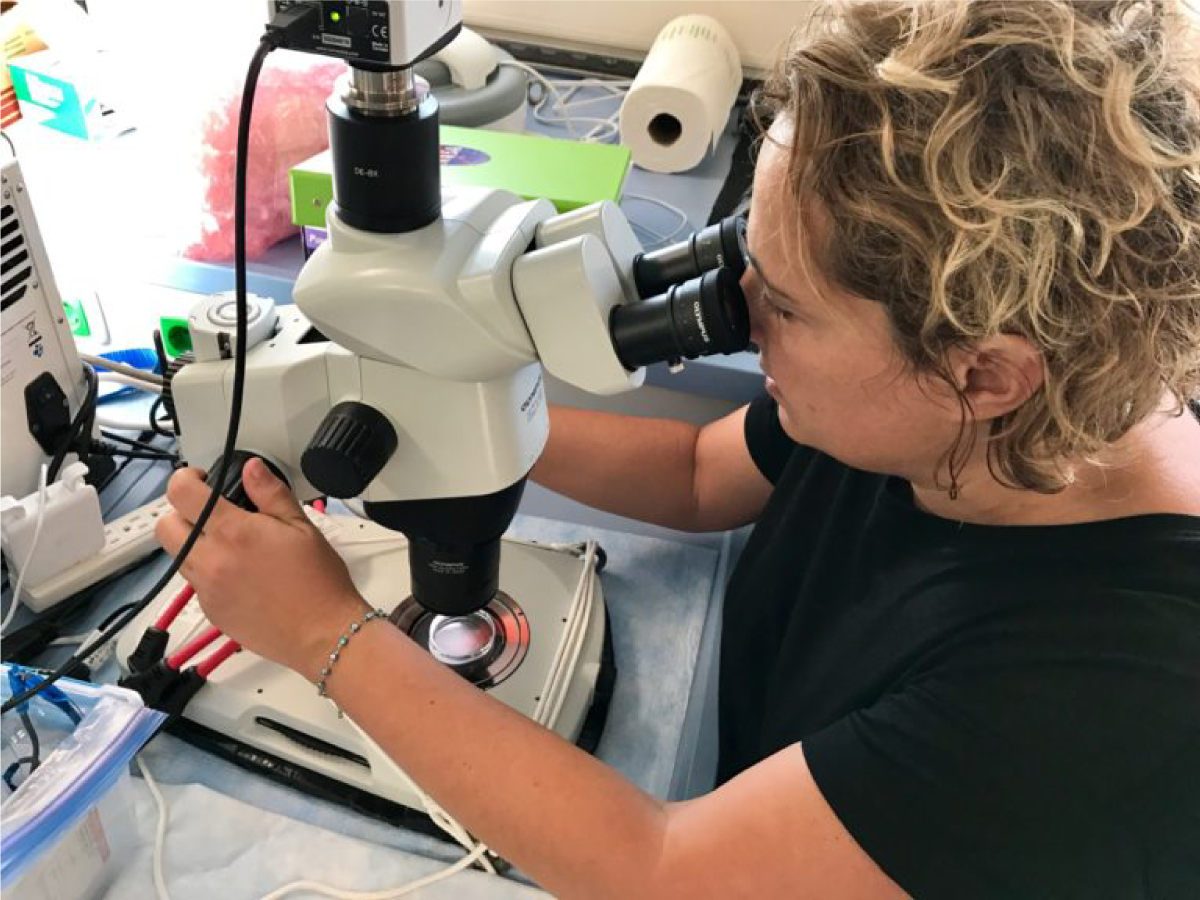
Zrinka Ljubesic (University of Zagreb) uses a microscope to identify phytoplankton and zooplankton in seawater samples. Credit: Stephanie Schollaert Uz (NASA)
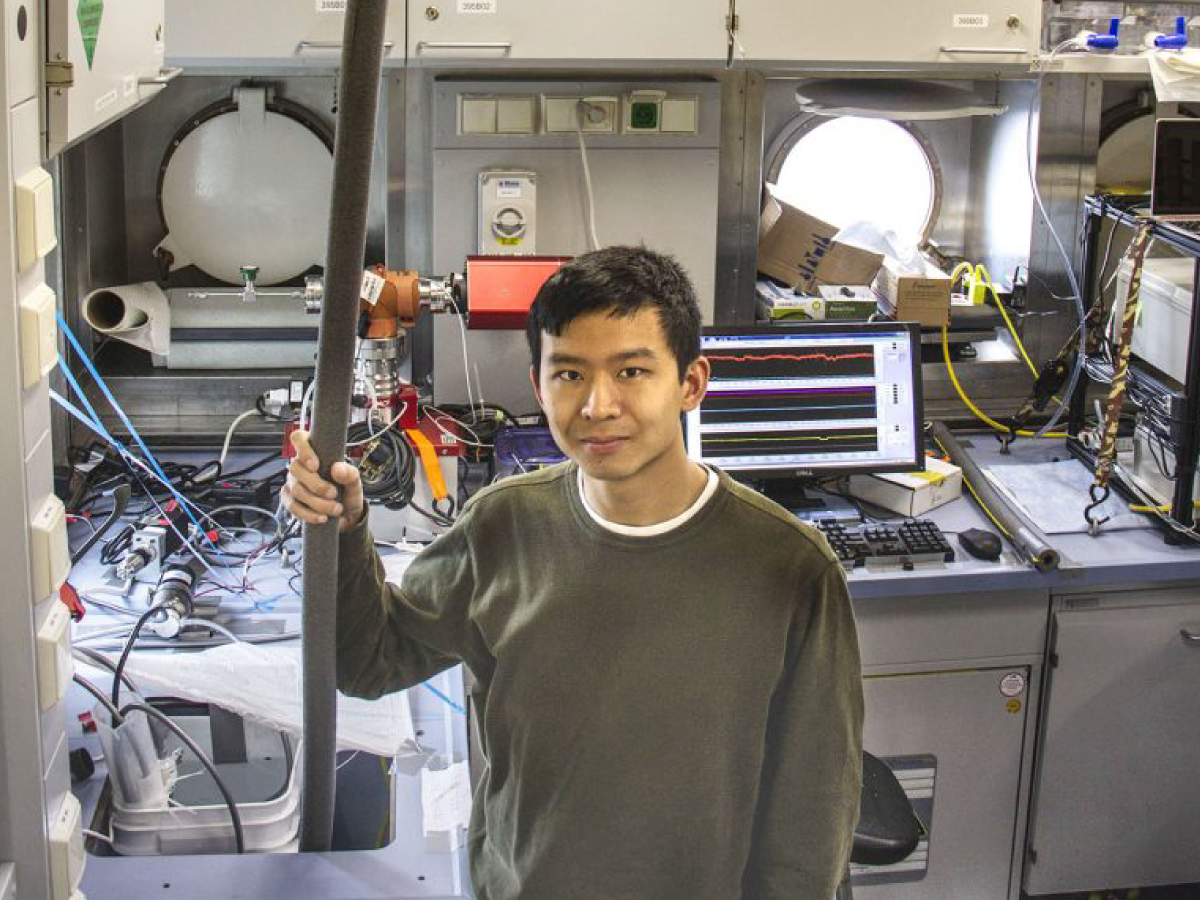
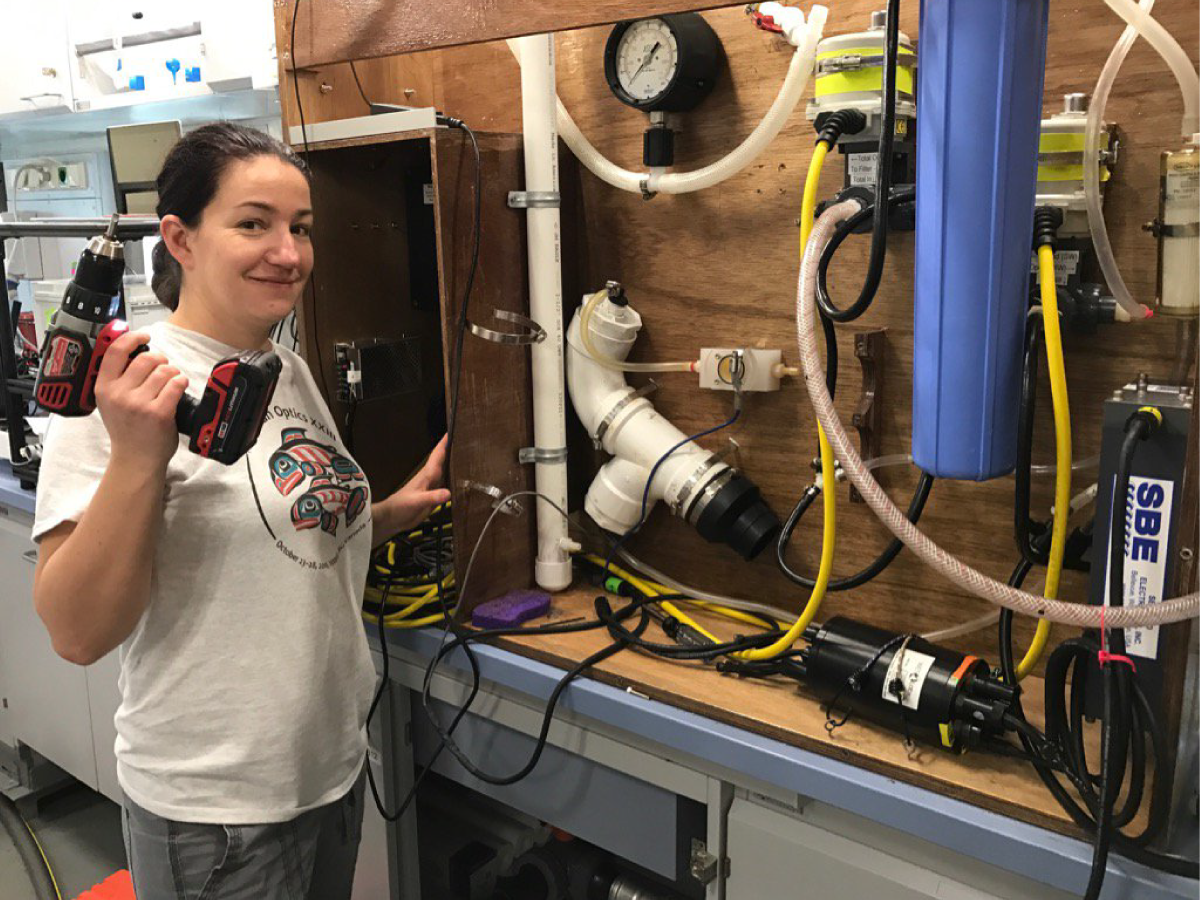
The R/V Falkor contains wet and dry laboratory space, a control room for sonar and ROV operations, and offices. Here, Seaver Wang supplies water to a mass spectrometer in the Wet Lab. Credit: Monika Naranjo Gonzalez (SOI)
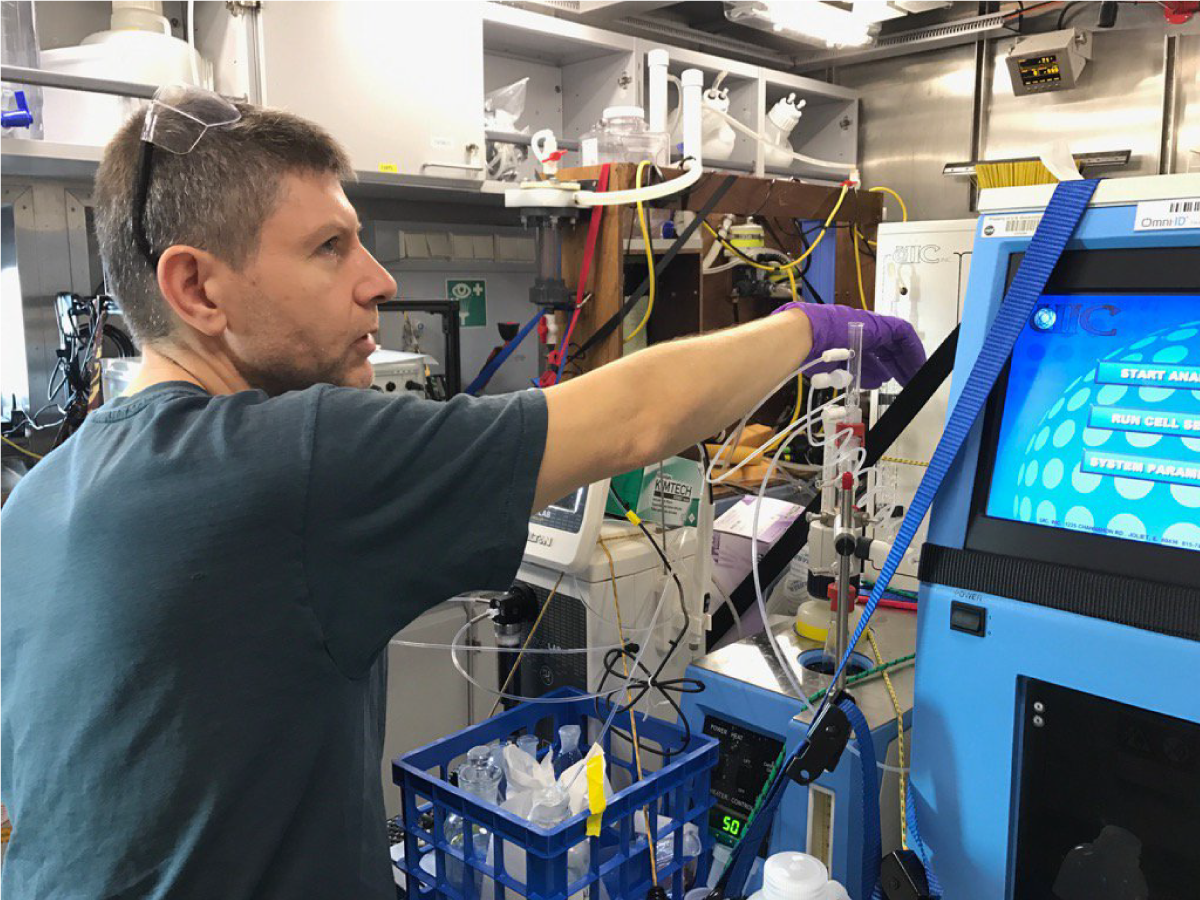
Dr. Antonio Mannino installs a Coulometer in the on-board wet lab to measure particle productivity in water samples. Credit: Monika Naranjo Gonzalez (SOI)
Designed to simulate naturally available light at different times and depth, the electro-squid 4000 experimental photosynthetron measures the biological activity and composition of microscopic plankton and the optical properties of seawater. Credit: Schmidt Ocean Institute/Ryan Vandermeulen
Phytoplankton are incubated in a one-of-a-kind photosynthetron, an incubation chamber used to study and measure the balance of phytoplankton oxygen/carbon exchange. Credit: Schmidt Ocean Institute/ Ryan Vandermeulen
Water is fed through the FlowCam at a specific magnification wherein a camera is triggered to take a digital image of each particle that passes by the field of view. Credit: Schmidt Ocean Institute/Aimee Neeley
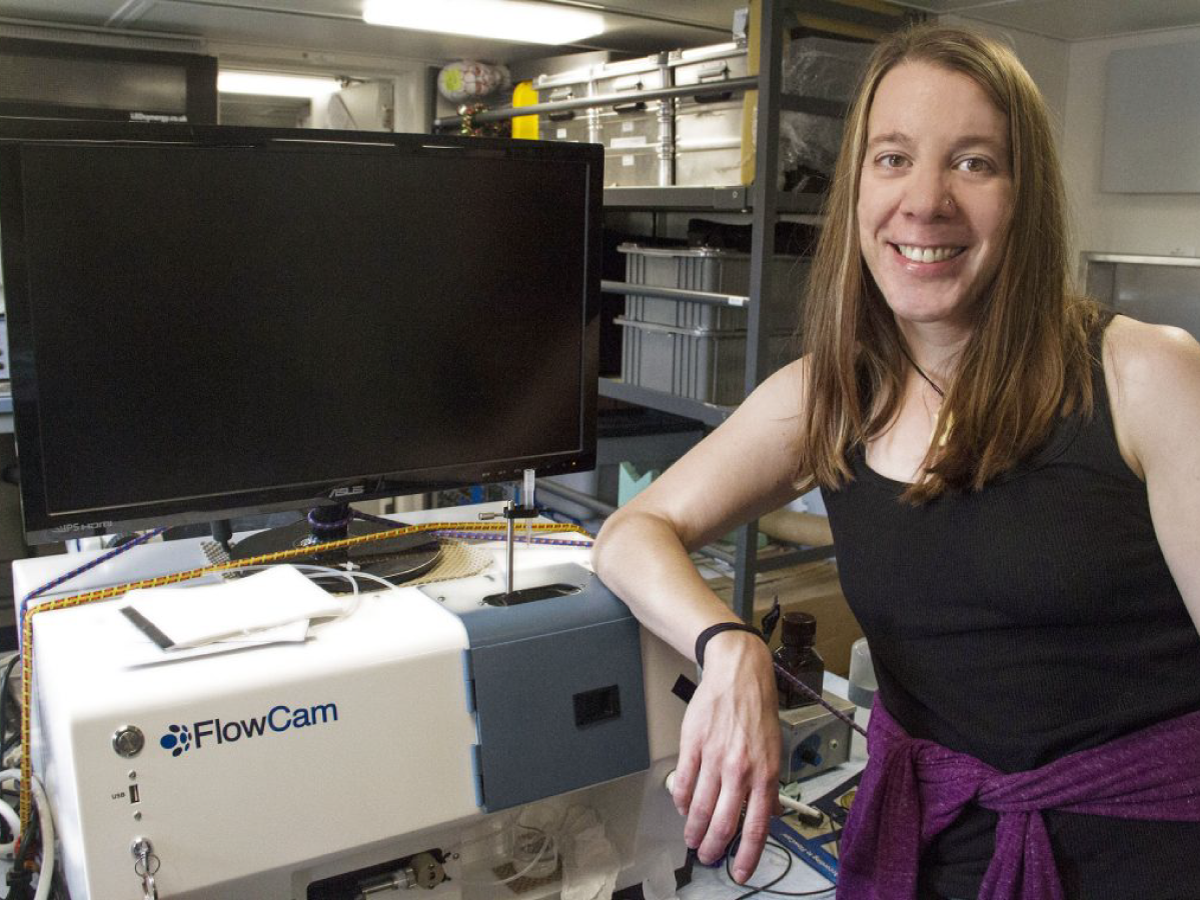
Biological Oceanographer Aimee Neely uses a FlowCam to study particles suspended in seawater. The FlowCam combines the functionality of an imaging flow cytometer and a microscope in a single, powerful tool. Credit: Schmidt Ocean Institute/Monica Naranjo Gonzalez
High-resolution images of suspended particles are captured with an Imaging FlowCytobot (IFCB). The IFCB - an in-situ, automated submersible, uses a combination of flow cytometric and video technology to generate 30,000 images per hour. Credit: Schmidt Ocean Institute/Ivona Cetinic
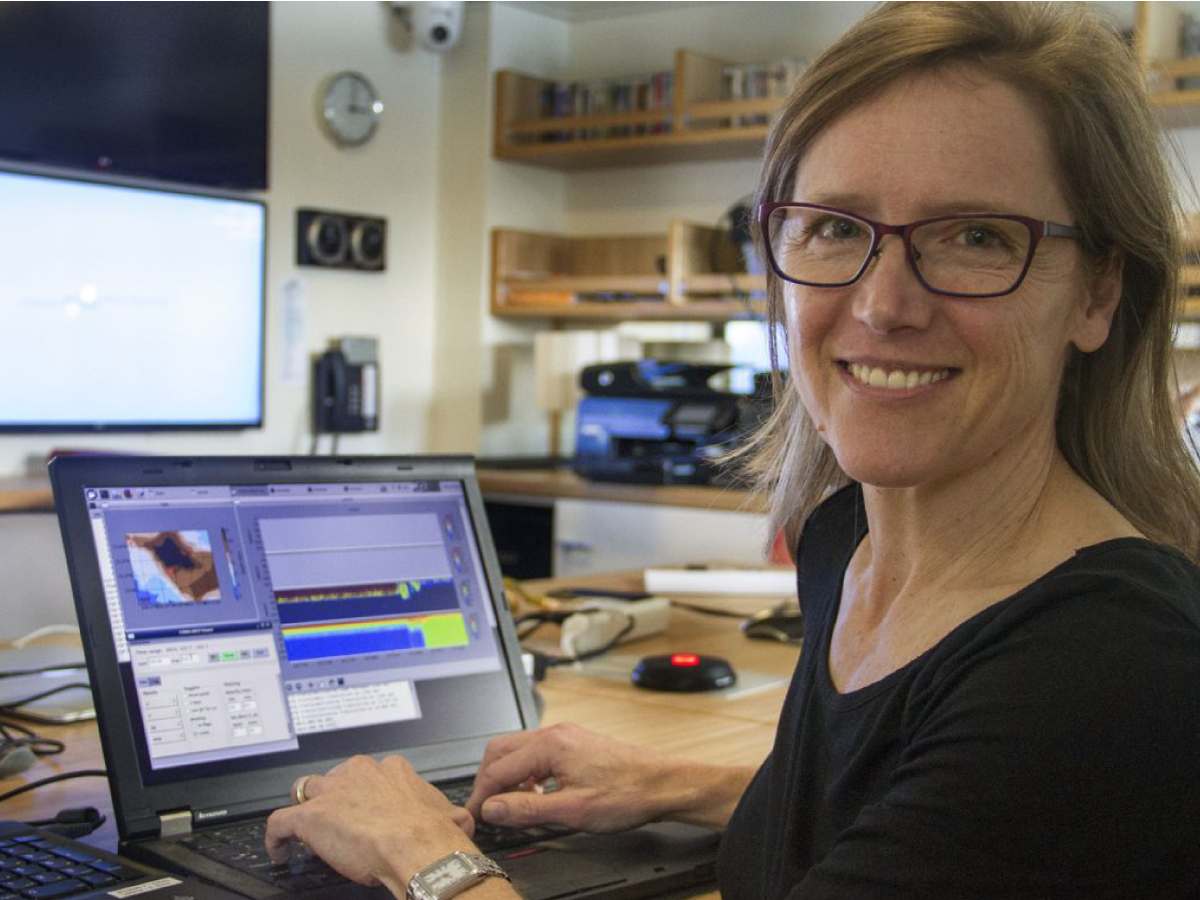
Stephanie Schollaert Uz monitors the speed and direction of water flowing under the ship with an Acoustic Doppler Current Profiler (ADCP). Credit: SOI
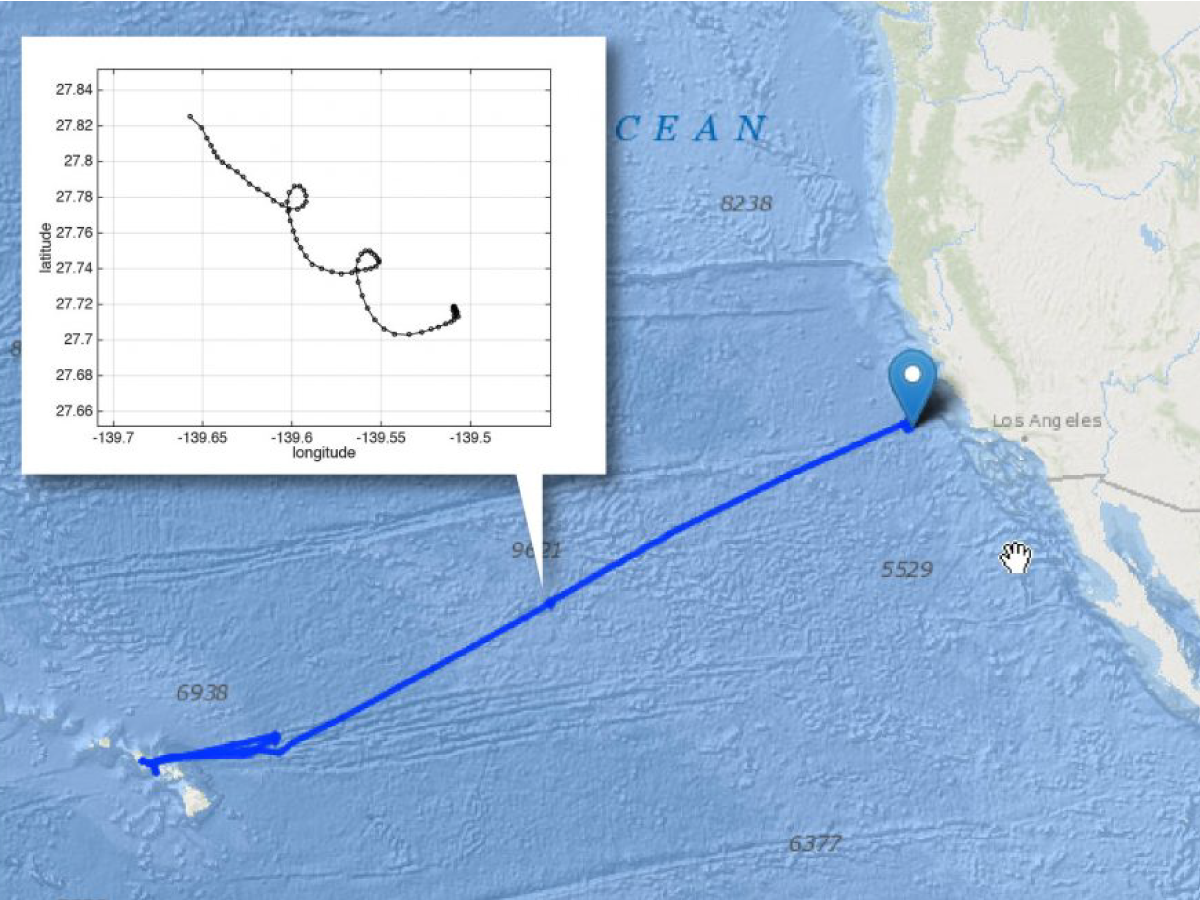
A plot of the Wirewalker's track as it drifted freely for three days. Credit: SOI
The Wirewalker is a vertical profiling instrument package propelled by ocean waves. When attached to a cable, the motion of ocean waves "walks" the Wirewalker to the bottom as it takes continuous samples in the water column. Credit: SOI
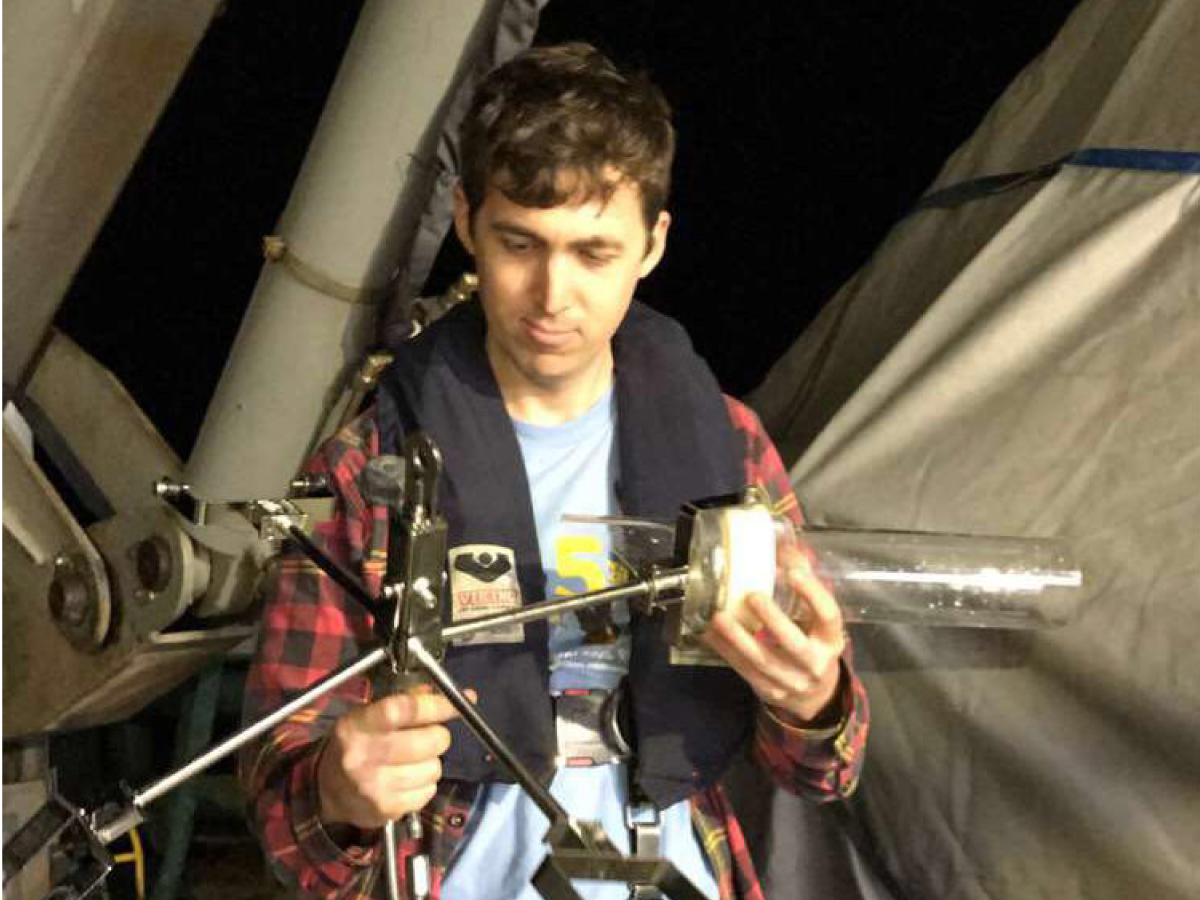
Chief Officer Philipp Guenther assembles a Wirewalker, an autonomous platform used to collect high frequency data. Credit: SOI
A neutrally buoyant sediment trap (NBST) is deployed off the R/V Falkor. Credit: SOI
An aluminum block below one trap holds an iPhone camera programmed for time-lapse image collection. The images will be used for holographic research in collaboration with Brown University. Credit: SOI
Melissa Omand, Colleen Durkin, Phillipp Guenther and Ben Knorlein prepare a sediment trap for deployment. Credit: SOI
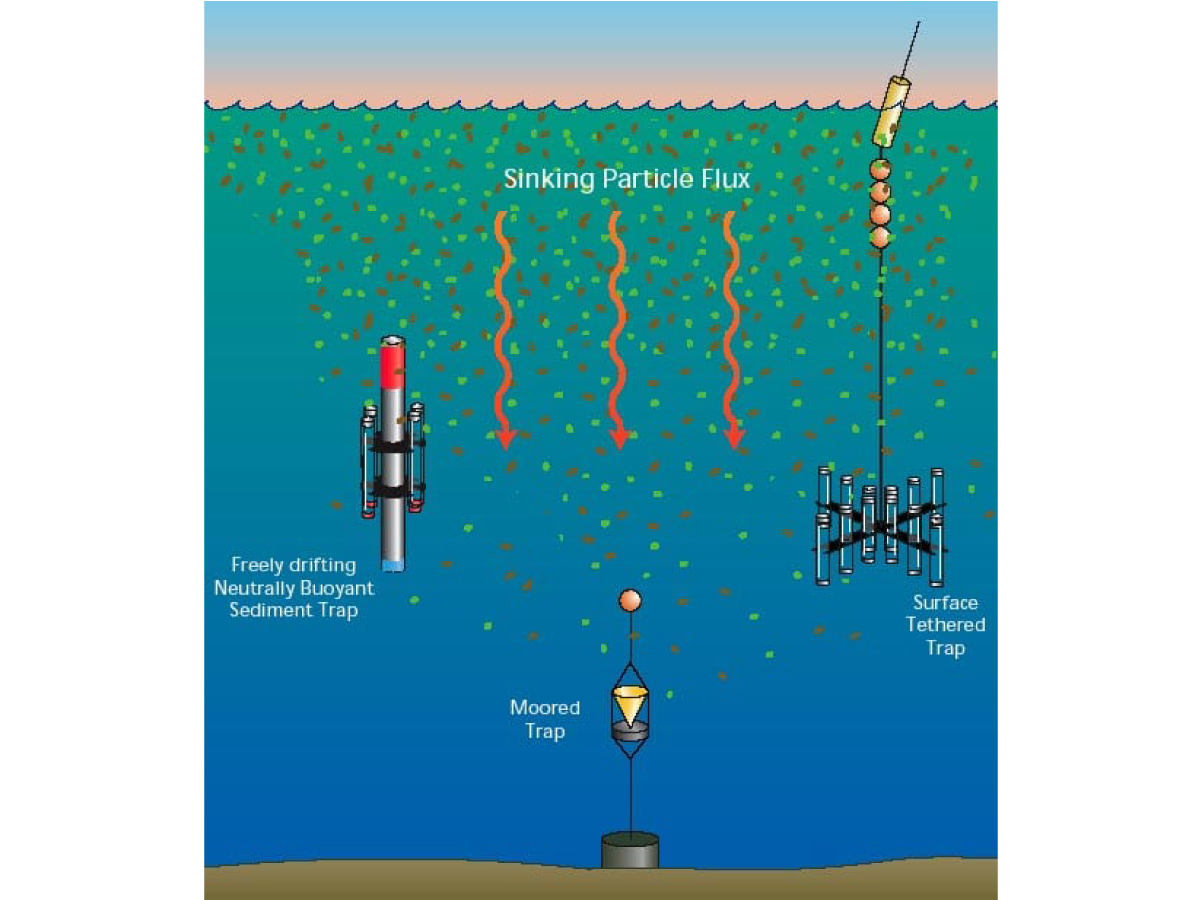
Sediment traps collect particles falling toward the sea floor. These particles - marine snow - are made up of organic matter, dead sea creatures, tiny shells, dust, and minerals. Credit: WHOI
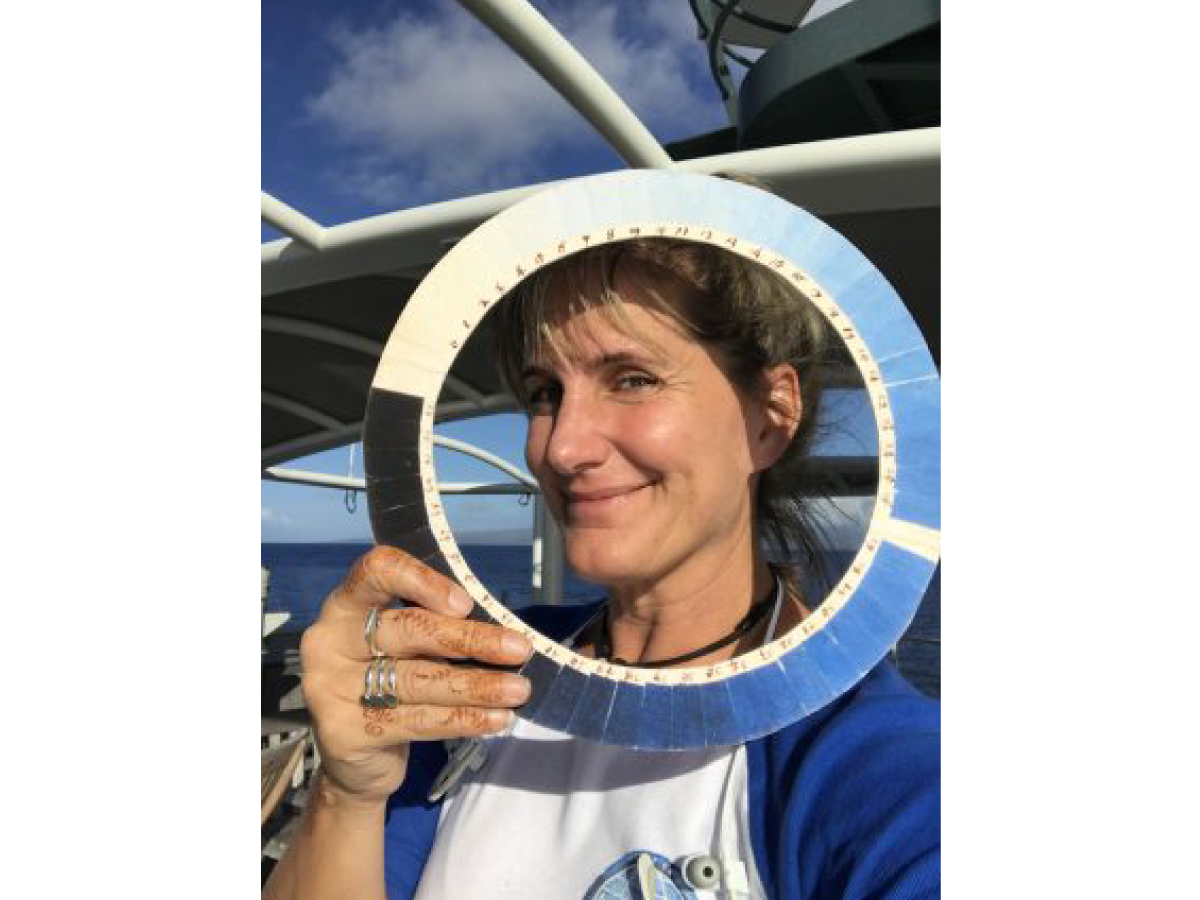
Artist at Sea Kirsten Carlson poses with a replica of a cyanometer, a tool used to measure 'blueness', or the color intensity of blue sky. Credit: Schmidt Ocean Institute
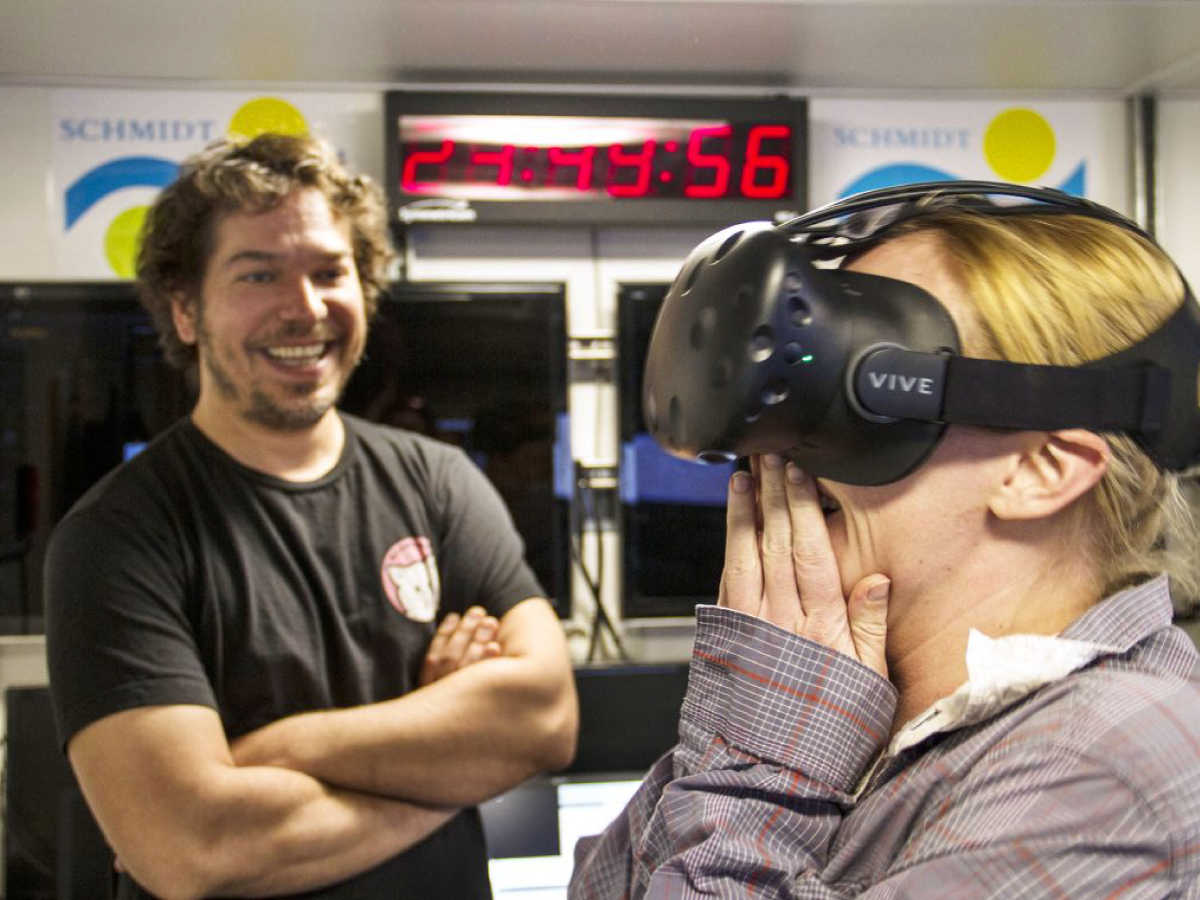
Melissa Omand reacts to the first virtual reality experience created on board R/V Falkor: holographic images of plankton suspended in the water. Credit: SOI
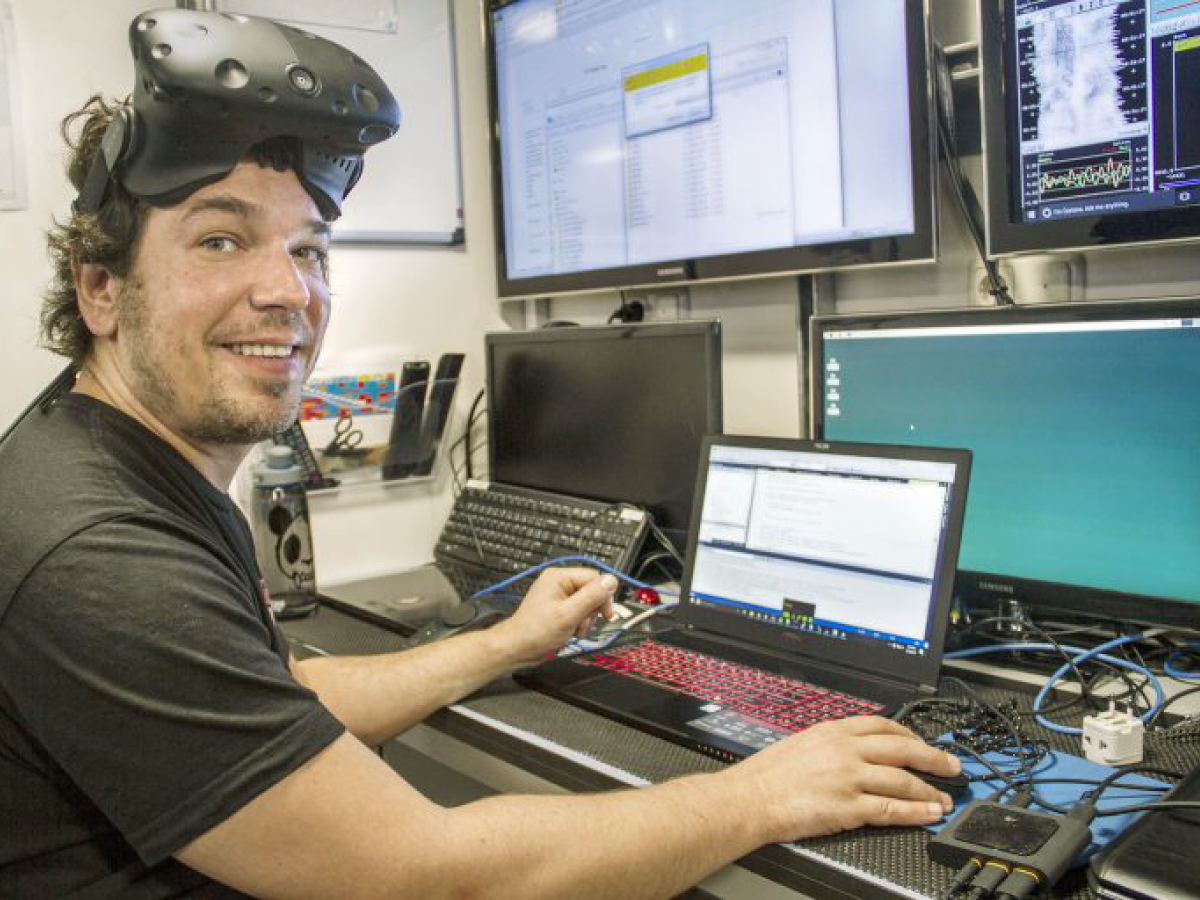
Computer Scientist Benjamin Knorlein (Brown University) integrates virtual reality with a digital holographic microscope to present an up-close look at plankton in a view so finely detailed that the human eye can't capture it under normal observation. Credit: SOI
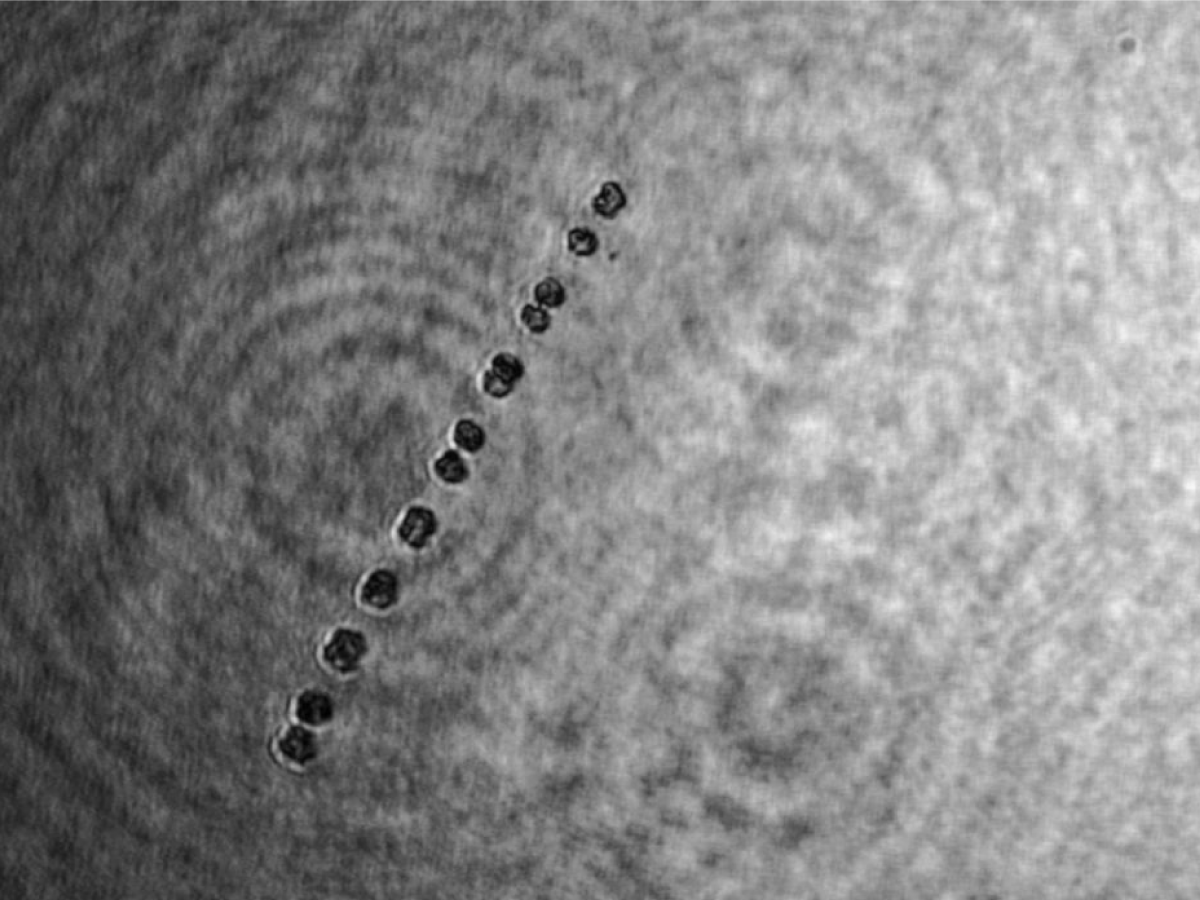
A holographic picture of a diatom chain. Credit: SOI
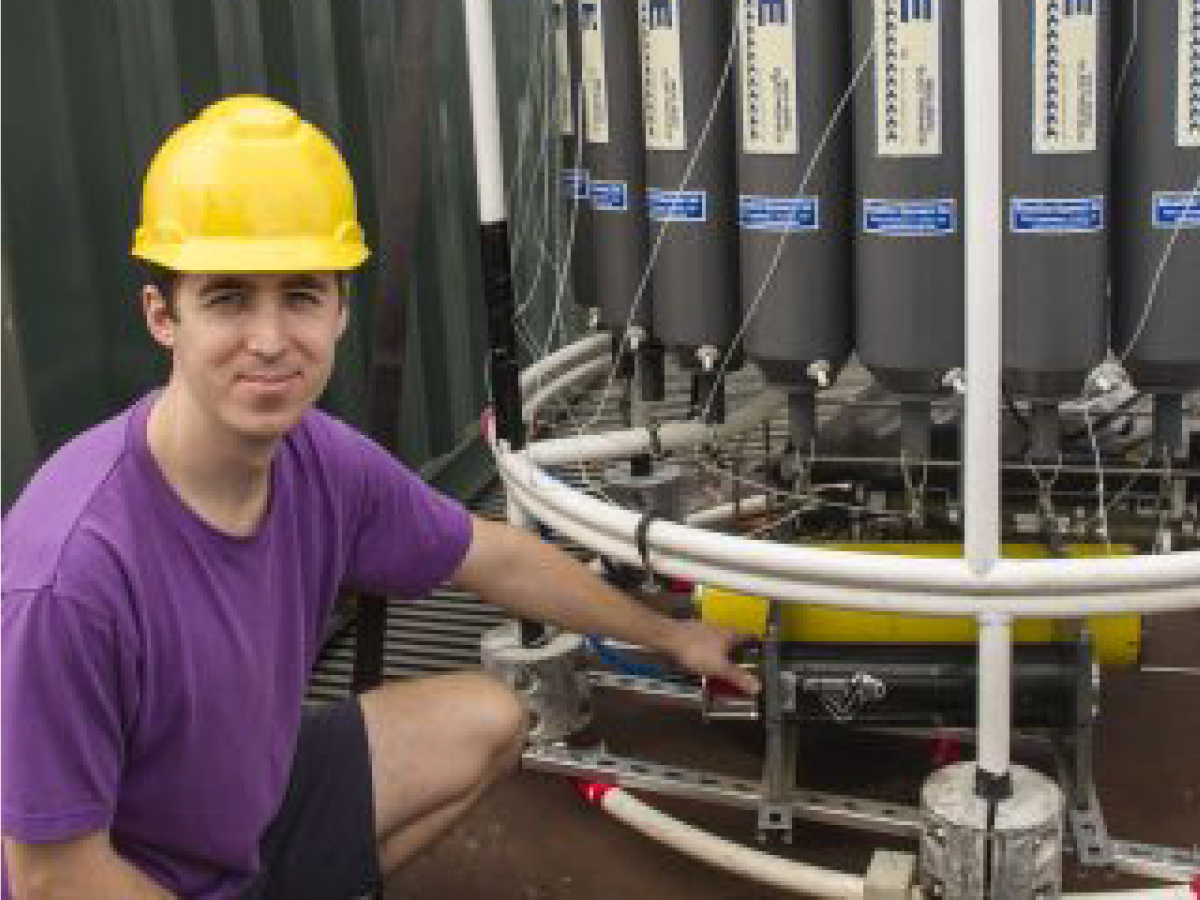
Noah Walcutt examines a holographic camera installed on a rosette. The camera can capture 40,000 images in a single deployment. Credit: SOI
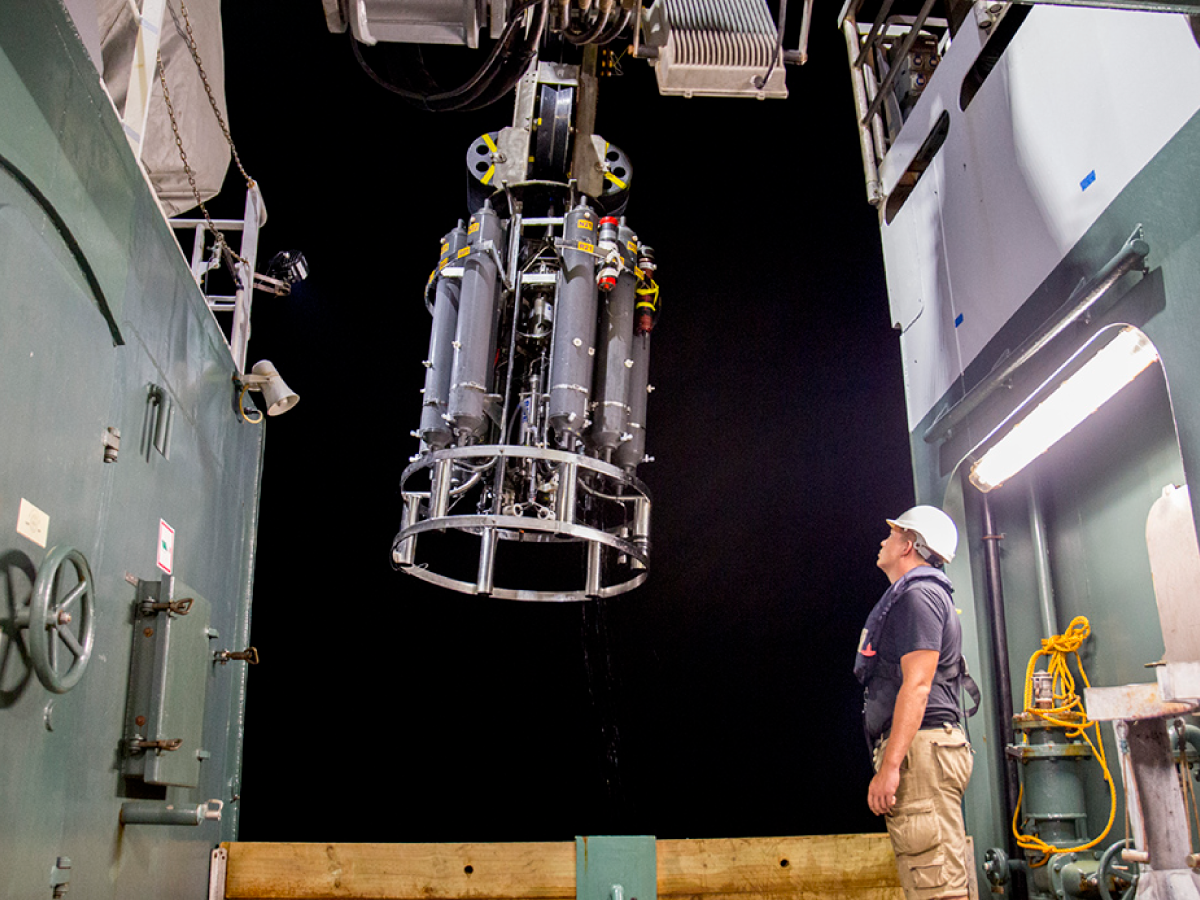
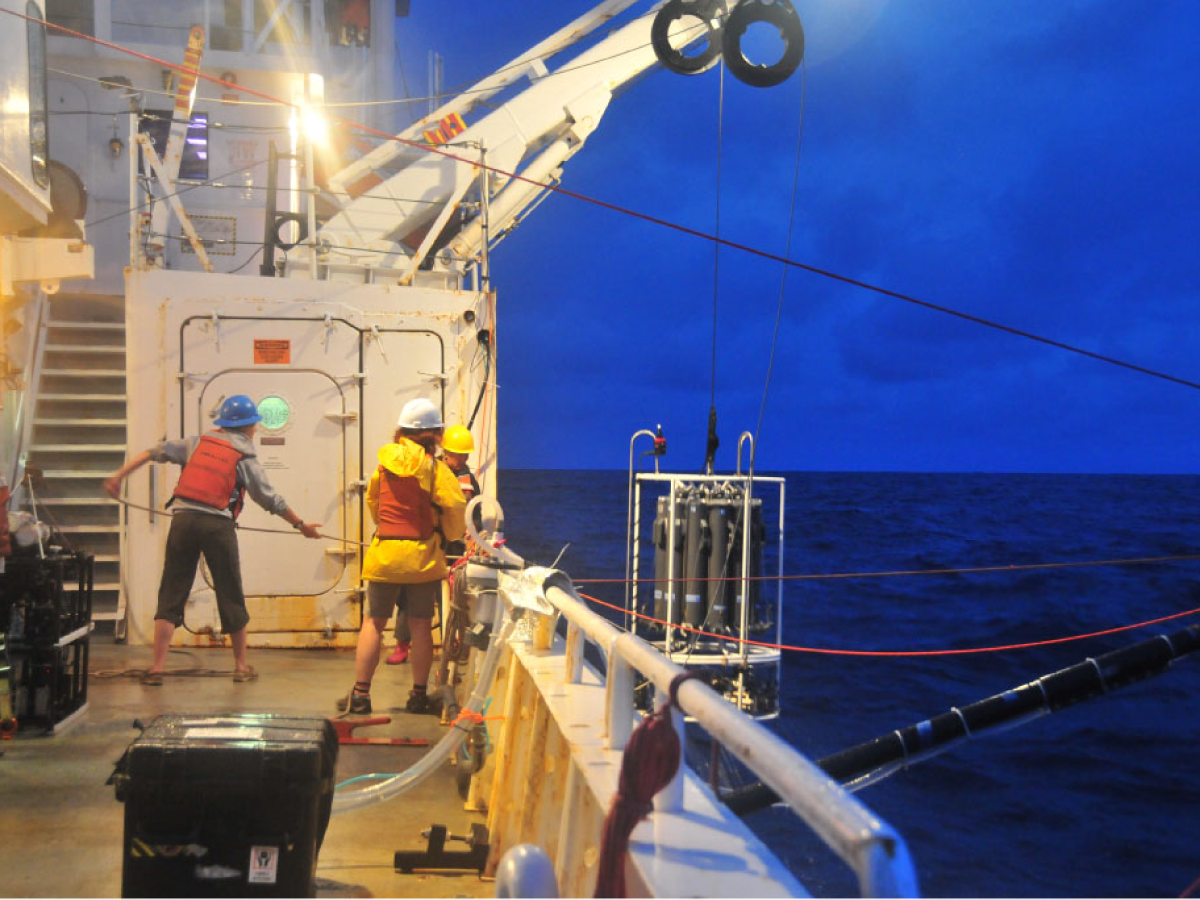
A sampling rosette carrying a CTD is deployed off the R/V Falkor at night. Credit: SOI
A CTD may be incorporated into an array of Niskin bottles (referred to as a rosette). The bottles close at predefined depths to collect discrete samples for analysis. Credit: Monika Naranjo Gonzalez (SOI)
A CTD is used to measure the conductivity, temperature, and pressure of seawater (the D stands for depth, which is closely related to pressure). CTDs generate a vertical profile of the water column from surface to bottom. Credit: Hannes Grobe
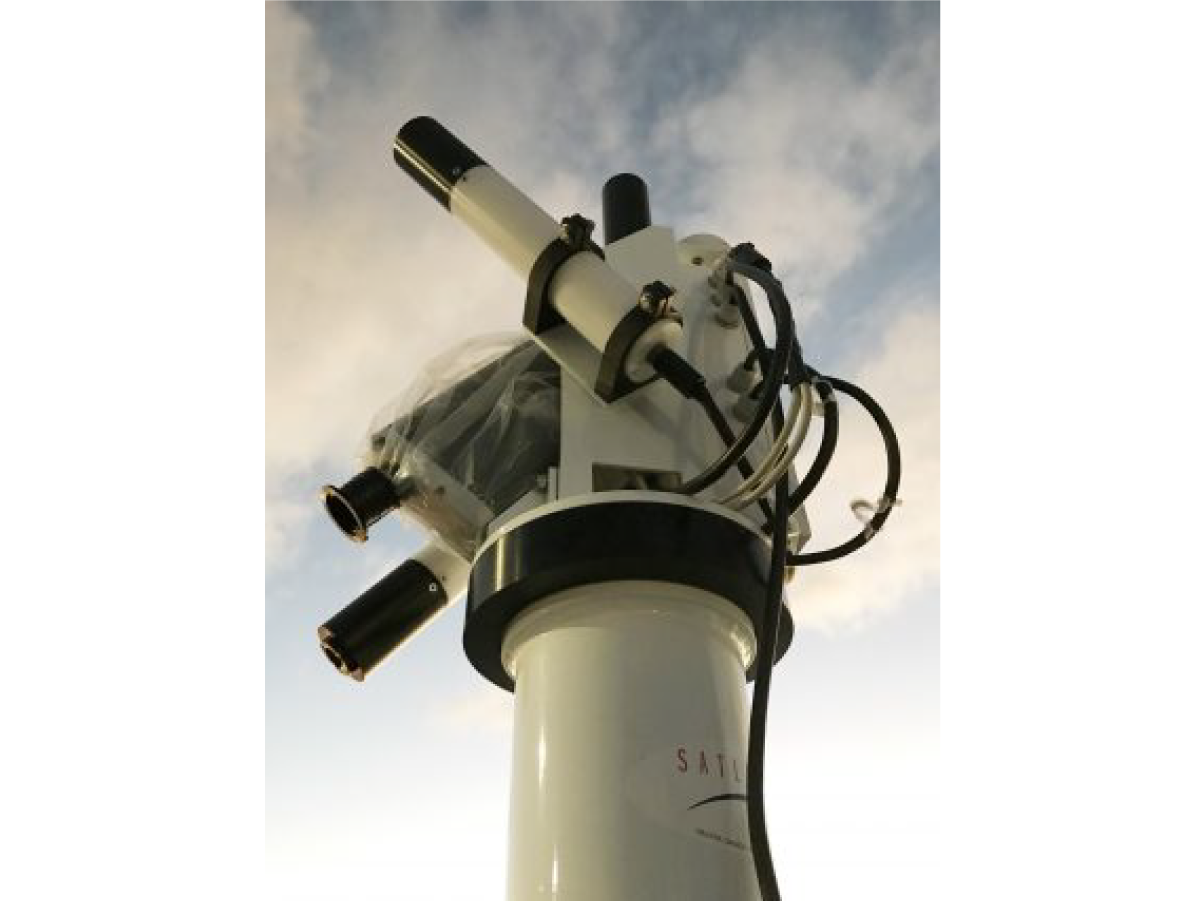
Research Oceanographer Dr. Antonio Mannino stands next to the HyperSAS radiometer. Credit: Schmidt Ocean Institute/Kirsten Carlson
The HyperPro radiometer is an in-situ, free-fall profiling unit designed to measure the apparent optical properties of the ocean. It is periodically deployed off the stern. Credit: NASA GSFC
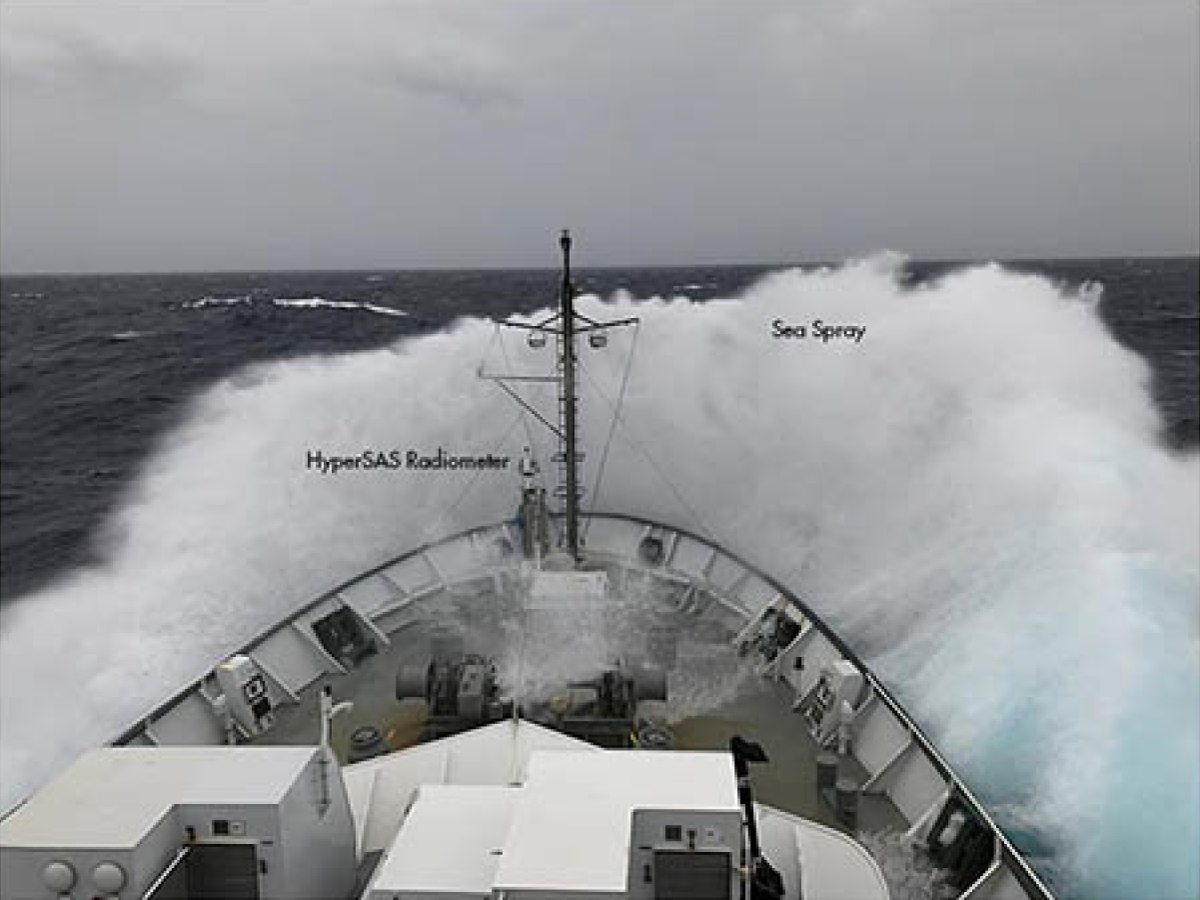
A view of the HyperSAS radiometer in the bow during rough seas. The lenses of the radiometer must be cleaned periodically because of sea spray. Credit: Kirsten Carlson (SOI)
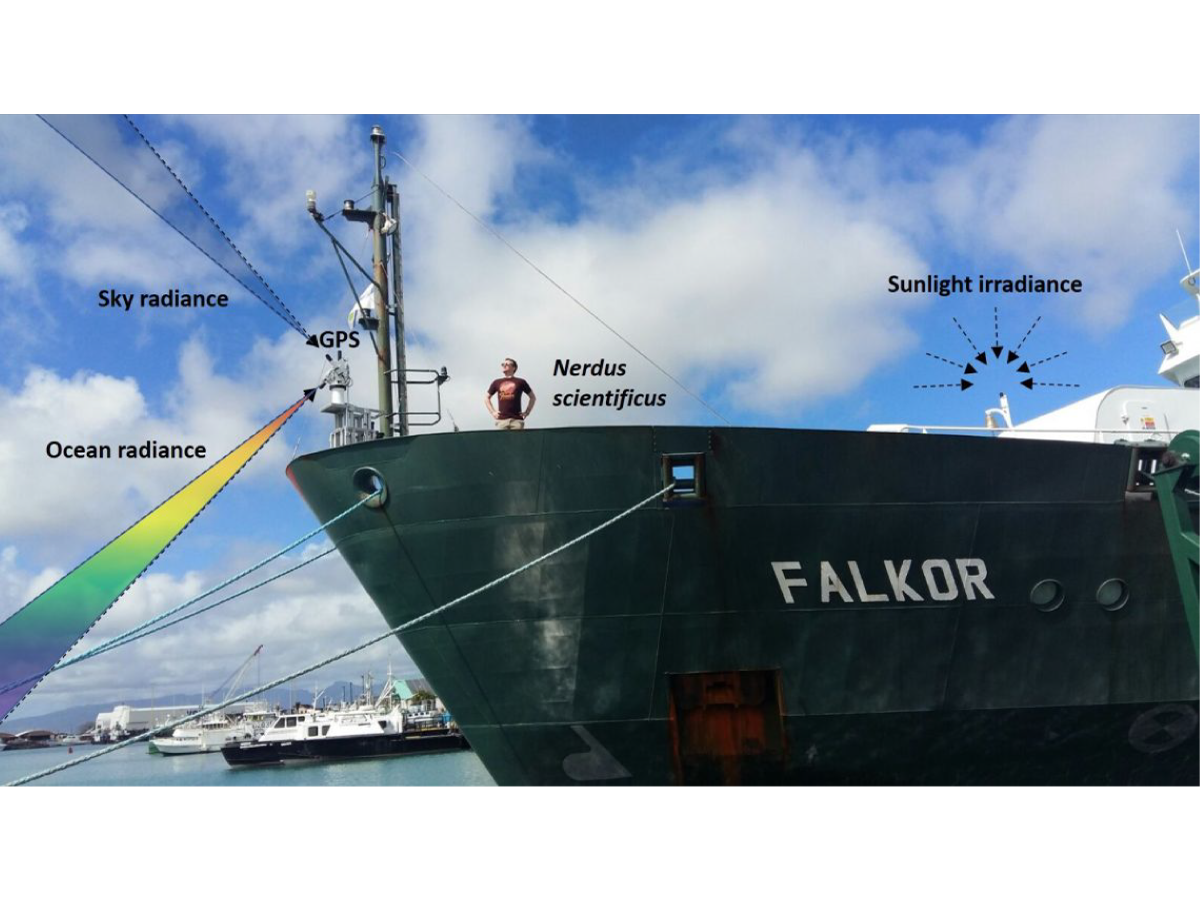
The HyperSAS radiometer, installed in the bow, continously follows the angle of the sun and measures the color of the sea through a downward looking lens, and the color of the sky through another lens pointed upward. Credit: Schmidt Ocean Institute/Ryan Vandermeulen
Radiometers observe and capture the color of sea and sky by measuring different wavelengths of light. The team will use two different radiometers on this cruise: HyperSAS and HyperPro. Credit: Schmidt Ocean Institute
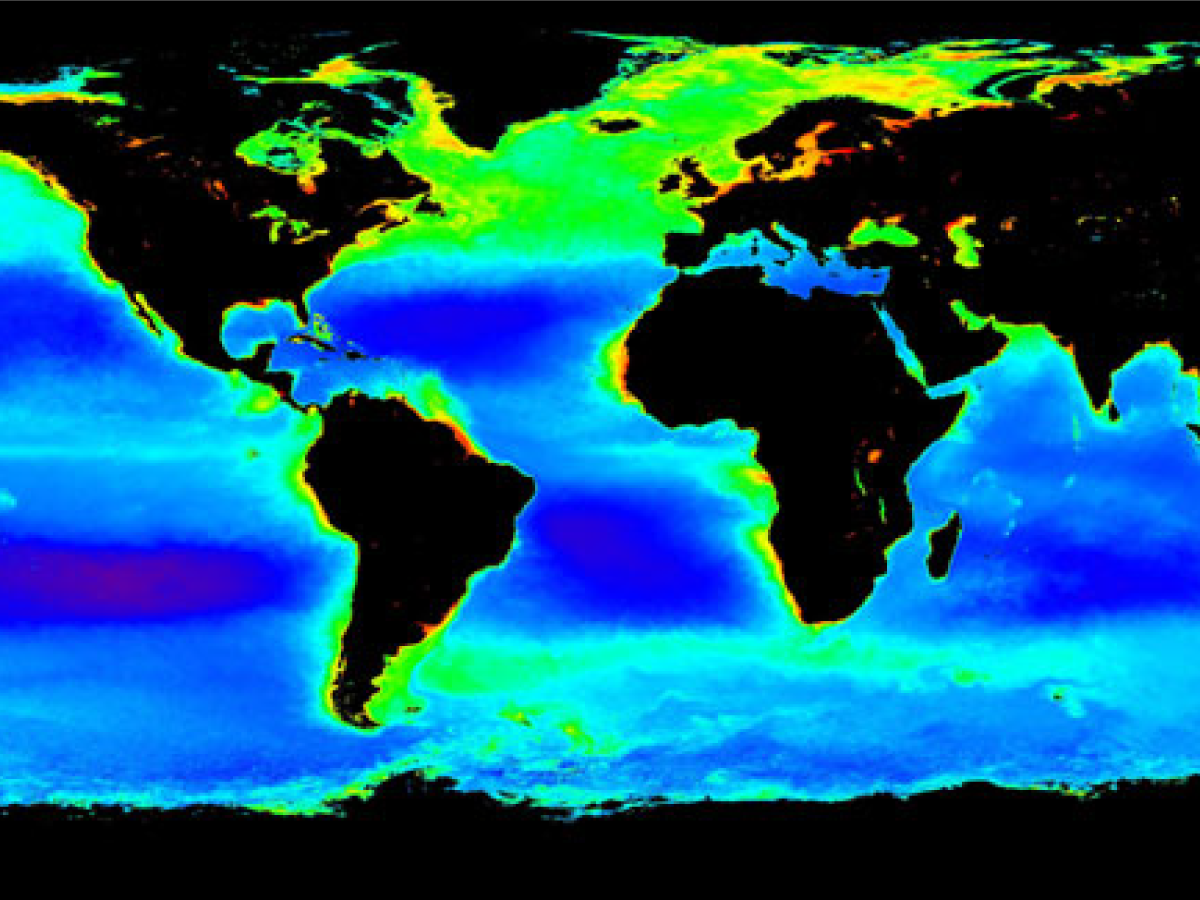
The team will use the data collected on this investigation to ground-truth satellite observations of ocean color (seen here in this composite image of average chlorophyll concentrations in Spring, 1998 to 2004. Credit: NASA
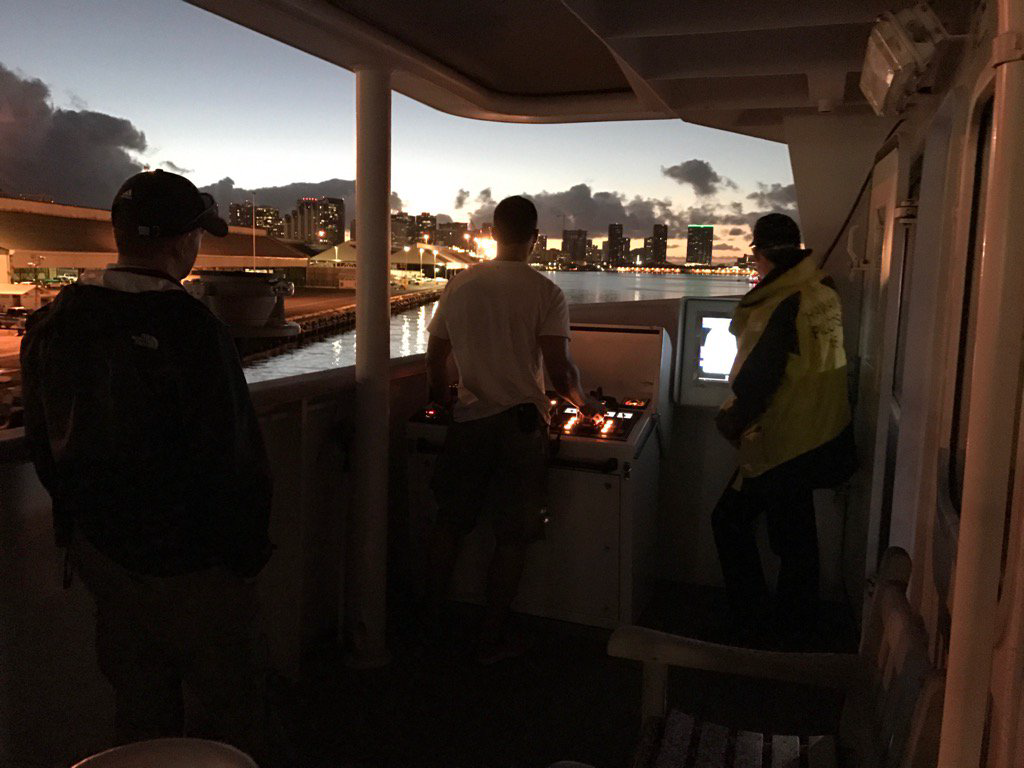
The R/V Falkor departs Honolulu on January 24, 2017. Credit: SOI
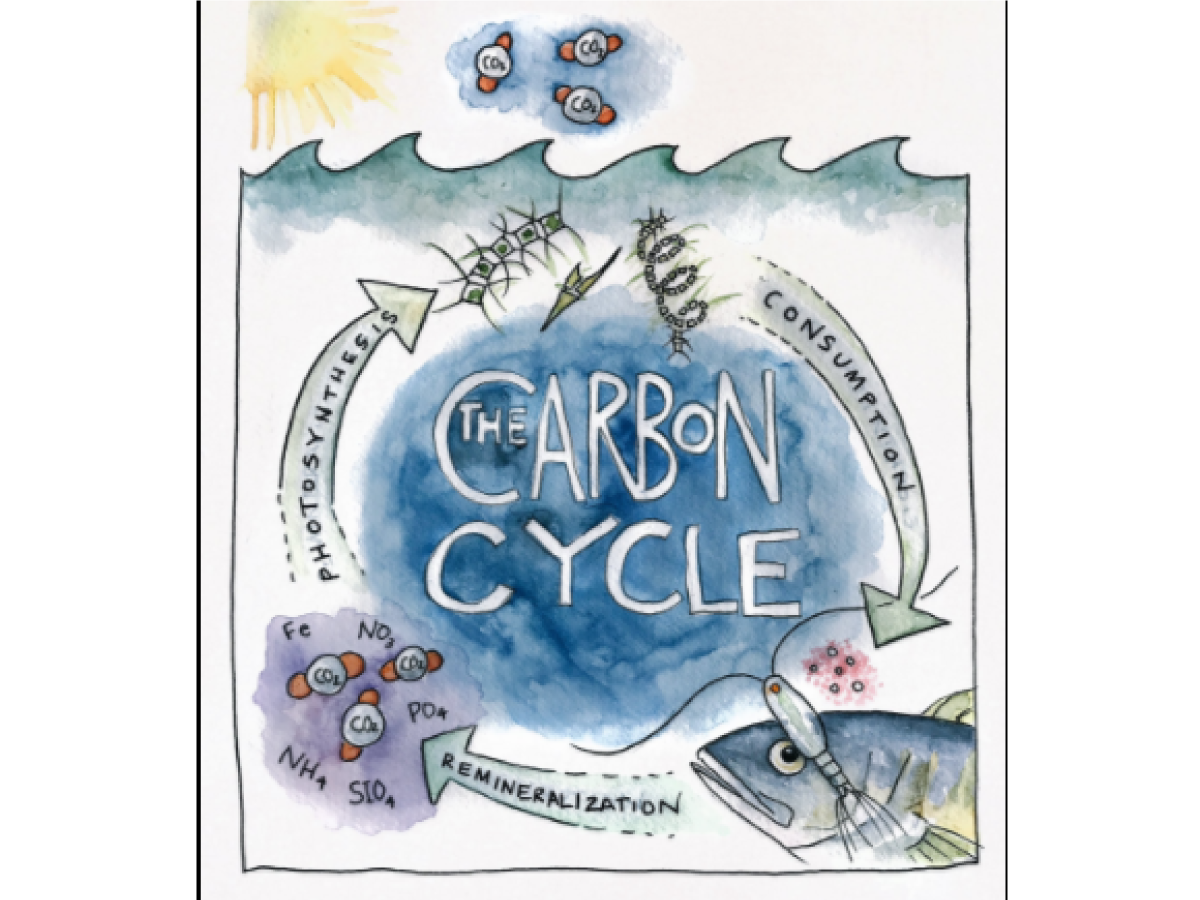
The carbon cycle consists of processes that exchange carbon within and between the ocean, atmosphere, Earth interior, and the seafloor. Along with the nitrogen and water cycles, the carbon cycle comprises a sequence of events that are key to make Earth capable of sustaining life. Credit: Kirsten Carlson
Phytoplankton are critical to our existence. They produce much of the world’s oxygen and remove carbon dioxide from the atmosphere, thereby helping to control climate. This collage shows a small number of the different kinds of phytoplankton that inhabit Earth's ocean. Credit: Heidi Sosik (WHOI)
The focus of Chief Scientist Dr. Ivona Cetinic´ (USRA/NASA) and her multidisciplinary team of oceanographers, engineers, biologists, and computer scientists is to study ocean particles, and specifically, the tiny phytoplankton that make up the base of our food web. Credit: SOI
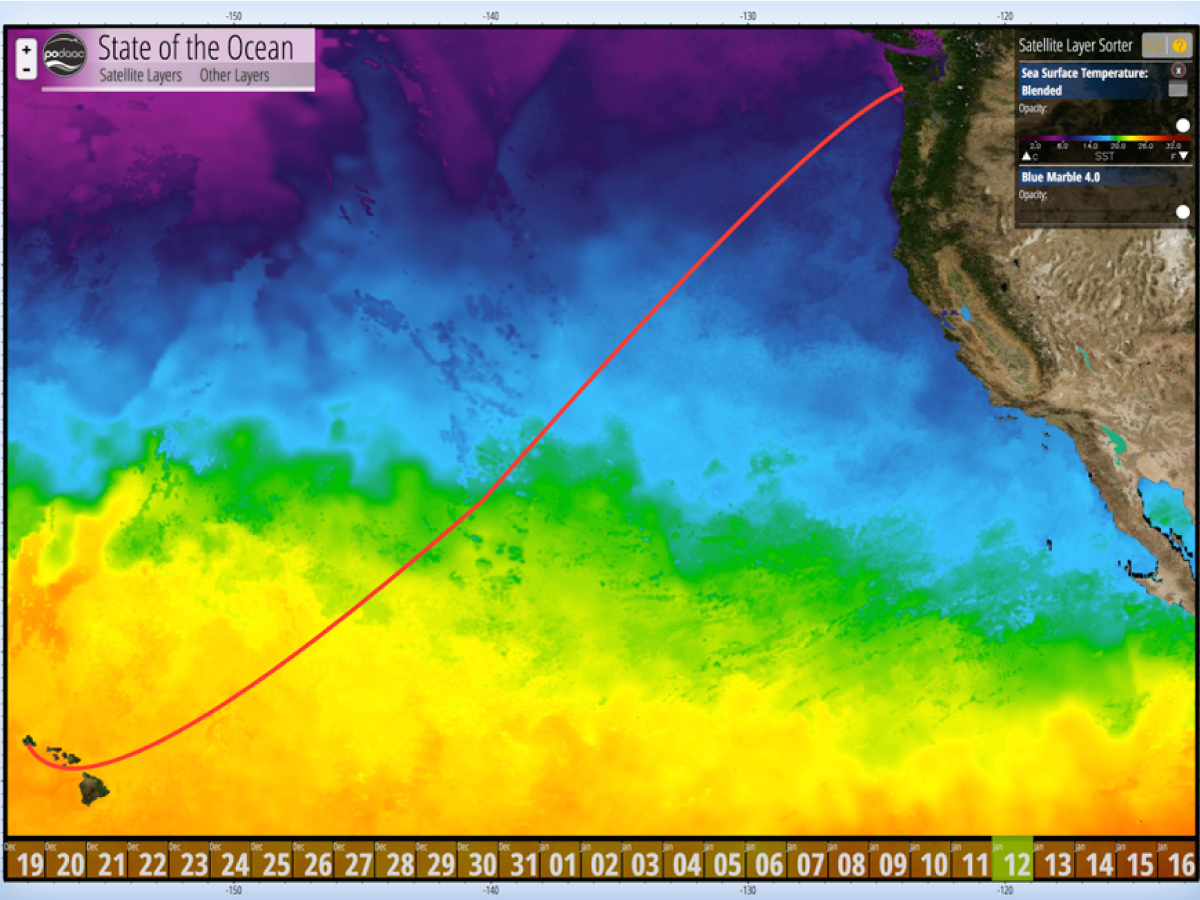
The R/V Falkor cruise track superimposed on a map of sea surface temperature. The cruise will take 28 days to sail from Honolulu, HI to Seattle, WA. Credit: PO.DAAC/NASA
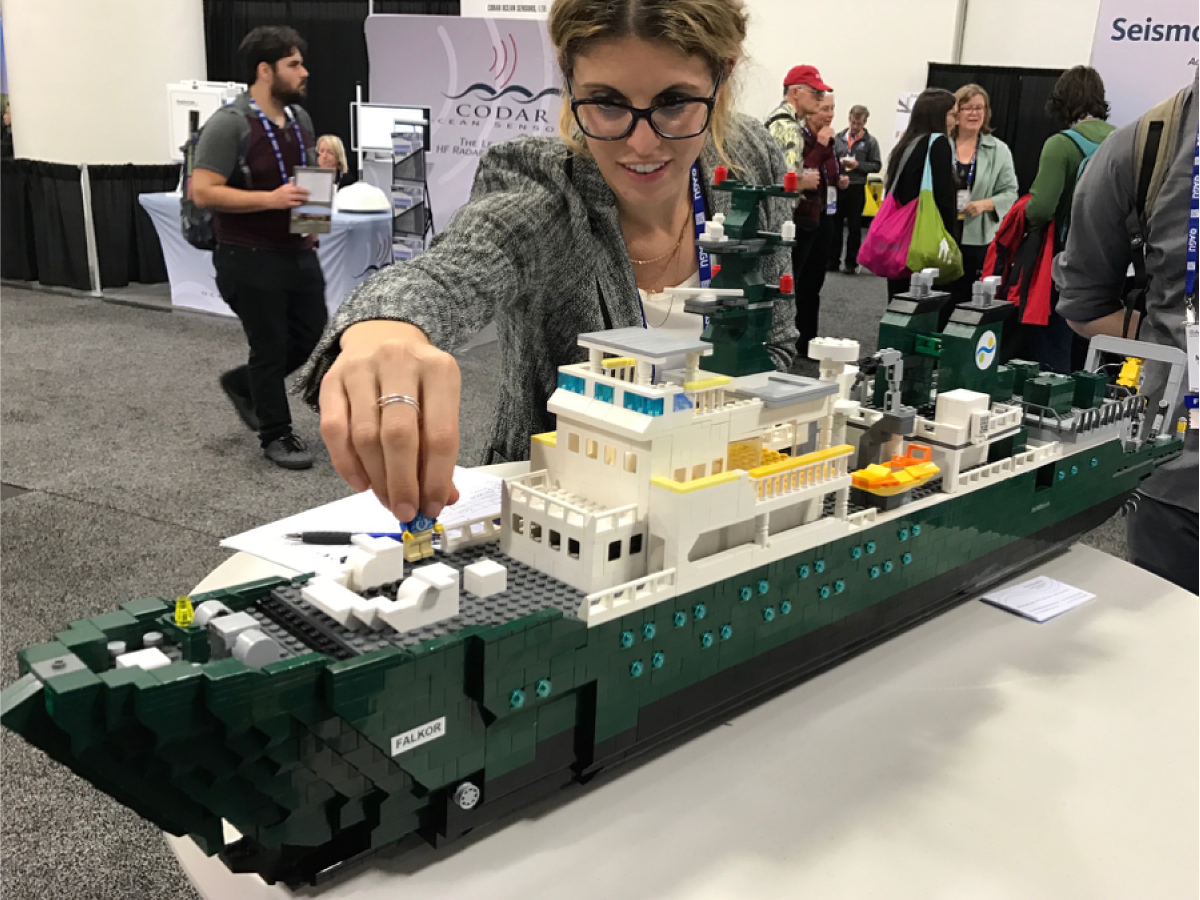
Carlie Wiener (SOI) examines a model of the R/V Falkor made out of legos. Credit: SOI
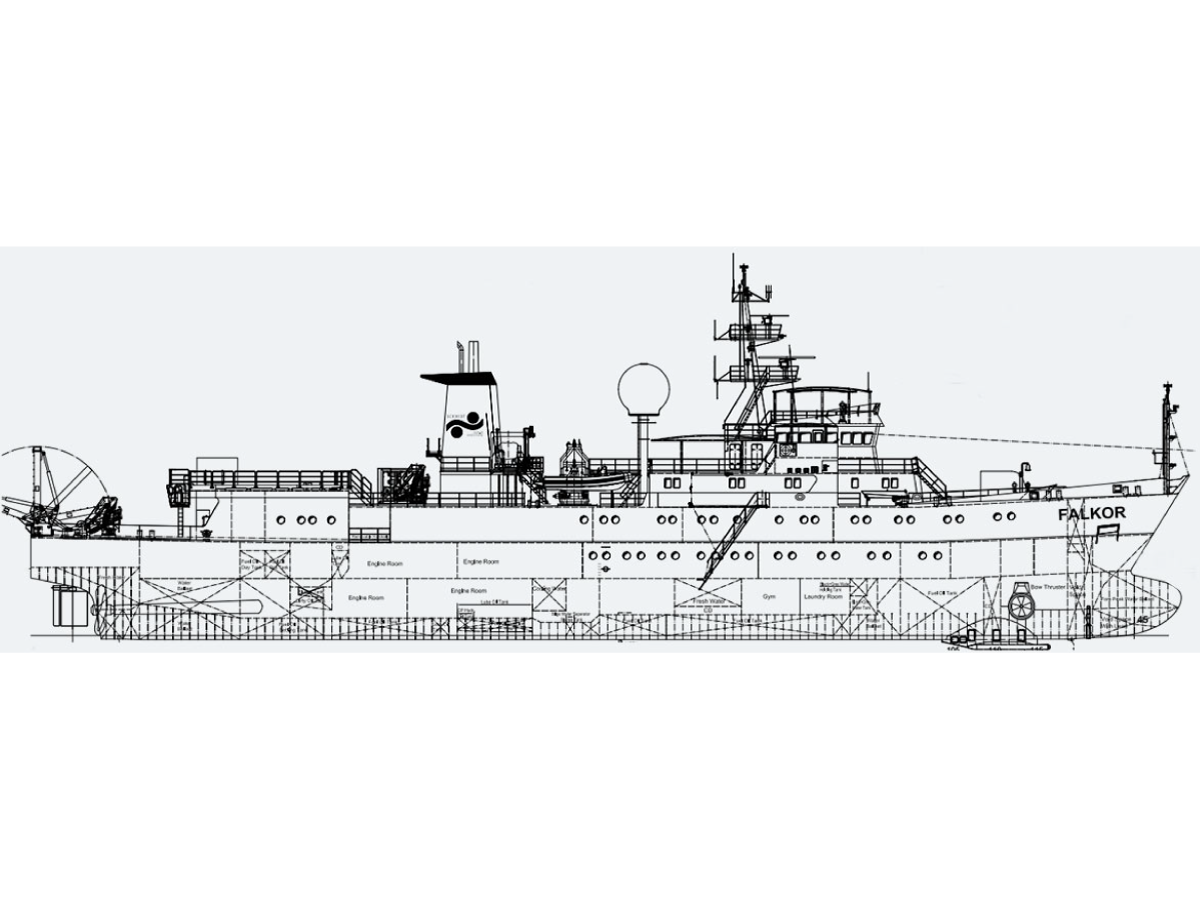
R/V Falkor was originally built as the Seefalke in 1981 in Lübeck, Germany as a fishery protection vessel but was converted for oceanographic research in 2009-2012. The 82-meter ship has a maximum speed of 17 knots and contains 16 berths for scientists, technicians, and cruise personnel. Credit: Schmidt Ocean Institute
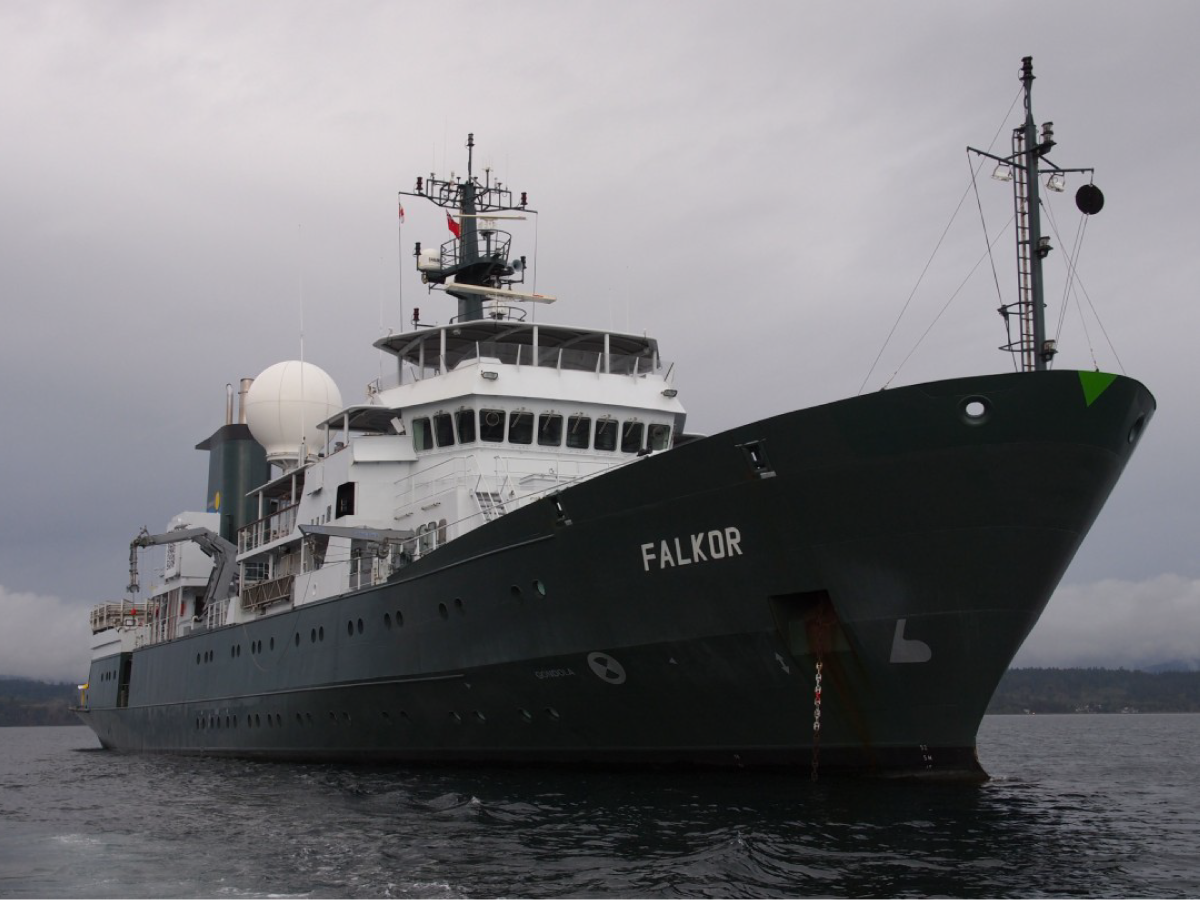
Scientists from NASA Goddard Space Flight Center (GSFC) will collect data in collaboration with the Schmidt Ocean Institute (SOI) on a month-long cruise in the Pacific aboard the R/V Falkor. Credit: SOI
The Sea to Space Particle Investigation aims to improve the accuracy of particle size distribution products gathered from satellite and remote-sensing data. These data contain critical information that can improve our understanding of how Earth's living marine resources and carbon sequestration are responding to rising carbon dioxide levels and climate changes. Credit: SOI
Sea 2 Space Particle Investigation Field Campaign VIEW ALL »
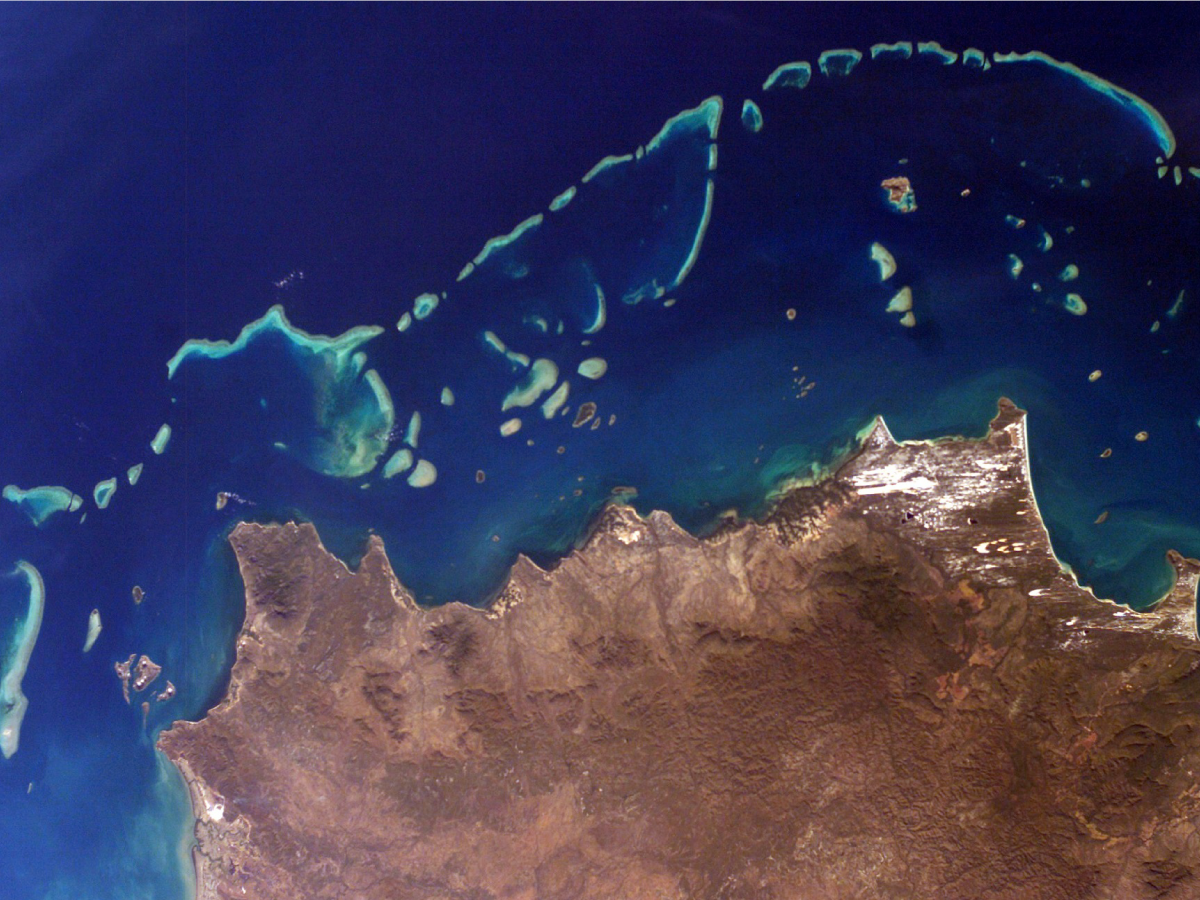
Part of Australia's Great Barrier Reef, one of many that will be studied during the CORAL field campaign. Credit: NASA
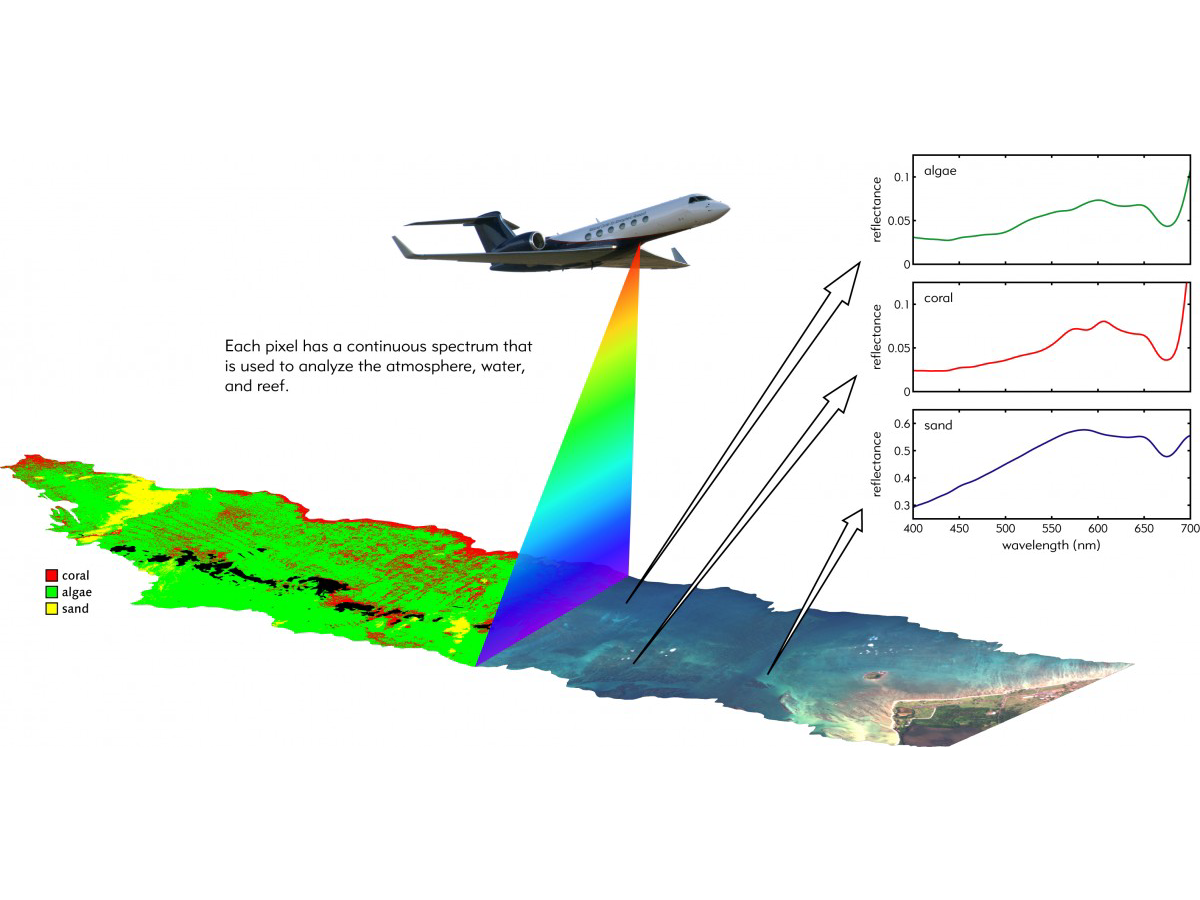
The airborne PRISM instrument records light spectra reflected upward from the ocean. Data are used to identify reef compositions.
Meteorologist John Jelsema discusses an upcoming weather forecast with CORAL project scientist Michelle Gierach. Credit: James Round (NASA)
CORAL team members examine PRISM, an airborne instrument that measures the spectra of light reflected from surfaces below a plane. Credit: NASA
Lab testing of the Portable Remote Imaging Spectrometer (PRISM), an airborne instrument designed to observe hard-to-see coastal water phenomena. Credit: NASA JPL-Caltech
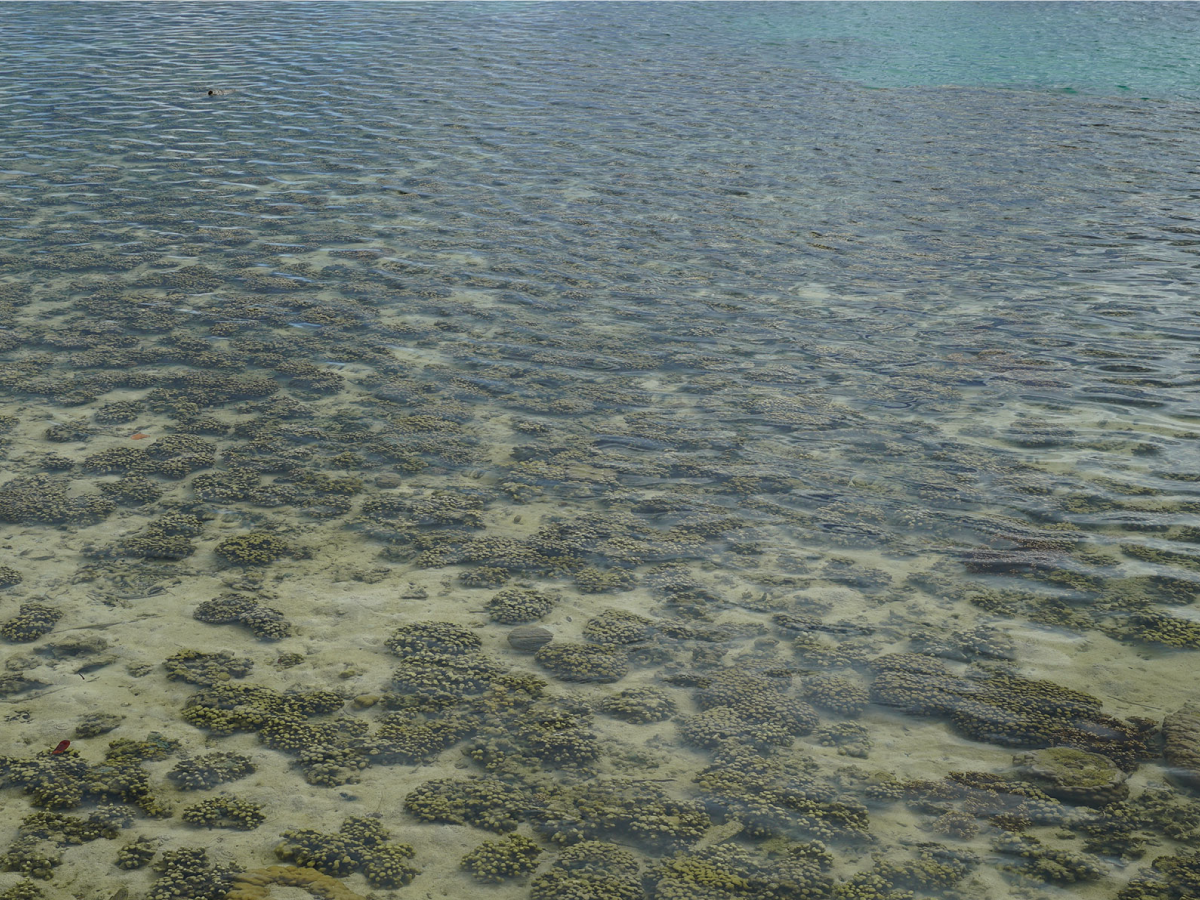
One of the Kaneohe Bay reefs studied by CORAL to assess the condition of vulnerable ecosystems. Credit: James Round (NASA)
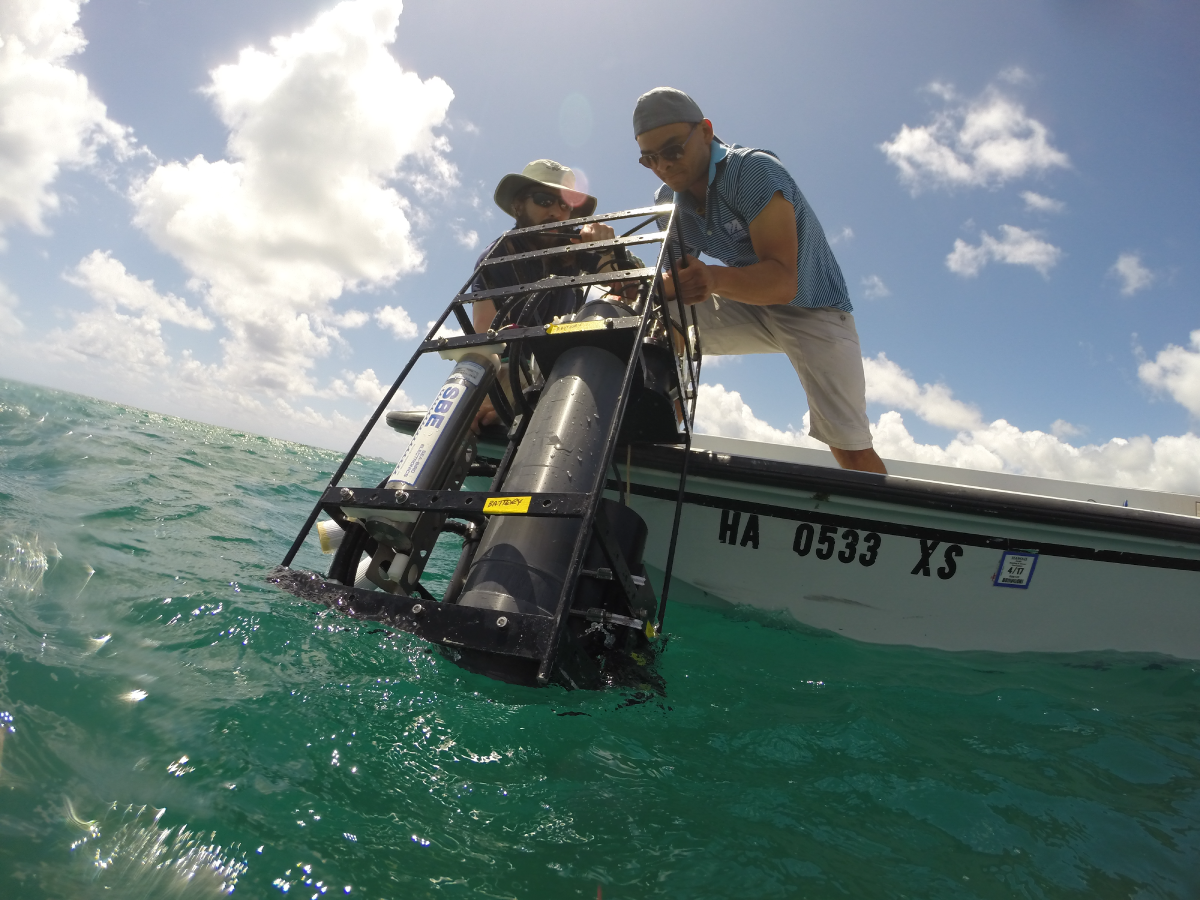
A package of instruments is deployed during the CORAL field campaign. This cage contains instruments that measure how light is absorbed and scattered in water. Credit: Daniel Schar (HIMB)
Principal Investigator Eric Hochberg directs sampling efforts during the CORAL field campaign.
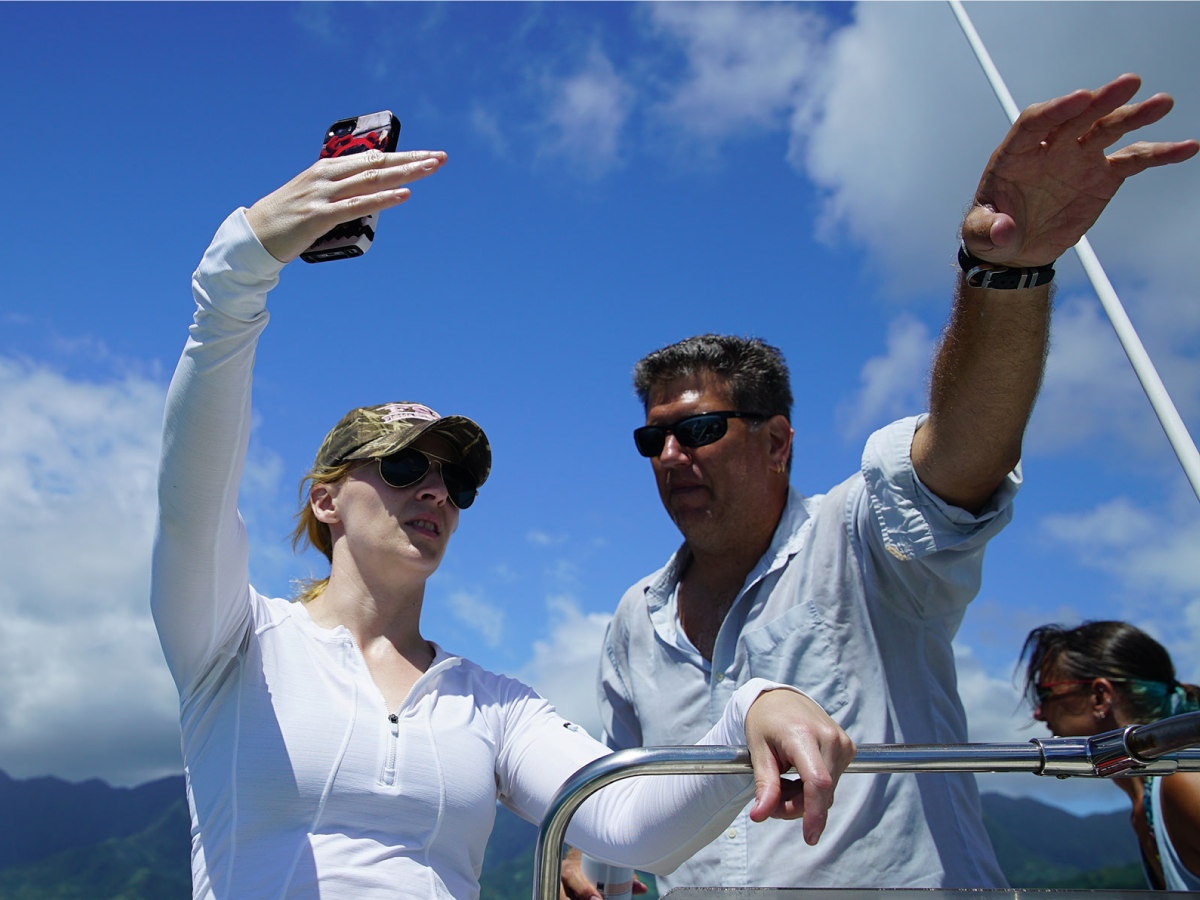
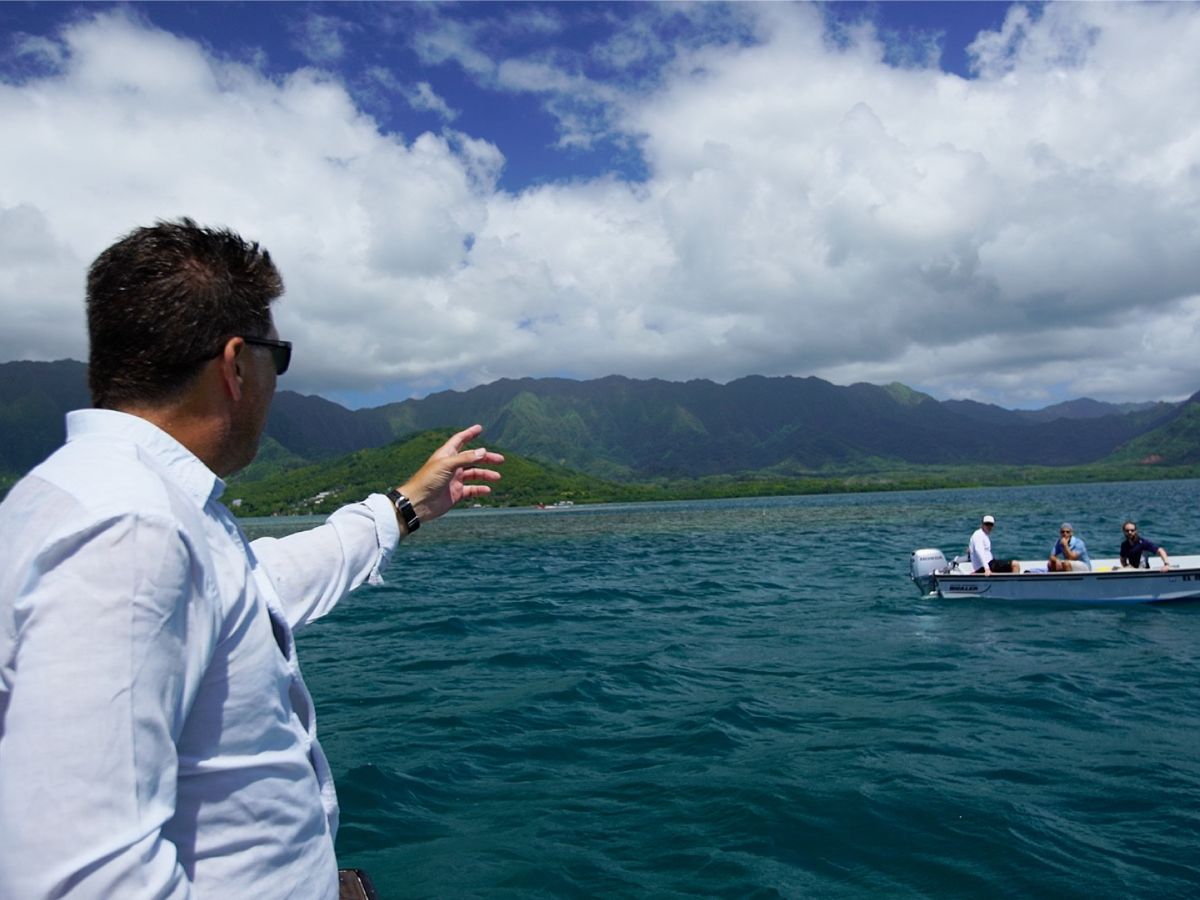
CORAL scientists identify reefs in Kaneohe Bay (Oahu, Hawaii). Credit: James Round (NASA)
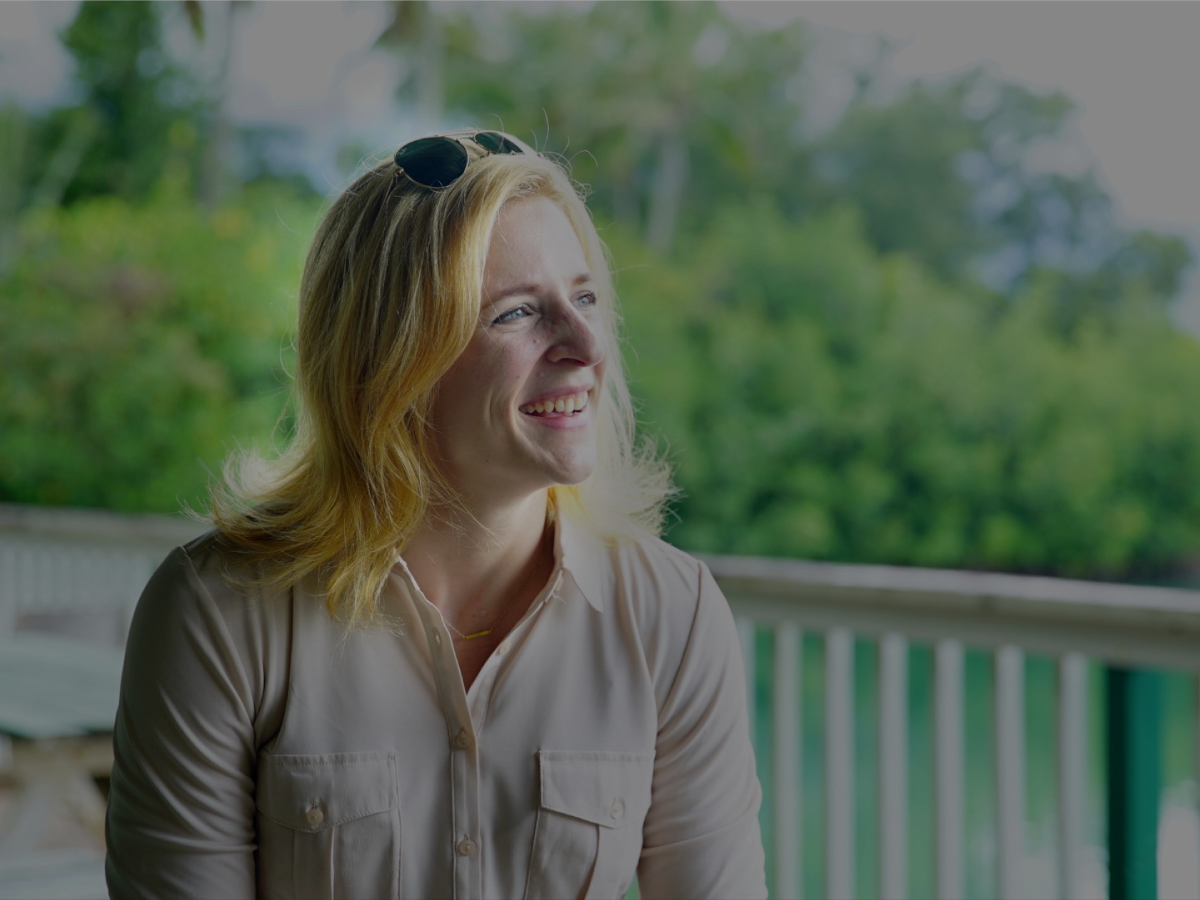
CORAL Project Scientist Michelle Gierach at the Hawaii Institute of Marine Biology on Oahu. Credit: James Round (NASA)
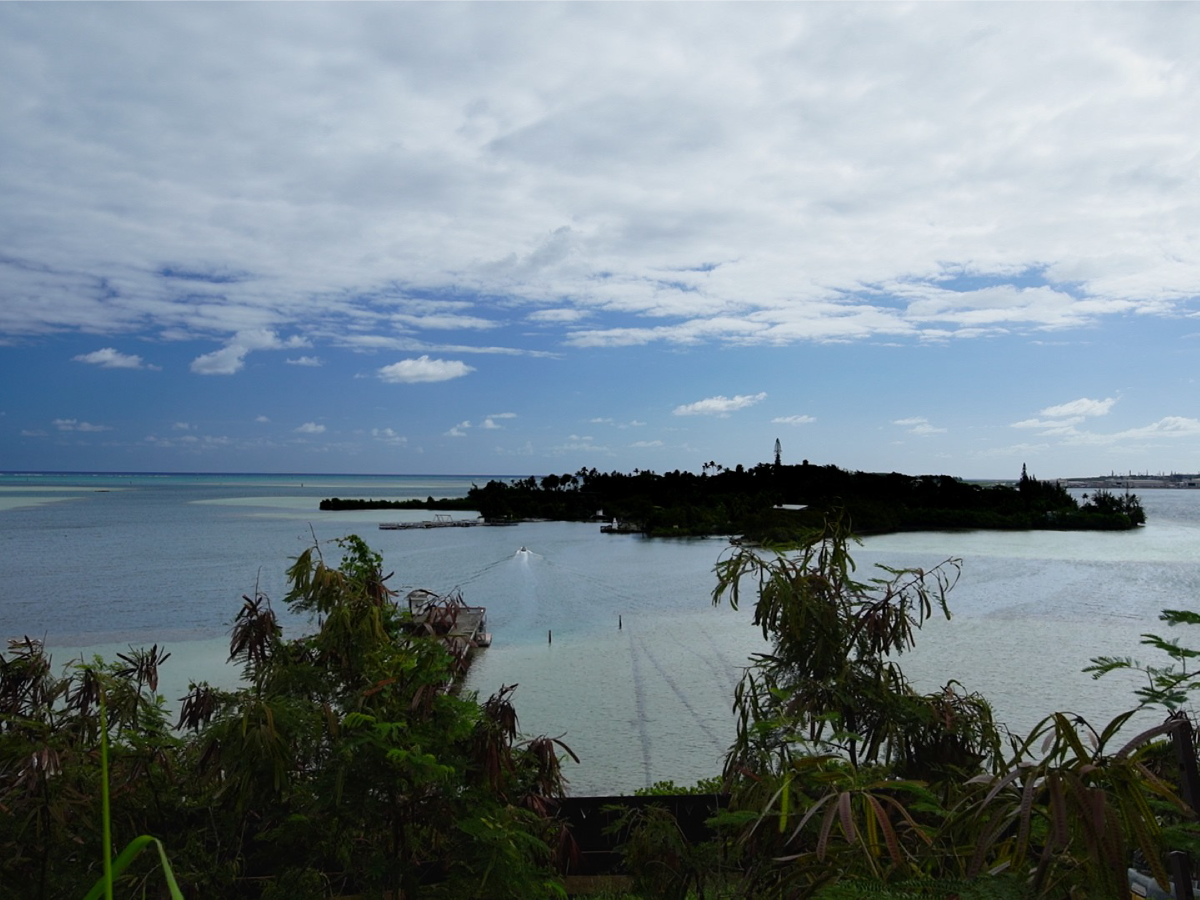
Coconut Island - CORAL's base of operations in Hawaii. Credit: James Round (NASA)
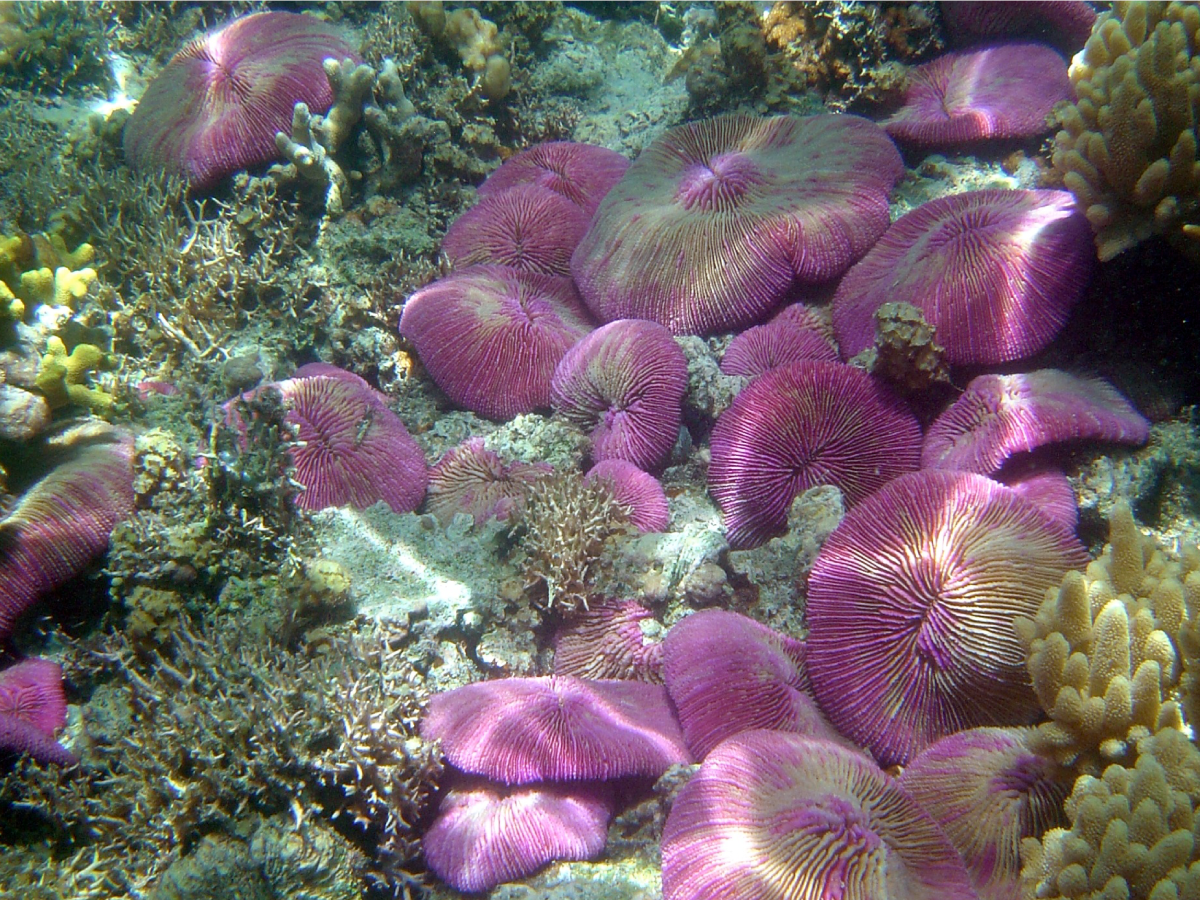
CORAL's field campaign will use advanced airborne instruments and in-water collection methods to survey the reefs of Palau, the Mariana Islands, portions of Australia's Great Barrier Reef, and Hawaii. Credit: David Burdock (NOAA)
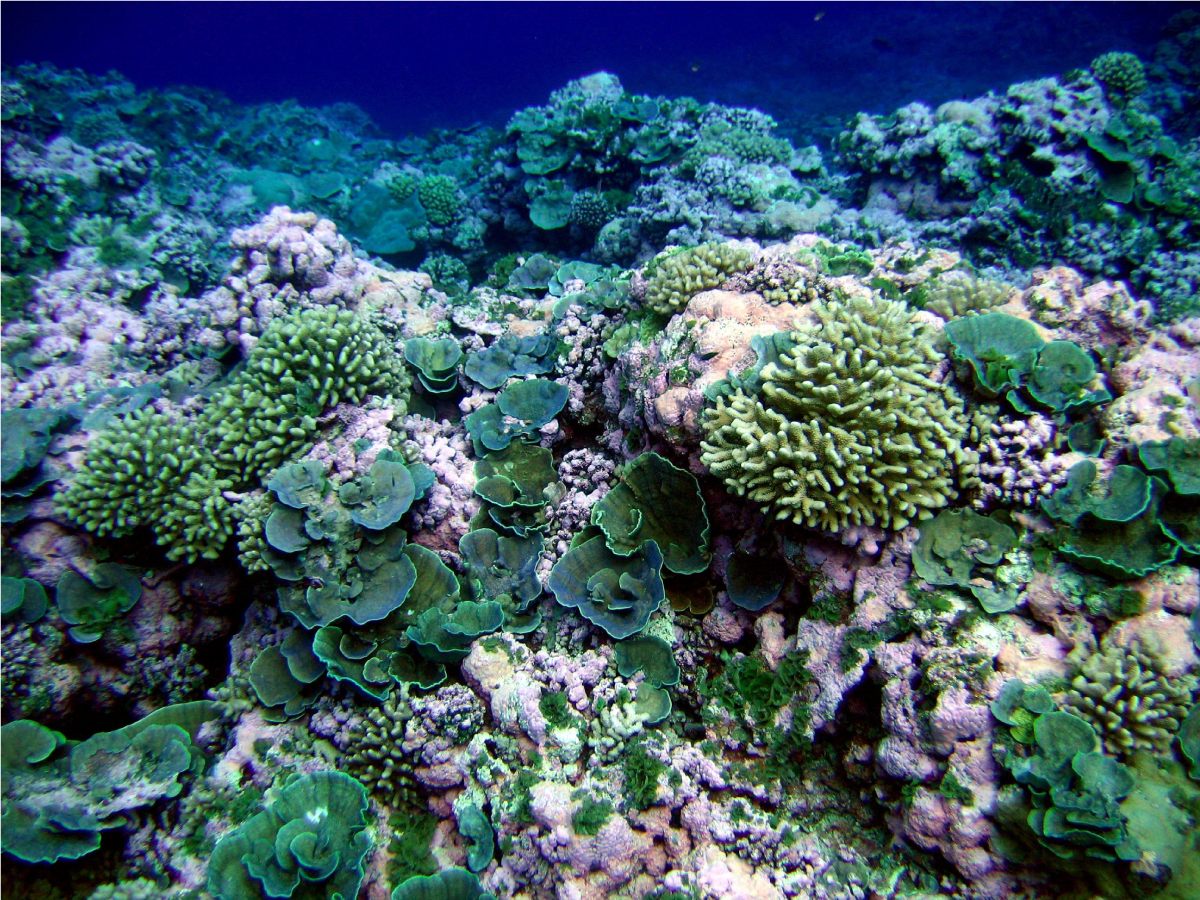
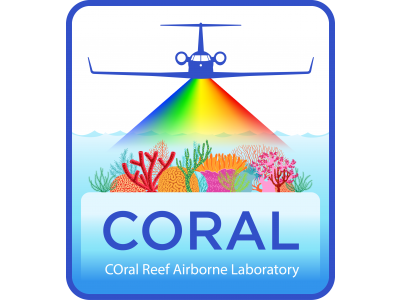
The three-year COral Reef Airborne Laboratory (CORAL) mission will survey a portion of the world's coral reefs to assess the condition of these threatened ecosystems. Credit: NOAA/NMFS/PIFSC/CRED Oceanography Team
CORAL Field Campaign VIEW ALL »
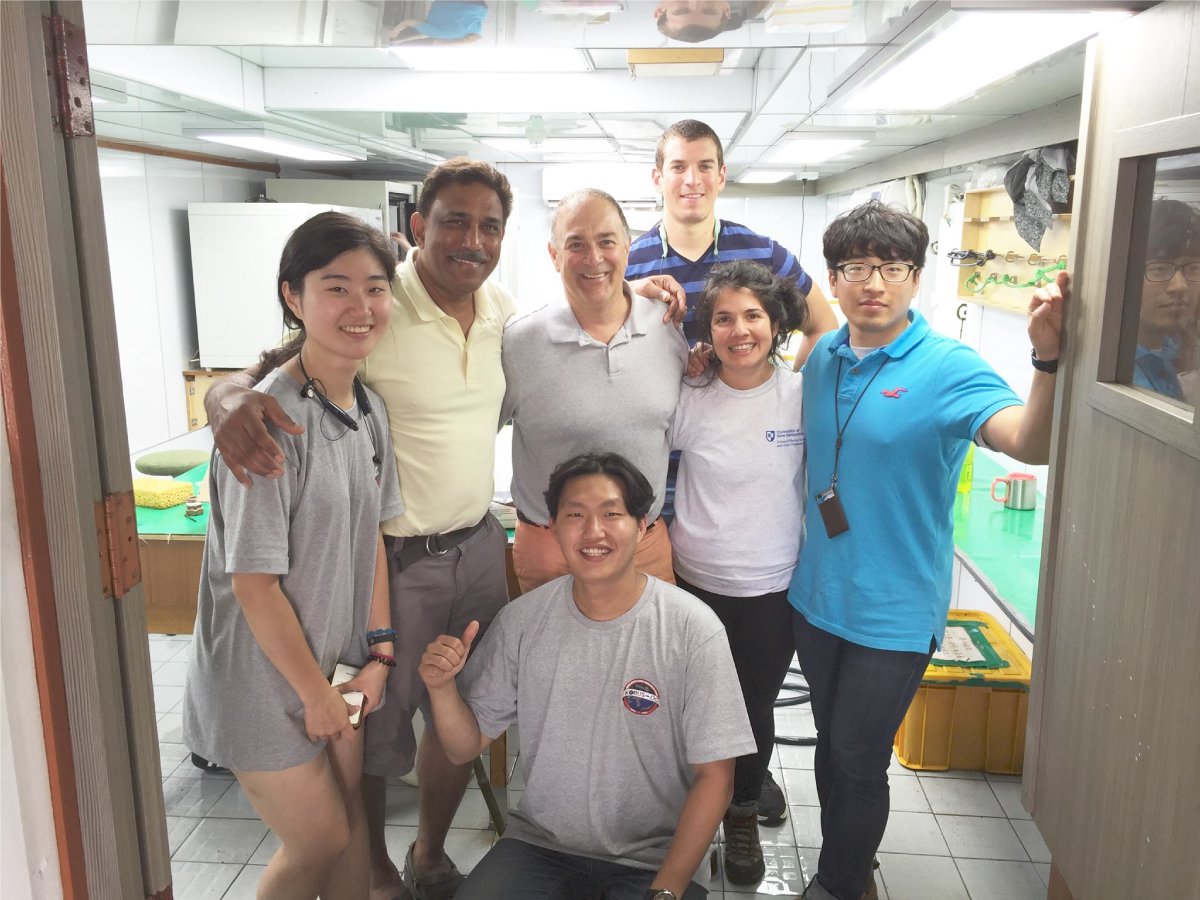
U.S. scientists pose for a final photo with the KIOST team at the conclusion of the KORUS-OC field campaign.
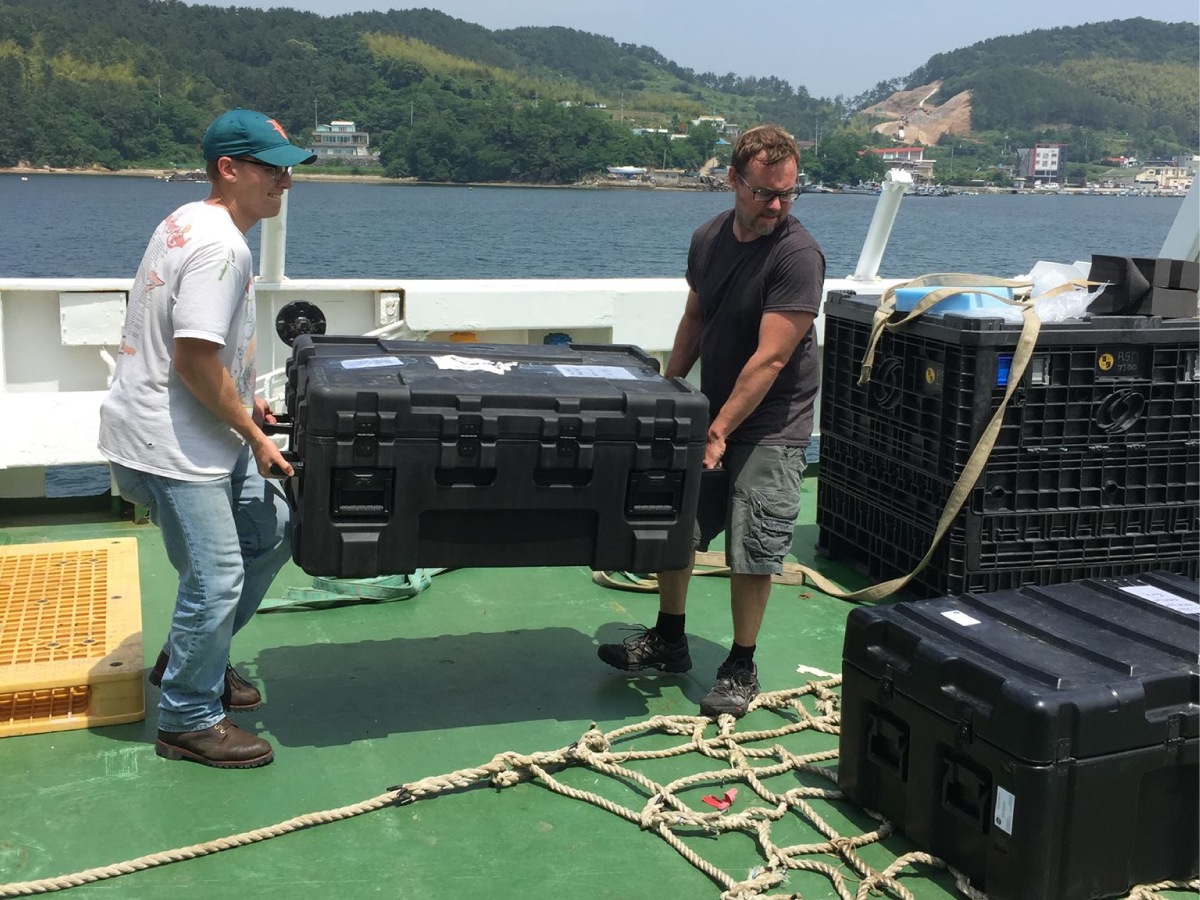
Offloading equipment after the KORUS-OC field campaign. Credit: Joaquin Goes (Columbia University)
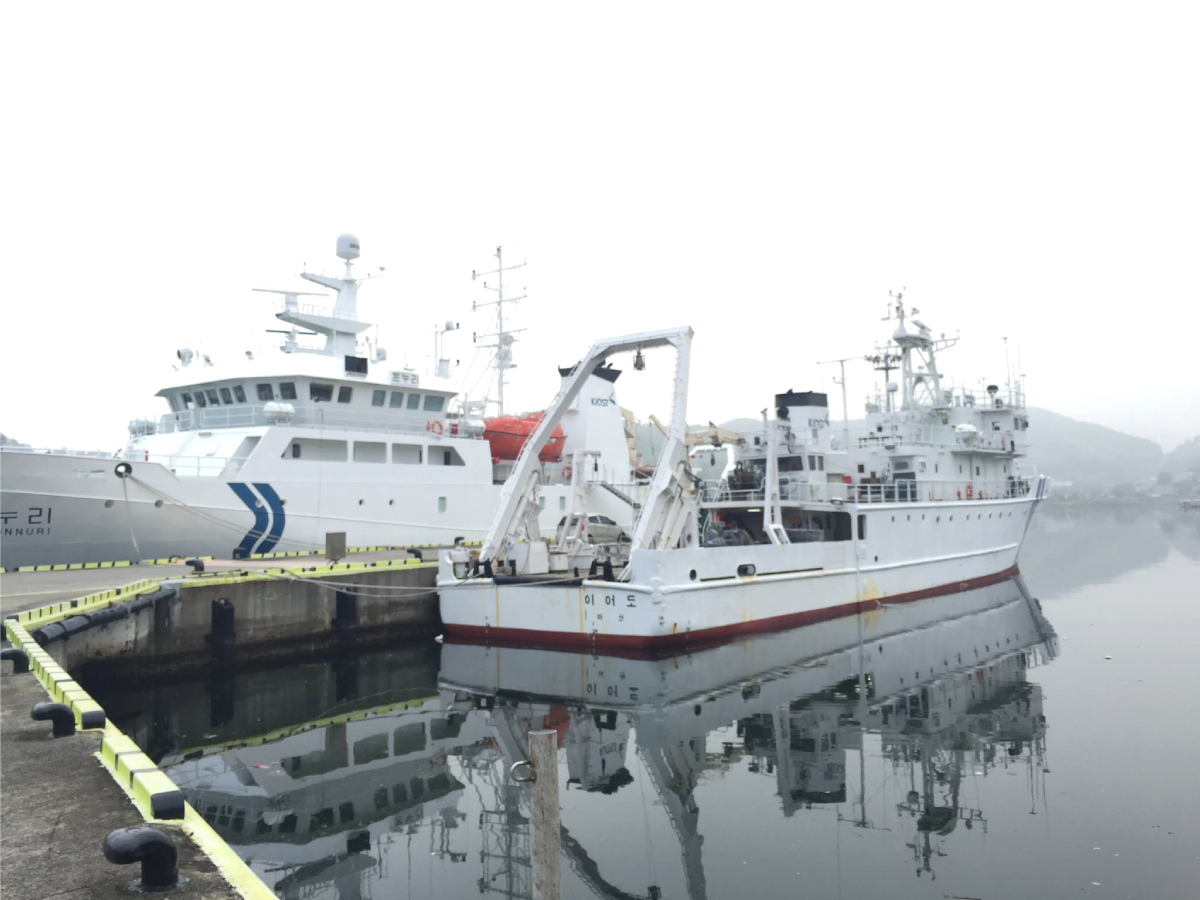
R/V Onnuri and R/V Eardo in port after the KORUS-OC field campaign. Credit: Joaquin Goes (Columbia University)
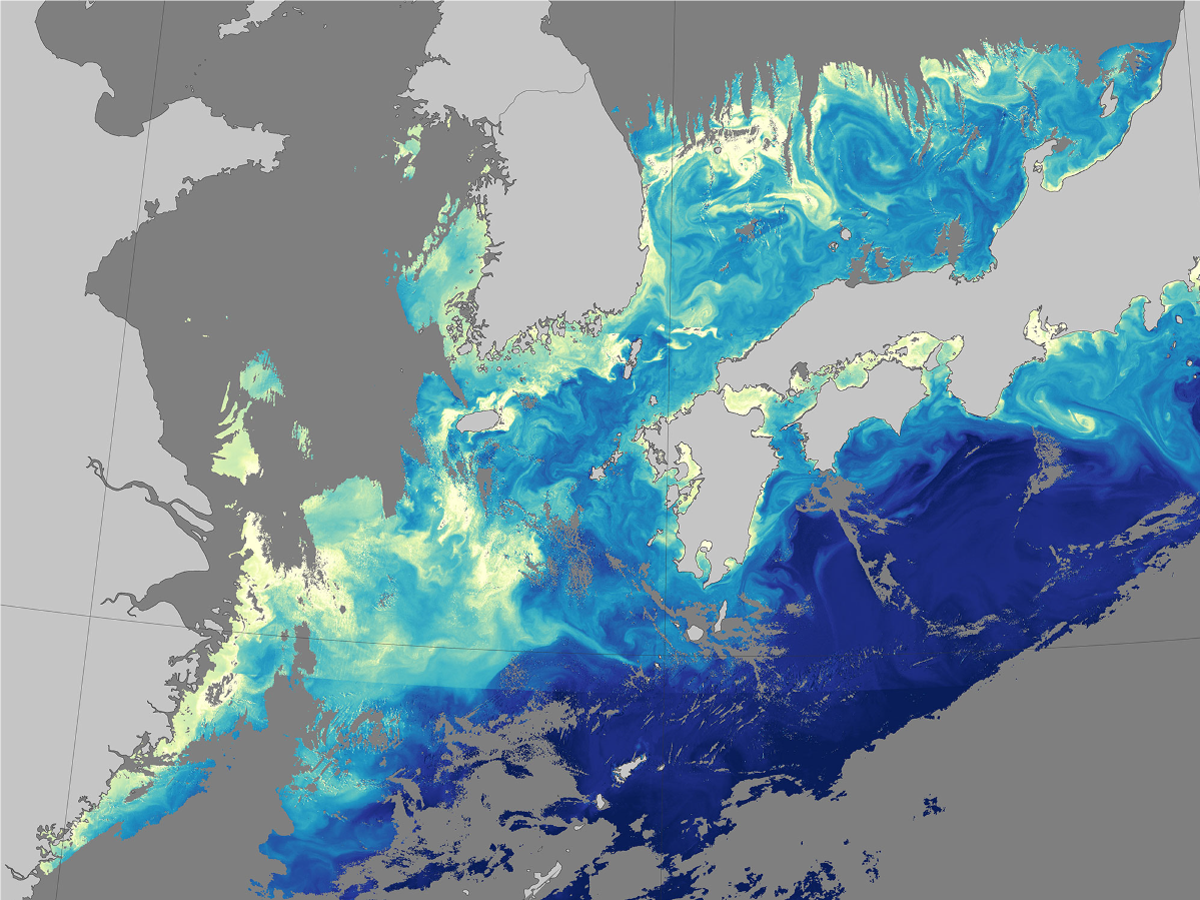
Chlorophyll concentrations in the waters off South Korea during the KORUS-OC field campaign. The data were collected by GOCI, an instrument on South Korea's Communication, Ocean and Meteorological Satellite. Credit: NASA Earth Observatory
Noctiluca cells from the Yangtze River plume as seen by FlowCAM. Credit: Joaquin Goes (Columbia University)
Deploying instruments in the Yangtze River plume. River plumes are generated by the flow of buoyant river water into the coastal ocean, where it impacts the properties and circulation of seawater. Credit: Joaquin Goes (Columbia University)
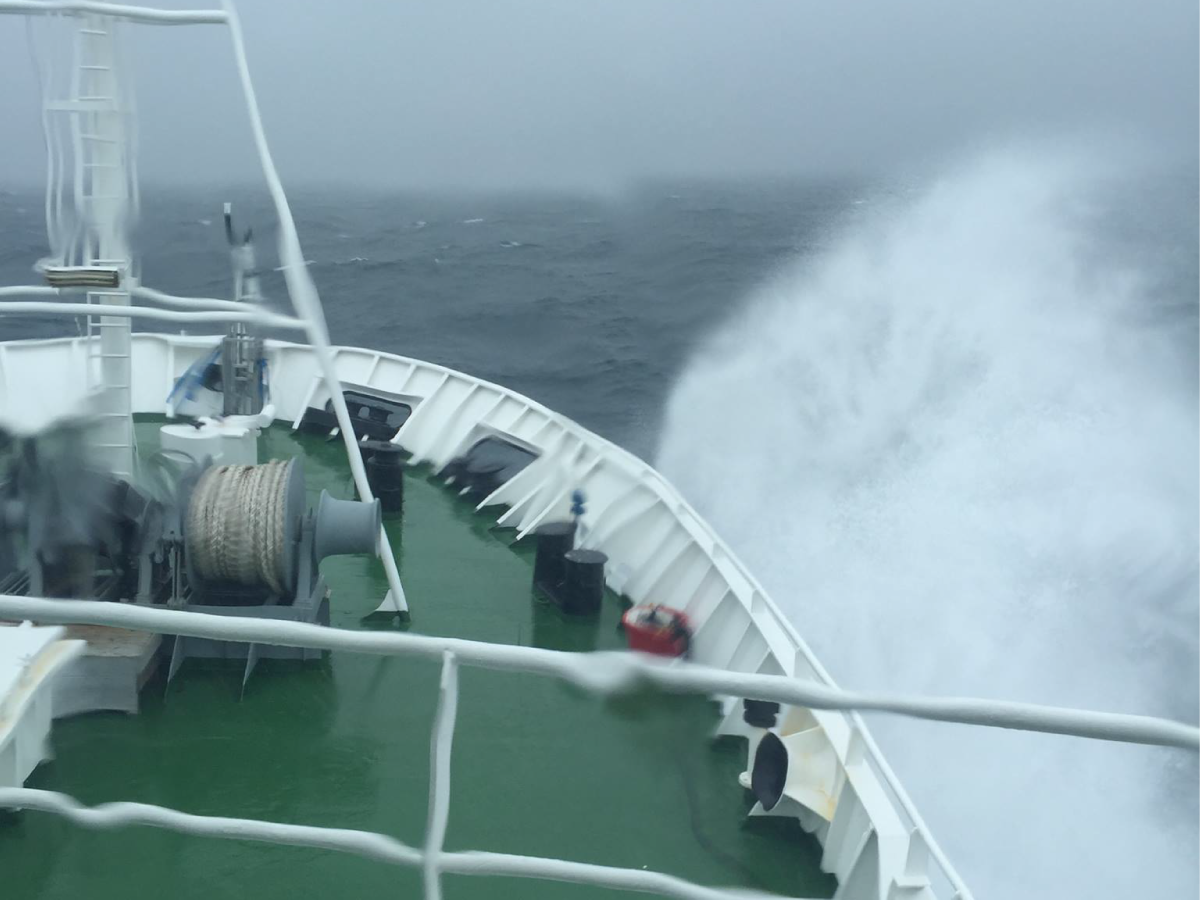
Waves break over the bow of the RVOnnuri in rough seas. Credit: Joaquin Goes (Columbia University)
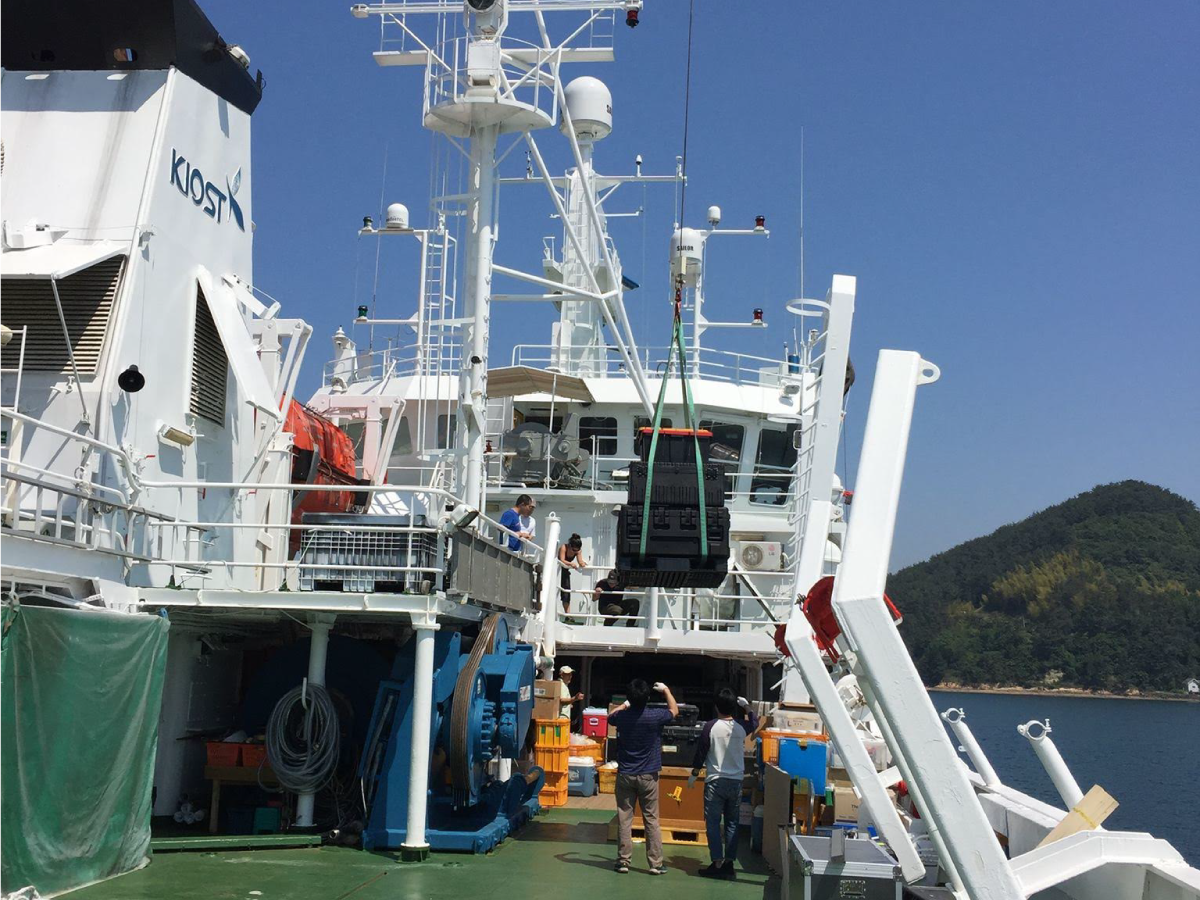
Containers are carefully hoisted on board the research vessel. Credit: Joaquin Goes (Columbia University)
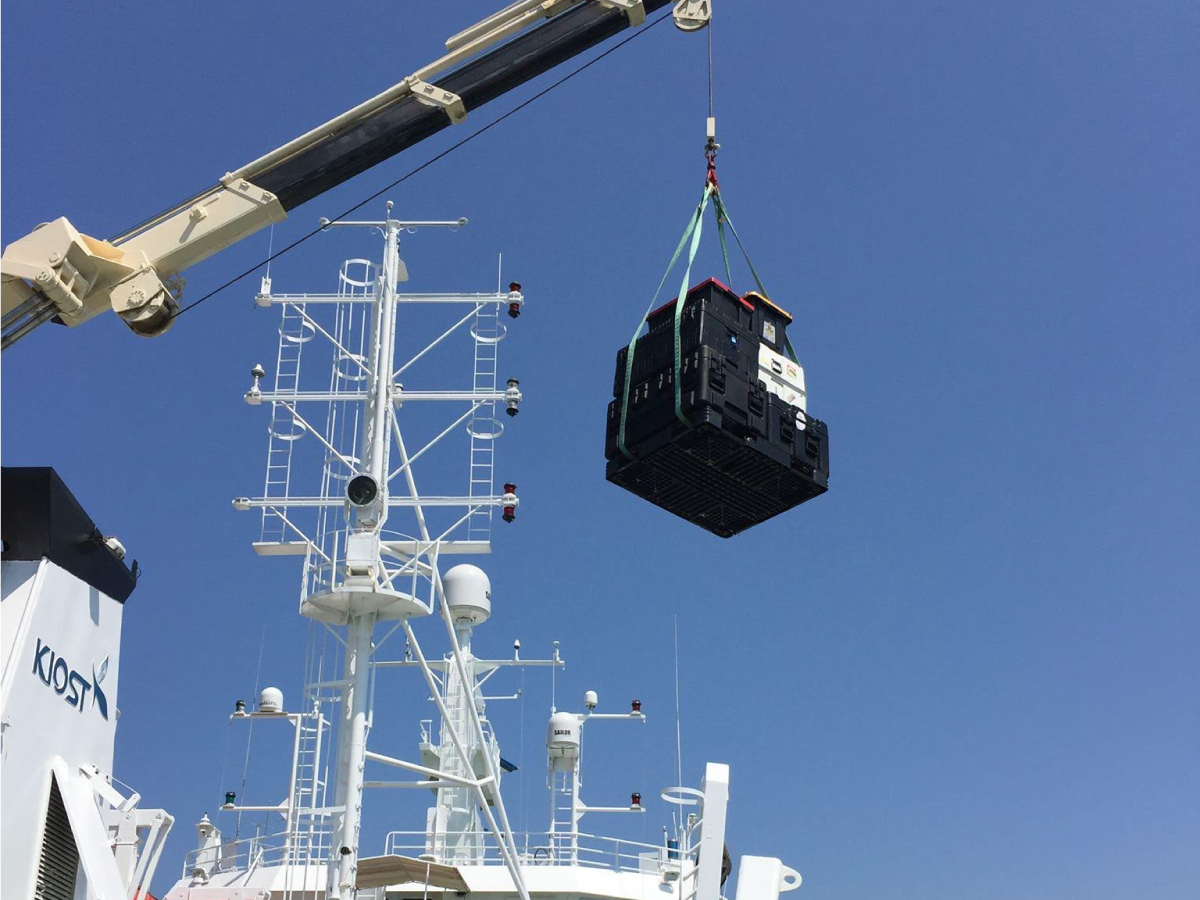
Onboard cranes lift heavy equipment onto the deck of the R/V Onnuri. Credit: Joaquin Goes (Columbia University)
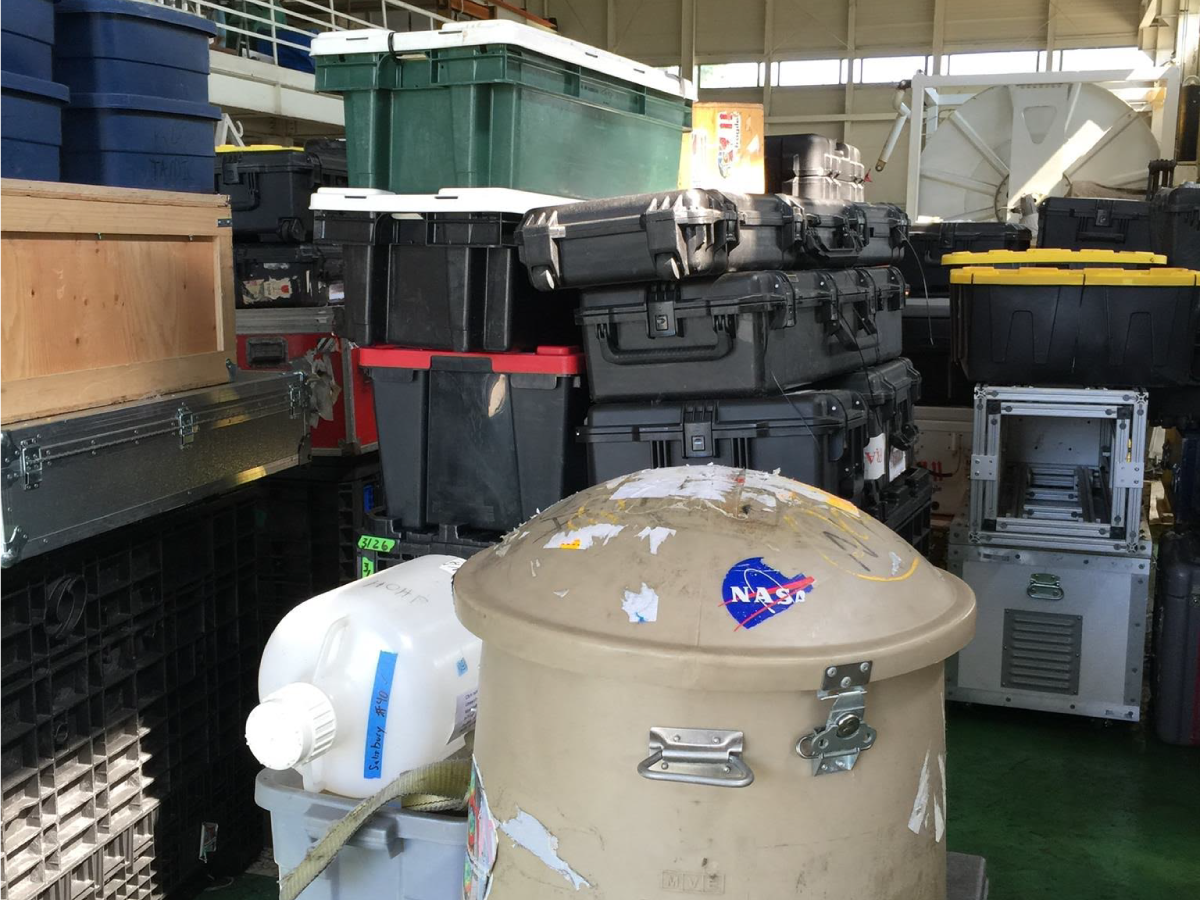
Containers of eqiupment destined for the seas surrounding South Korea await loading. Credit: Joaquin Goes (Columbia University)
Scientific equipment is organized dockside for loading on board the R/V Onnuri. Credit: Joaquin Goes (Columbia University)
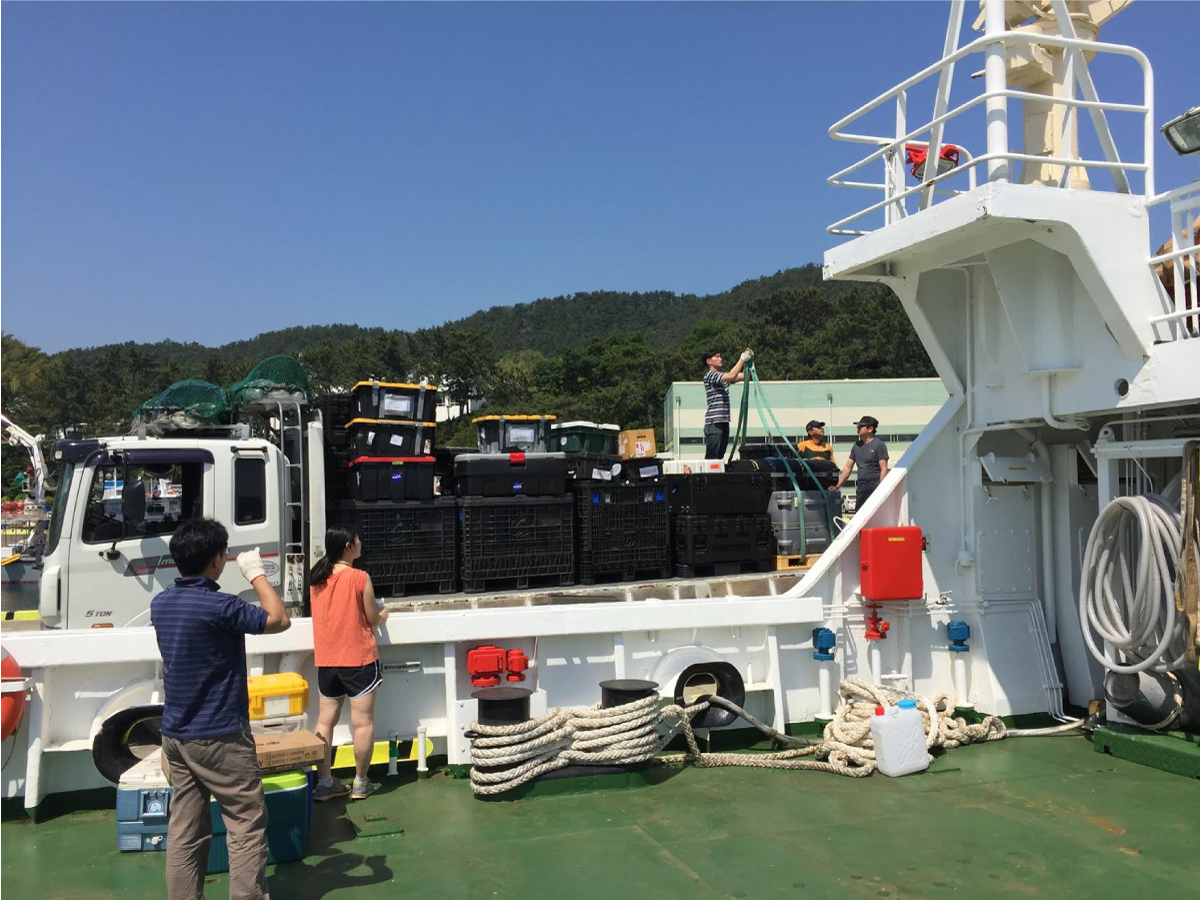
Multiple vehicles bearing scientific equipment queue for boarding. Credit: Joaquin Goes (Columbia University)

The loading process for the KORUS-OC field campaign begins on the R/V Onnuri. Credit: Joaquin Goes (Columbia University)
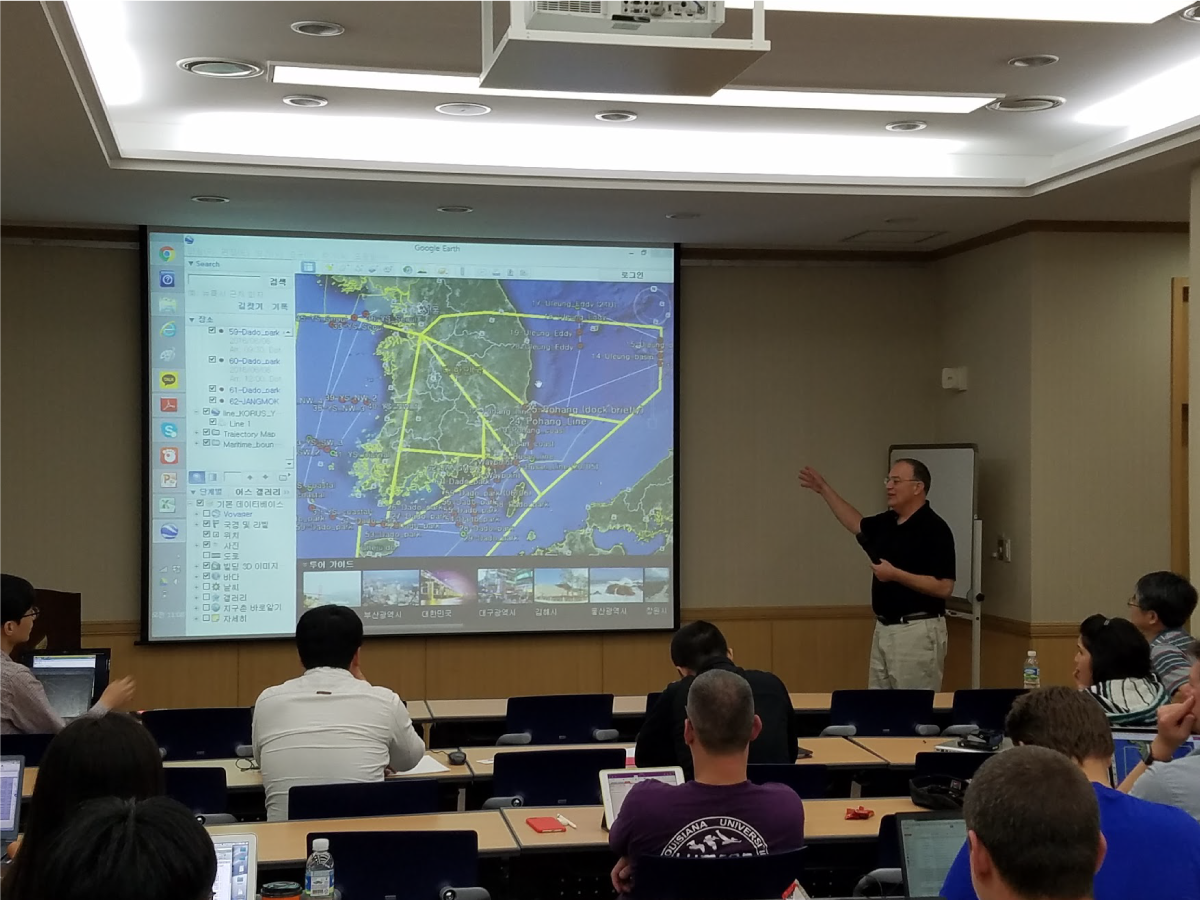
Scientists discuss the combined ship-based and airborne tracks for the KORUS-OC field campaign. Credit: Ivona Cetinić (NASA)
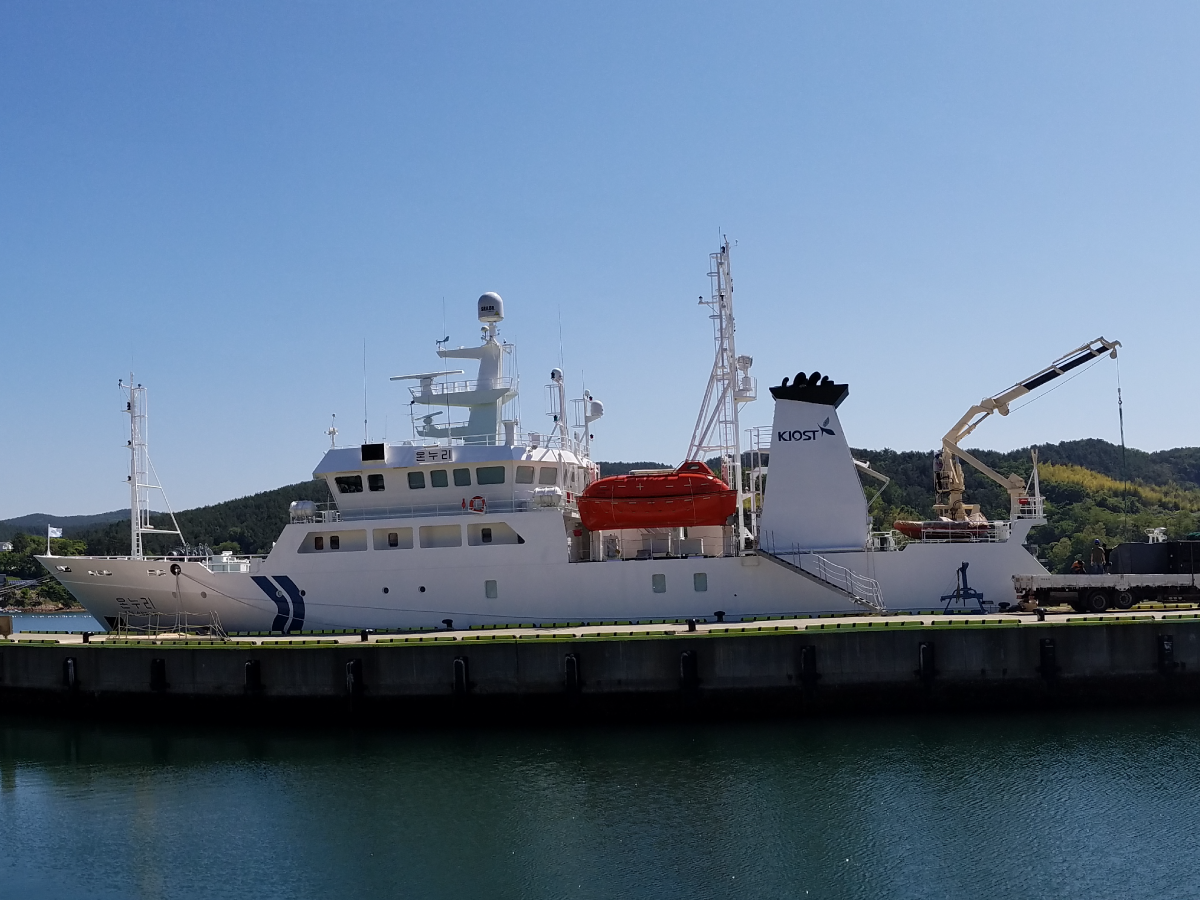
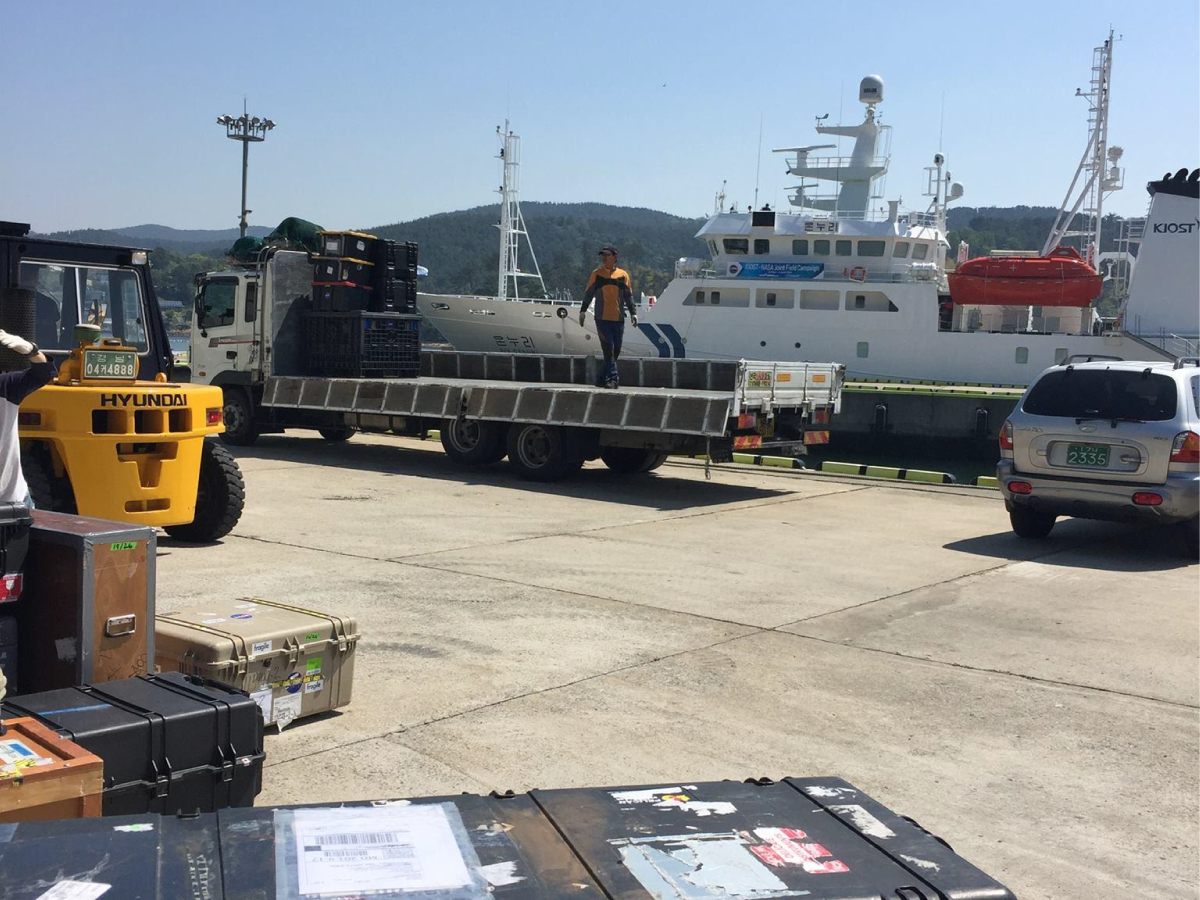
The R/V Onnuri, one of two KORUS-OC research vessels, awaits crew and cargo. Credit: Ivona Cetinić (NASA)
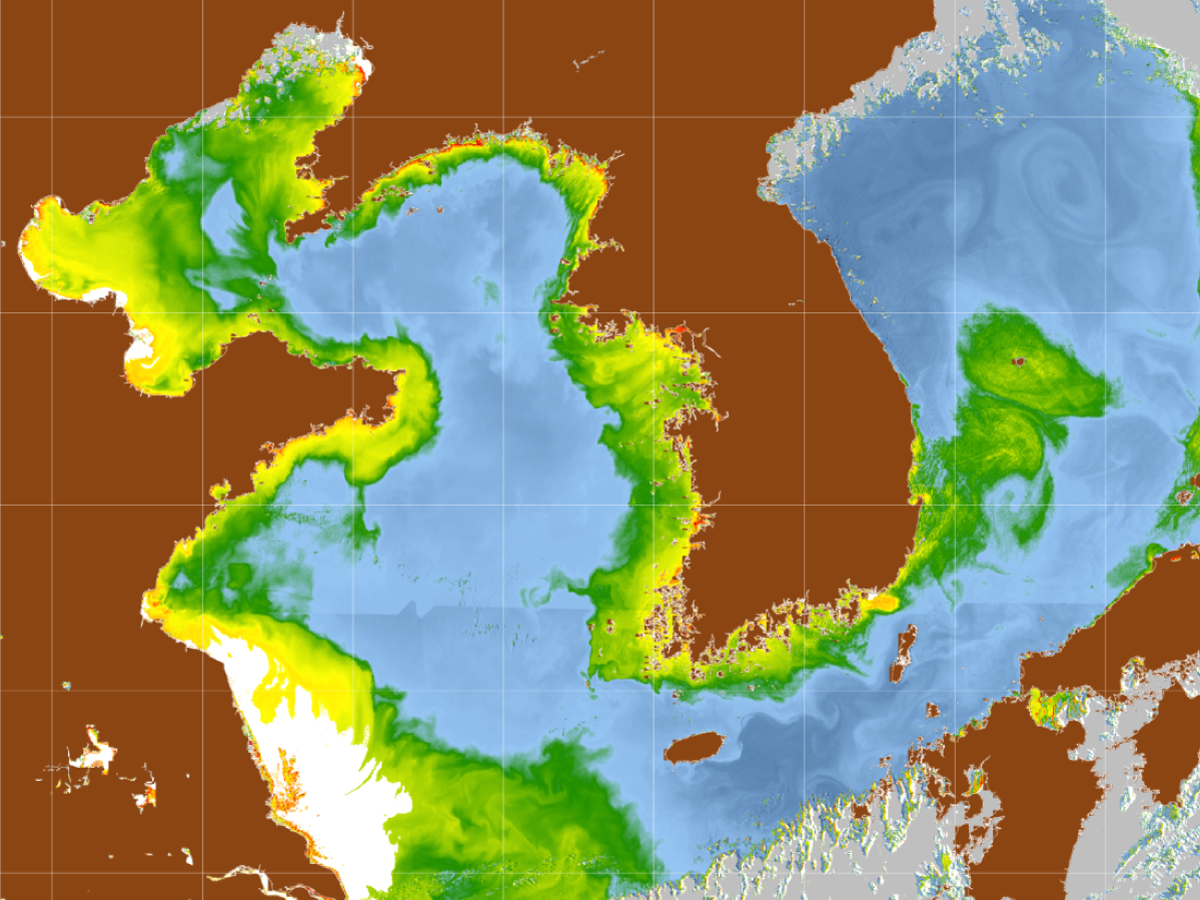
Chlorophyll-a distribution in waters off the Korean peninsula as seen by the Geostationary Ocean Color Imager (GOCI) in May 2011. In 2016, KORUS-OC scientists seek to better understand the role that phytoplankton play in ocean processes.
The Korea - United States Ocean Color (KORUS-OC) Study will focus on the links between satellite- and ship-based measurements of ocean color, biology and biogeochemistry, along with the composition of coastal waters adjacent to the Republic of Korea.
KORUS-OC Field Campaign VIEW ALL »

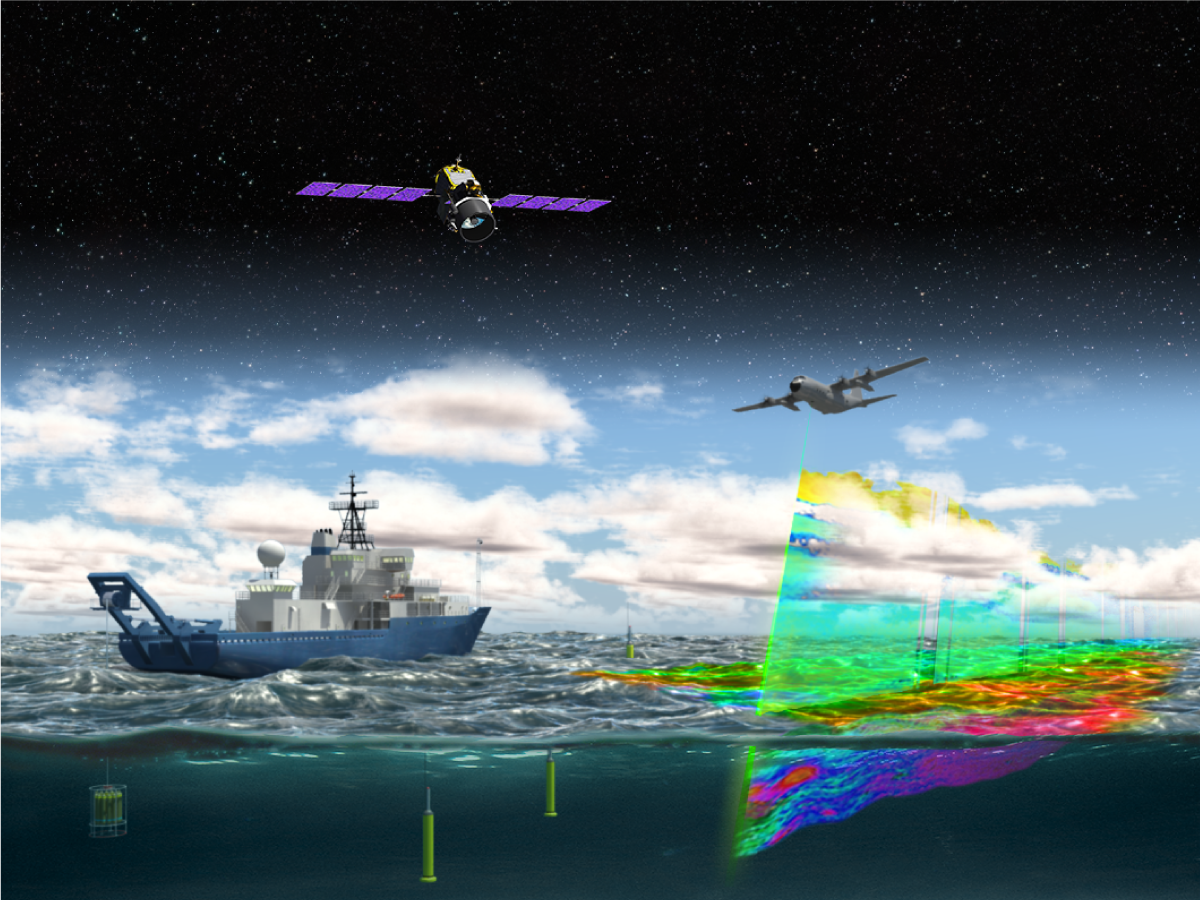
Information obtained during four targeted ship and aircraft field campaigns, combined with continuous satellite and in situ ocean sensor measurements, will enable improved predictive capabilities of Earth system processes for management and assessment of ecosystem change.
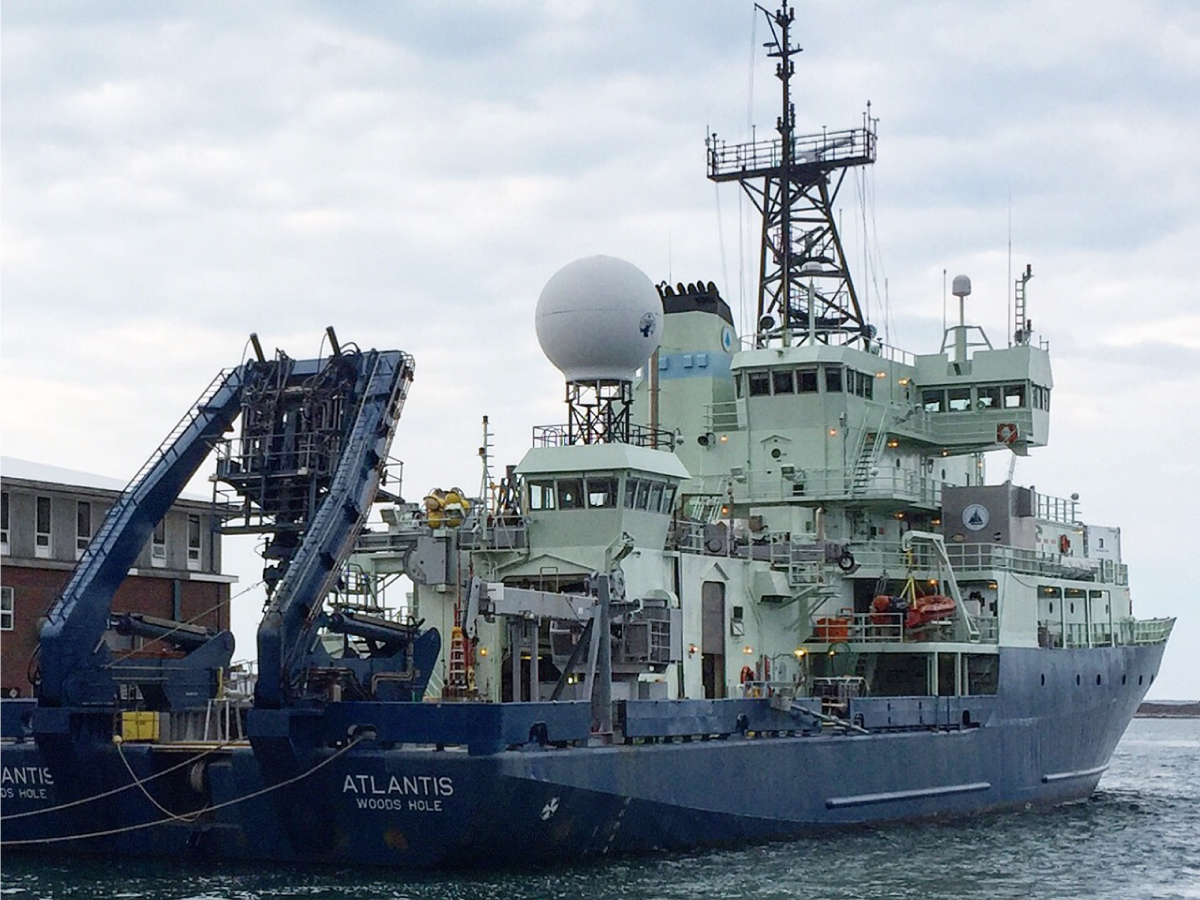
The R/V Atlantis in port. Credit: Dick Pittenger (WHOI)
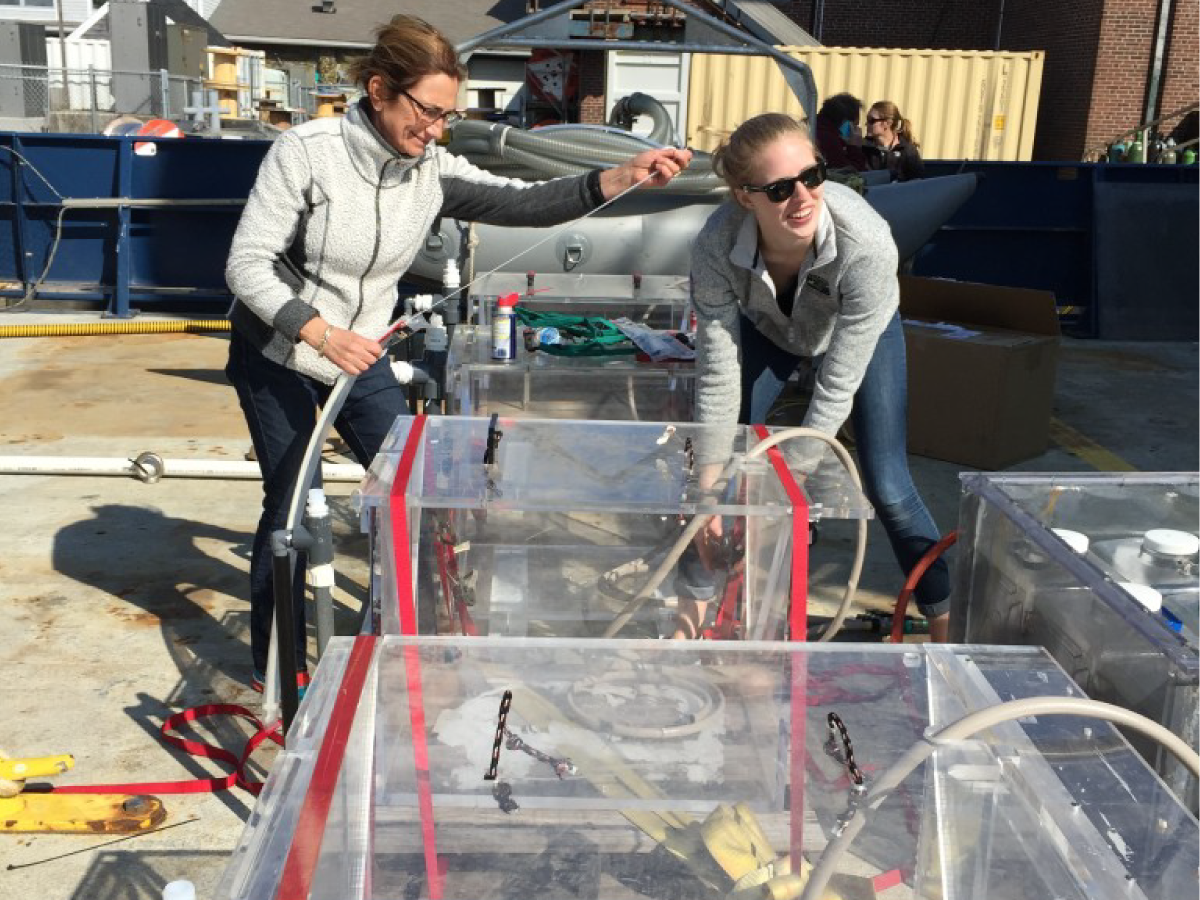
Françoise Morison (URI) and Caitlin Russell secure incubators used to measure phytoplankton growth rates. Credit: Stephanie Schollaert Uz (NASA)
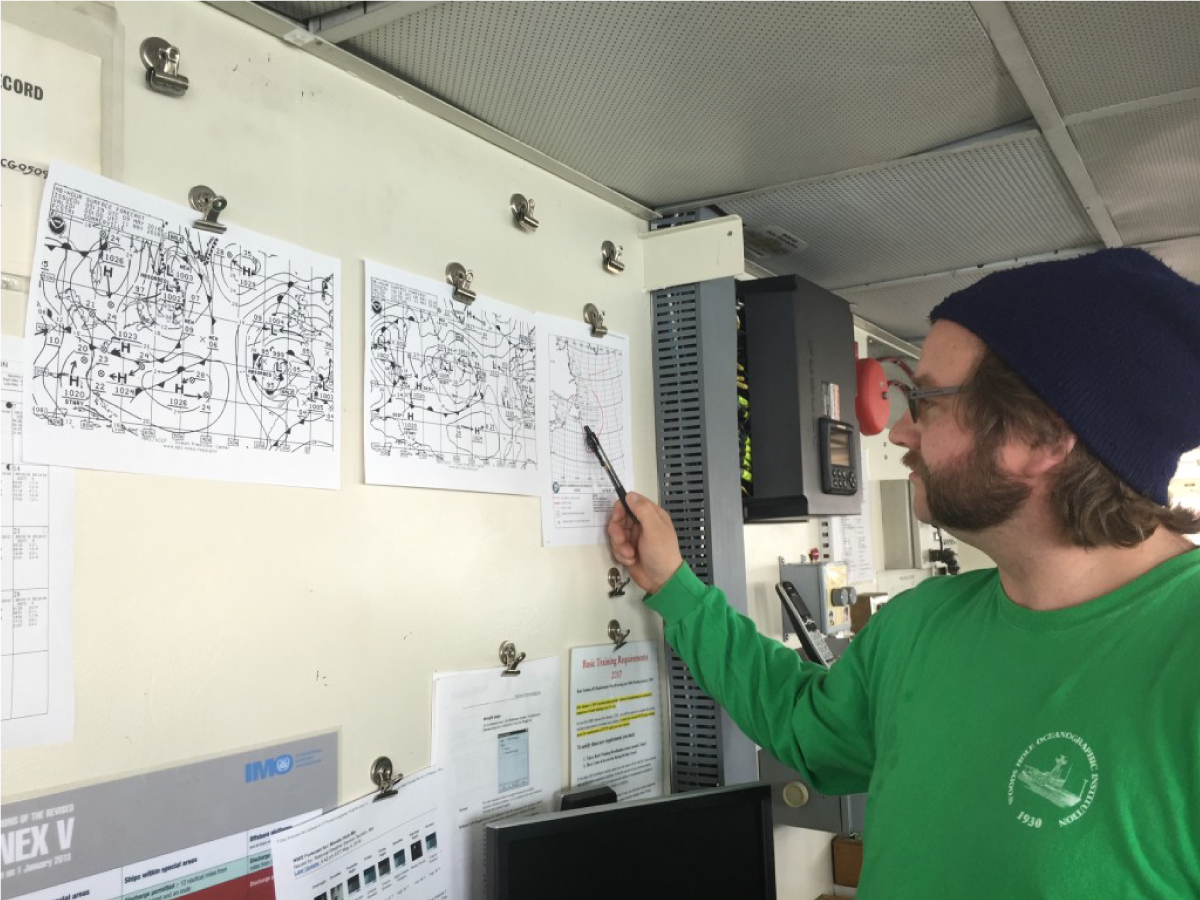
Logan Johnsen, navigator and second mate, studies the weather to plan the best route to the North Atlantic. Credit: Stephanie Schollaert Uz/NASA
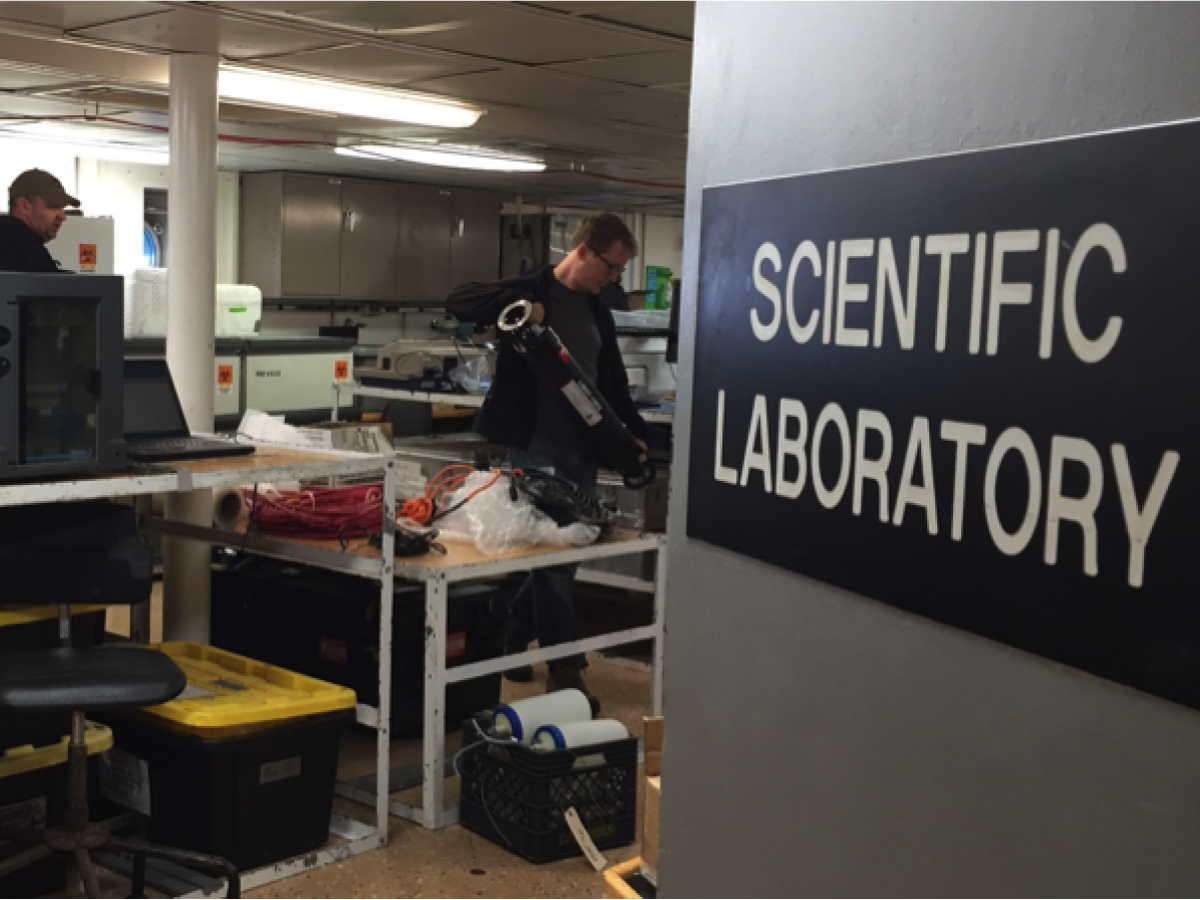
Aboard the R/V Atlantis, several cargo containers - assembled and outfitted to create a laboratory (shown here) - are used to test samples for biological, chemical and physical parameters. Credit: Michael Starobin (NASA)
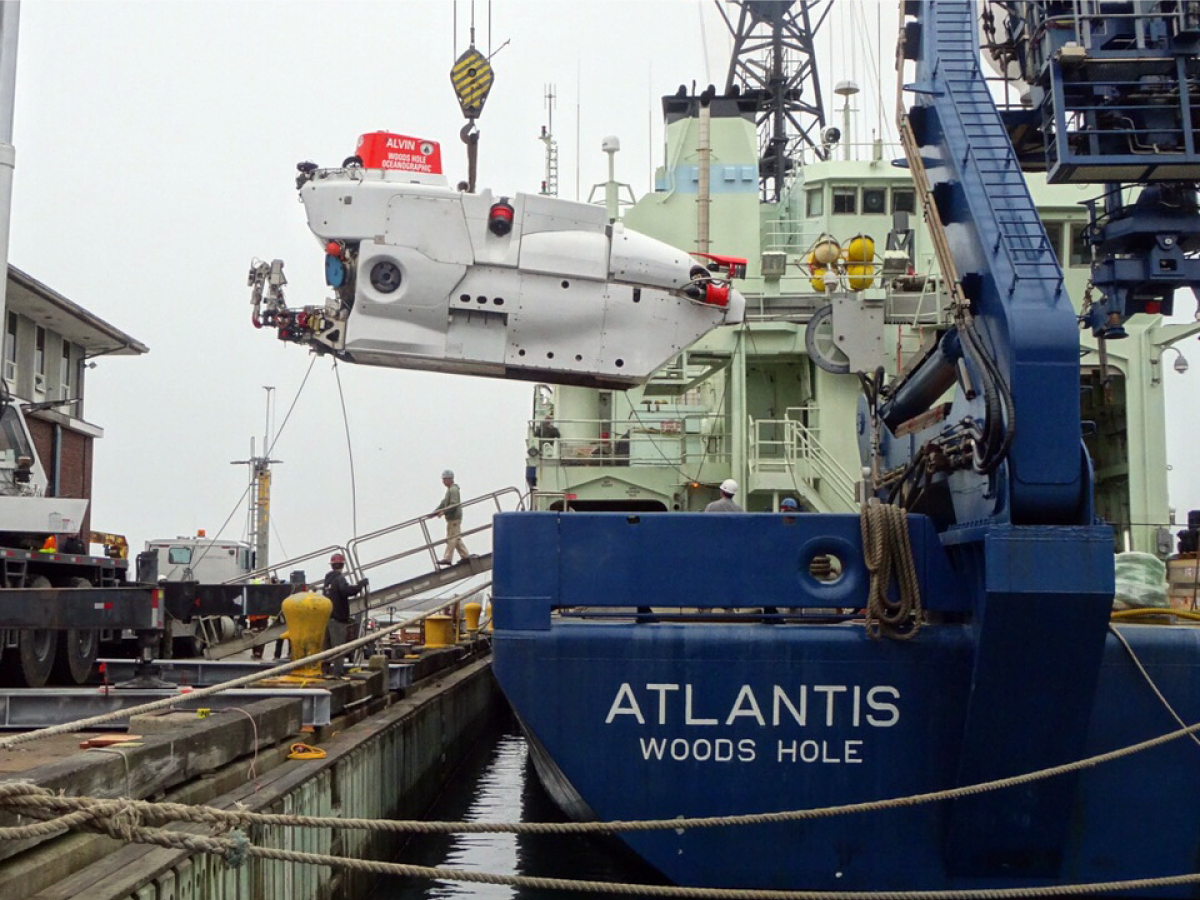
Alvin, a 3-person research submarine, is offloaded from the R/V Atlantis during preparation for NAAMES. Credit: Dick Pittenger (WHOI)
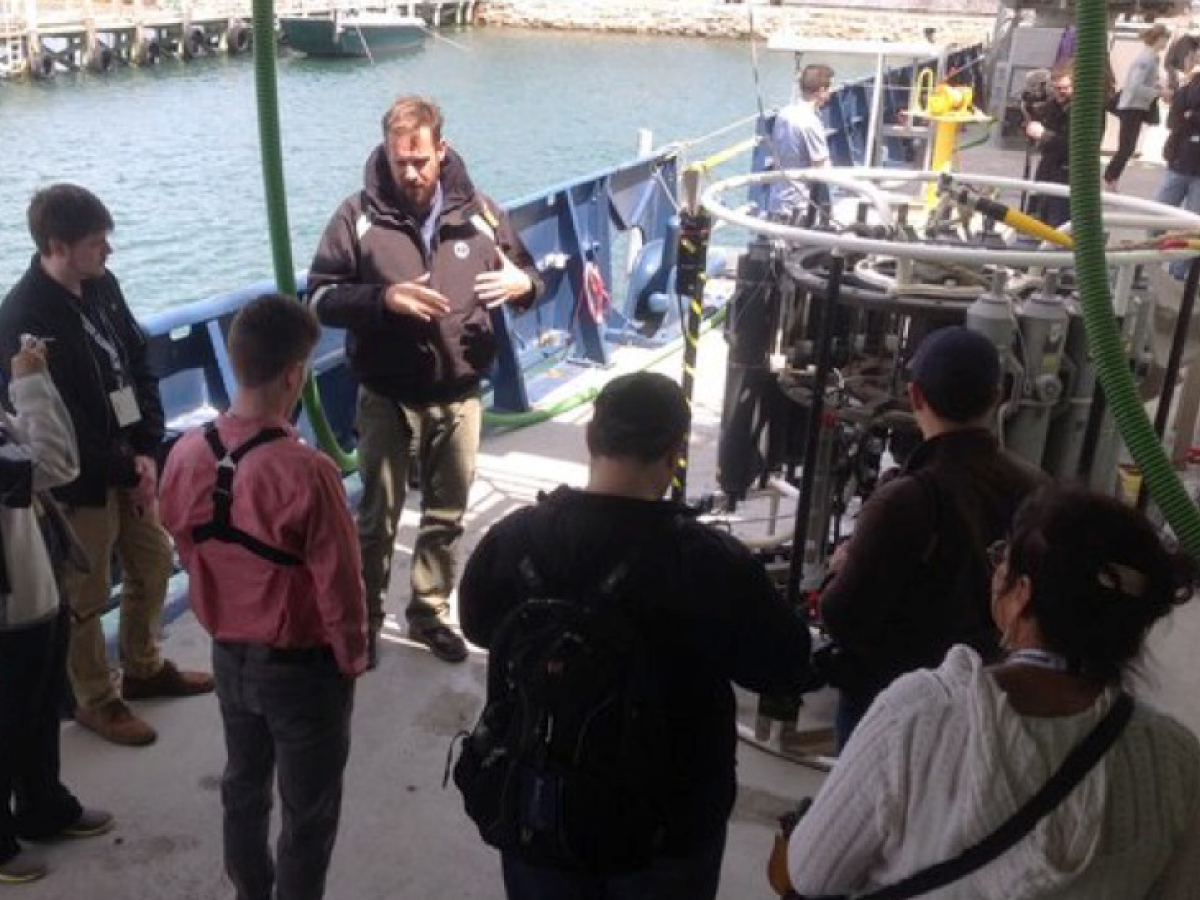
Oceanographer Peter Gaube describes the Conductivity, Temperature, and Depth (CTD) instrument, a cluster of sensors that generate a vertical profile of the water column. Credit: Stephanie Schollaert Uz (NASA)
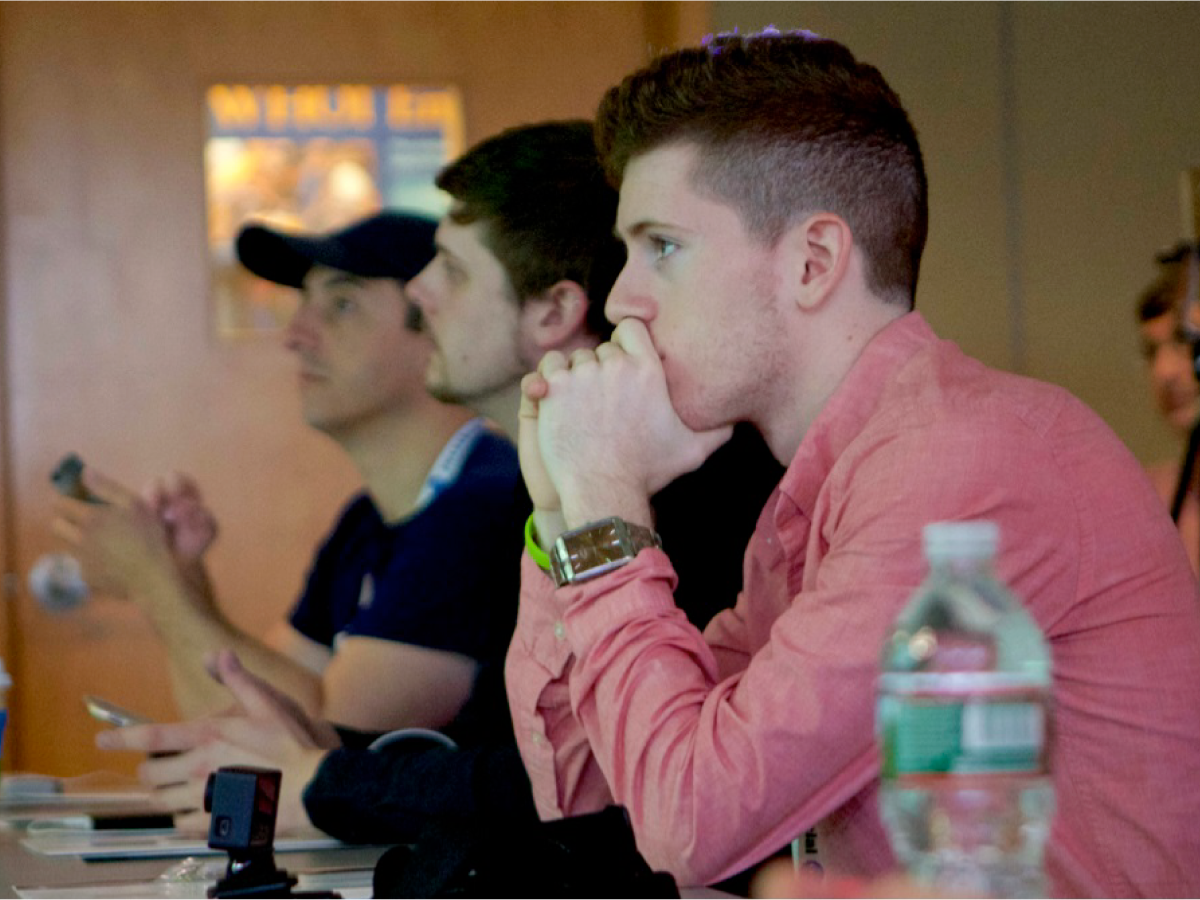
Bloggers from around the country listen to a presentation by Dr. Mike Behrenfeld (OSU). Credit: Michael Starobin (NASA)
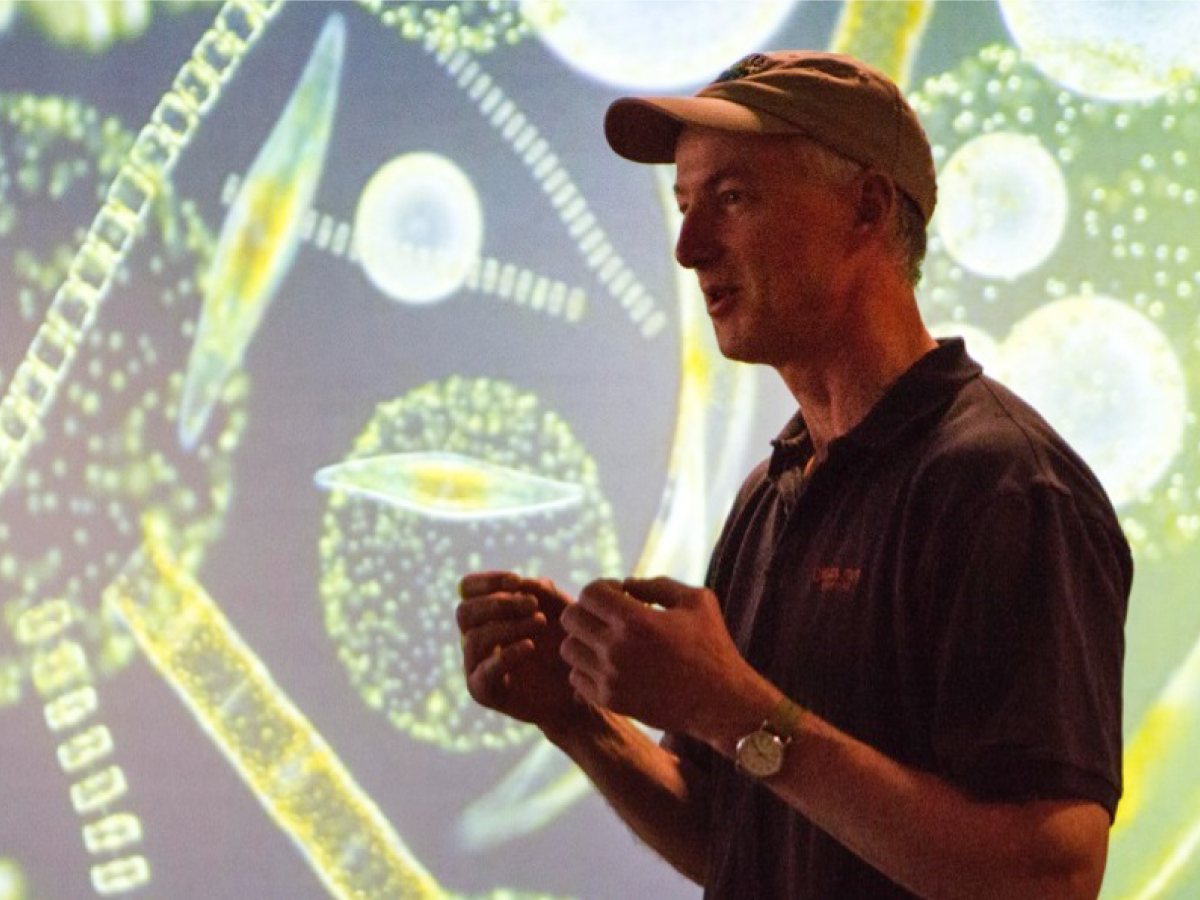
NAAMES Chief Scientist Mike Behrenfeld explains the importance of plankton for life on Earth. Credit: Michael Starobin (NASA)
On May 10, a dedicated group of 20 bloggers travelled to Woods Hole, MA to learn about the NAAMES field campaign. Credit: Michael Starobin (NASA)
Jason Graff (OSU) measures the carbon in phytoplankton and sorts species with a laser-based instrument. Credit: Stephanie Schollaert Uz (NASA)
Cleo Davie-Martin (OSU) measures volatile organic compounds (VOCs) emitted by phytoplankton. Credit: Stephanie Schollaert Uz (NASA)
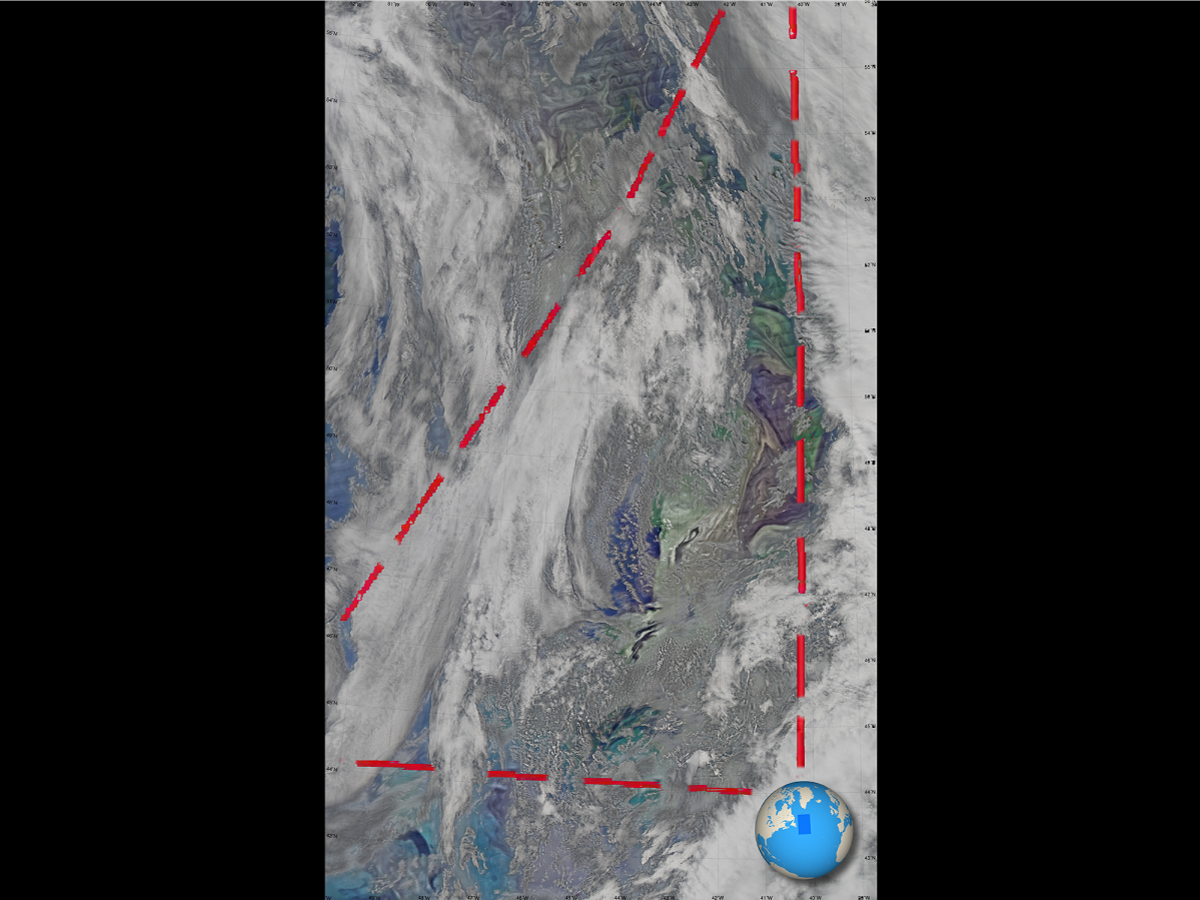
The R/V Atlantis cruise track (red dashes). Green seas indicate that phytoplankton are starting to bloom in the North Atlantic. Credit: Norman Kuring (NASA)
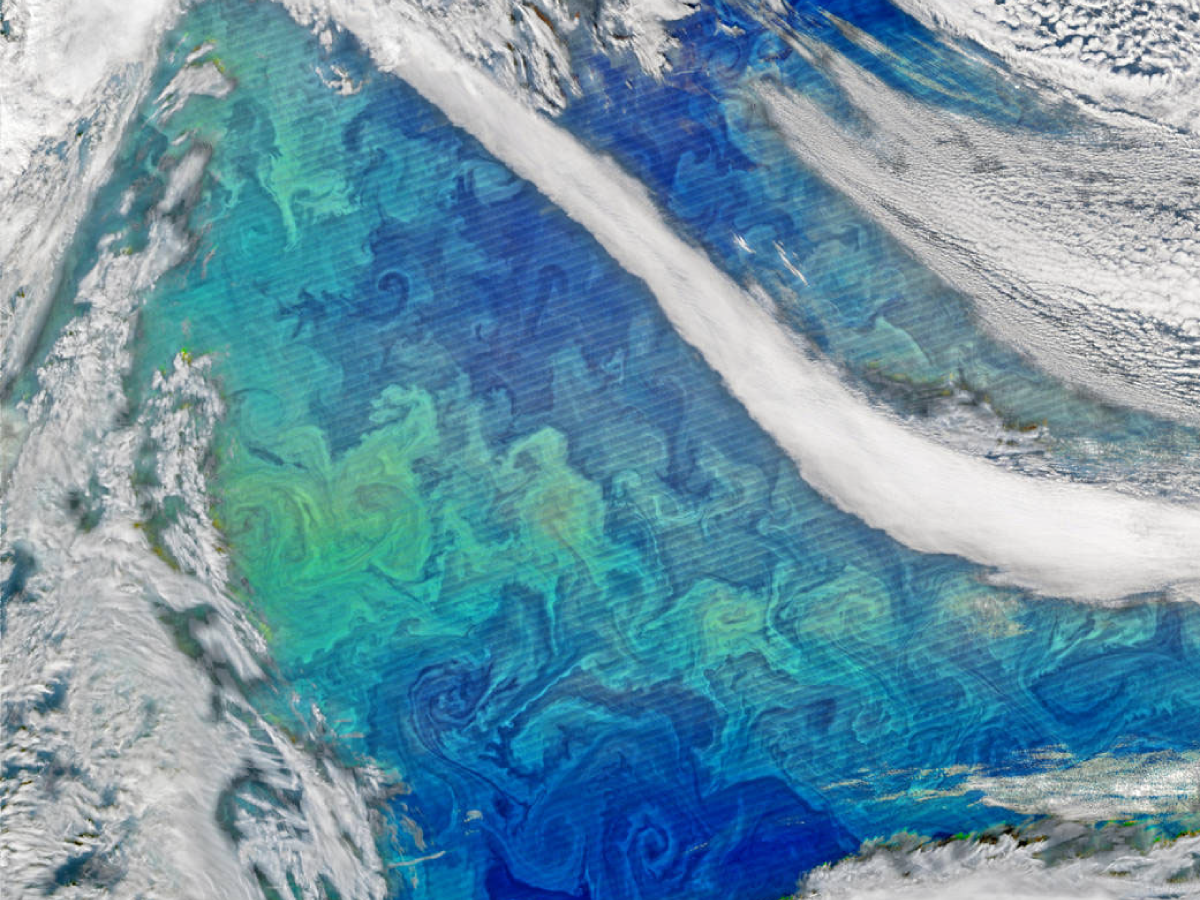
Every spring and fall, millions of microscopic plants bloom to color the North Atlantic with vivid strokes of blue, turquoise, green, and brown. NAAMES seeks to understand bloom processes for better ocean management and assessment of ecosystem change. Credit: Norman Kuring (NASA)
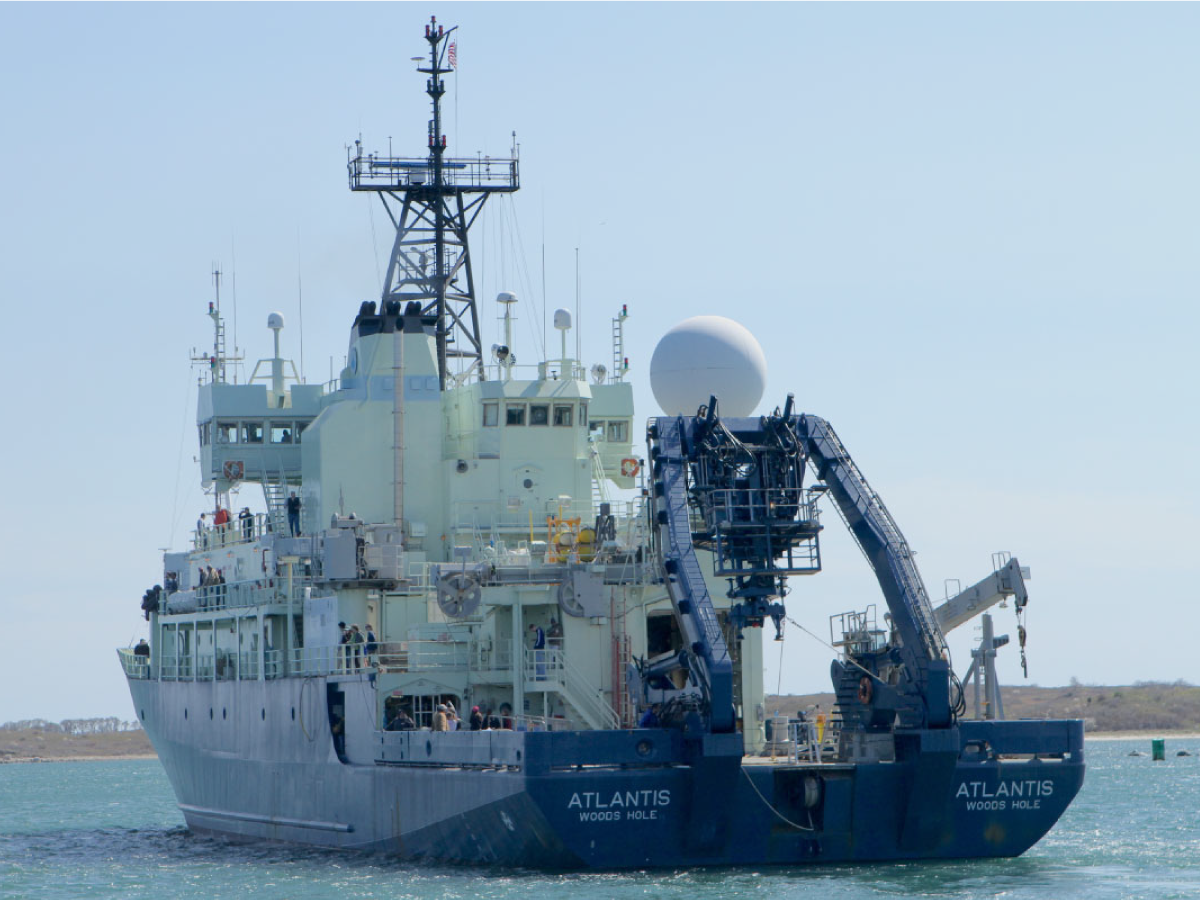
R/V Atlantis steams away from Woods Hole for a seasonal phytoplankton bloom in the North Atlantic. Credit: Michael Starobin (NASA)
The C-130, carrying airborne instrumentation, approaches Sable Island. Credit: Codey Barnett (NASA)
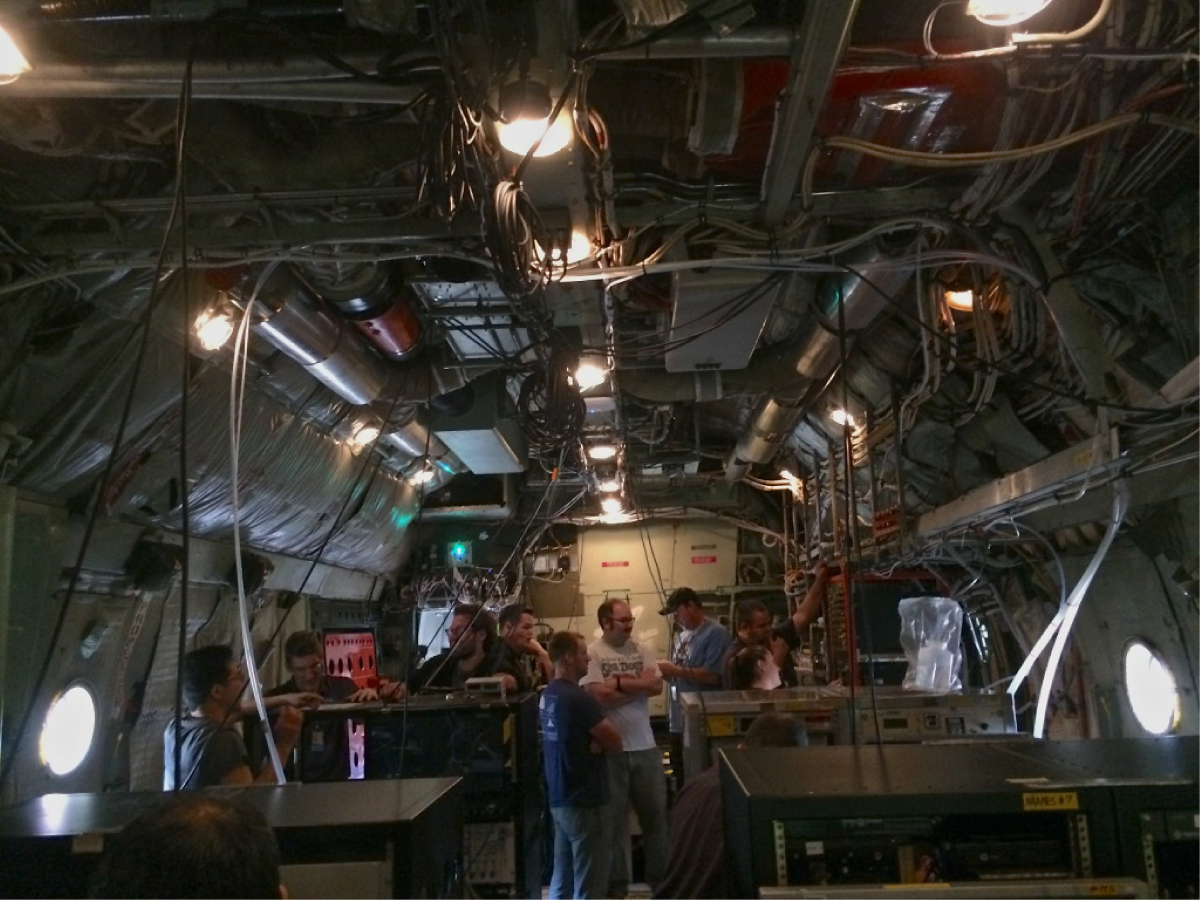
The NAAMES team prepares a C-130 for flight to St. John's International Airport, where it will rendezvous with the R/V Atlantis. Credit: Denise Wineberry (NASA)
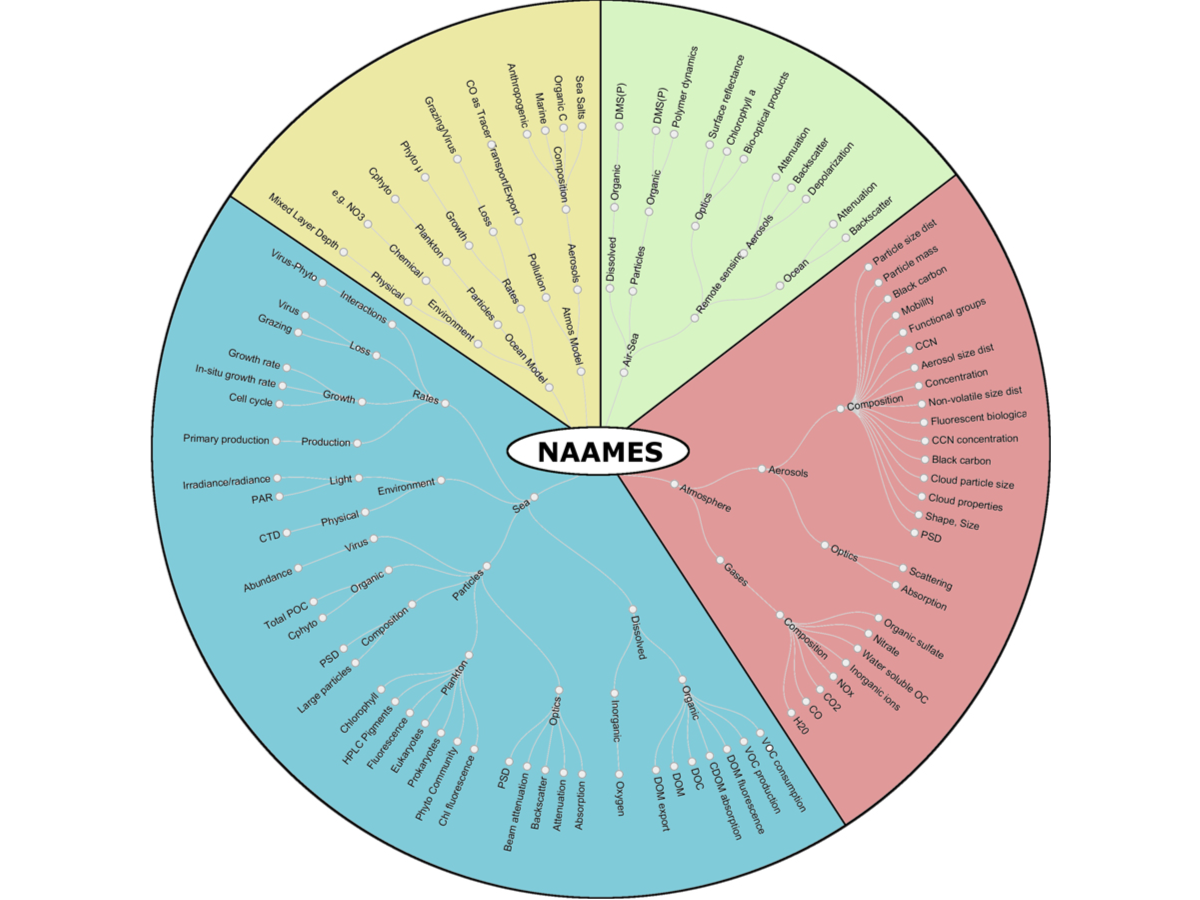
Dendogram illustrating the parameters that will be studied during the NAAMES field campaign.
NAAMES is a five-year investigation to resolve key processes controlling ocean system function, their influences on atmospheric aerosols and clouds and their implications for climate.
NAAMES Field Campaign VIEW ALL »