Chlorophyll Time Series

Credit: Figure updated from Franz et al., State of the Climate in 2014, Bulletin of the American Meteorological Society.
Download this image (PNG, 76.9 KB).
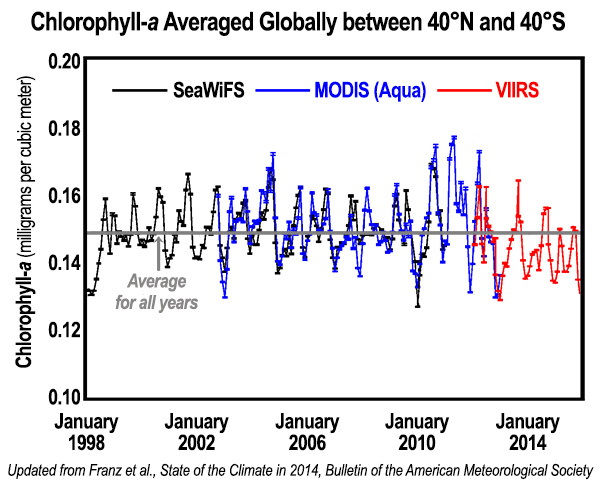
[02-Feb-16] An 18-year continuous record shows variation in average chlorophyll-a concentrations between 40°N and 40°S latitude. Measurements from SeaWiFS (1997-2010) are shown in black, MODIS (Aqua) from 2002-2012 are shown in blue, and VIIRS (2011-2014) are shown in red. An average for all years - approximately 0.15 milligrams per cubic meter - is indicated by the grey horizontal line.
This figure was updated from Franz et al., State of the Climate in 2014, Bulletin of the Meteorological Society.


