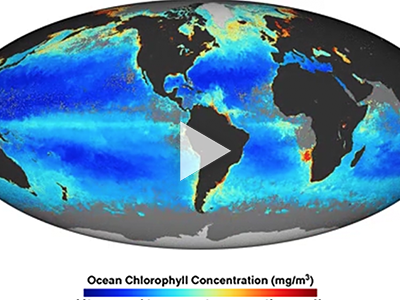
Ocean Chlorophyll Concentration (2009-2012)
[03-Jan-12] At the base of the ocean food web are single-celled algae and other plant-like organisms known as phytoplankton. Like plants on land, phytoplankton use chlorophyll and other light-harvesting pigments to carry out photosynthesis, absorbing atmospheric carbon dioxide to produce sugars for fuel. The presence of chlorophyll changes the way water reflects and absorbs sunlight, allowing scientists to map the amount and location of phytoplankton. These measurements give scientists valuable insights into the health of the ocean environment, and help scientists study the ocean carbon cycle.
These chlorophyll maps show milligrams of chlorophyll per cubic meter of seawater from 2009 to 2012 derived using data from the Moderate Resolution Imaging Spectroradiometer (MODIS) instrument onboard NASA's Aqua satellite. Places where chlorophyll amounts were very low, indicating very low numbers of phytoplankton are blue. Places where chlorophyll concentrations were high are red. Places where MODIS could not collect data, because of sea ice, polar darkness, or clouds, are light gray. The highest chlorophyll concentrations, where tiny surface-dwelling ocean plants are thriving, are found in cold polar waters or in places where ocean currents bring cold water to the surface.


