Jumbo Content

The Coastal Ocean from a Hyperspectral Perspective
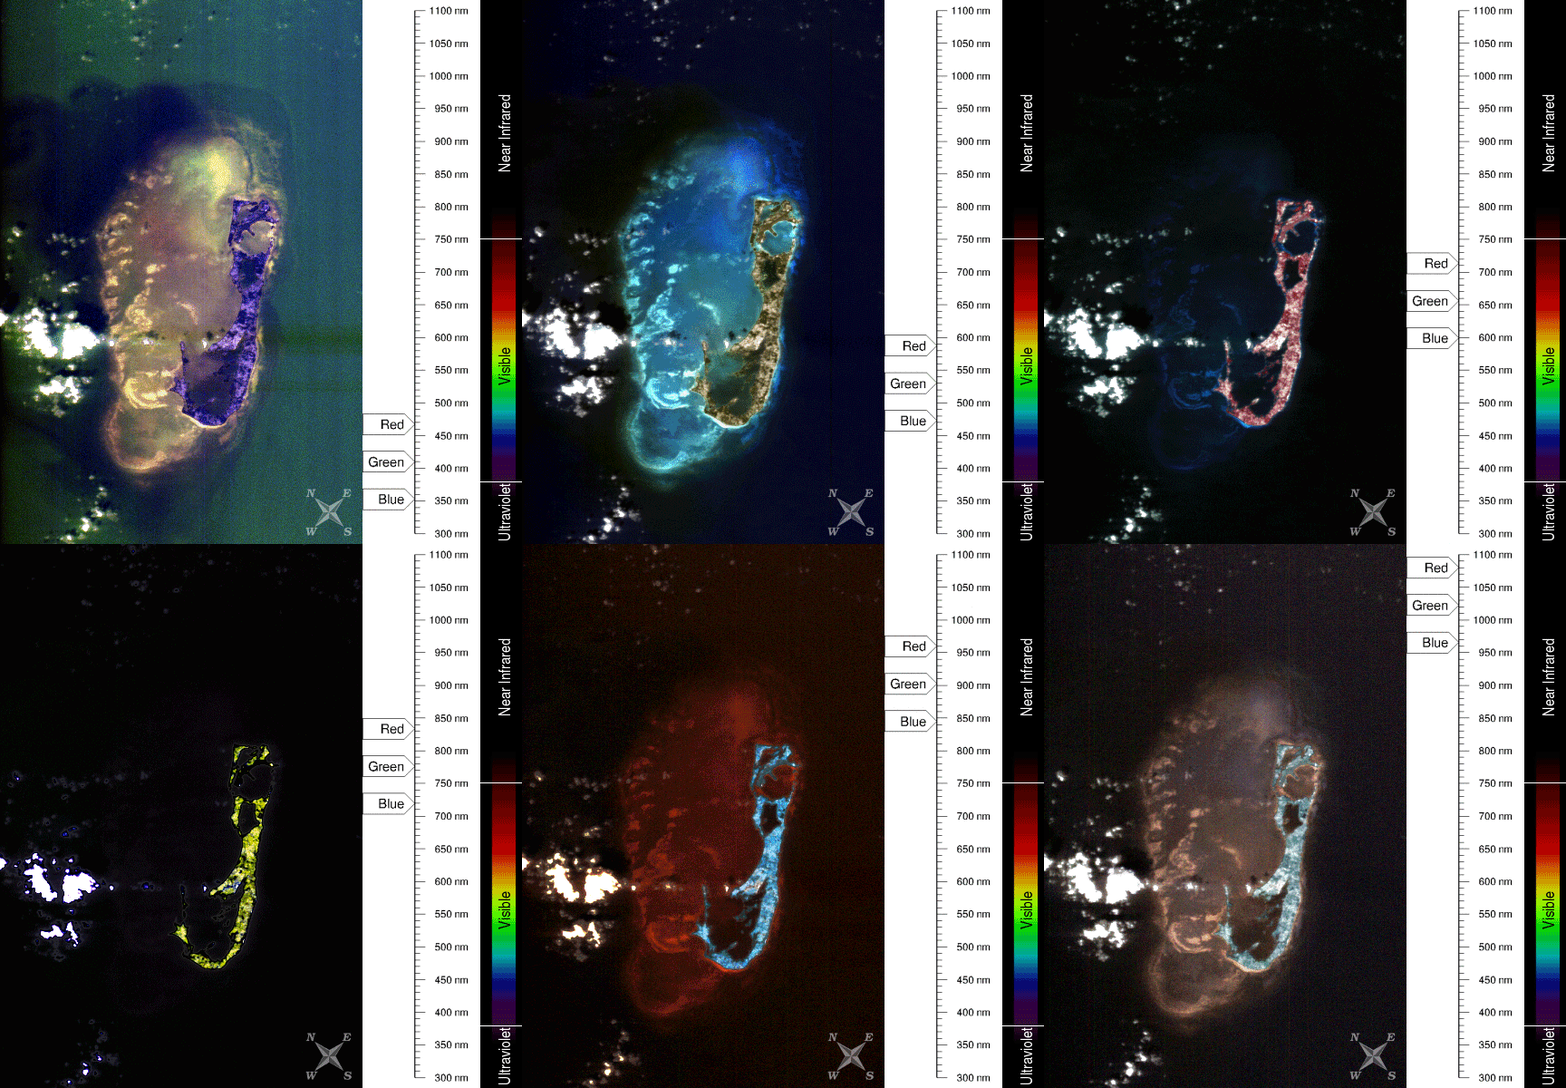

Hyperspectral measurements collected from orbit over <a href="https://www.google.com/maps/place/Bermuda/@32.3192793,-64.8366121,12z/data=!3m1!4b1!4m5!3m4!1s0x8a2d139e8668b0a5:0x3cdffdc72c99b8bc!8m2!3d32.3078!4d-64.7505">Bermuda</a> on August 17, 2013. The animation cycles through 128 channels - three at a time. The sliders on the right show which channels (represented by their central wavelength in nanometers) were used for the red, green, and blue components of each frame of the animation.
Credit: Norman Kuring (NASA). Download this image (GIF, 10.4 MB).
[09-Apr-19] The future of ocean-color research likely lies in hyperspectral measurements collected from orbit. Such measurements have been prohibitive in the past because of the large volume of data involved and because of the time needed to calibrate and process that volume. Technological advances in spacecraft, networks, and ground processing hardware and software are now, however, beginning to put remotely sensed hyperspectral measurements within the oceanographer's reach. NASA already is flying sensors like Hyperion and HICO as early demonstrations of this technology, and future missions involving hyperspectral sensors such as HyspIRI and PACE are currently being planned.

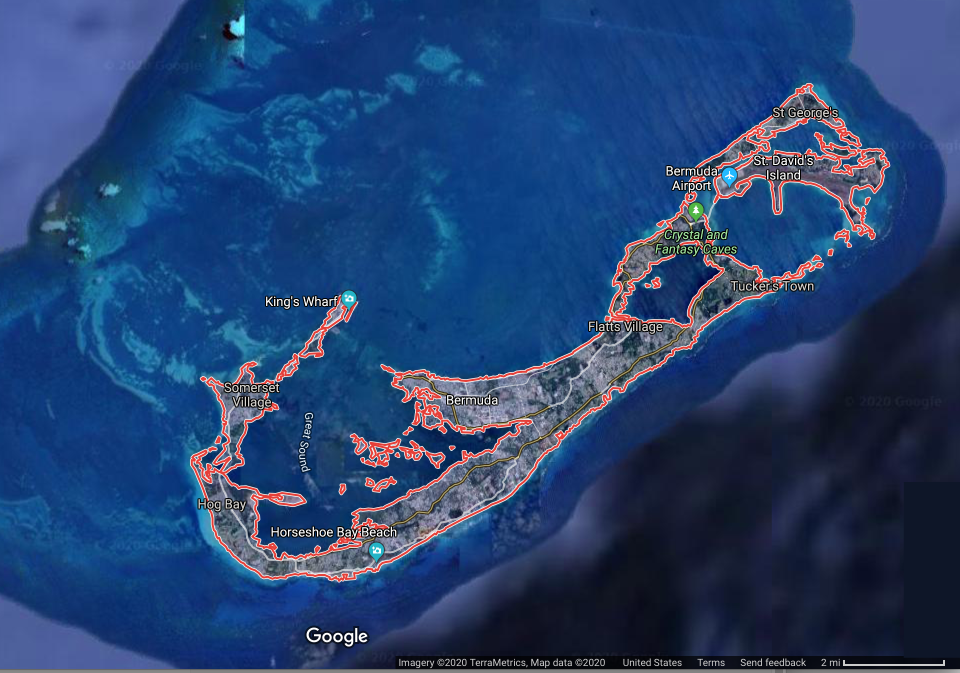
This animation was produced from a scene collected over Bermuda on August 17, 2013. It cycles through all 128 HICO channels - three at a time. The sliders on the right show which channels (represented by their central wavelength in nanometers) were used for the red, green, and blue components of each frame of the animation. No additional processing of the top-of-the-atmosphere radiances in the level-1B file was performed to make the images in the above animation other than some contrast stretching. Compare the animation with the still image of Bermuda from Google Maps (below).