Cyclone Courtney A 3D Cloud Bonanza
Four Ways to Visualize Storm Towers in Three Dimensions
(Yes, the 90s styling is intentional. Magic Eye stereograms and wiggle GIFs deserve a proper throwback aesthetic!)
Satellite cloud data typically comes to us as flat, two-dimensional images. We get a colorful map showing height values, but without much sense of the dramatic vertical structure these clouds possess. What if we could actually see these clouds in three dimensions? What if you could put on a pair of 3D glasses and watch storm towers leap off the screen toward you?
That's exactly what we're exploring here. Using PACE satellite data, we've created four different methods to visualize cloud top heights in three dimensions. Each approach uses a different perceptual trick to help your brain see depth in what is fundamentally a flat image. It's a wonderful blend of science, psychology, and a bit of optical illusion!
About Cyclone Courtney
Severe Tropical Cyclone Courtney formed north of Western Australia in late March 2025 and moved westward across the Indian Ocean. The system remained well offshore throughout its lifecycle, causing no impacts to the Australian mainland or island communities. PACE captured this scene on 2025-03-29 as Courtney intensified over open water.
 The Science Behind the Scenes
This data comes from NASA's PACE satellite, specifically the Ocean Color Instrument (OCI). PACE stands for Plankton, Aerosol, Cloud, and ocean Ecosystem. Clouds are a fundamental pillar of the mission, essential for understanding Earth's climate system. Clouds play a critical role in regulating energy balance, the water cycle, and interactions between the ocean, atmosphere, and ecosystems.
Understanding Cloud Height
Cloud heights reveal the dramatic structure of our atmosphere. Low stratus clouds hover around 1-2 km, forming those gray, uniform layers we associate with dreary days. Fair-weather cumulus clouds usually top out around 3-5 km. But the most dramatic features are storm towers: vertical columns of rapidly rising air that can reach 15+ km, punching through the troposphere into the stratosphere.
These towering structures are the powerhouses of severe weather systems. With updrafts exceeding 100 mph, they create the perfect environment for intense weather phenomena:
- Heavy rainfall and flooding
- Frequent lightning
- Large hail
- Strong winds and tornadoes
- Rapid hurricane intensification
Scene Statistics: Cloud heights in this scene range from 0.3 to 17.0 km, with 16.7 km of vertical variation. That represents a significant amount of atmospheric structure to work with!
Why Cloud Top Height Matters
When meteorologists analyze cloud heights, they're taking the pulse of weather systems. These measurements provide crucial insights into atmospheric processes:
- Weather forecasting: Tall clouds indicate strong updrafts and unstable conditions. When cloud tops suddenly reach above 12 km, it's a clear signal that intense weather is developing.
- Hurricane monitoring: The tallest towers in a hurricane's eyewall reveal where the storm is actively strengthening, often signaling intensification.
- Climate research: High clouds interact with Earth's energy balance differently than low clouds, affecting how much heat is trapped or reflected back to space.
- Aviation safety: Commercial aircraft need to avoid these tall convective systems due to severe turbulence, icing, and lightning hazards.
PACE observes these structures with impressive 1 km resolution at nadir (the point directly below the satellite), allowing us to track individual storm cells and their evolution from 676 km above Earth.
How We Measure Cloud Height from Space
Determining the height of clouds from a satellite might seem impossible, but PACE uses an elegant principle based on oxygen absorption.
Earth's atmosphere contains approximately 21% oxygen (O2), and this percentage stays constant from the surface up through the troposphere. Oxygen molecules absorb sunlight at specific colors, particularly in the deep red portion of the spectrum in what scientists call the oxygen A-band. This is light that's just barely visible to the human eye, at the far red edge before it becomes infrared. When sunlight reflects off a cloud and travels back to the satellite, it passes through the oxygen above the cloud, where some of that red light gets absorbed.
Here's the key: the higher the cloud, the less oxygen above it to absorb the light. A towering storm cloud at 15 km has very little atmosphere above it, so oxygen absorption is weak and the satellite sees a bright signal in those red colors. A low cloud at 2 km has most of the atmosphere above it, resulting in strong oxygen absorption and a dimmer signal in the same colors.
The CHROMA algorithm (Cloud Height Retrieval from O2 Molecular Absorption) compares brightness in colors where oxygen absorbs strongly versus nearby colors where it doesn't absorb at all. By measuring this difference, the algorithm calculates how much oxygen was above the cloud and therefore determines the cloud's altitude.
This technique works remarkably well because oxygen is uniformly mixed in the atmosphere. Unlike water vapor, which varies dramatically from place to place, we know exactly how much oxygen should be at each altitude. This makes O2 an ideal atmospheric "ruler" for measuring cloud heights.
Eight OCI channels in the deep red portion of the spectrum capture this absorption signature with enough detail to achieve the mission goal: determining cloud top pressure within ±60 millibars (roughly ±500 meters in height) for 65% of optically thick clouds globally.
 The Reference Image
Let's start with the traditional view: a straightforward 2D representation of our data. Lighter colors indicate higher clouds, while darker colors represent lower clouds or clear areas. This is what we're working with before we apply any 3D visualization techniques.
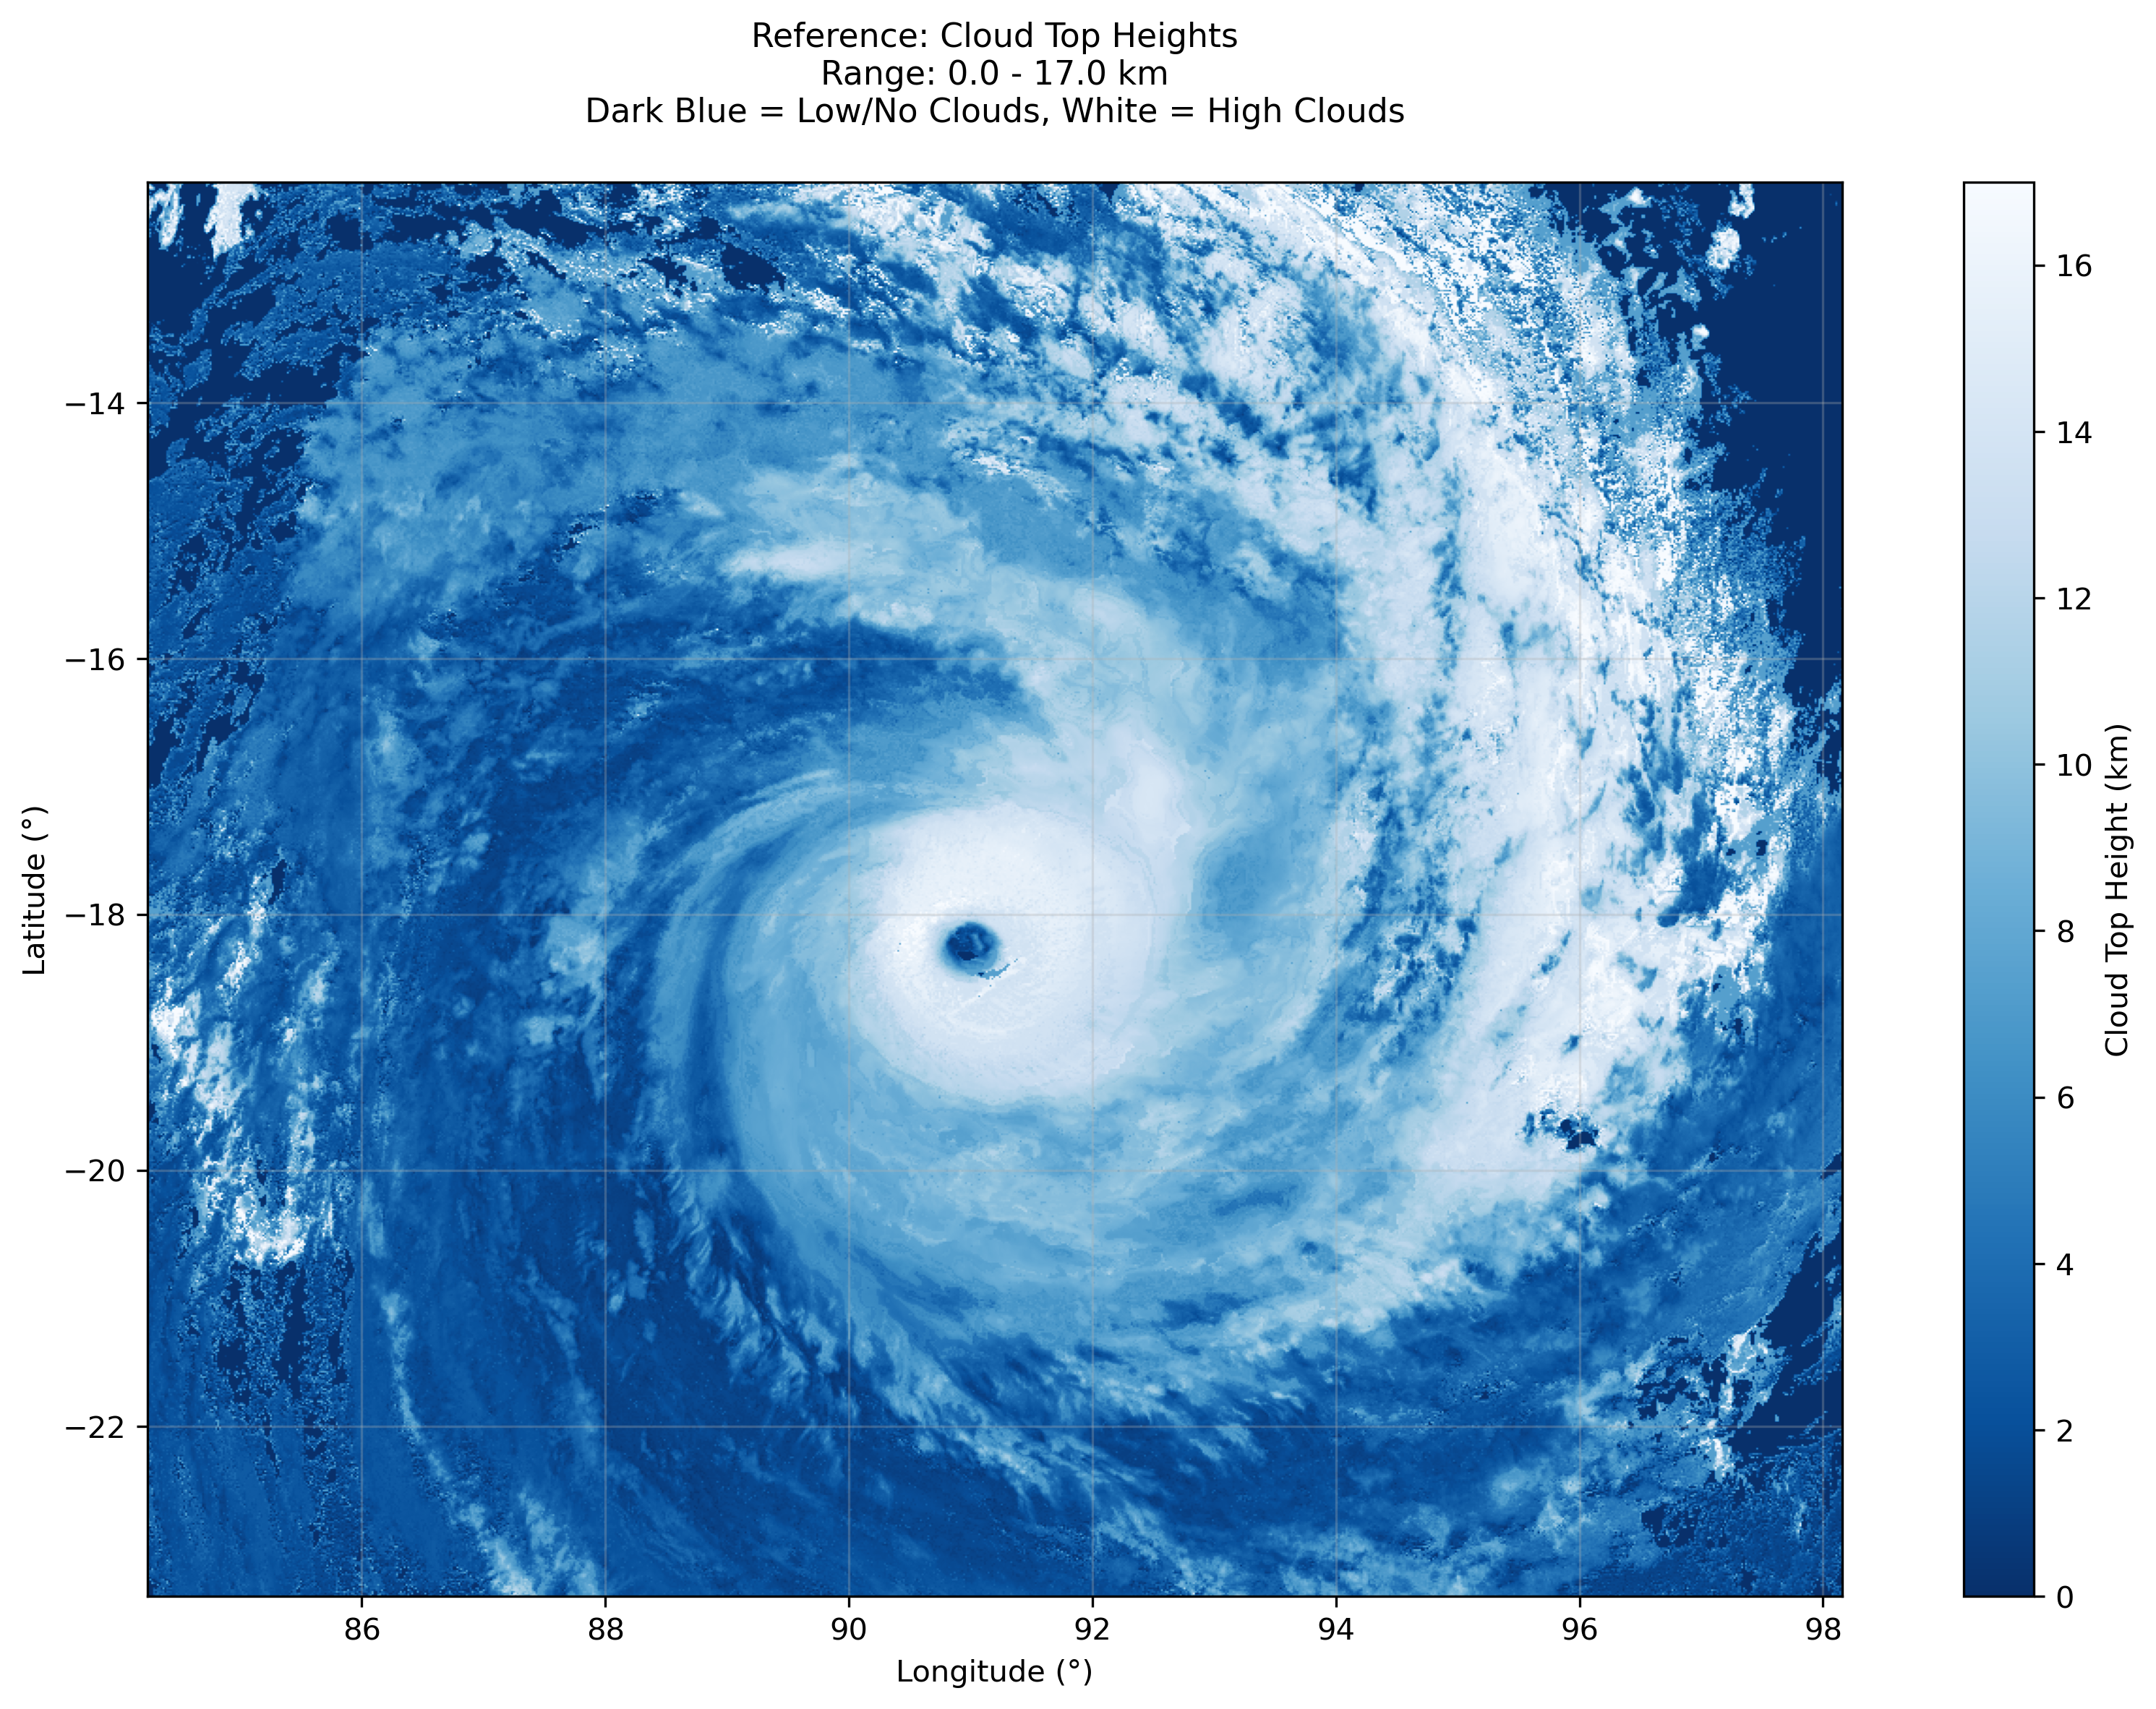
Traditional 2D visualization. Notice the bright white regions: those are our tallest storm towers.
 Method 1: Red-Cyan Anaglyph
This technique has been around since the 1850s and remains one of the most effective ways to create a stereoscopic 3D effect. It works by presenting slightly different images to each eye, mimicking how your eyes naturally perceive depth.
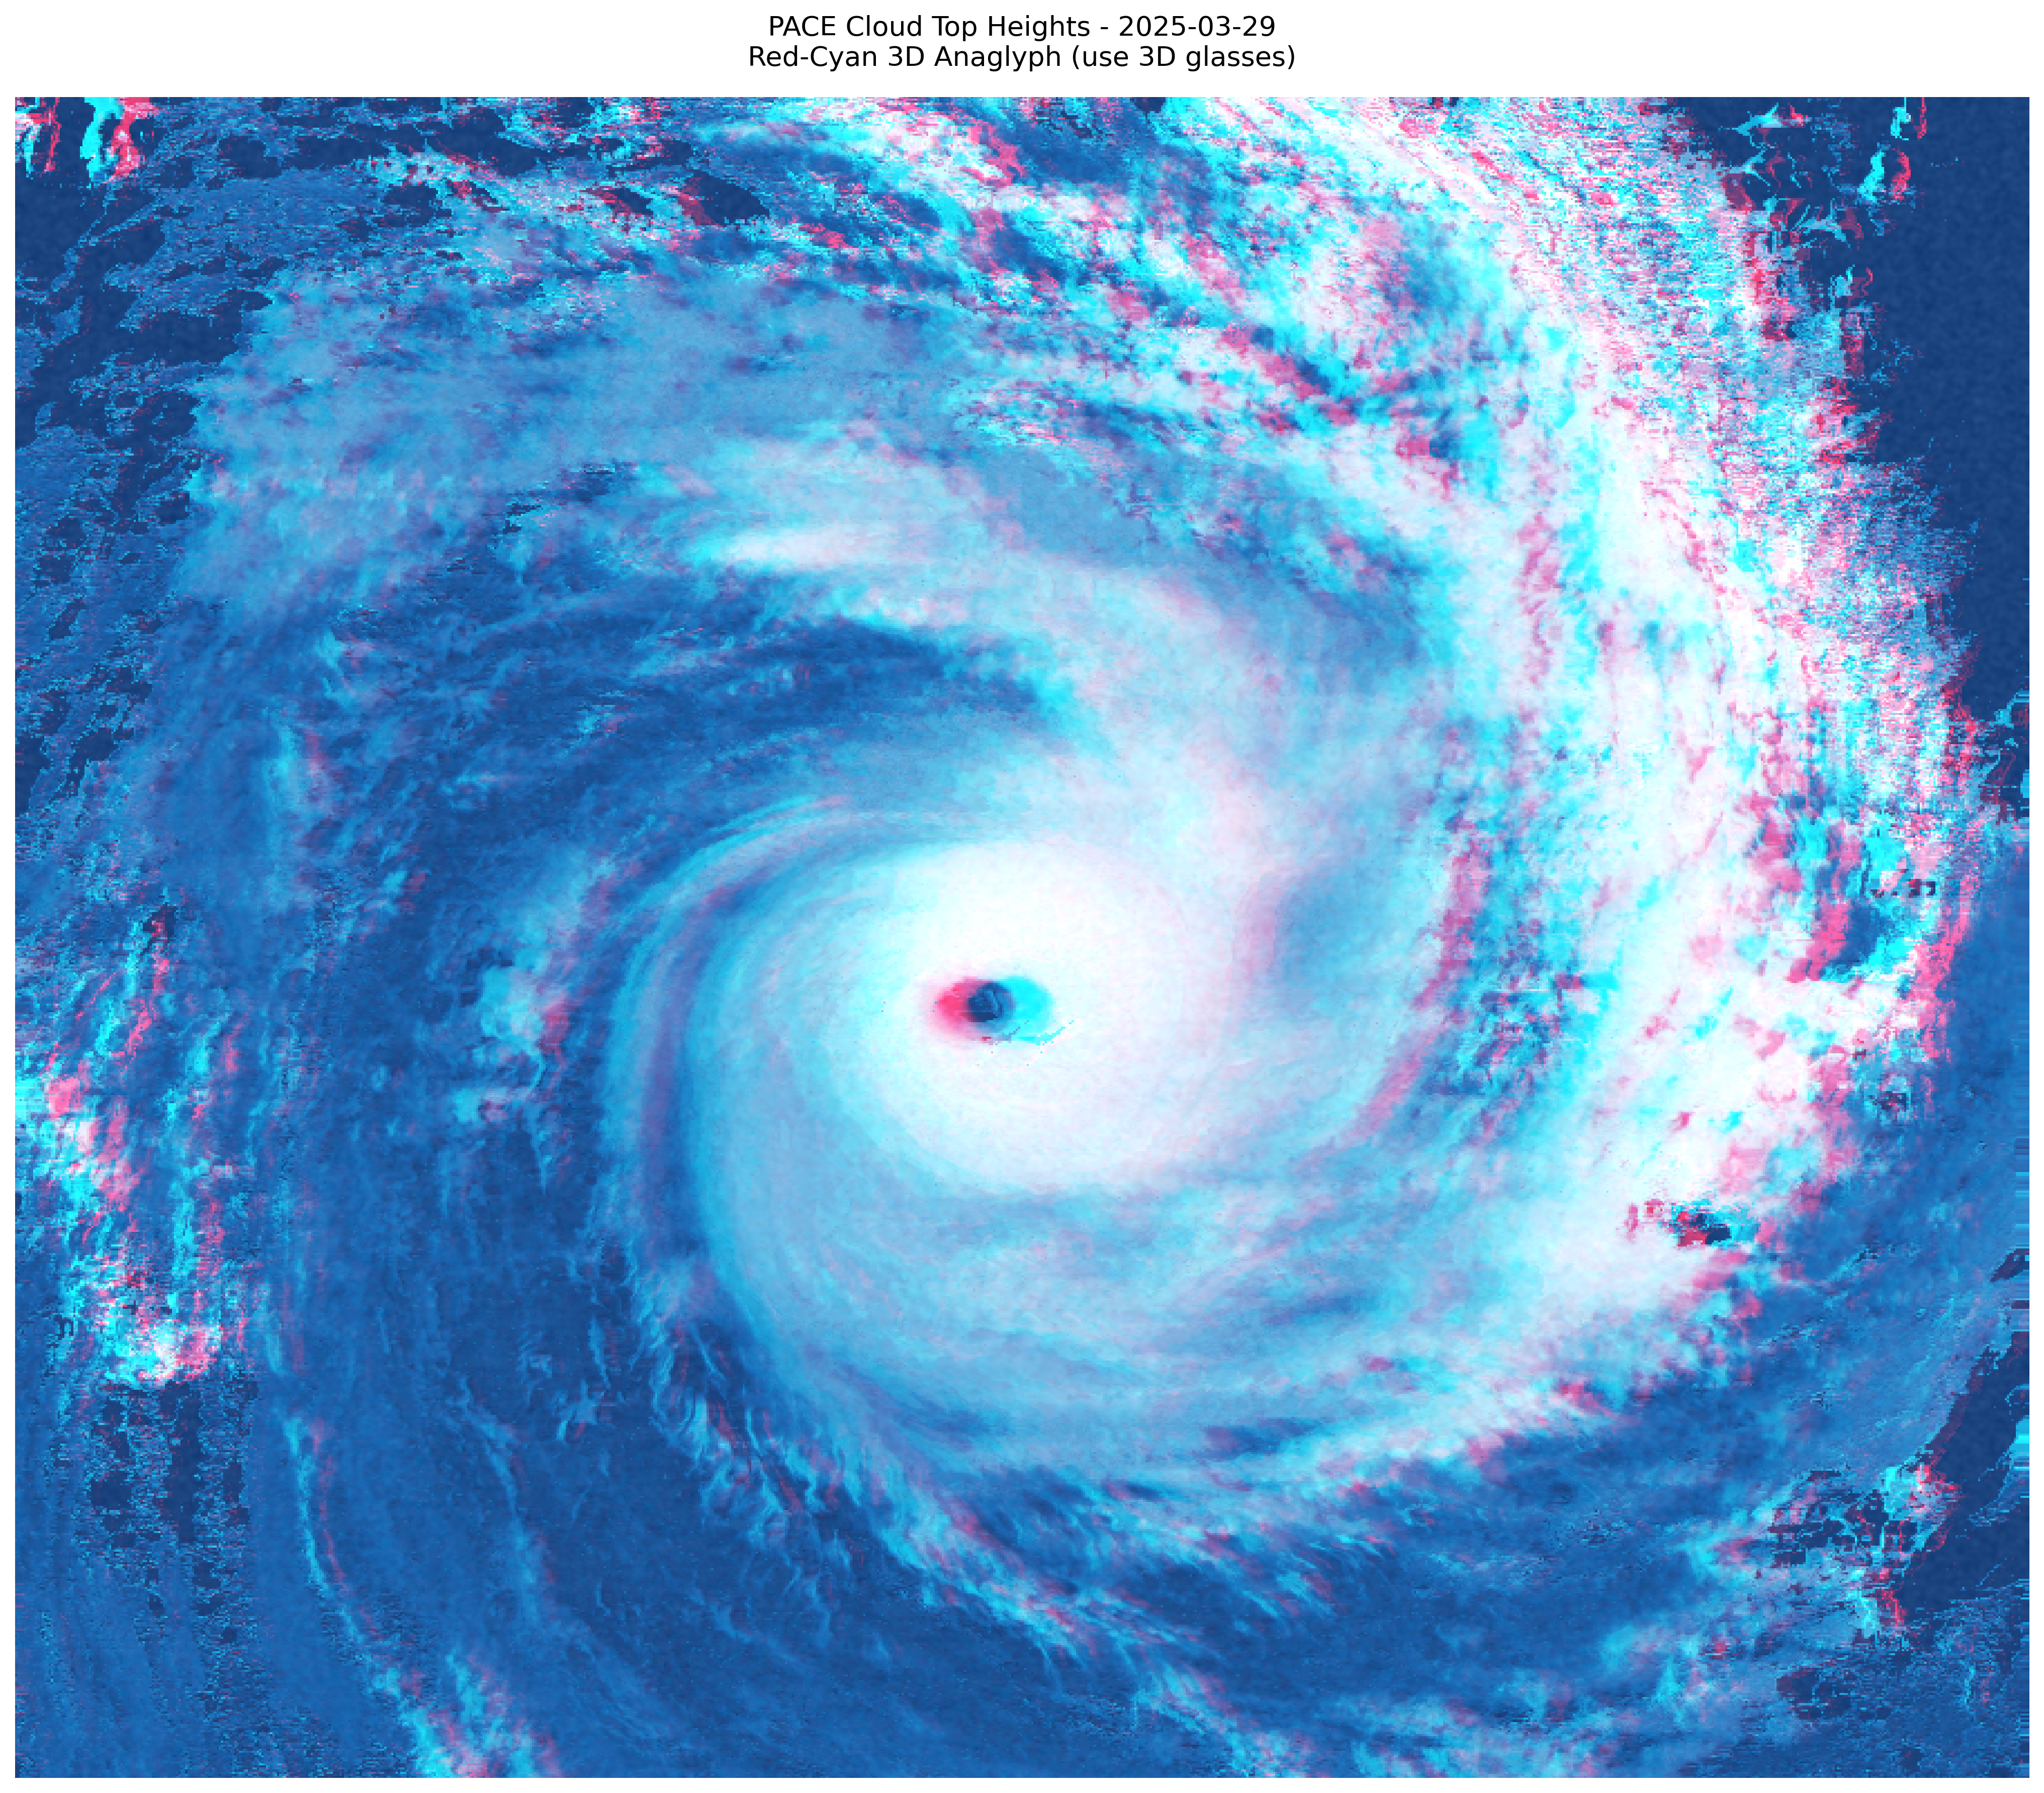
View with red-cyan glasses (red lens on left eye) to see the storm towers emerge in three dimensions.
Viewing Instructions:
- Obtain red-cyan 3D glasses, or you can construct your own using red and cyan cellophane
- Position the red lens over your left eye and the cyan lens over your right eye
- The tallest storm towers should appear to project forward, closer to you
- Lower clouds will appear to recede into the distance
This method works because we're showing slightly offset views to each eye, essentially what your eyes see naturally when observing real three-dimensional objects. Your brain automatically fuses these two images, and the result is a powerful sense of depth. The height difference between a 15 km storm tower and a 2 km cloud deck becomes immediately apparent.
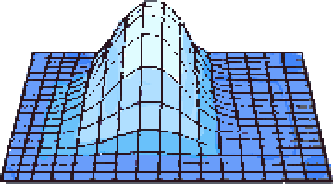 Method 2: Interactive 3D Surface
This approach creates a fully navigable three-dimensional model that you can explore from any angle. Think of it as being able to fly around the cloud system in a small aircraft, observing the structure from all sides.
Click and drag to rotate the view, scroll to zoom, and double-click to reset. Notice how the storm towers dominate the landscape.
This interactive visualization renders a three-dimensional surface right in your web browser. No special equipment is needed, just your mouse or touchscreen. The vertical scale is exaggerated somewhat (otherwise the clouds would appear quite flat relative to their horizontal extent), but this exaggeration actually helps reveal the structure we're interested in.
Here's a suggestion: try rotating the view to observe it from the side. From that perspective, you can really appreciate how these storm towers rise like atmospheric skyscrapers above the surrounding cloud deck.
 Method 3: Wiggle Animation
This clever technique requires no special glasses or equipment. Just your eyes and your brain's natural depth perception abilities. The animation creates the illusion of depth through something called motion parallax.
The wiggle effect makes tall storm towers shift dramatically while lower clouds barely move. That's motion parallax at work.
This is sometimes called a "wiggle stereogram," and it exploits an important depth cue called motion parallax. When you move your head (or when a viewpoint moves), objects that are closer to you appear to shift more than objects that are farther away. Your visual system is highly attuned to this pattern, so even though this is just a 2D animation, your brain can't help but interpret the differential motion as depth.
Watch carefully as the animation plays: the tall storm towers shift significantly, while low-level clouds barely move at all. That difference in apparent motion is what creates such a convincing 3D effect.
An added benefit: this works on any device and is perfect for sharing on social media or in presentations!
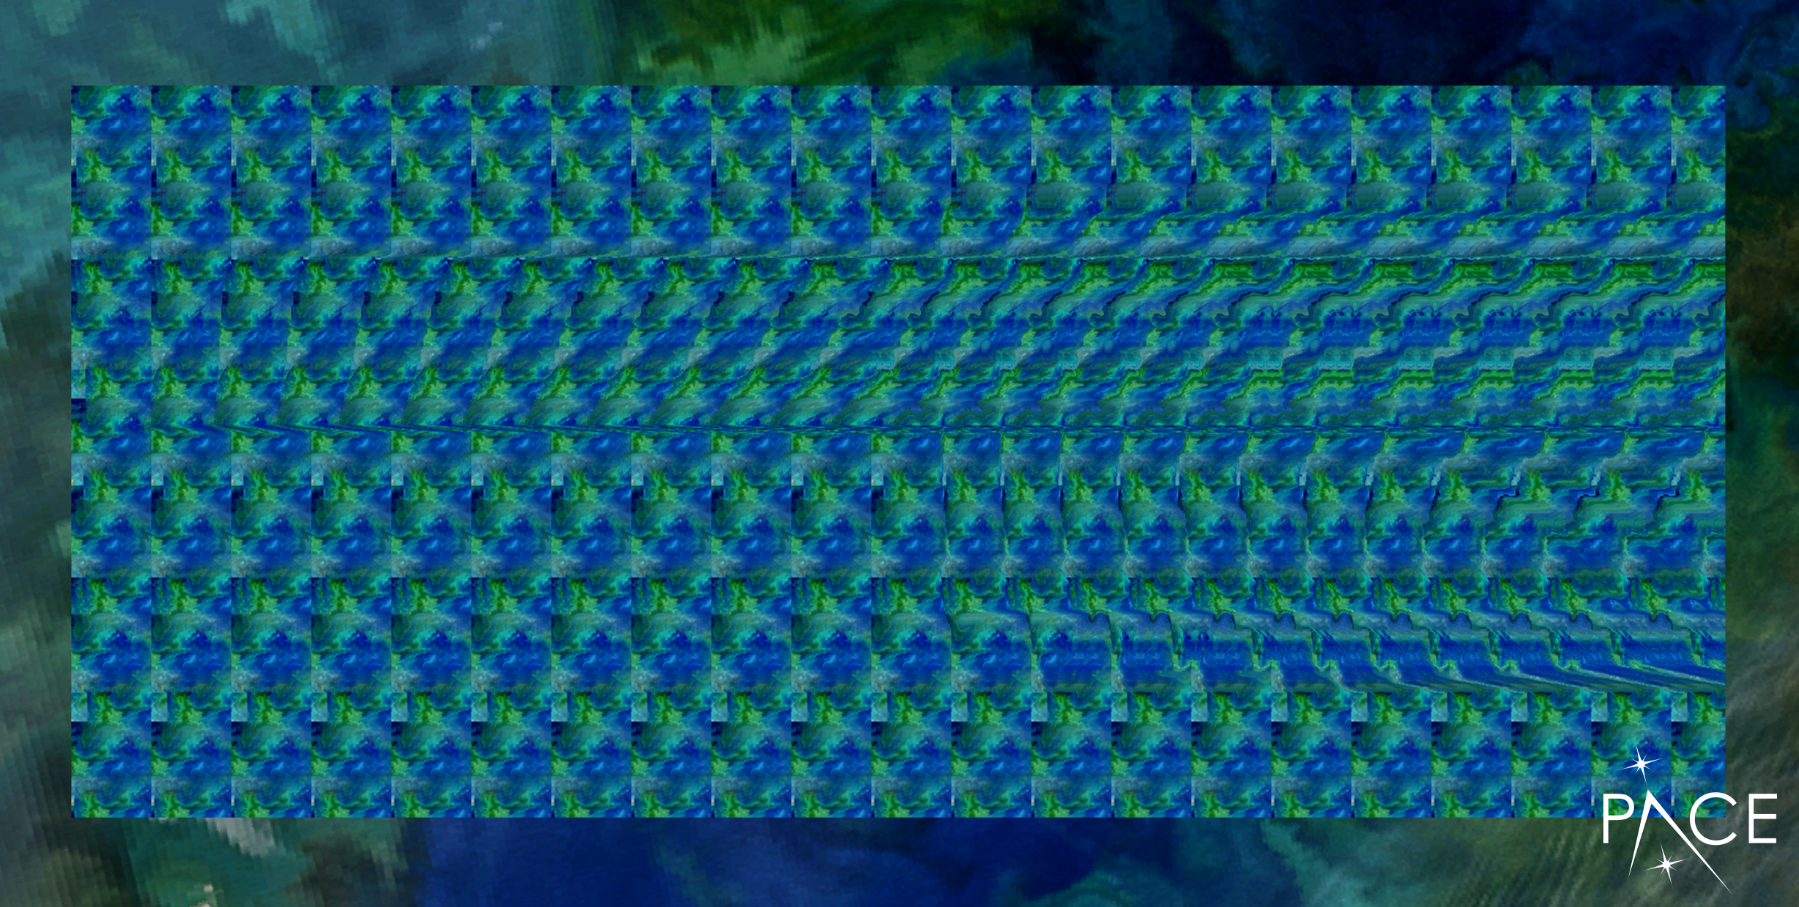
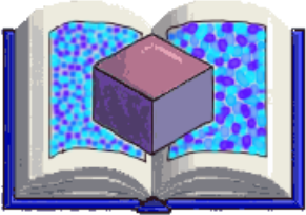 Method 4: Magic Eye Stereogram
If you remember the "Magic Eye" posters popular in the 1990s, this uses the same principle. The technique, called autostereography, encodes depth information into a repeating pattern. When viewed correctly, your brain fuses these patterns to reveal hidden 3D structure.
Viewing Instructions:
- Position your face very close to the screen (nearly touching it)
- Relax your eyes as if you're looking at something far in the distance, beyond the screen
- Slowly move your head backward while maintaining that relaxed, distant focus
- Be patient. This can take 30-60 seconds of practice to achieve
- When it "clicks," you'll suddenly see the 3D structure emerge from the pattern
Practice First!
New to Magic Eye stereograms? Try this practice image first! It contains the PACE satellite hidden in 3D. Once you can see it, you'll be ready to tackle the cyclone visualization below.
Practice stereogram with the PACE satellite. Perfect your technique here before moving to the cyclone data!
With practice, you'll see the storm towers rise dramatically out of the repeating pattern.
This technique takes some practice, and not everyone finds it easy to master. But when it works, the effect is quite magical. The stereogram encodes depth by carefully controlling the horizontal spacing of pattern elements based on the cloud heights.
 Scientific Insights from 3D Cloud Observations
These 3D visualizations aren't just visually striking. They provide valuable insights into the physical processes occurring inside powerful storm systems like Cyclone Courtney.
Cloud top height reveals what's happening deep within storms. Those tall towers reaching 12-15 km mark regions where ice particles are actively forming and precipitation is developing. Their spatial pattern, so clear in 3D, shows how the cyclone is organized and where the heaviest rain is likely falling.
PACE's unique combination of sensors provides unprecedented information: OCI measures cloud height while two advanced polarimeters, HARP2 and SPEXone, reveal cloud droplet size, particle shape, and ice crystal properties by measuring how sunlight is polarized. Together with PACE's aerosol measurements, scientists can connect atmospheric particles to cloud formation and precipitation patterns, improving predictions of when and where heavy rain will occur and how storms might change in a warming climate.
From flat satellite data to immersive three-dimensional experiences, these visualization techniques remind us that how we present scientific information matters just as much as the data itself. Each method reveals something unique about Cyclone Courtney's structure, and together they paint a complete picture of the atmospheric dynamics at play.
The next time you see a weather satellite image, remember: behind that flat view lies a dramatic three-dimensional world of towering storm systems, each one a testament to the incredible power and complexity of Earth's atmosphere.