Global Transport of Smoke from Australian Bushfires
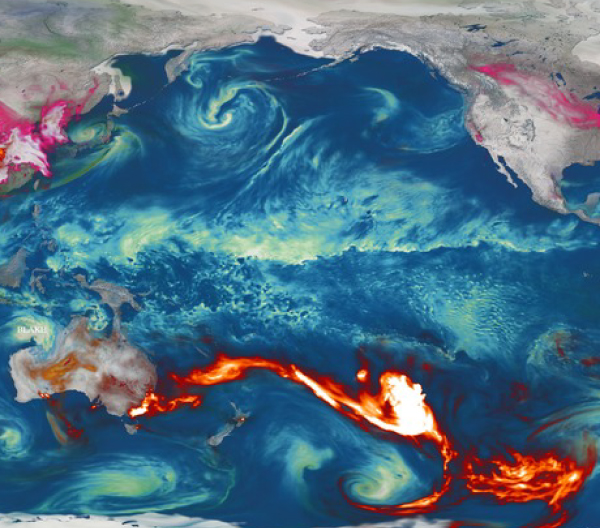
Global distribution of aerosols released by Australian bushfires (Dec. 2019 - Jan. 2020). Different aerosol species are highlighted by color, including dust (orange), sea-salt (blue), nitrates (pink), sulfates (green), and carbon (red), with brighter regions corresponding to higher aerosol amounts. Credit: NASA’s Goddard Space Flight Center. Download this movie.
Different aerosol species are highlighted by color, including dust (orange), sea-salt (blue), nitrates (pink), sulfates (green), and carbon (red), with brighter regions corresponding to higher aerosol amounts. NASA's MODIS observations constrain regions with biomass burning as well as the aerosol optical depths in GEOS, capturing the prominent bushfires in Australia and transport of emitted aerosols well downstream over the South Pacific Ocean. Weather events including Hurricane Dorian in August–September 2019 and other tropical cyclones around the world, along with major fire events in South America and Indonesia in August - September 2019 are also shown.
The local impacts of the Australian bushfires have been devastating to property and life in Australia while producing extreme air quality impacts throughout the region. As smoke from the massive fires has interacted with the global weather, the transport of smoke plumes around the globe have accelerated through deep vertical transport into the upper troposphere and even the lowermost stratosphere, leading to long-range transport around the globe.
Global distribution of aerosols released by Australian bushfires (Dec. 2019 - Jan. 2020). Different aerosol species are highlighted by color, including dust (orange), sea-salt (blue), nitrates (pink), sulfates (green), and carbon (red), with brighter regions corresponding to higher aerosol amounts. Credit: NASA’s Goddard Space Flight Center. Download this movie.