Measuring Aerosols

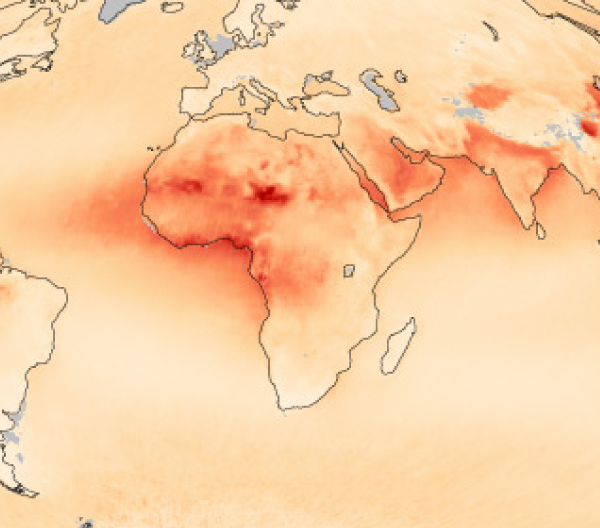
This map shows the average distribution of aerosols from June 2000 through May 2010, measured by the Multi-angle Imaging Spectroradiometer (MISR). Red indicates high concentrations of aerosols, beige indicates low concentrations. Credit: Robert Simmon, based on MISR data..
Source: NASA Earth Observatory
[02-Nov-2010] Although it became clear about 40 years ago that aerosols could affect climate, the measurements needed to establish the magnitude of such effects - or even whether specific aerosol types warm or cool the surface - were lacking. This situation has improved considerably. Today scientists use an array of satellite, aircraft, and ground-based instruments to monitor aerosols. Read more about these measurement methods in this article on the NASA Earth Observatory website. Measuring Aerosols 
