Early Adopter
Applied Research Topic
Potential Applications ► ECCO-Darwin global-ocean biogeochemistry model
Description
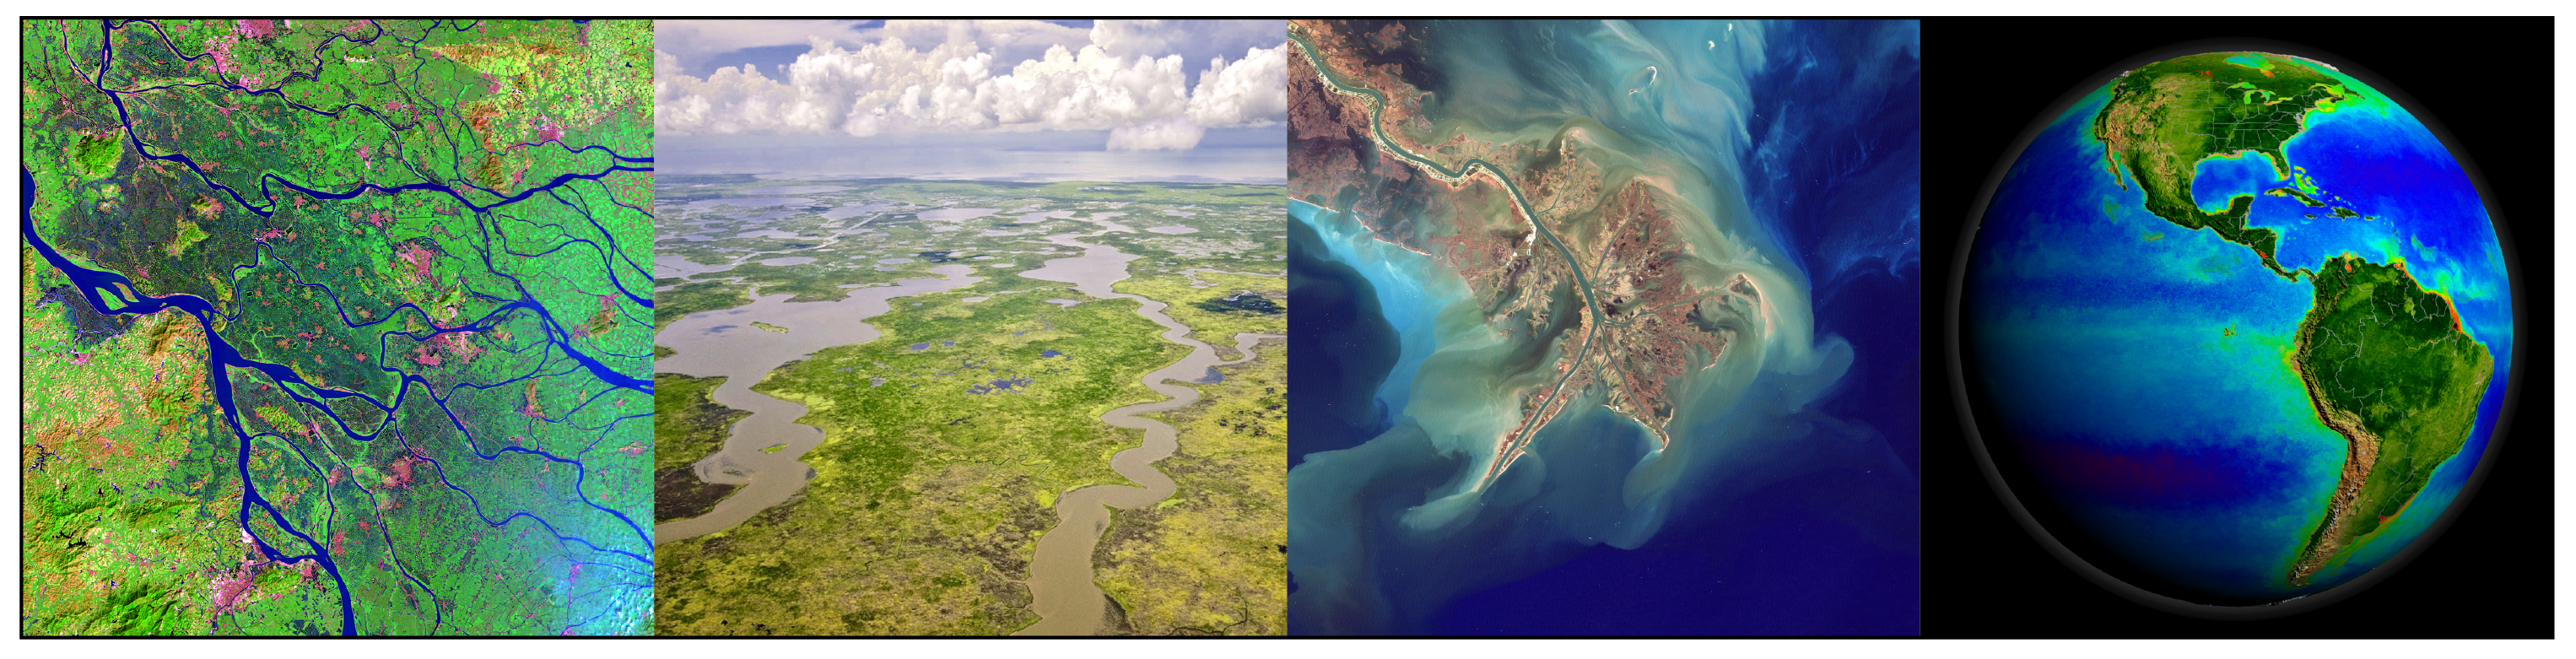
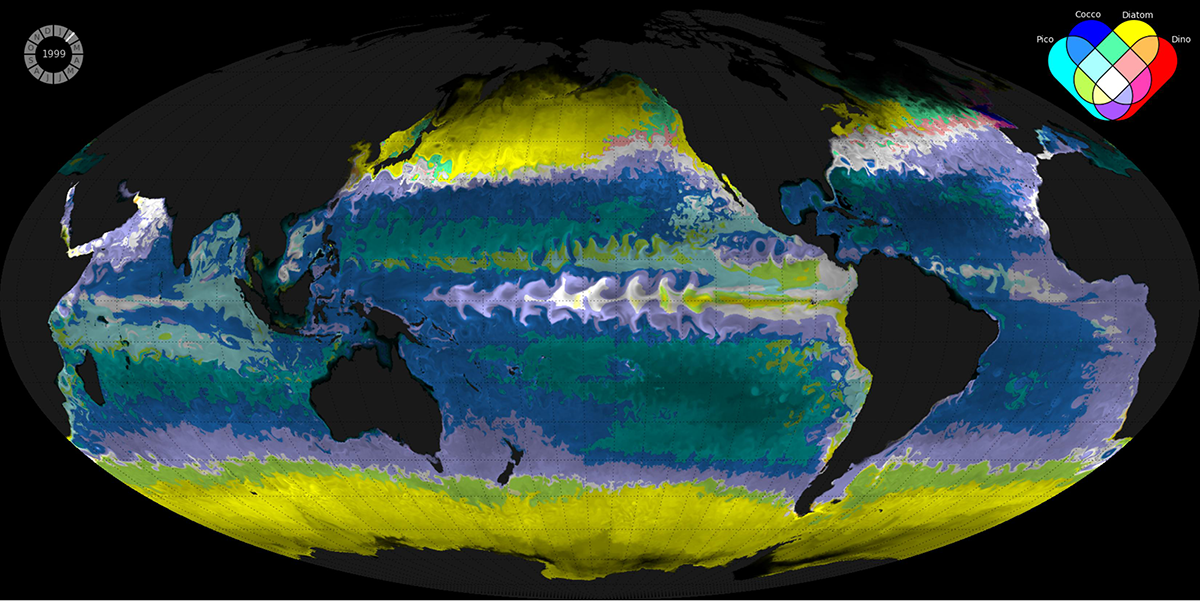
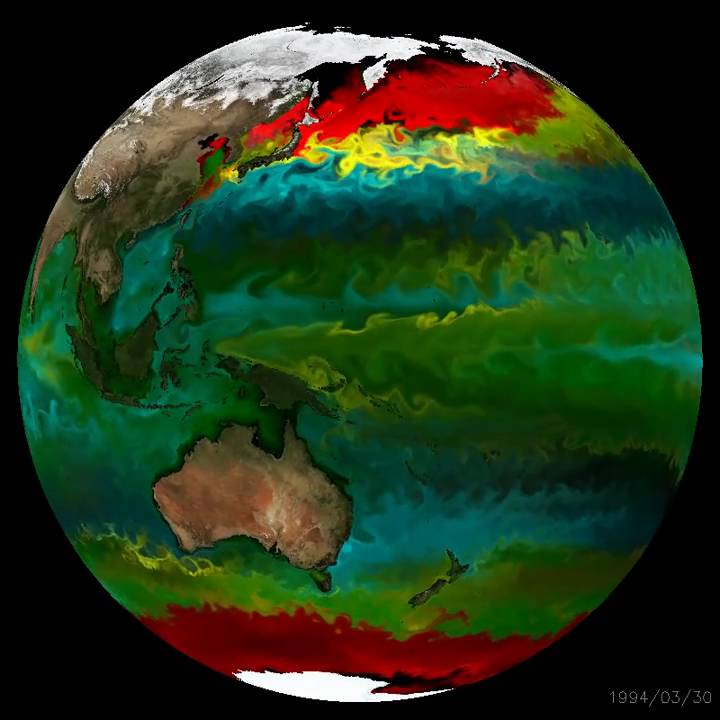
We are developing a global-ocean biogeochemistry model, called ECCO-Darwin, that assimilates both physical and biogeochemical observations over multi-decadal timescales (1992–near present). ECCO-Darwin leverages interdisciplinary results from two well-established projects: 1) model physics and ocean circulation from the Estimating the Climate and Circulation of the Ocean (ECCO) Consortium and 2) a highly realistic ecosystem model from MIT Darwin Project. A novel aspect of ECCO-Darwin, which connects it directly to PACE, is that it includes the explicit radiative transfer of spectral irradiance. Therefore, the model can simulate the spectral absorption and scattering of water molecules, phytoplankton types, detritus, and colored dissolved organic matter; allowing for the direct assimilation of ocean color observations and generation of synthetic datasets for mission planning.Significance
ECCO-Darwin provides an improved, data-constrained estimate of the ocean carbon sink, which can be used to better constrain estimates of the global carbon budget. This information is critical for quantifying uncertainty across the various carbon sources/sinks and informing policy and carbon mitigation strategies. We are also working with several groups to use ECCO-Darwin for simulating geo- and bioengineering (e.g., ocean alkalization and blue carbon) carbon mitigation experiments.Why PACE
PACE data will be assimilated into ECCO-Darwin to improve the model representation of phytoplankton physiology, bloom timing, biological carbon uptake, and coastal runoff. The goal is direct assimilation of PACE level-2 or level-3 observations in global and regional configurations of ECCO-Darwin.End User(s)
ECCO ConsortiumColumbia University
California Institute of Technology- Division of Geological and Planetary Sciences
MIT
Google, Inc
The Climate Foundation
SAT Partner(s)
Cecile RousseauxPublications
Wood, M., Carroll, D., Fenty, I., Bertin, C., Darby, B., Dutkiewicz, S., Hopwood, M., Khazendar, A., Meire, L., Oliver, H., Parker, T., and J. Willis, 2025, Increased melt from Greenland’s most active glacier fuels enhanced coastal productivity. Nature Communications: Earth & Environment, 6, 626.
Hayward, A., Wright, S. W., Carroll, D., Law, C. S., Wongpan, P., Gutiérrez-Rodriguez, A., and M.H Pinkerton, 2025, Antarctic phytoplankton communities restructure under shifting sea-ice regimes. Nature Climate Change, 1–8.
Suselj, K., Carroll, D., Whitt, D., Samuels, B., Menemenlis, D., Zhang, H., Beatty, N., and A. Savage, 2025, Quantifying marine carbon dioxide removal via alkalinity enhancement across circulation regimes using ECCO-Darwin and 1D models. Journal of Advances in Modeling Earth Systems, 17, e2024MS004847.
Carroll, D., Menemenlis, D., Dutkiewicz, S., Lauderdale, J. M., Adkins, J. F., Bowman, K. W., et al., 2022, Attribution of space-time variability in global-ocean dissolved inorganic carbon, Global Biogeochemical Cycles, 36, e2021GB007162
Carroll, D., Menemenlis, Adkins, J.F., Bowman, K.W., Brix, H., Dutkiewicz, S., Fenty, I., Gierach, M. M., Hill, C., Jahn, O., Landschützer, P., Lauderdale, J. Liu, J.M., Naviaux, J.D., Manizza, M., Rödenbeck, C., Schimel, D. S., Van der Stocken, T., Zhang, H, Seasonal to Multi-decadal Air-sea CO2 Fluxes from the Data-constrained ECCO-Darwin Global Ocean Biogeochemistry Model, Journal of Advances in Modeling Earth Systems, 12, e2019MS001888