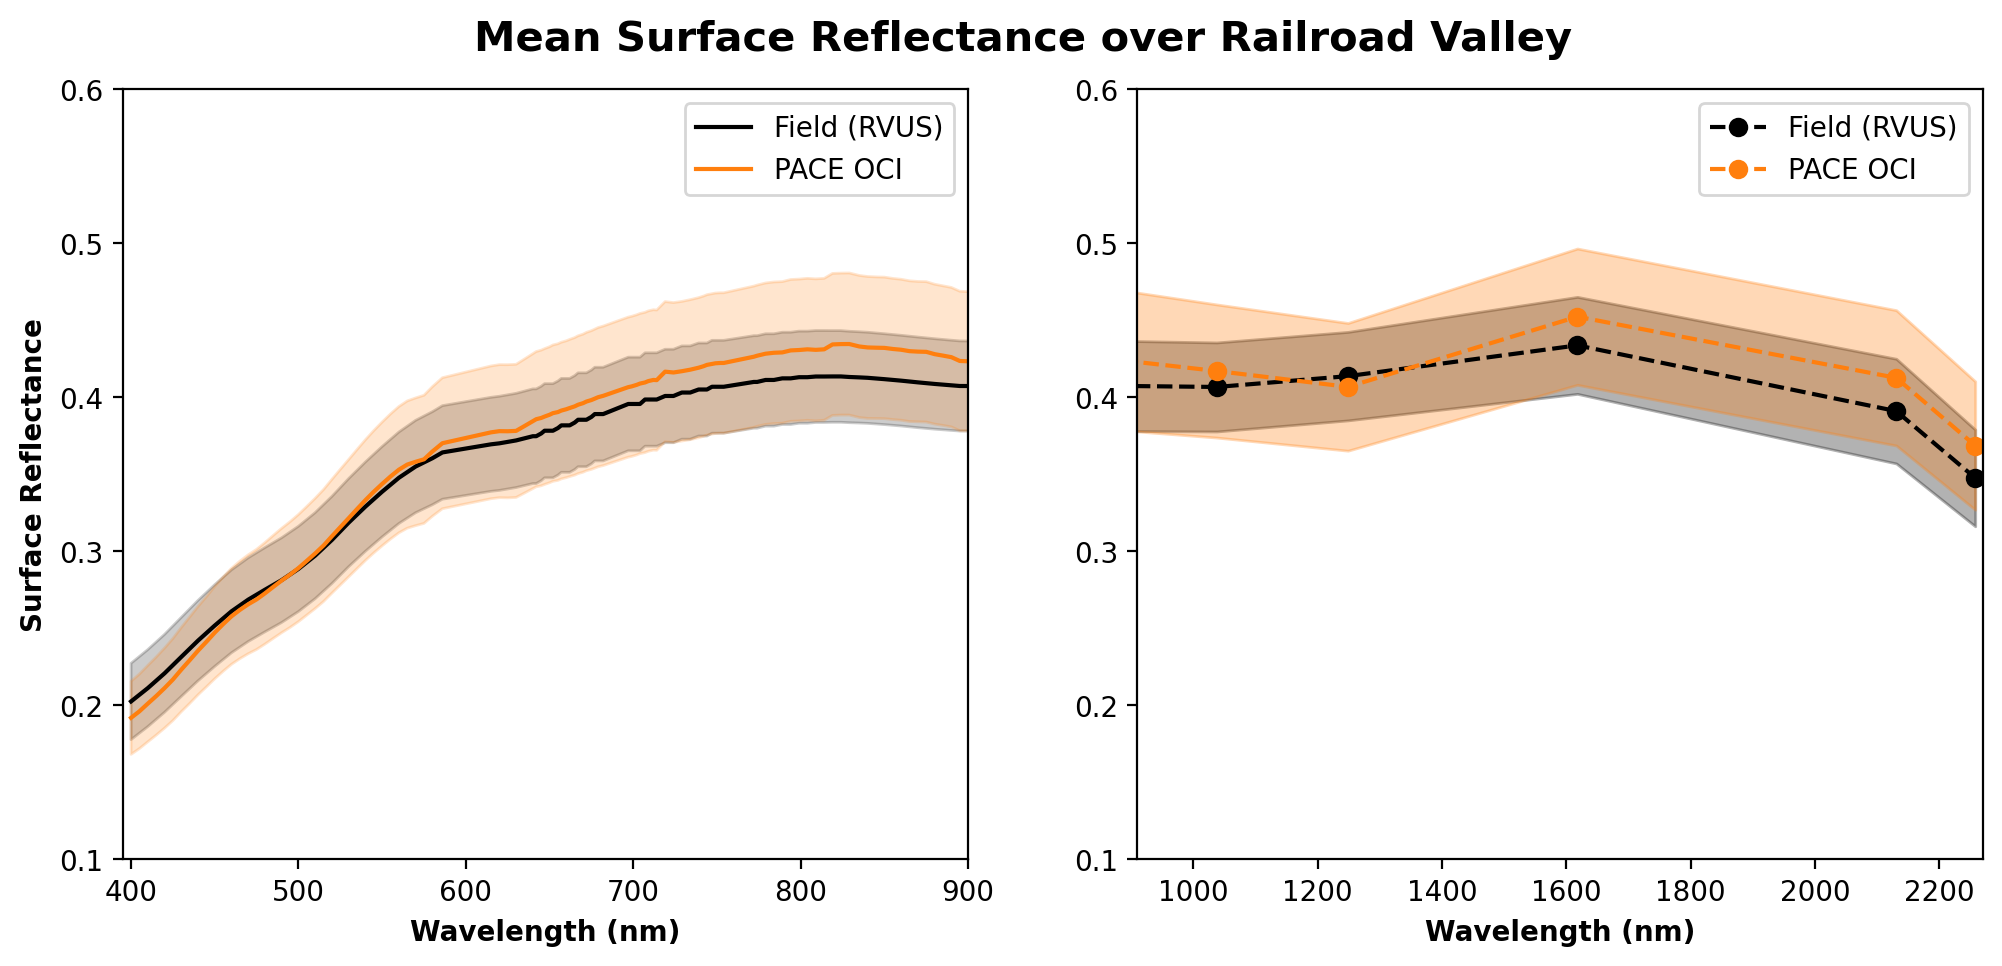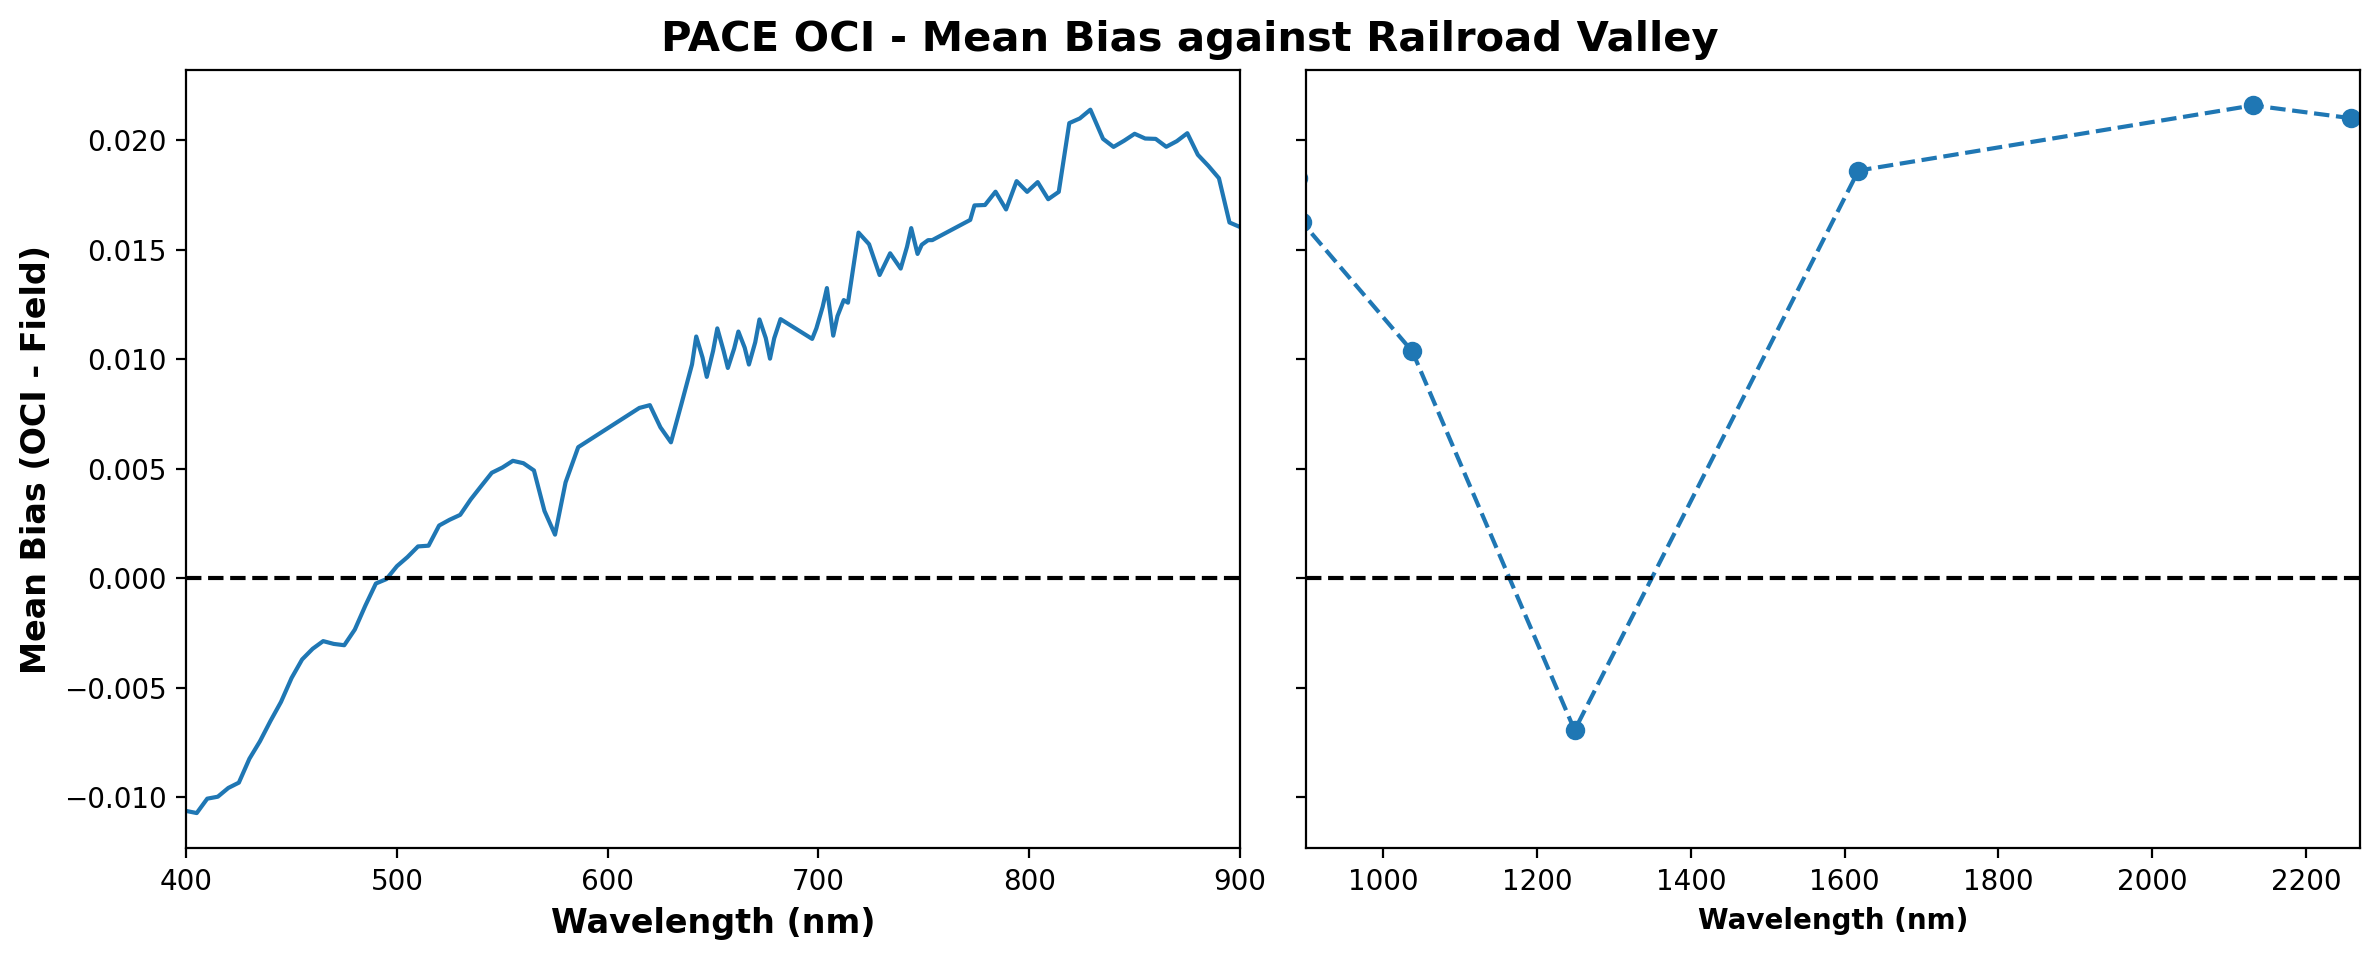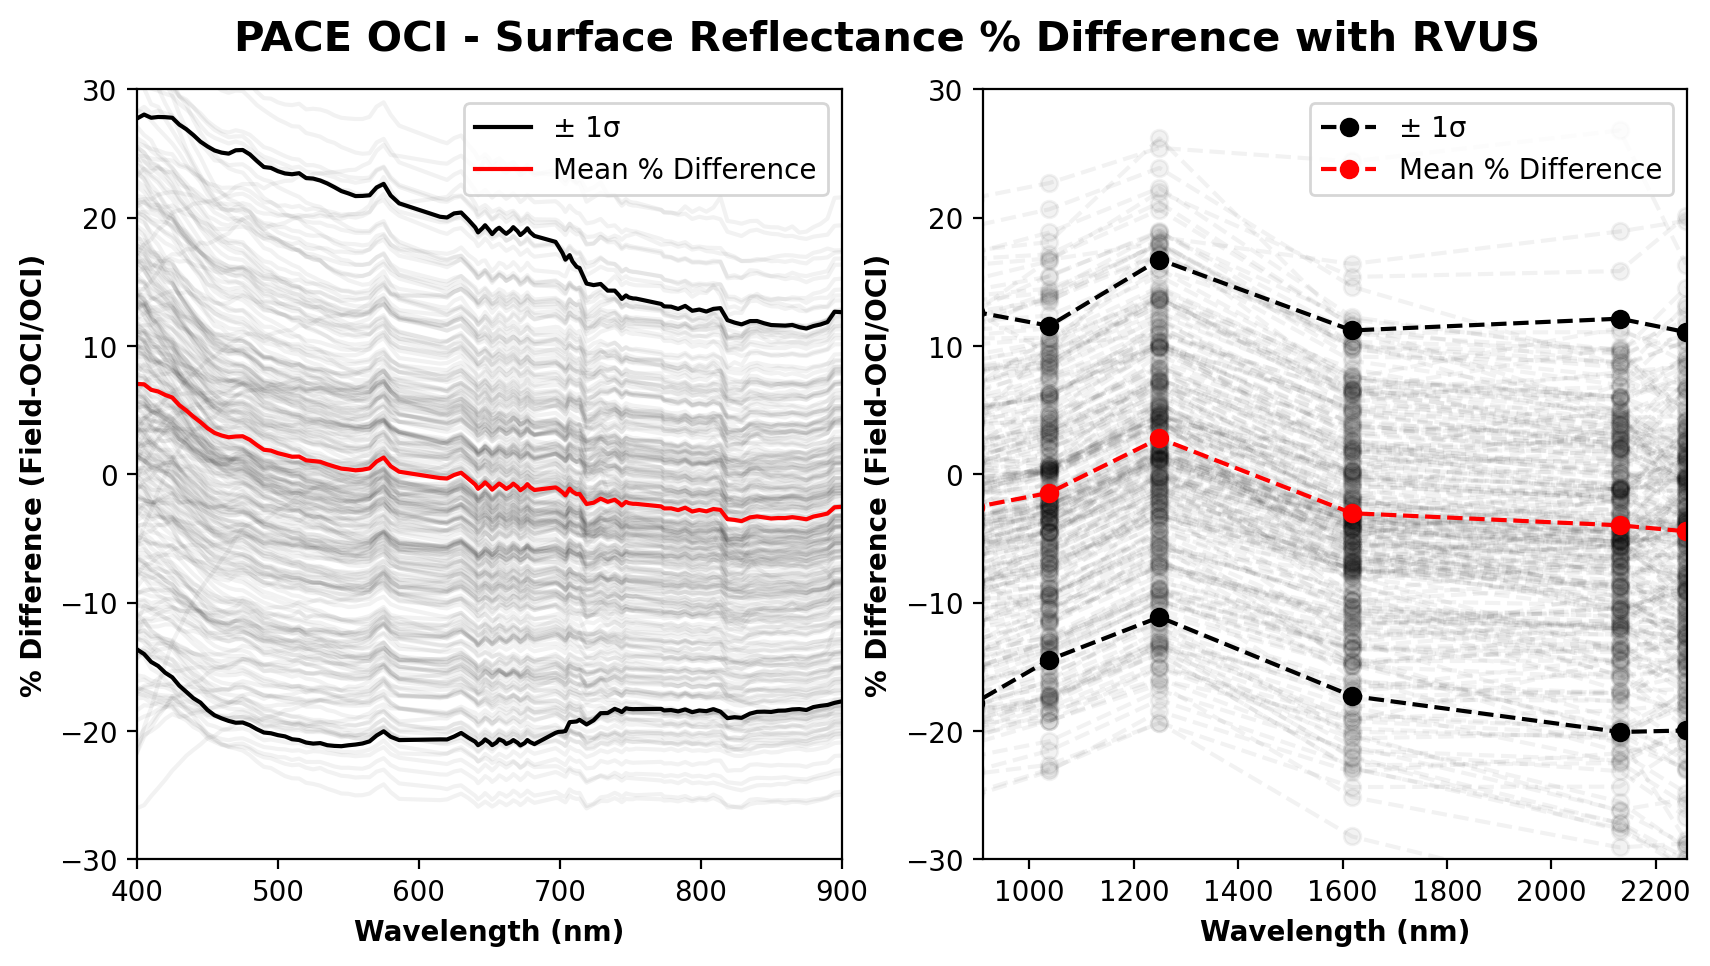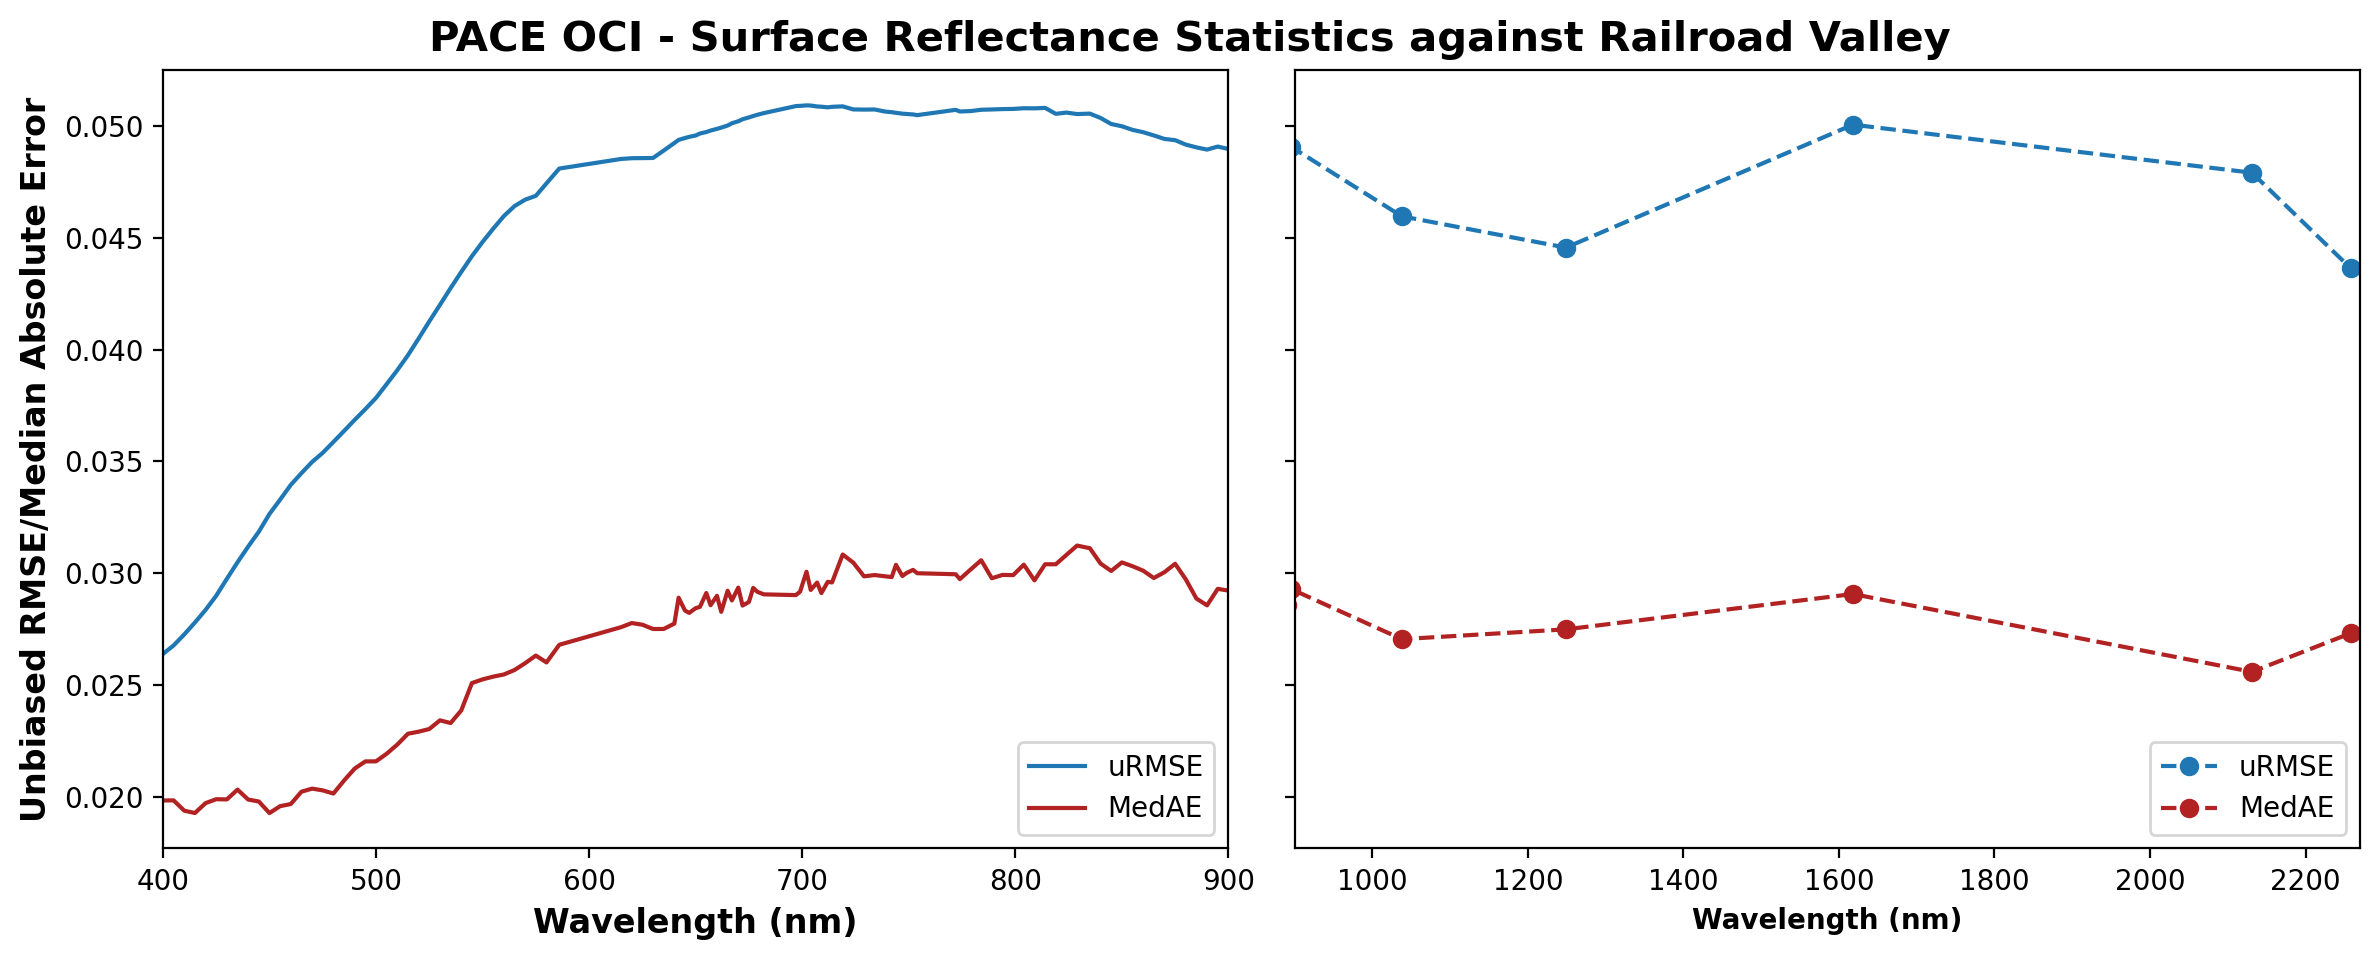

This page presents Ocean Color Instrument (OCI) surface reflectance validation. Surface reflectance is the unitless fraction of incoming solar radiation reflected by the surface. The method with which PACE OCI derives spectral surface reflectances can be found in the Algorithm Theoretical Basis Document (ATBD). Currently, only surface reflectances over land are being validated.
Matchup Criteria
Matchups are filtered to remove data with clouds, anomalous atmospheric conditions, and surface water. Additionally, view zenith angle is filtered to < 60°, and solar zenith angles are filtered to < 75°. Matchups are considered only for points taken on the same day within 6 hours of the OCI overpass. Ground station spectra are bandpass-averaged for spectral alignment.
Plots for each matchup are also provided on the PACE Validation Viewer. The viewer is an exploratory tool for dynamically visualizing satellite-in-situ matchup pairs. It is not, however, intended to be used as official results. More validation points will be added to the Viewer as they become available.
Disclaimer
Currently, the only ground station considered in this matchup set is the Radiometric Calibration Network (RadCalNet) Railroad Valley (RVUS) site. More validation sites will be added to this analysis in the near future. Note that due to ground station spectral coverage, the ultraviolet (UV) portion of the OCI spectrum is not included in these validation matchup point.
These validation plots and statistics are to be considered preliminary. Visitors should expect updated values over time due to incoming datasets with different spatial and temporal variability coverages and dynamic ranges, as well as to algorithm refinements.
|
Surface Reflectance Click to download data: Matchup statistics for all wavelengths | All matchup spectra |
||||
|---|---|---|---|---|
| Wavelength (nm) | Mean Bias | MedAE | RMSE | uRMSE |
| All wavelengths | 0.00893982 | 0.02684349 | 0.04723245 | 0.04560858 |