This page shows comparisons between aerosol properties retrieved by the OCI Unified Aerosol Algorithm (UAA) and ground-based sun photometers within NASA's Aerosol Robotic Network (AERONET). The UAA makes use of OCI's spectral coverage to combine and expand on the heritage Dark Target, Deep Blue, and near-UV algorithms which have been broadly applied to NASA sensors (Remer et al., 2019).
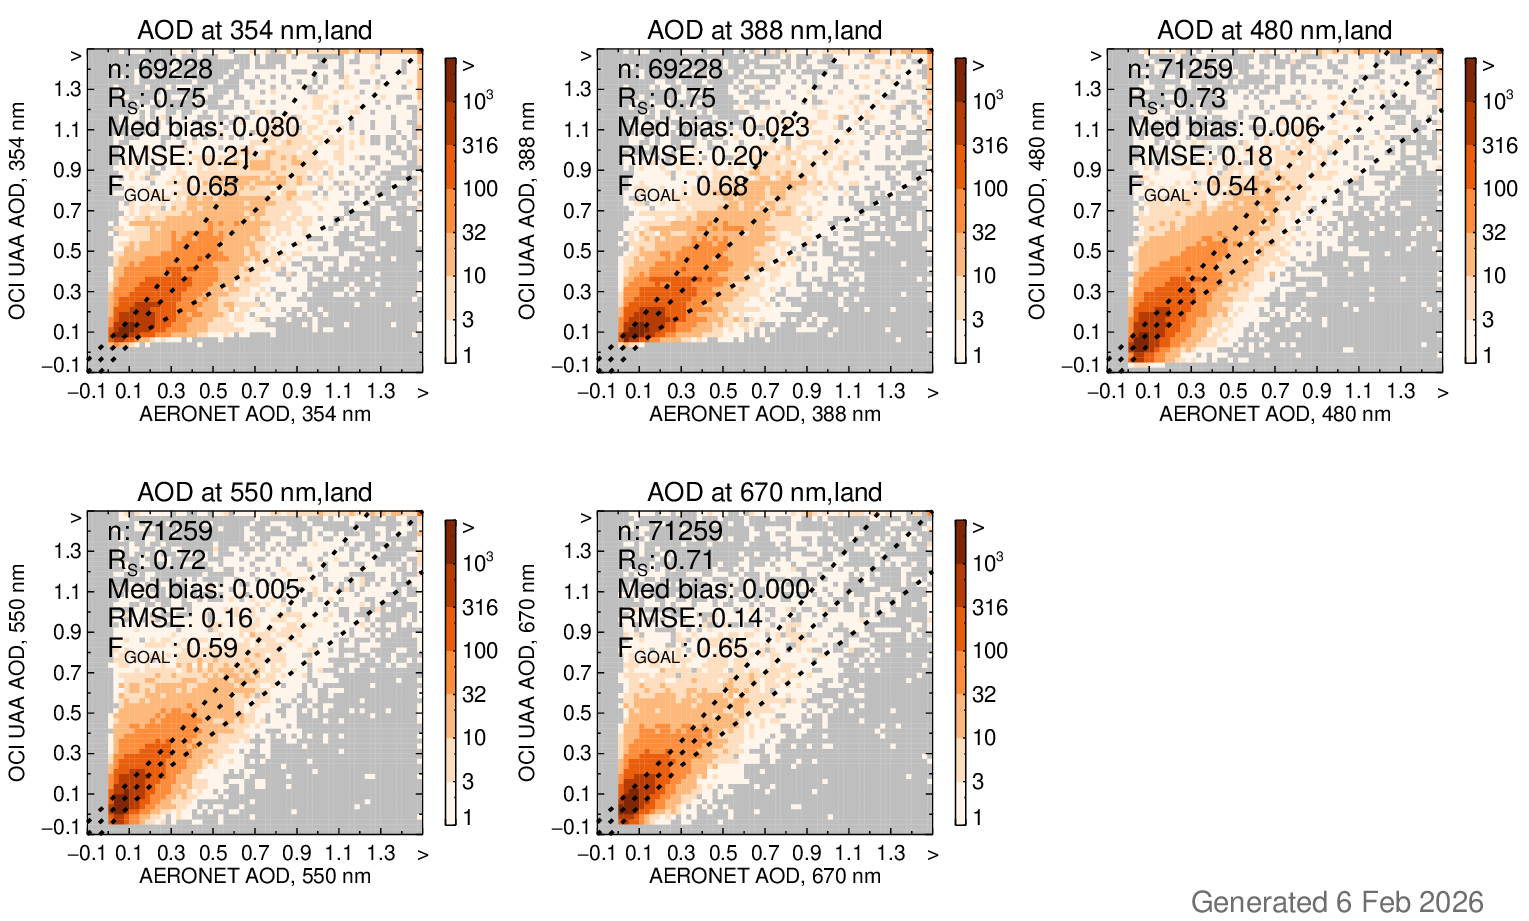
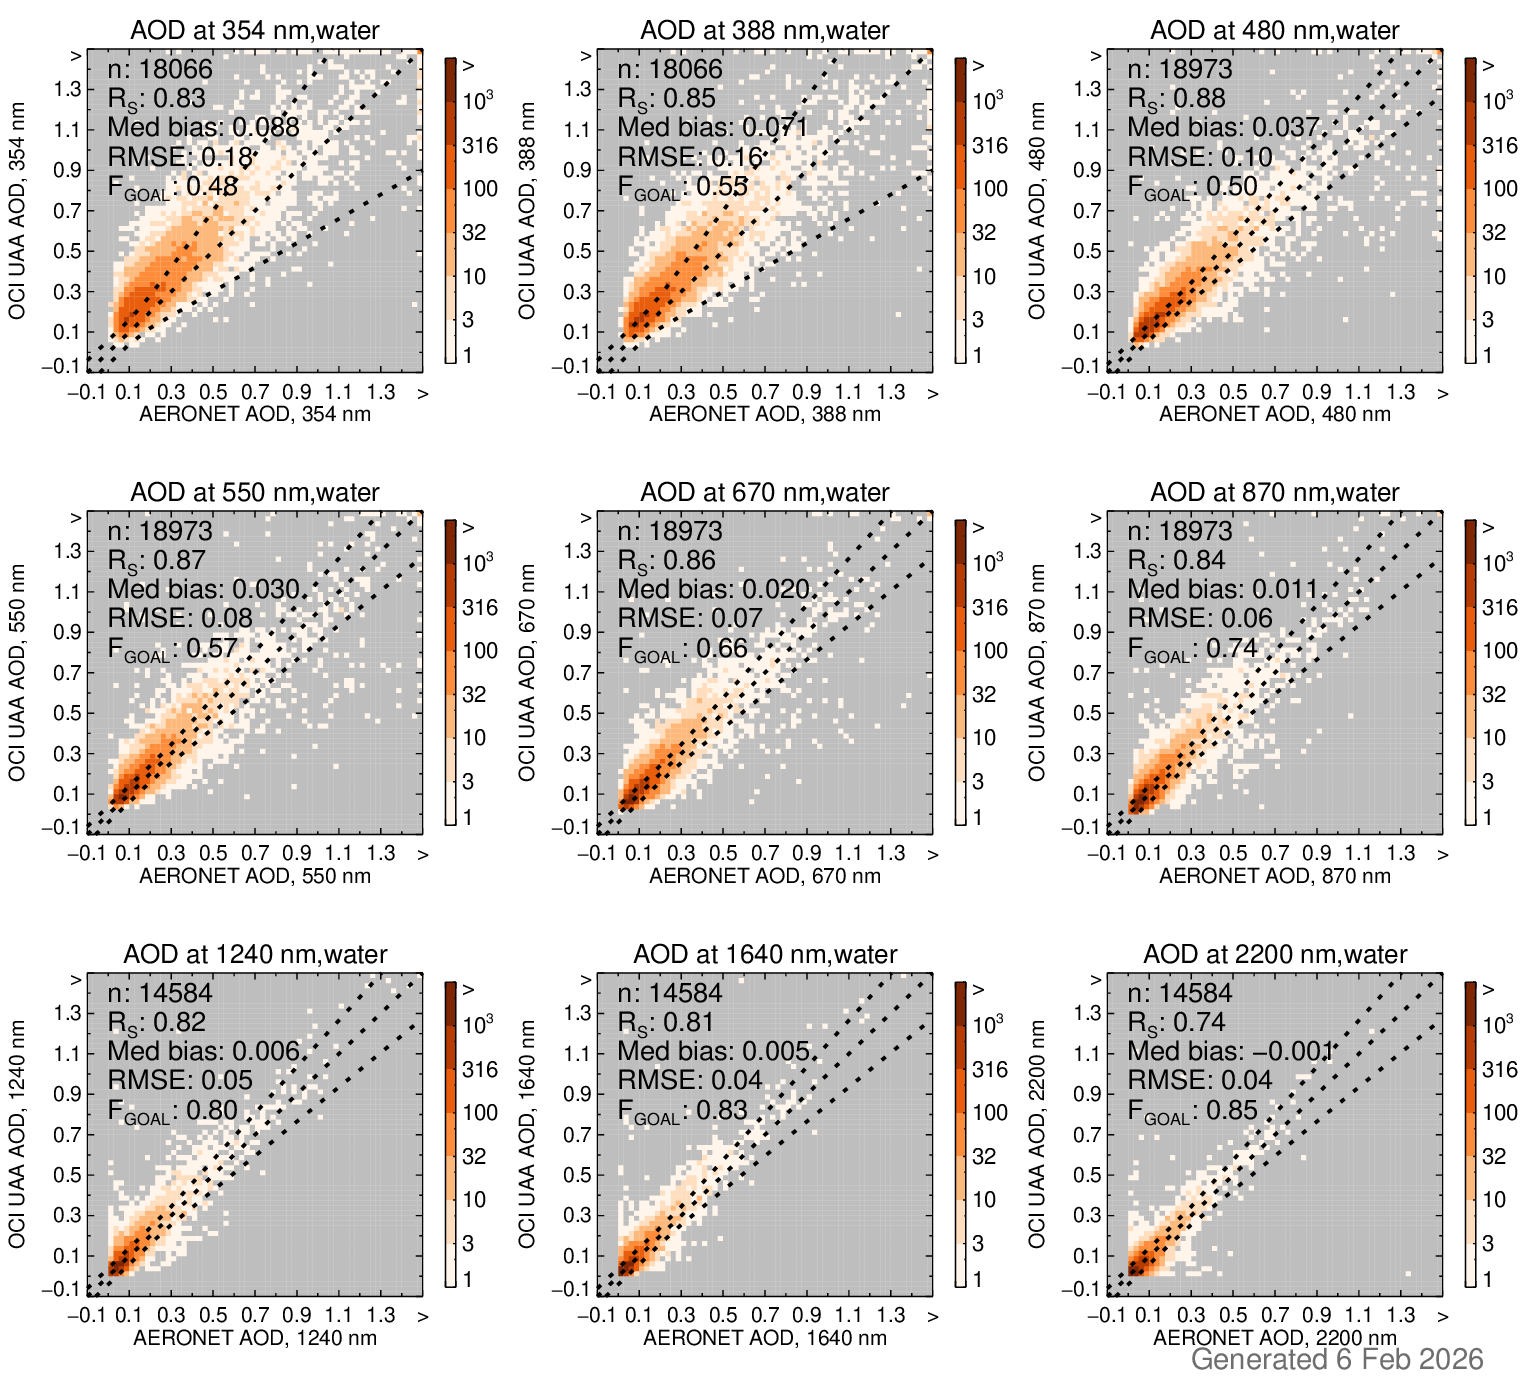
Here, we compare v3.1 UAA retrievals against AERONET level 1.5, version 3 data from the start of mission launch until the end of October 2025. We compare medians of UAA retrievals within 25 km of each ground site with medians of AERONET retrievals within 30 minutes of the PACE overpass. We show results for spectral aerosol optical depth (AOD), which UAA provides at different wavelengths over land and water. Retrievals over land and water are expected to have different error characteristics so we split results by surface type. The table below and scatter density plots (heat maps) show various statistics. These include the number of matchups; Spearman's rank correlation coefficient; the median (UAA minus AERONET) bias; the root mean square error (RMSE), and the fraction of matchups agreeing within the mission uncertainty goals (FGOAL). For UV wavelengths (354 and 388 nm) these AOD uncertainty goals are the greater of 0.06 or 40%. For longer wavelengths, they are the greater of 0.06 or 20% over land, and the greater of 0.04 or 15% over water. These are all dimensionless metrics.
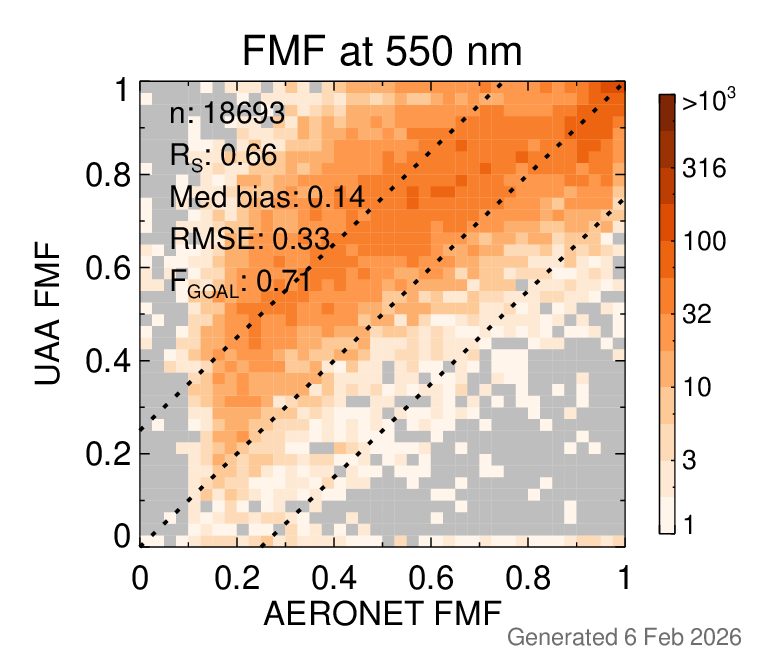
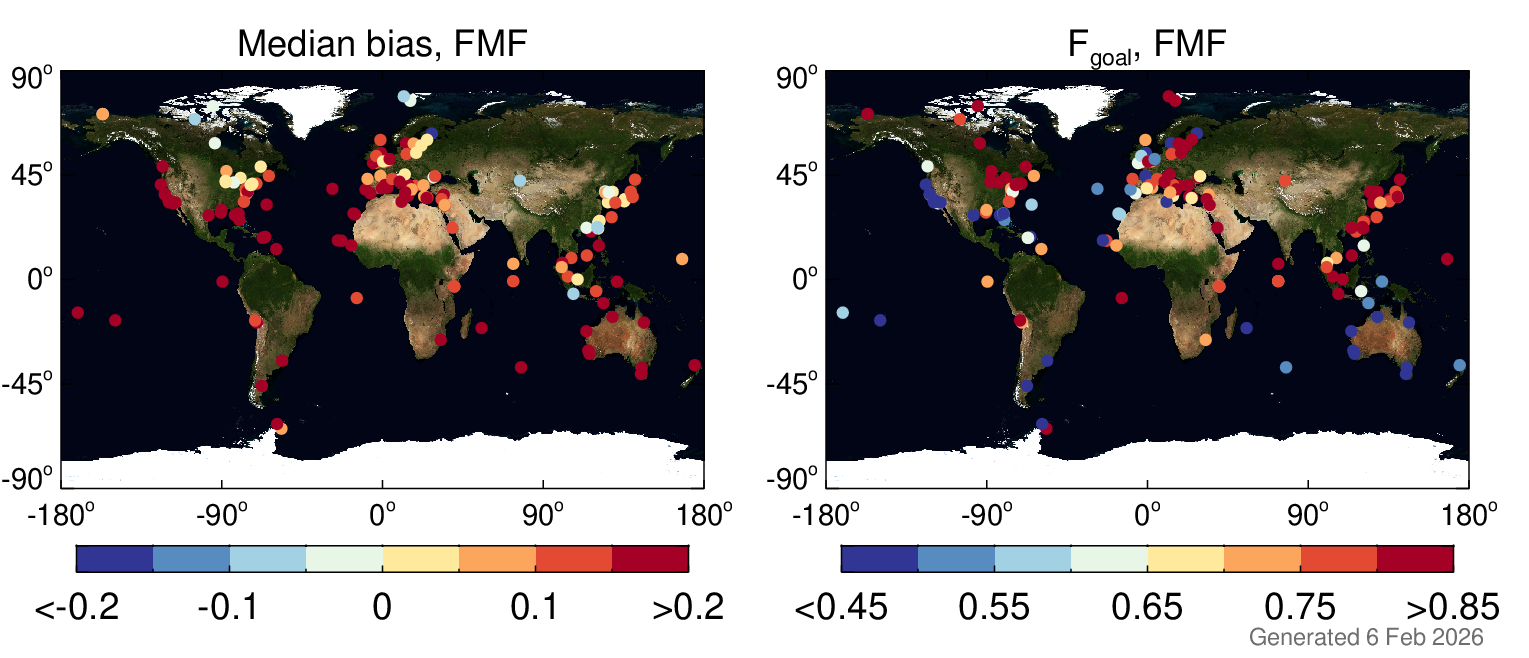
Here we show the fine mode fraction (FMF) of AOD at 550 nm, which the UAA only retrieves FMF over water. The FMF uncertainty goal is 0.25.
Here we show the fine mode fraction (FMF) of AOD at 550 nm, which the UAA only retrieves FMF over water. The FMF uncertainty goal is 0.25.
| Aerosol Properties from the OCI Unified Aerosol Algorithm (UAA) Click to download data: Select UAA matchup statistics |
|||||
|---|---|---|---|---|---|
| Wavelength (nm) | Count | Rs | Median Bias | RMSE | FGOAL |
| Land AOD | |||||
| 354 | 69228 | 0.75 | 0.03 | 0.21 | 0.65 |
| 388 | 69228 | 0.75 | 0.023 | 0.2 | 0.68 |
| 480 | 71259 | 0.73 | 0.006 | 0.18 | 0.54 |
| 550 | 71259 | 0.72 | 0.005 | 0.16 | 0.59 |
| 670 | 71259 | 0.71 | 0 | 0.14 | 0.65 |
| Water AOD | |||||
| 354 | 18066 | 0.83 | 0.088 | 0.18 | 0.48 |
| 388 | 18066 | 0.85 | 0.071 | 0.16 | 0.55 |
| 480 | 18973 | 0.88 | 0.037 | 0.1 | 0.5 |
| 550 | 18973 | 0.87 | 0.03 | 0.08 | 0.57 |
| 670 | 18973 | 0.86 | 0.02 | 0.07 | 0.66 |
| 870 | 18973 | 0.84 | 0.011 | 0.06 | 0.74 |
| 1240 | 14584 | 0.82 | 0.006 | 0.05 | 0.8 |
| 1640 | 14584 | 0.81 | 0.005 | 0.04 | 0.83 |
| 2200 | 14584 | 0.74 | -0.001 | 0.04 | 0.85 |
| Water FMF | |||||
| 550 | 18693 | 0.66 | 0.14 | 0.33 | 0.71 |
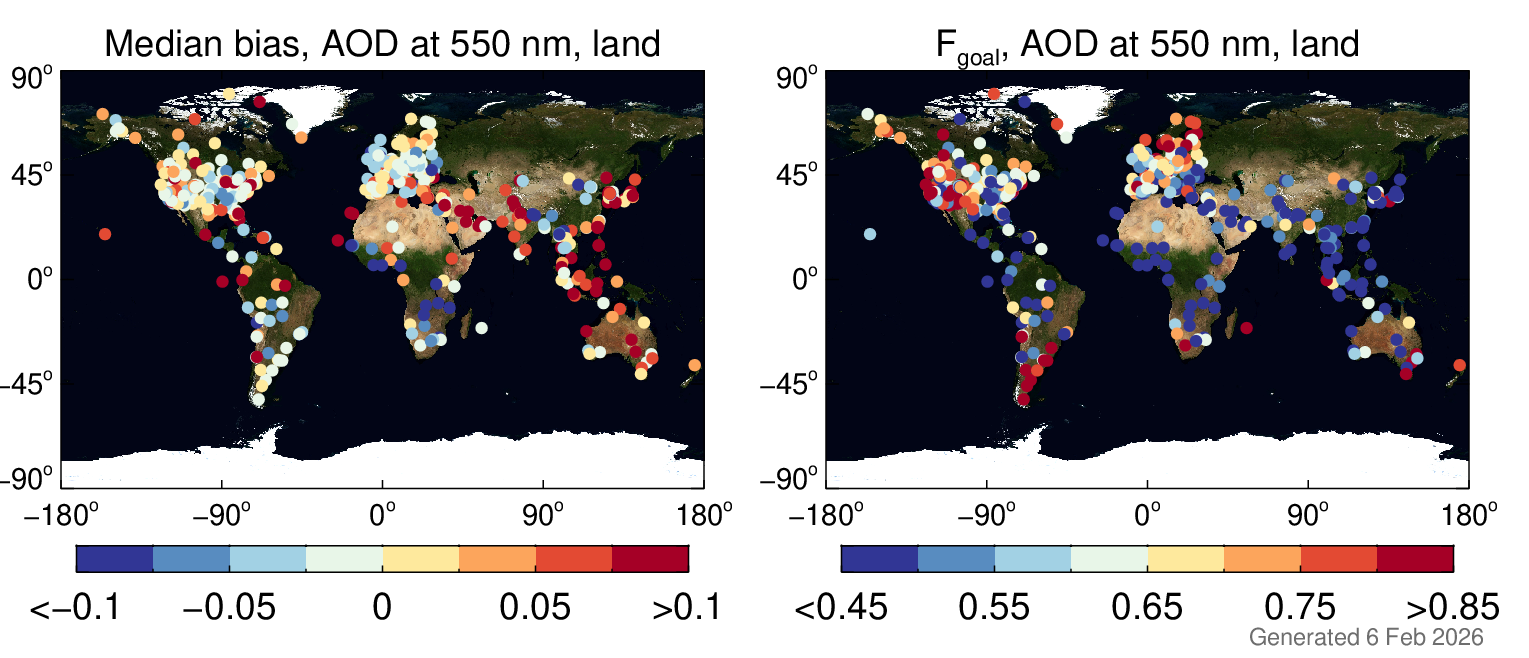
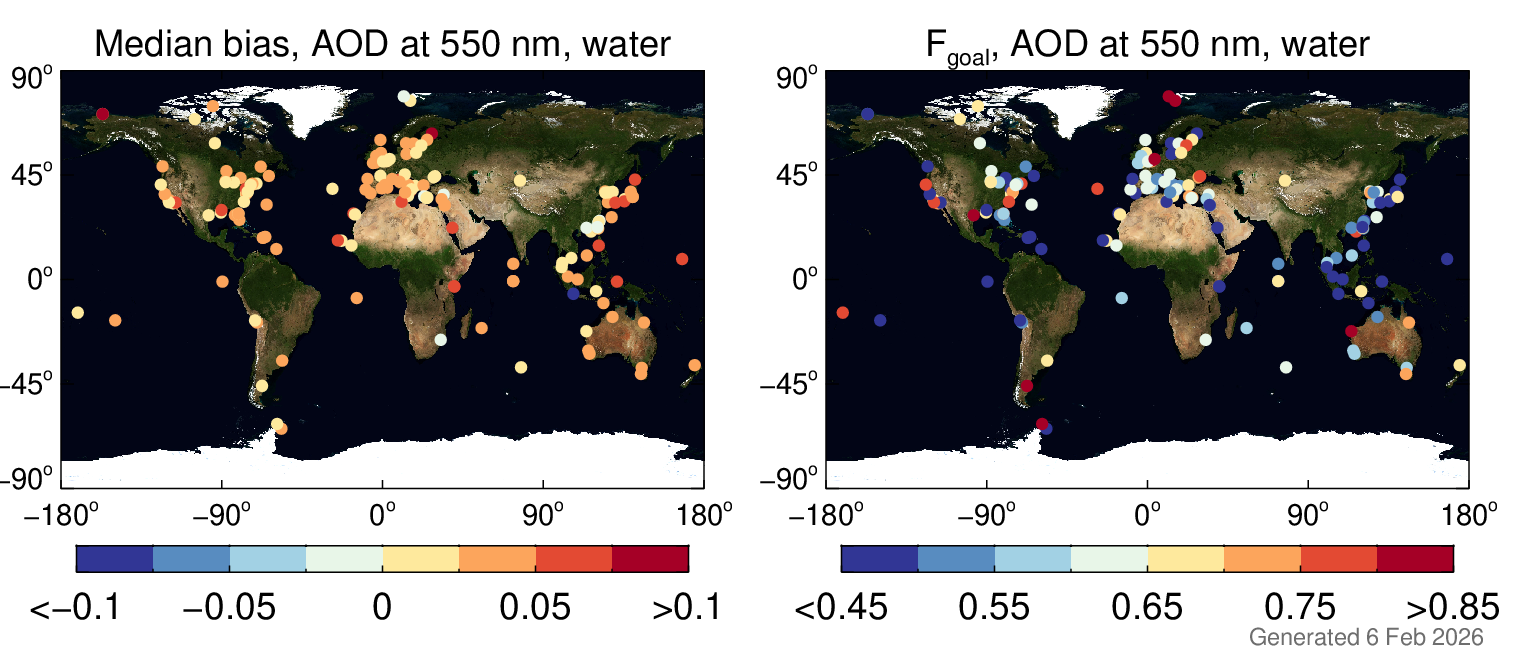
Maps of Median Bias & FGOAL
To illustrate regional variations in performance, the maps below show (for 550 nm) the median UAA-AERONET bias and FGOAL for each site. For median bias maps, less intense colors indicate smaller bias. For FGOAL maps, sites where UAA meets or exceeds the mission goal (65% of matchups within goal uncertainty) are shown as warm color dots; cool color dots indicate sites that do not meet the goal.
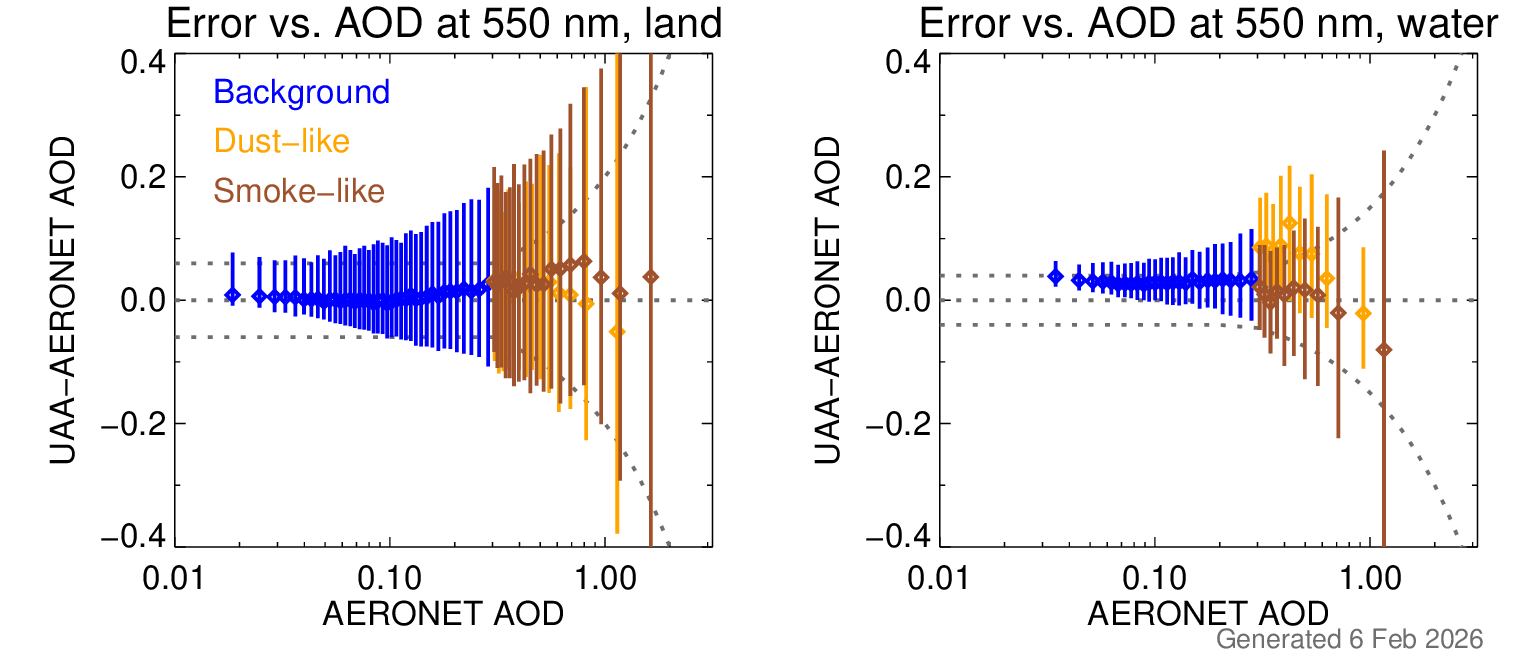
Plots of Error vs. AOD
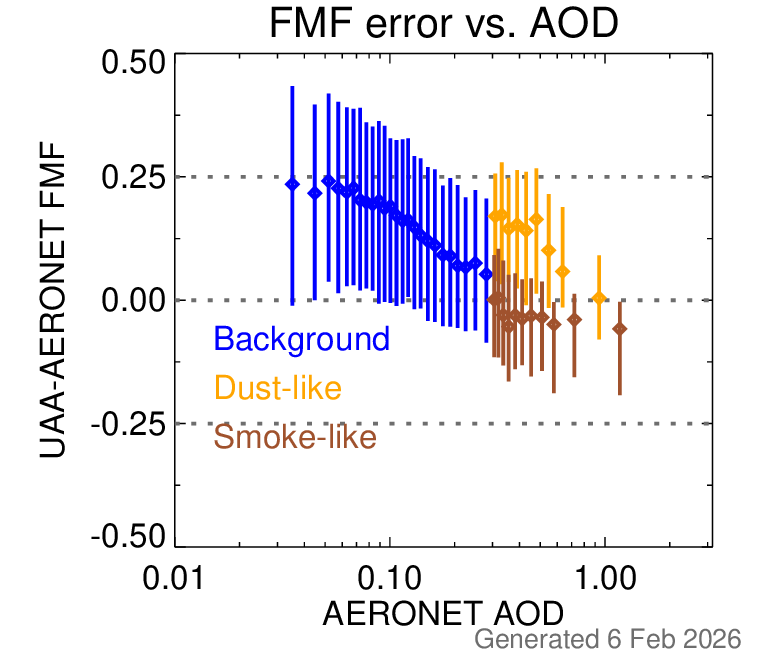
Below, we show how the error in retrieved AOD at 550 nm depends on the AOD at 550 nm for UAA land and water retrievals. The points here are split into three categories, based on the AERONET AOD at 550 nm and Ängström exponent (AE): background (blue; AOD<0.3), dust-like (orange; AOD>0.3, AE<1), or smoke-like (brown: AOD>0.3, AE>1). Points are binned as a function of AOD (with the number of bins set to the nearest integer of the cube root of the number of matchups in each category), and symbols and lines show the median and central one standard deviation of matchups in each bin. Dashed lines show the mission goal uncertainty. This graphic shows little overall bias for retrievals over land (albeit with some site-to-site variation shown in the maps above) but a more persistent positive bias for background and dust-like aerosols over water. As expected, AOD error increases with increasing AO.
This graphic shows FMF error as a function of AOD at 550 nm. In combination with the results shown above, the positive AOD bias – which diminishes with increasing wavelength – is related to retrieving too high FMF values.
This graphic shows FMF error as a function of AOD at 550 nm. In combination with the results shown above, the positive AOD bias – which diminishes with increasing wavelength – is related to retrieving too high FMF values.