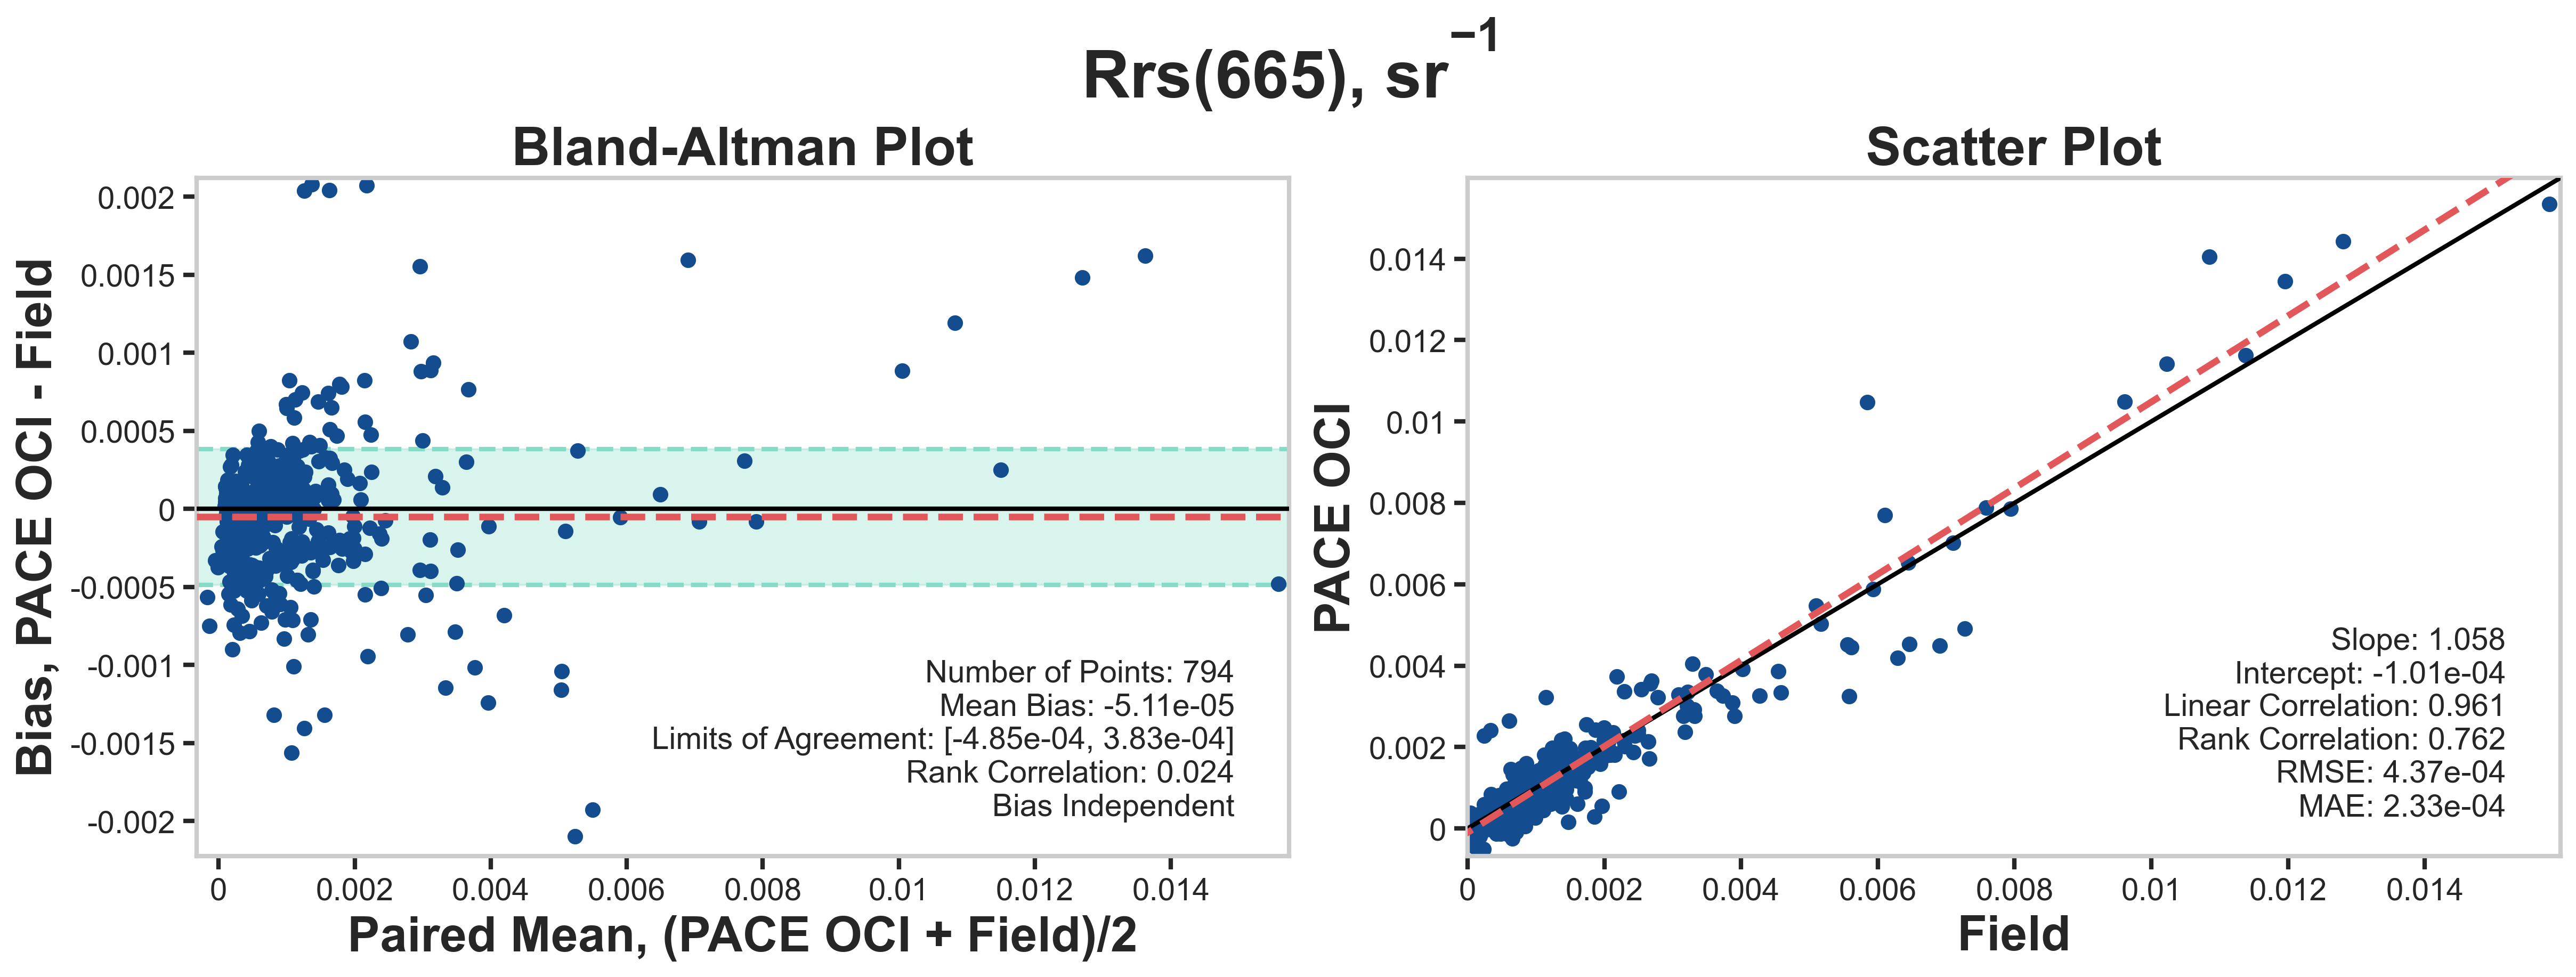
Apparent Optical Properties (AOPs) measured from the ocean depend on the type and composition of materials in the water (e.g., phytoplankton, colored dissolved organic material, detritus, and bubbles), as well as the environmental lighting conditions (e.g., sun angle, sensor viewing angle, and atmospheric composition). Here, we validate the spectral Remote Sensing Reflectance (Rrs), which is the amount of light leaving the sea surface towards the sensor normalized by the light reaching the sea surface from the entire upward hemisphere. For PACE-OCI, Rrs is derived through a series of quality control and atmospheric correction protocols.
|
Remote Sensing Reflectances (Rrs) Click to download data: Select AOP matchup statistics | Select AOP matchups |
||||||||||
|---|---|---|---|---|---|---|---|---|---|---|
| Wavelength | Mean Bias | Limits of Agreement | Linear Slope | Linear Intercept | Linear Correlation | Rank Correlation | RMSE [View plot] |
MAE [View plot] |
Matchup Plots | |
| Low | High | |||||||||
| Rrs_400 | 0.000505 | -999 | -999 | 1.15 | -0.000219 | 0.897 | 0.857 | 0.00189 | 0.00138 | Click here |
| Rrs_412 | 4.16E-05 | -999 | -999 | 1.11 | -0.000484 | 0.912 | 0.878 | 0.00158 | 0.00115 | Click here |
| Rrs_443 | 2.16E-05 | -999 | -999 | 1.07 | -0.000286 | 0.929 | 0.909 | 0.0012 | 0.000875 | Click here |
| Rrs_490 | 4.59E-05 | -999 | -999 | 1.09 | -0.000387 | 0.95 | 0.906 | 0.000979 | 0.000676 | Click here |
| Rrs_510 | 6.80E-05 | -999 | -999 | 1.1 | -0.000335 | 0.96 | 0.841 | 0.000882 | 0.000583 | Click here |
| Rrs_560 | 8.12E-05 | -999 | -999 | 1.09 | -0.000239 | 0.976 | 0.927 | 0.000817 | 0.00048 | Click here |
| Rrs_620 | -1.68E-05 | -999 | -999 | 1.07 | -0.000106 | 0.971 | 0.822 | 0.00051 | 0.000273 | Click here |
| Rrs_665 | -5.11E-05 | -0.000485 | 0.000383 | 1.06 | -0.000101 | 0.961 | 0.762 | 0.000437 | 0.000233 | Click here |


AOP Matchup Plots
The data plotted below are Bland-Altman plots and Scatter plots for select AOP matchups. In the select AOP matchups file, Aeronet-OC data have the "env_" prefix. PACE data have the "oci_" prefix.
400nm

412nm

443nm

490nm

510nm

560nm

620nm

665nm


