The absorption coefficient of phytoplankton (aph, units: m-1) quantifies light that is absorbed by pigment-containing phytoplankton in the near-surface layer. Field measurements of hyperspectral aph are routinely measured spectrophotometrically following the IOCCG Ocean Optics & Biogeochemistry Protocols for Satellite Ocean Colour Sensor Validation. PACE OCI derives hyperspectral of aph using the GIOP-DC* algorithm.
|
Phytoplankton Absorption Coefficient (aph) Click to download data: Select aph matchup statistics | Select aph matchups |
||||||||||
|---|---|---|---|---|---|---|---|---|---|---|
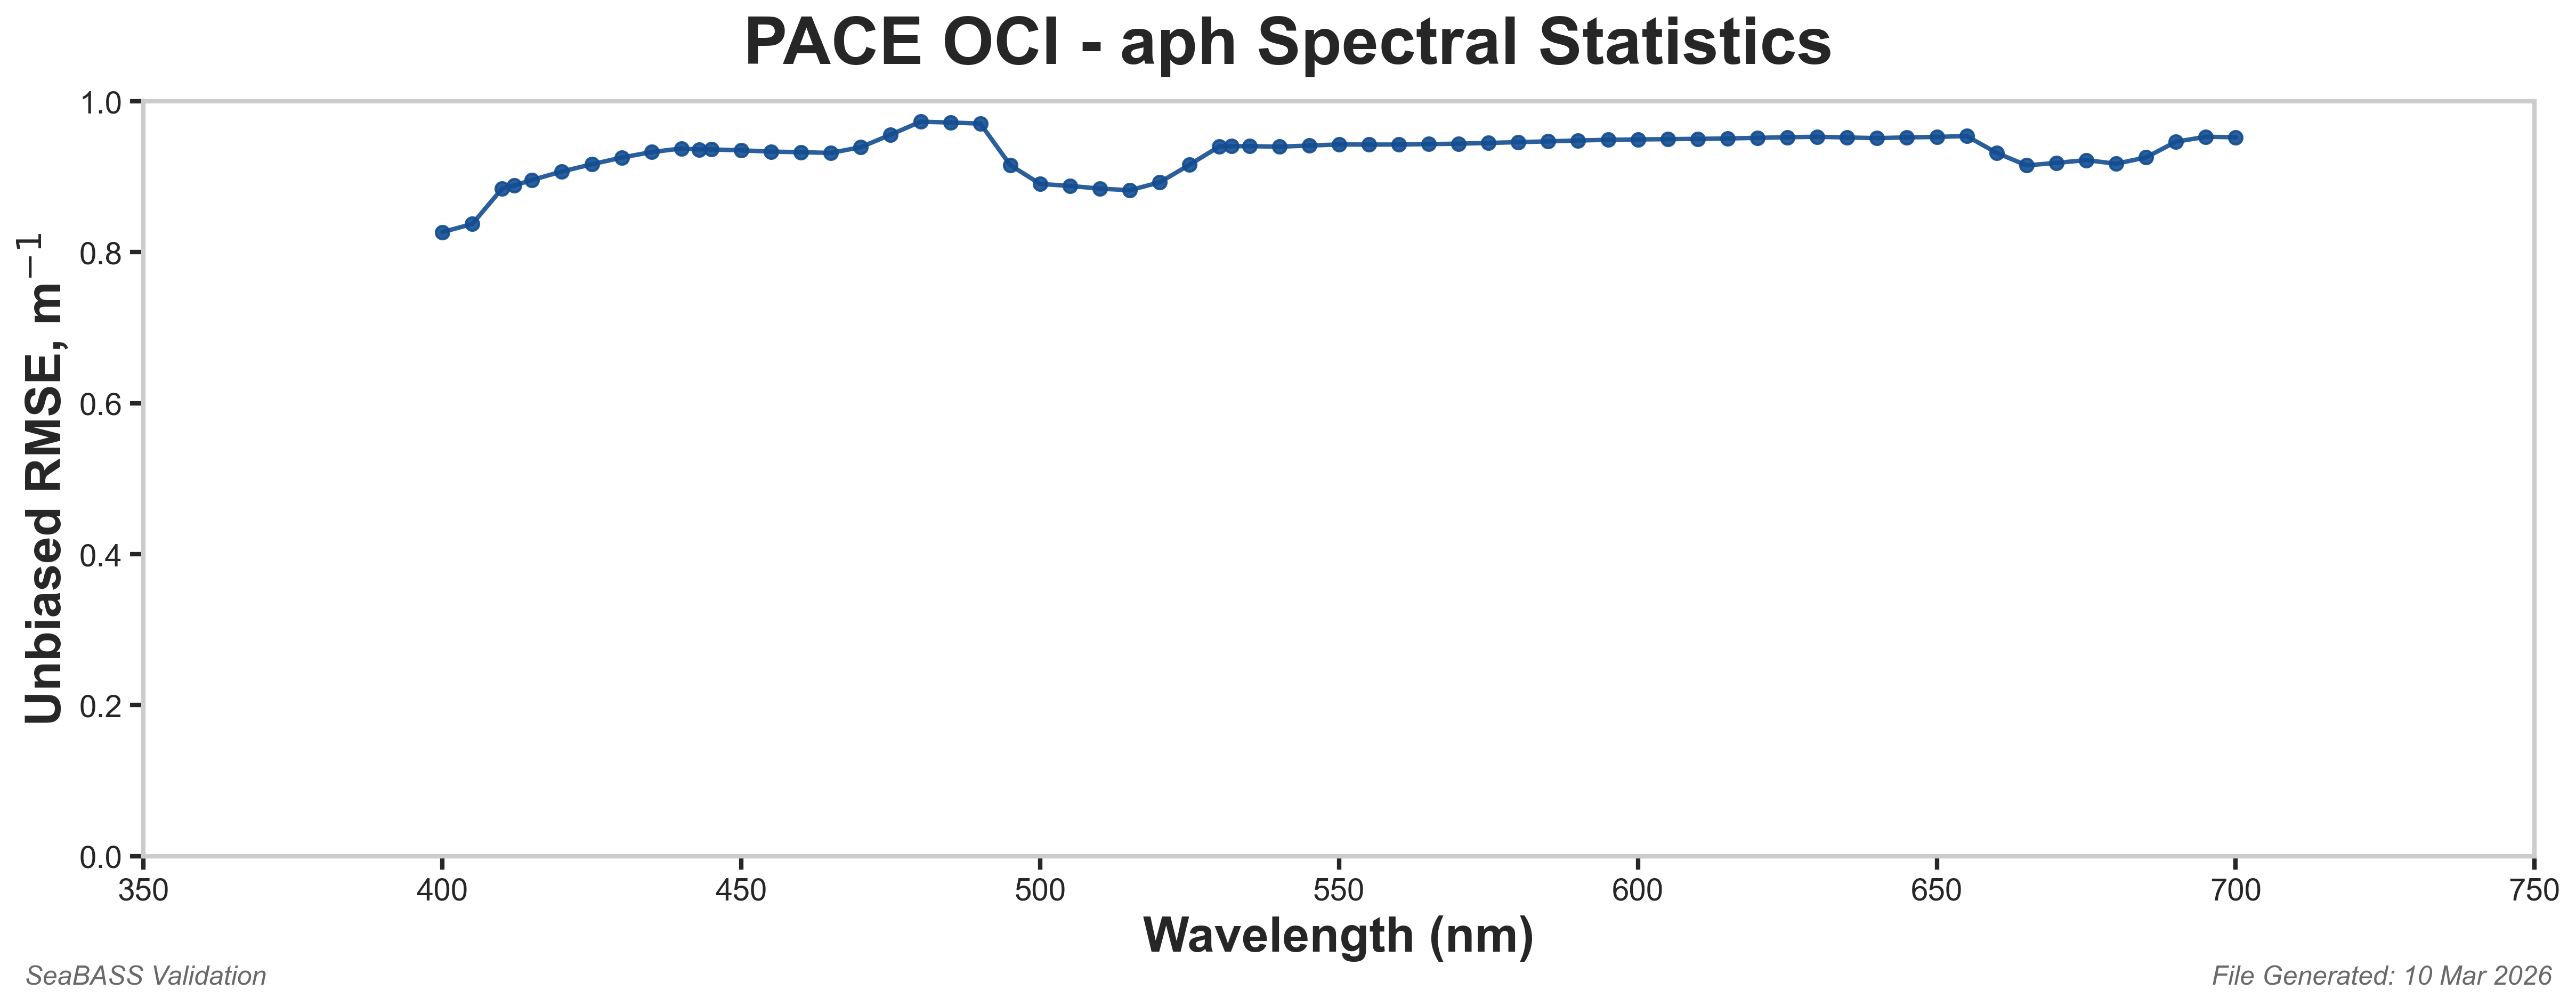
| Wavelength | Mean Bias | Limits of Agreement | Linear Slope | Linear Intercept | Linear Correlation | Rank Correlation | uRMSE [View plot] |
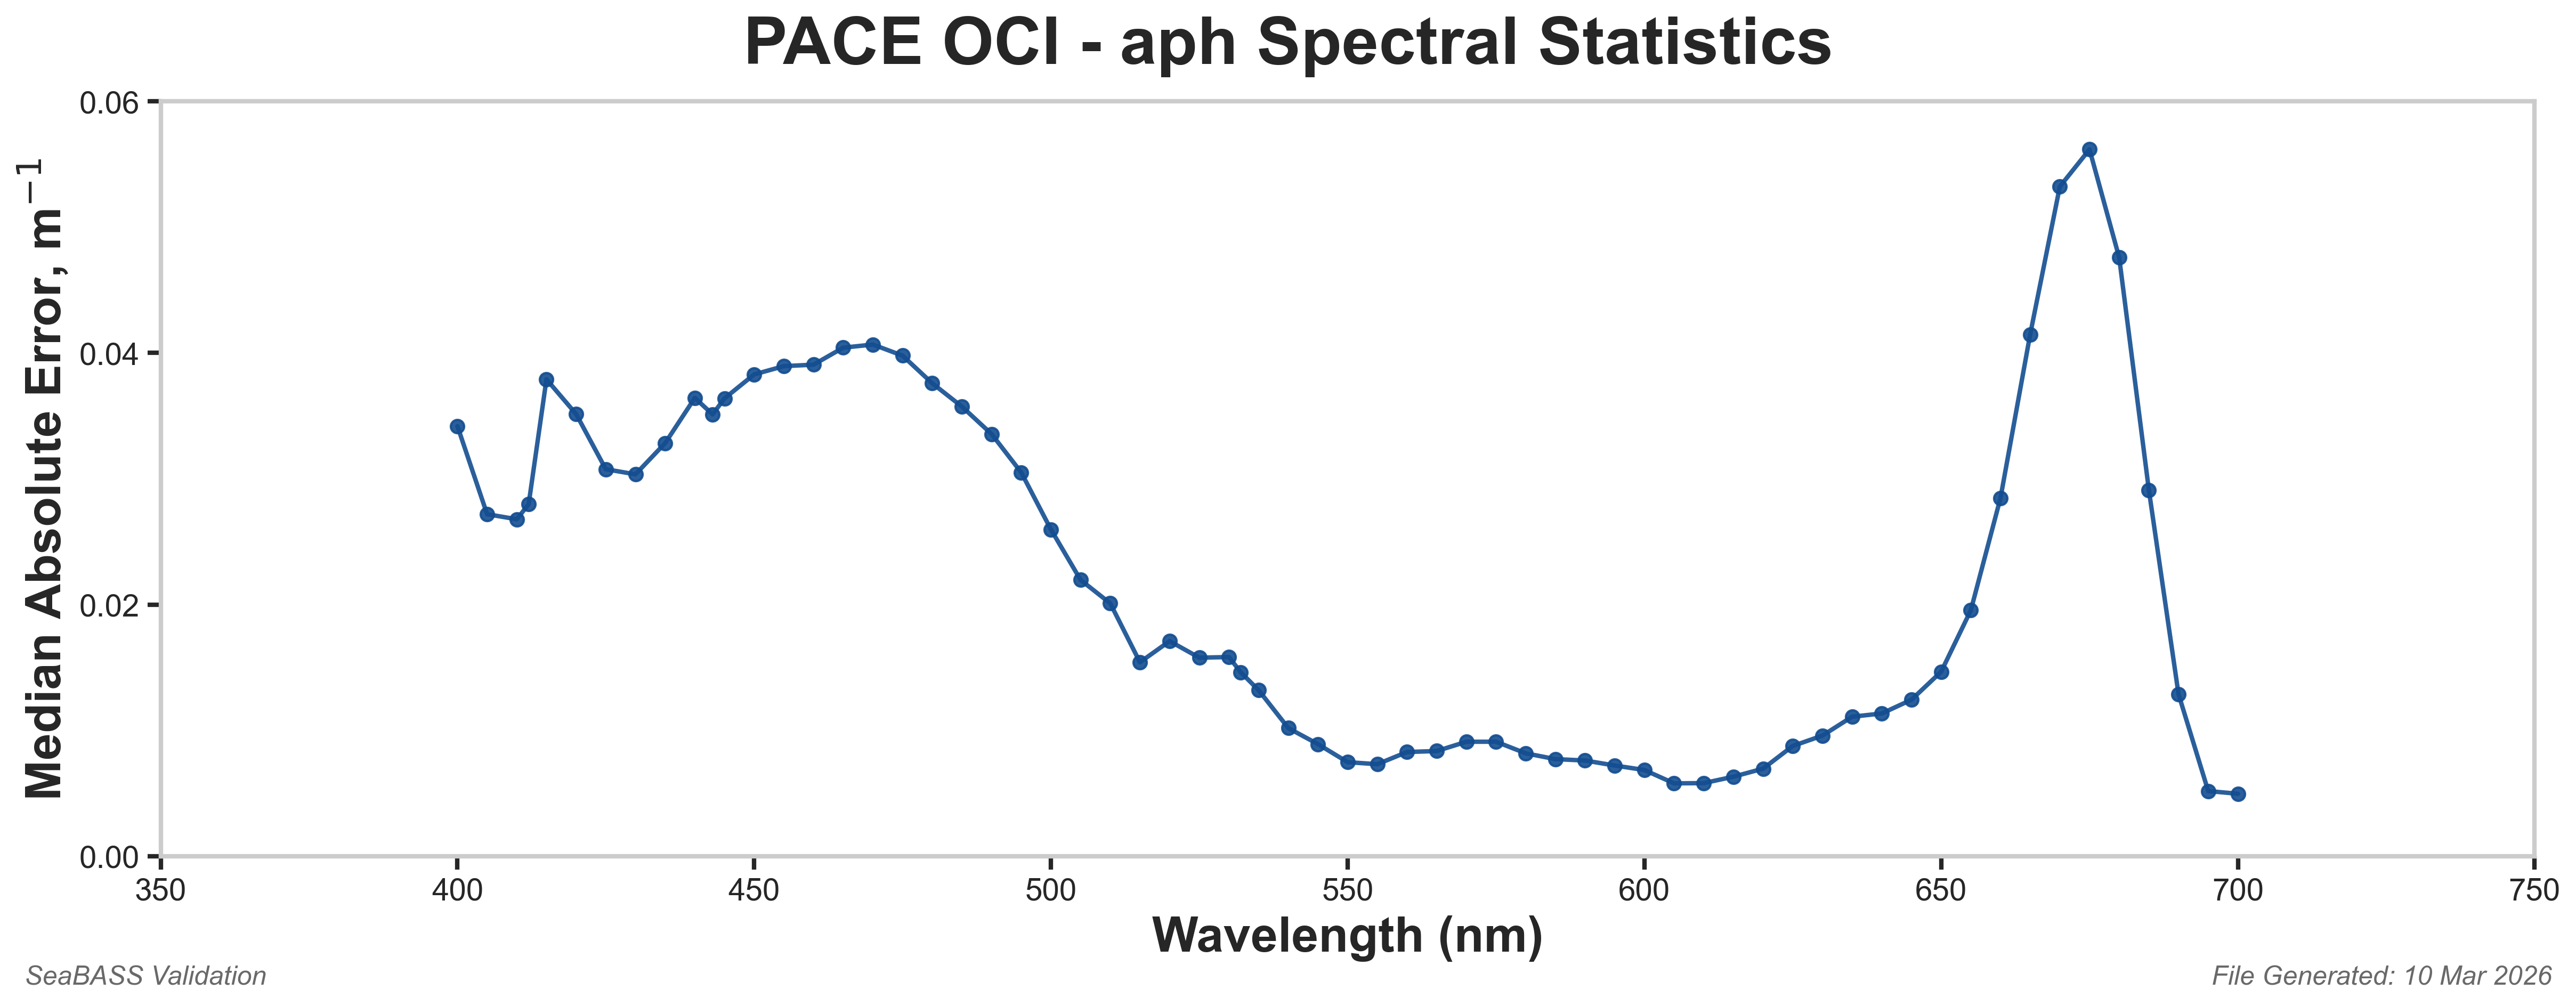
MedAE [View plot] |
Matchup Plots | |
| Low | High | |||||||||
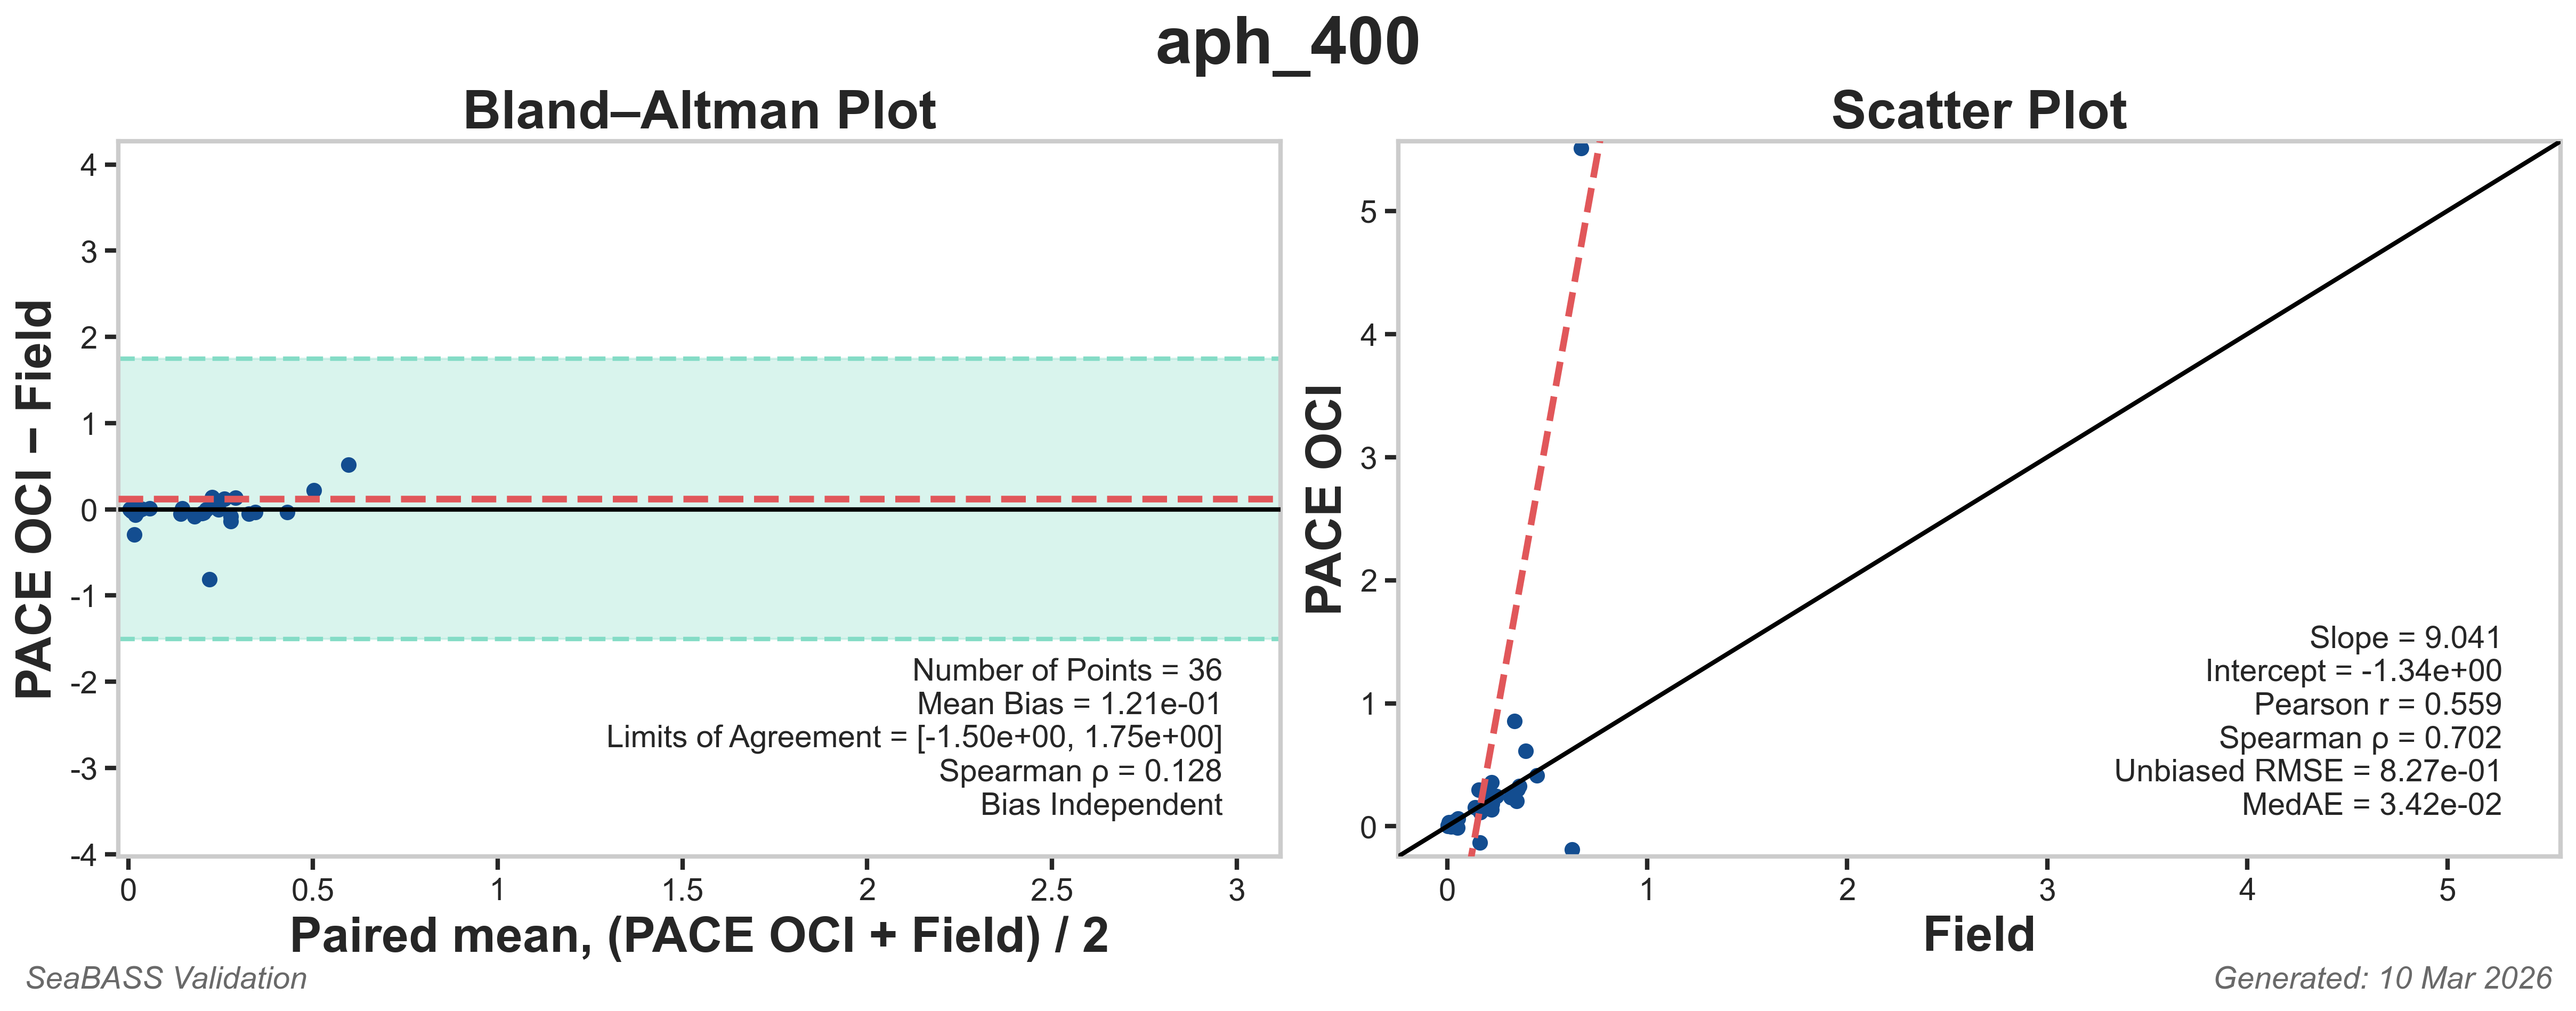
| aph_400 | 0.0337 | -0.412 | 0.48 | 2.55 | -0.202 | 0.75 | 0.916 | 0.225 | 0.0113 | Click here |
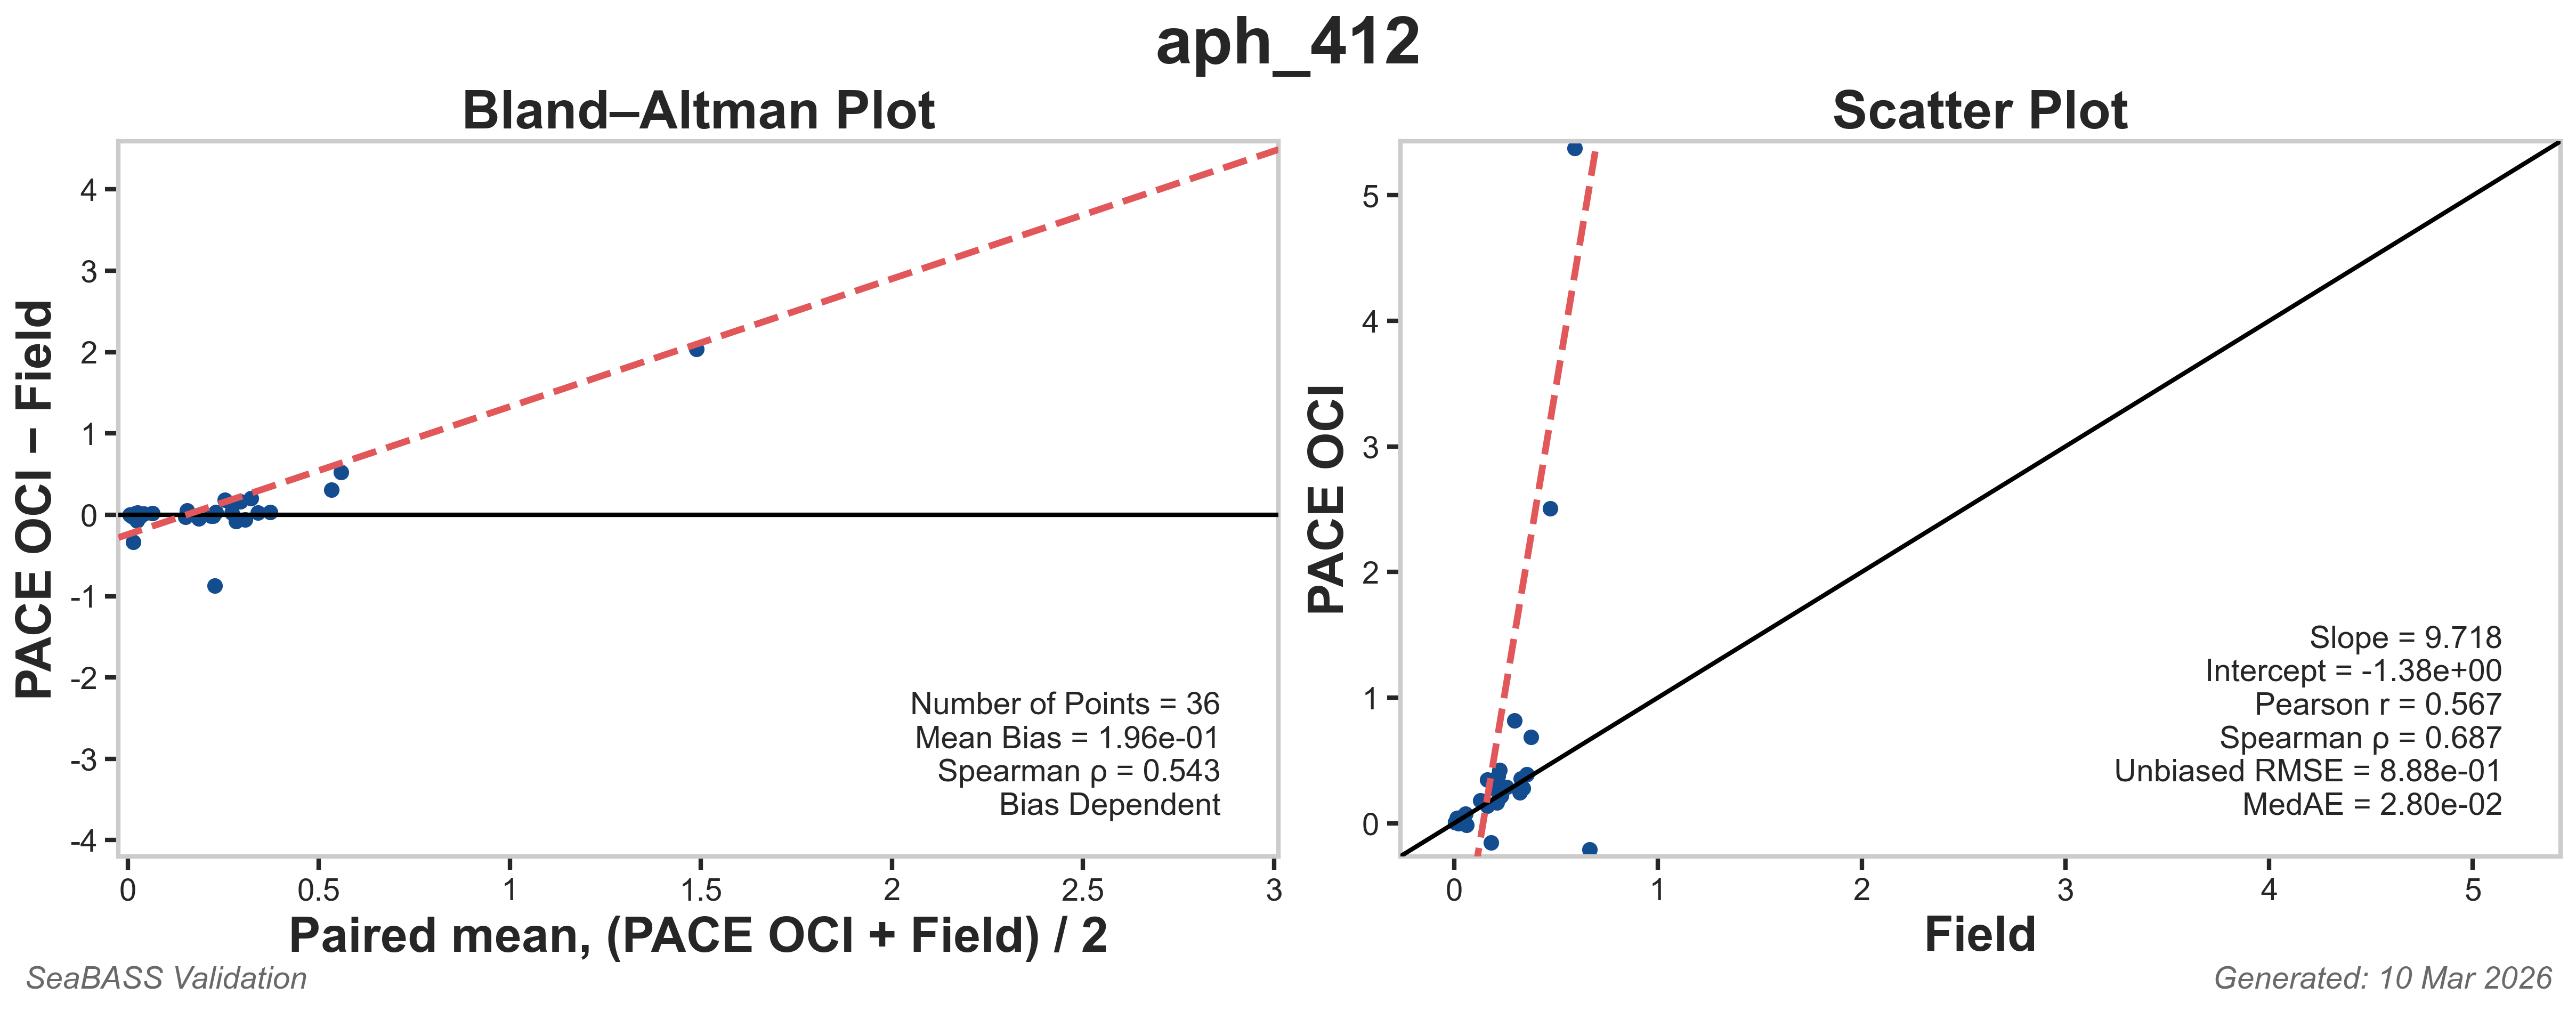
| aph_412 | 0.0607 | -999 | -999 | 2.85 | -0.223 | 0.781 | 0.909 | 0.245 | 0.0205 | Click here |
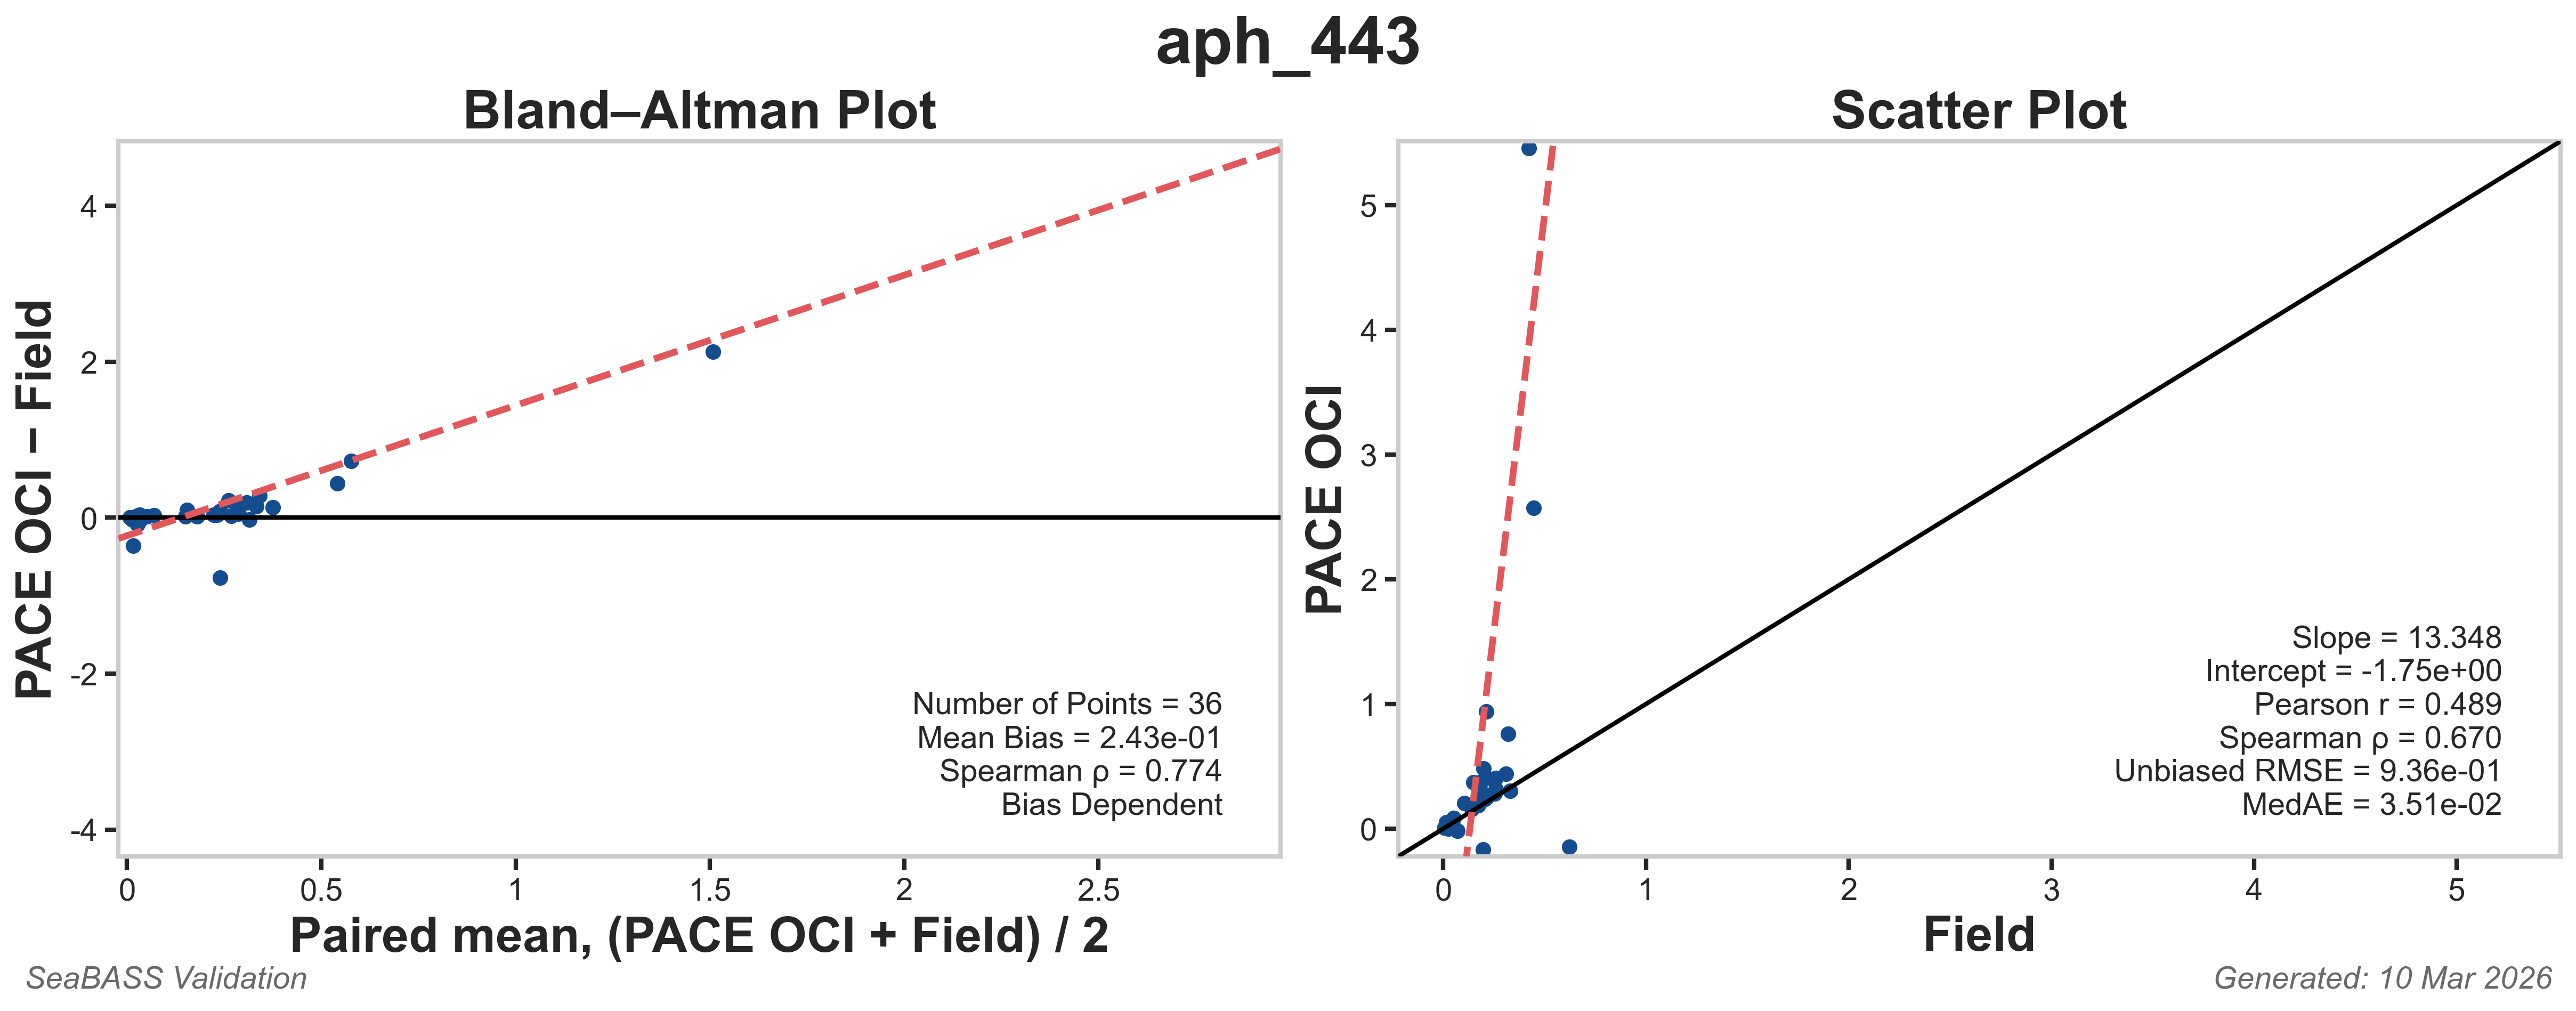
| aph_443 | 0.143 | -999 | -999 | 7.51 | -0.769 | 0.642 | 0.882 | 0.529 | 0.0294 | Click here |
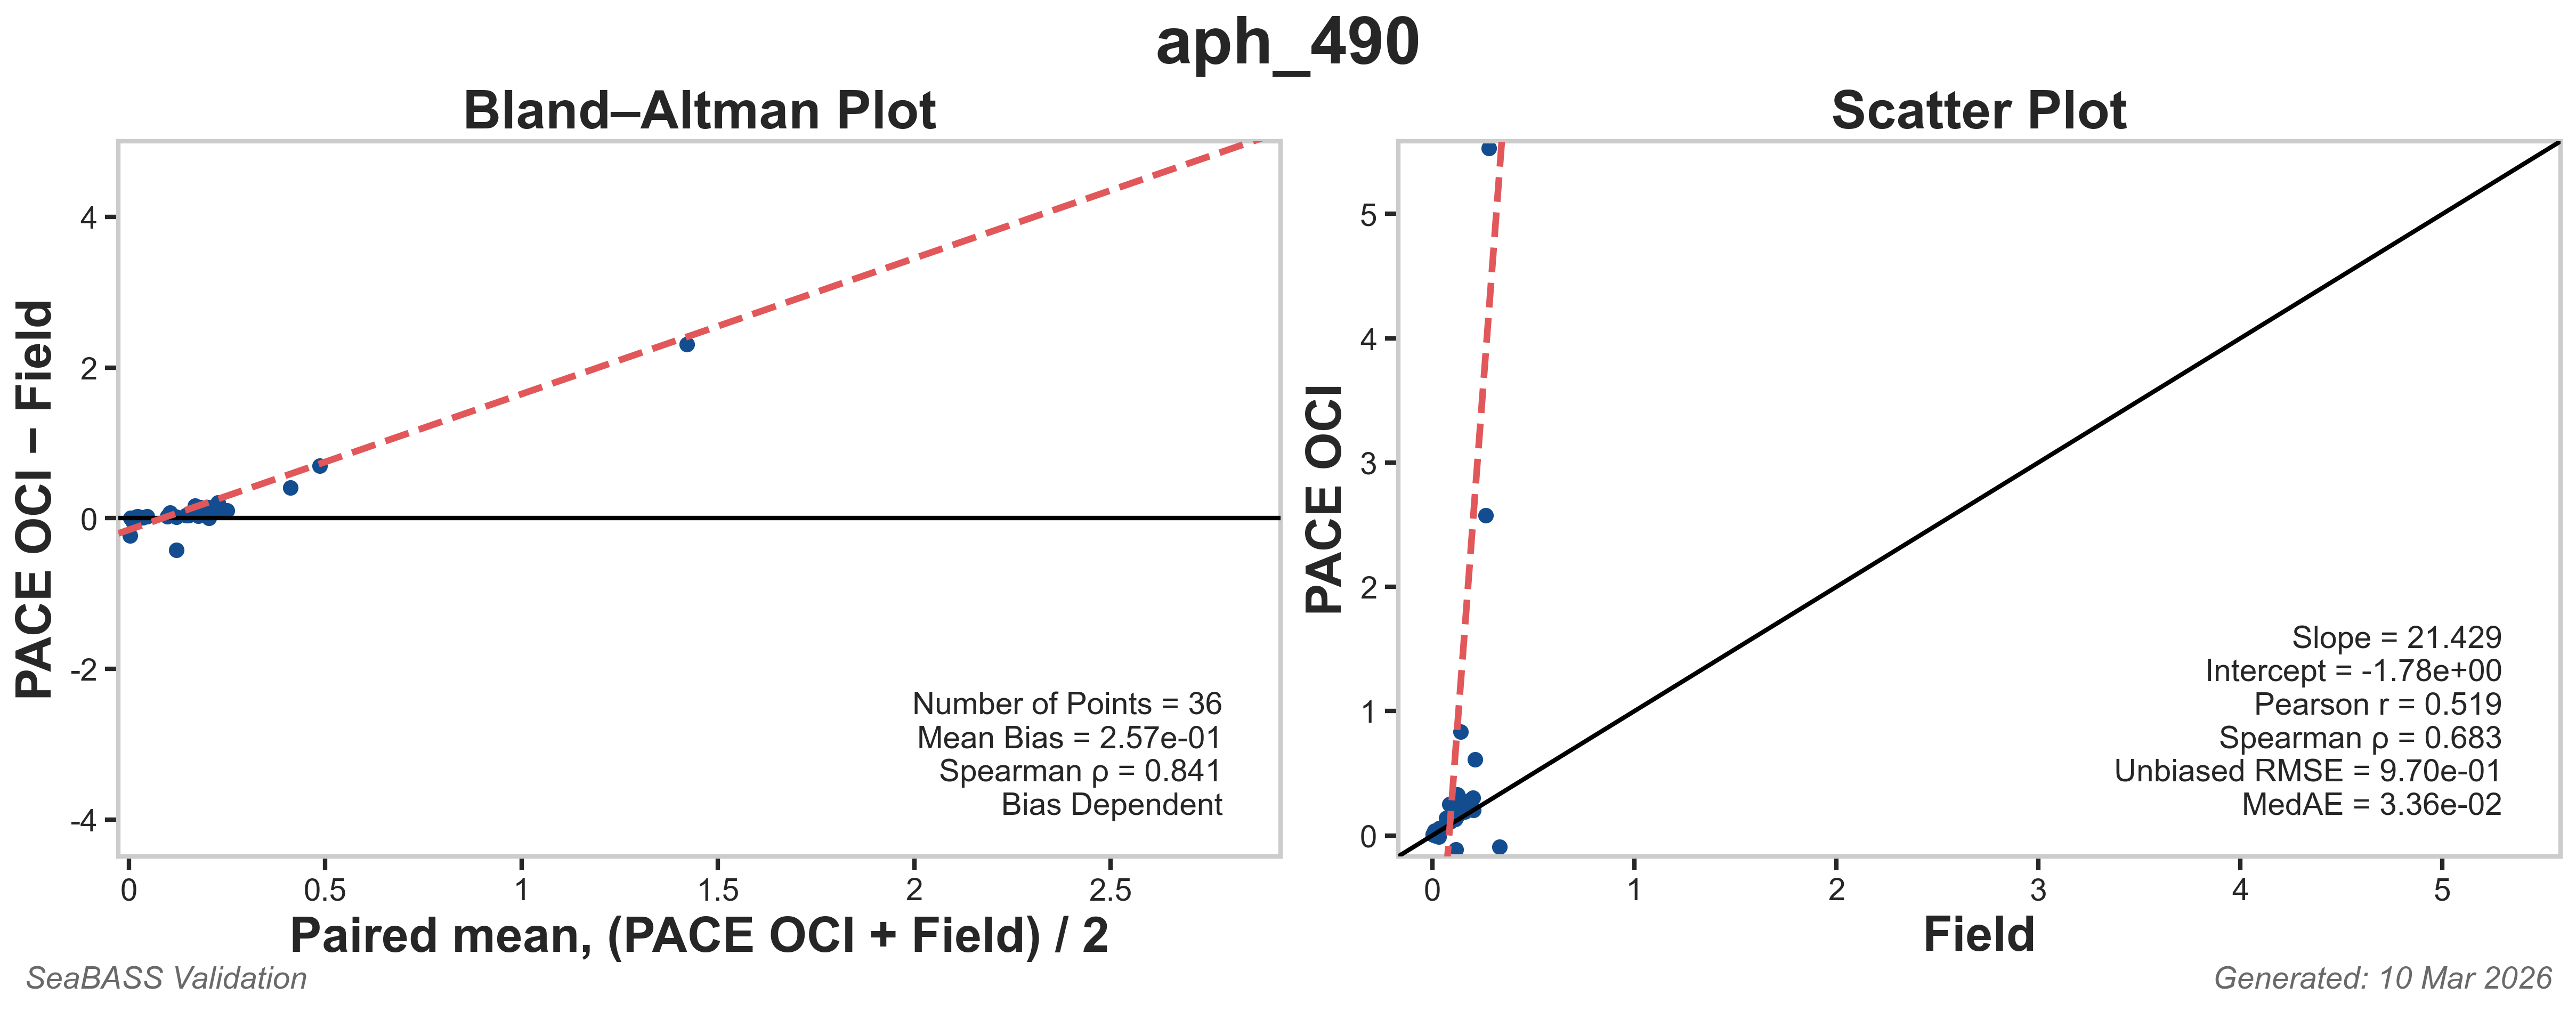
| aph_490 | 0.0901 | -999 | -999 | 6.07 | -0.357 | 0.678 | 0.887 | 0.279 | 0.0208 | Click here |
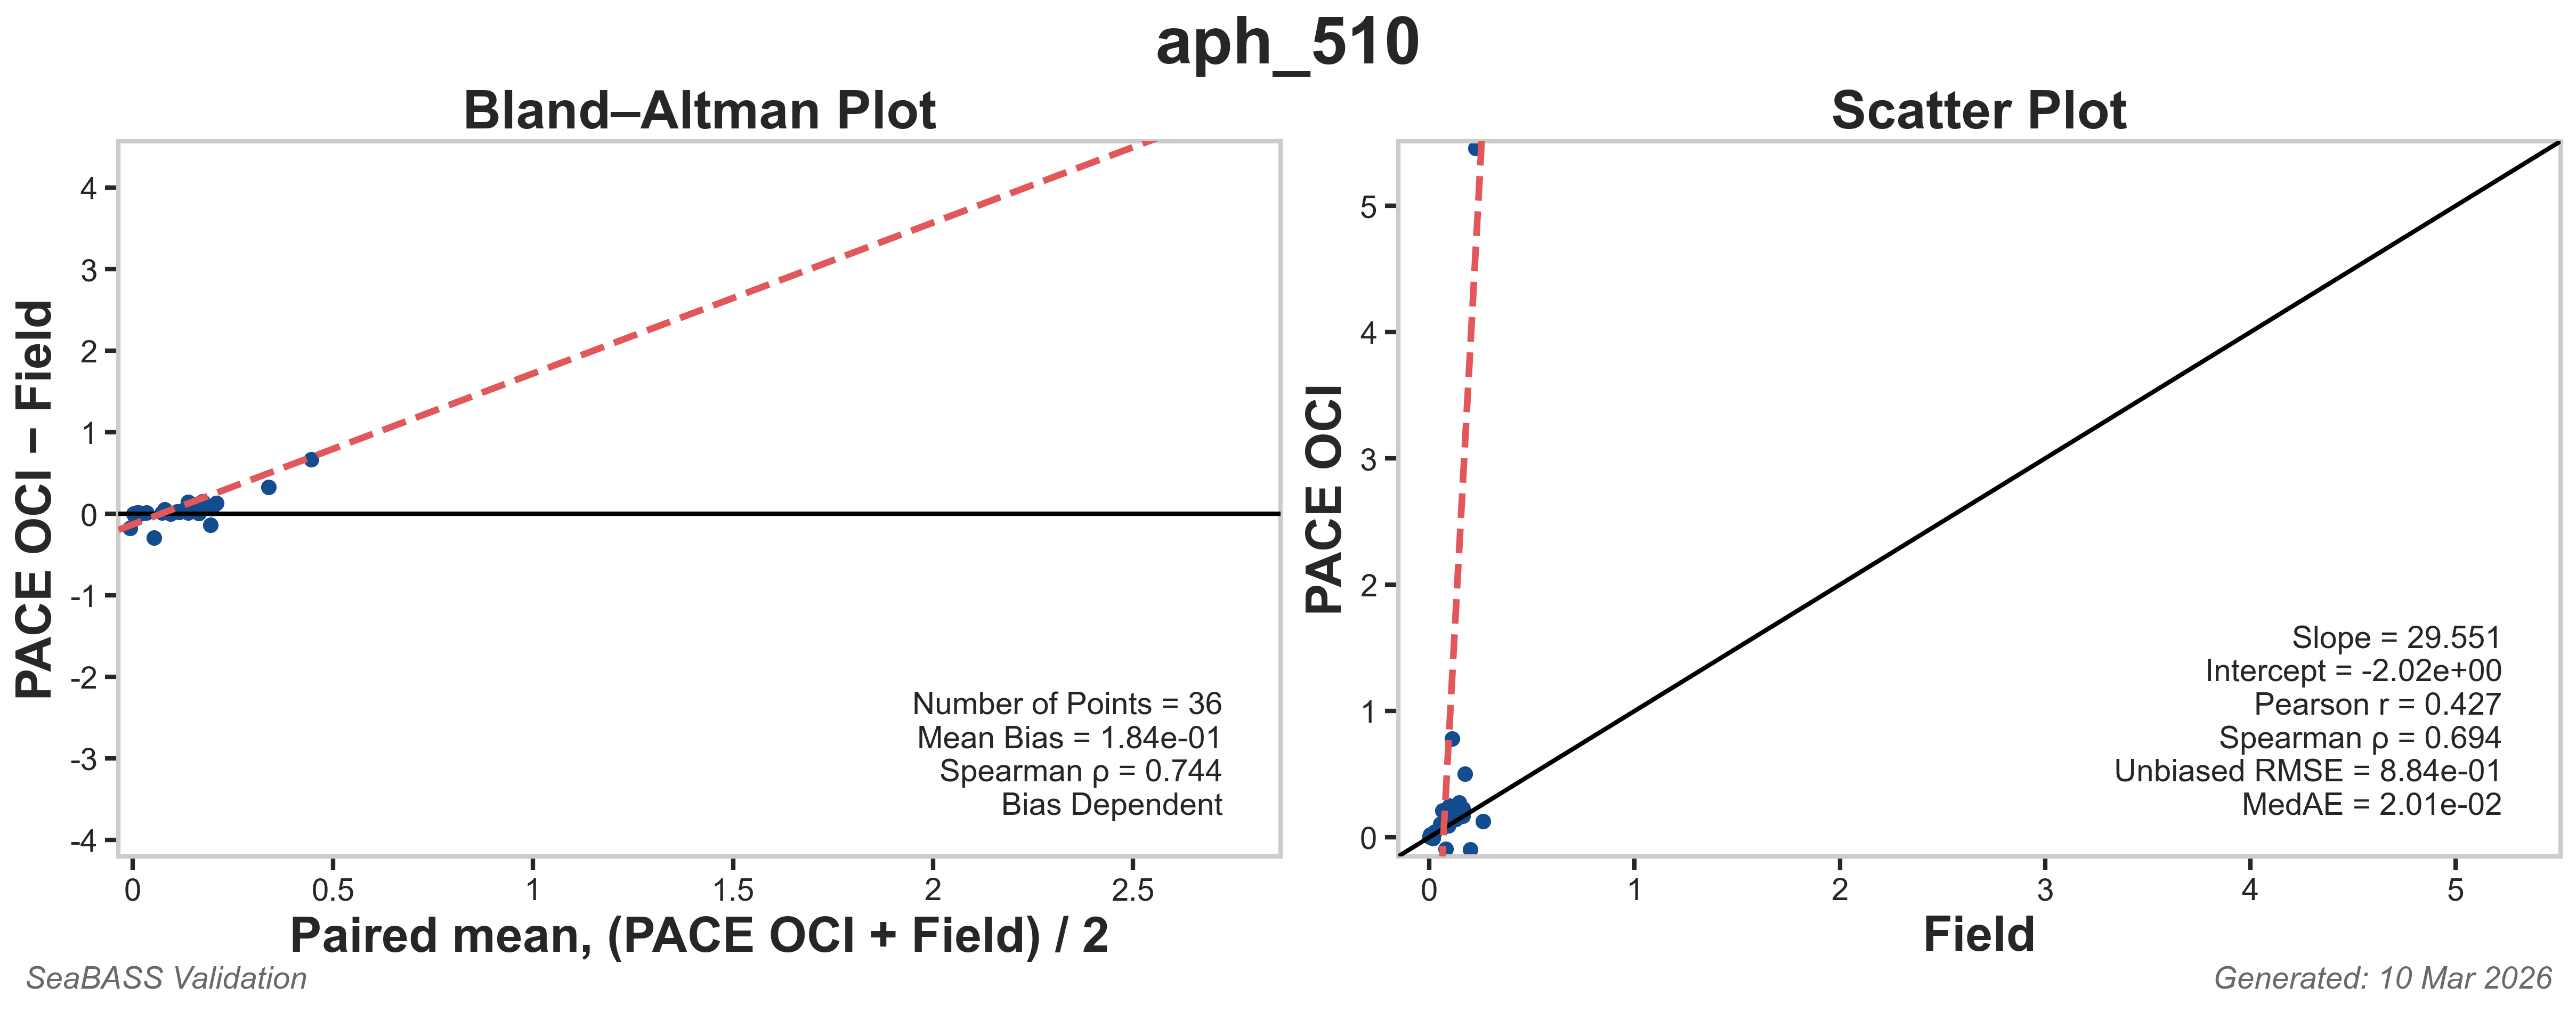
| aph_510 | 0.0596 | -999 | -999 | 4.38 | -0.169 | 0.735 | 0.899 | 0.166 | 0.0153 | Click here |
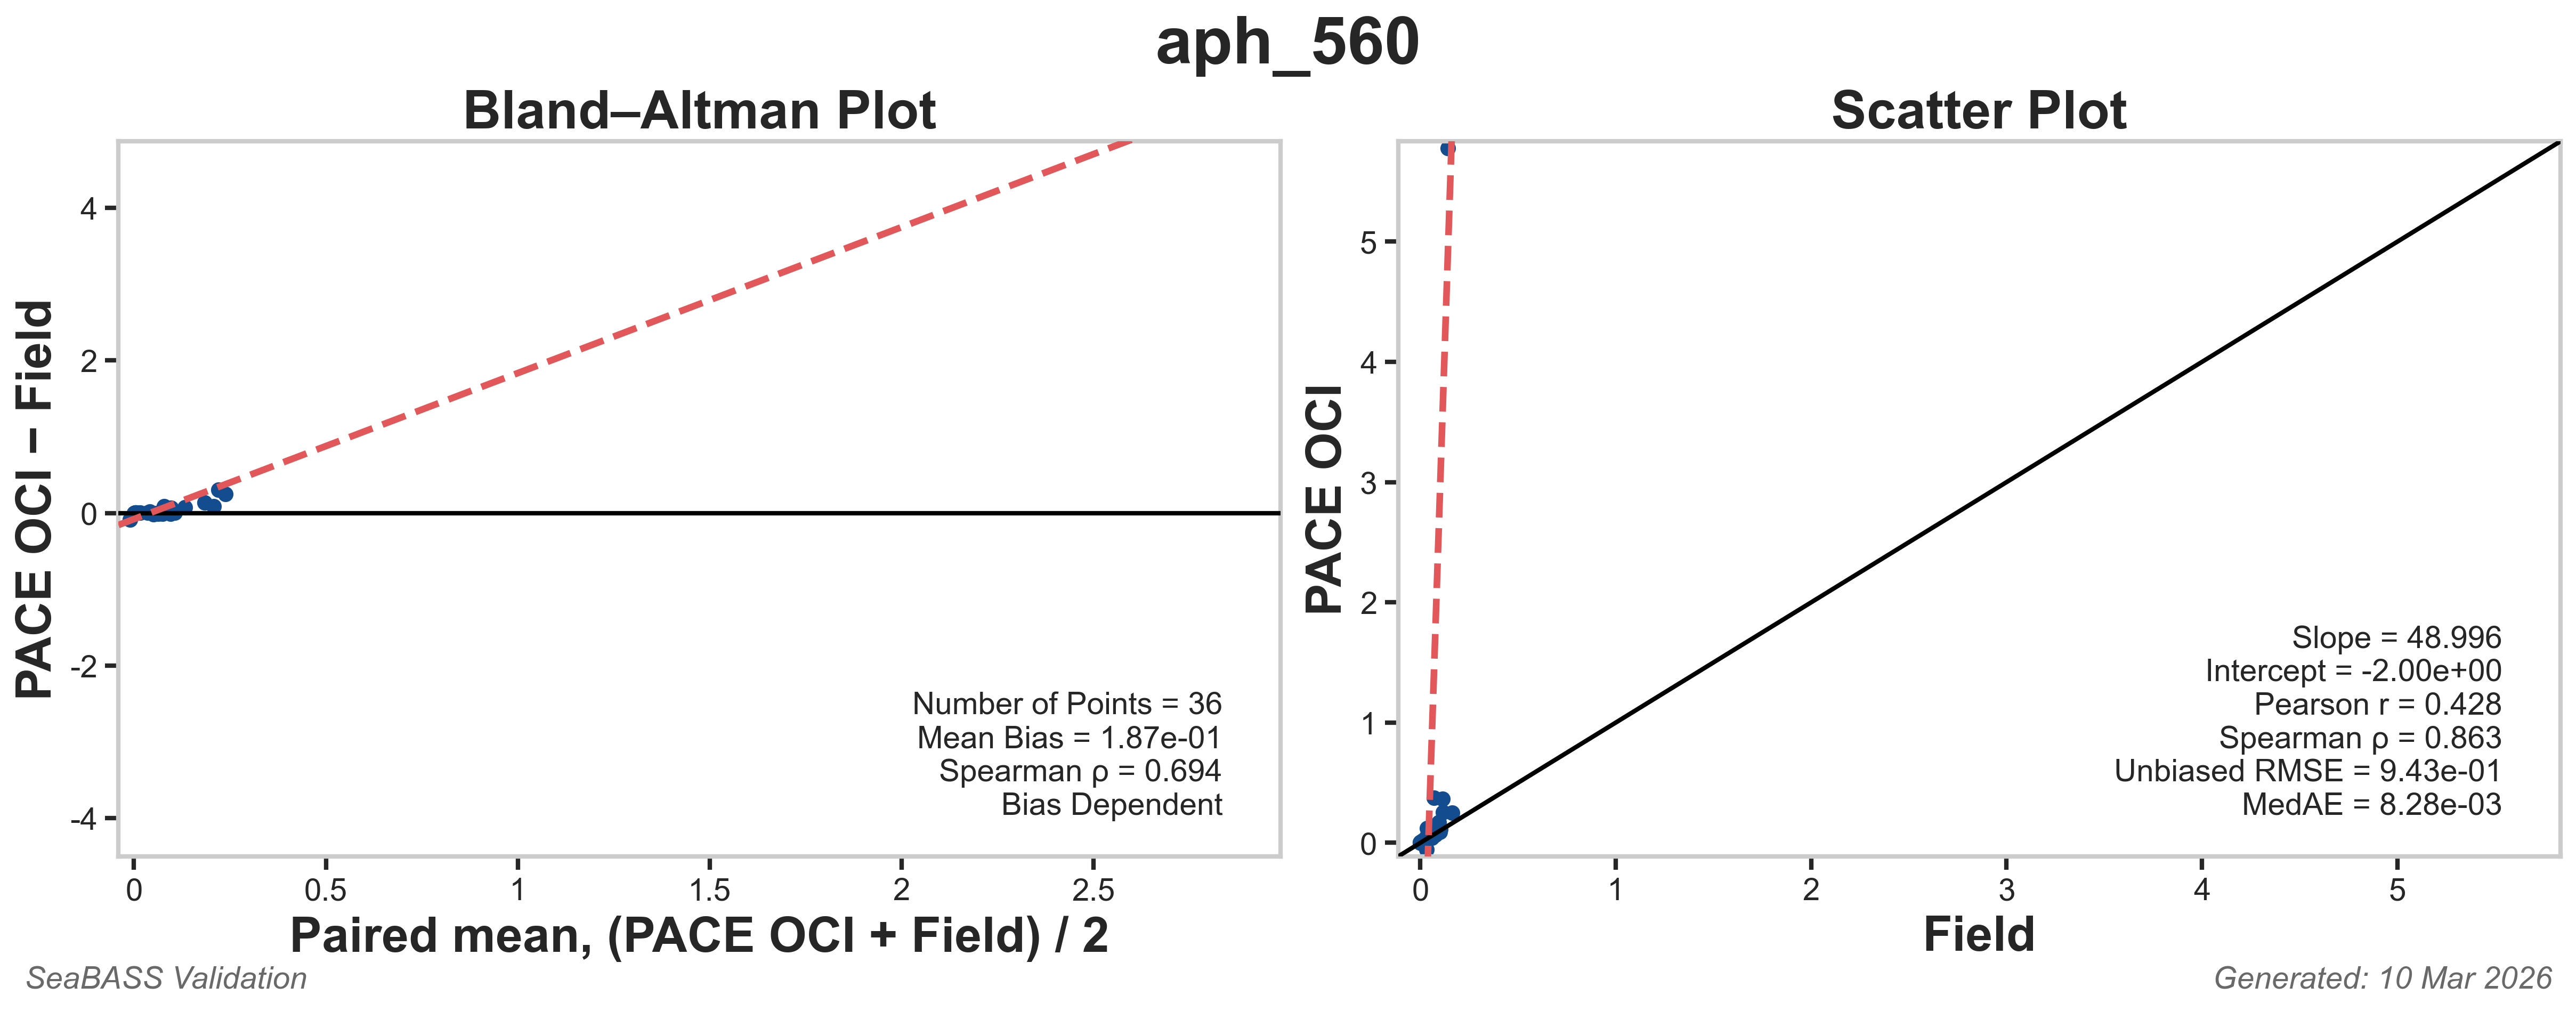
| aph_560 | 0.015 | -999 | -999 | 2.06 | -0.0257 | 0.836 | 0.924 | 0.0442 | 0.00753 | Click here |
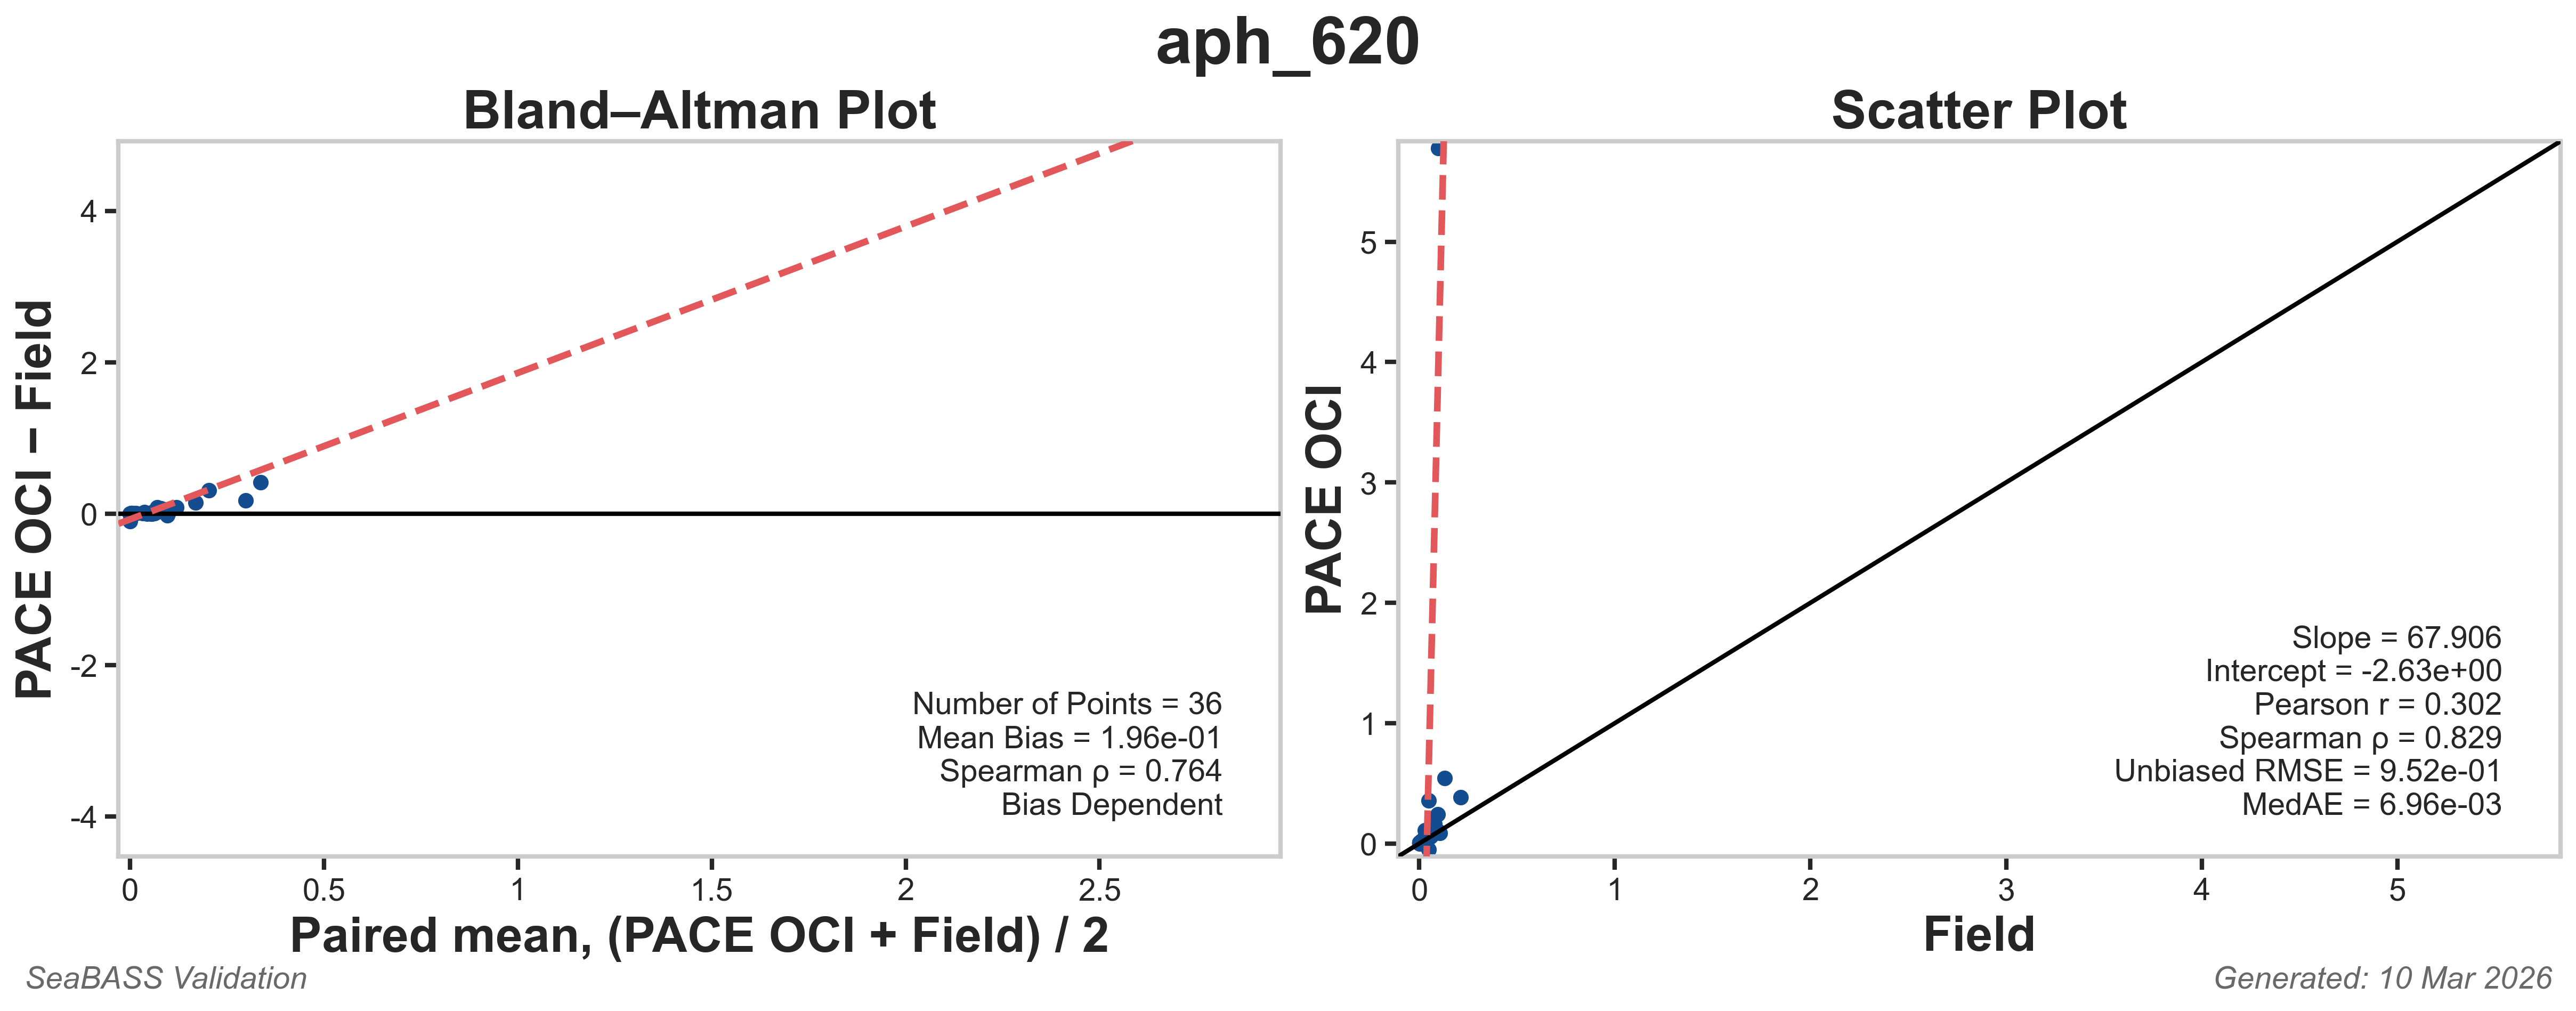
| aph_620 | 0.0187 | -999 | -999 | 2.45 | -0.0309 | 0.778 | 0.895 | 0.0498 | 0.00958 | Click here |
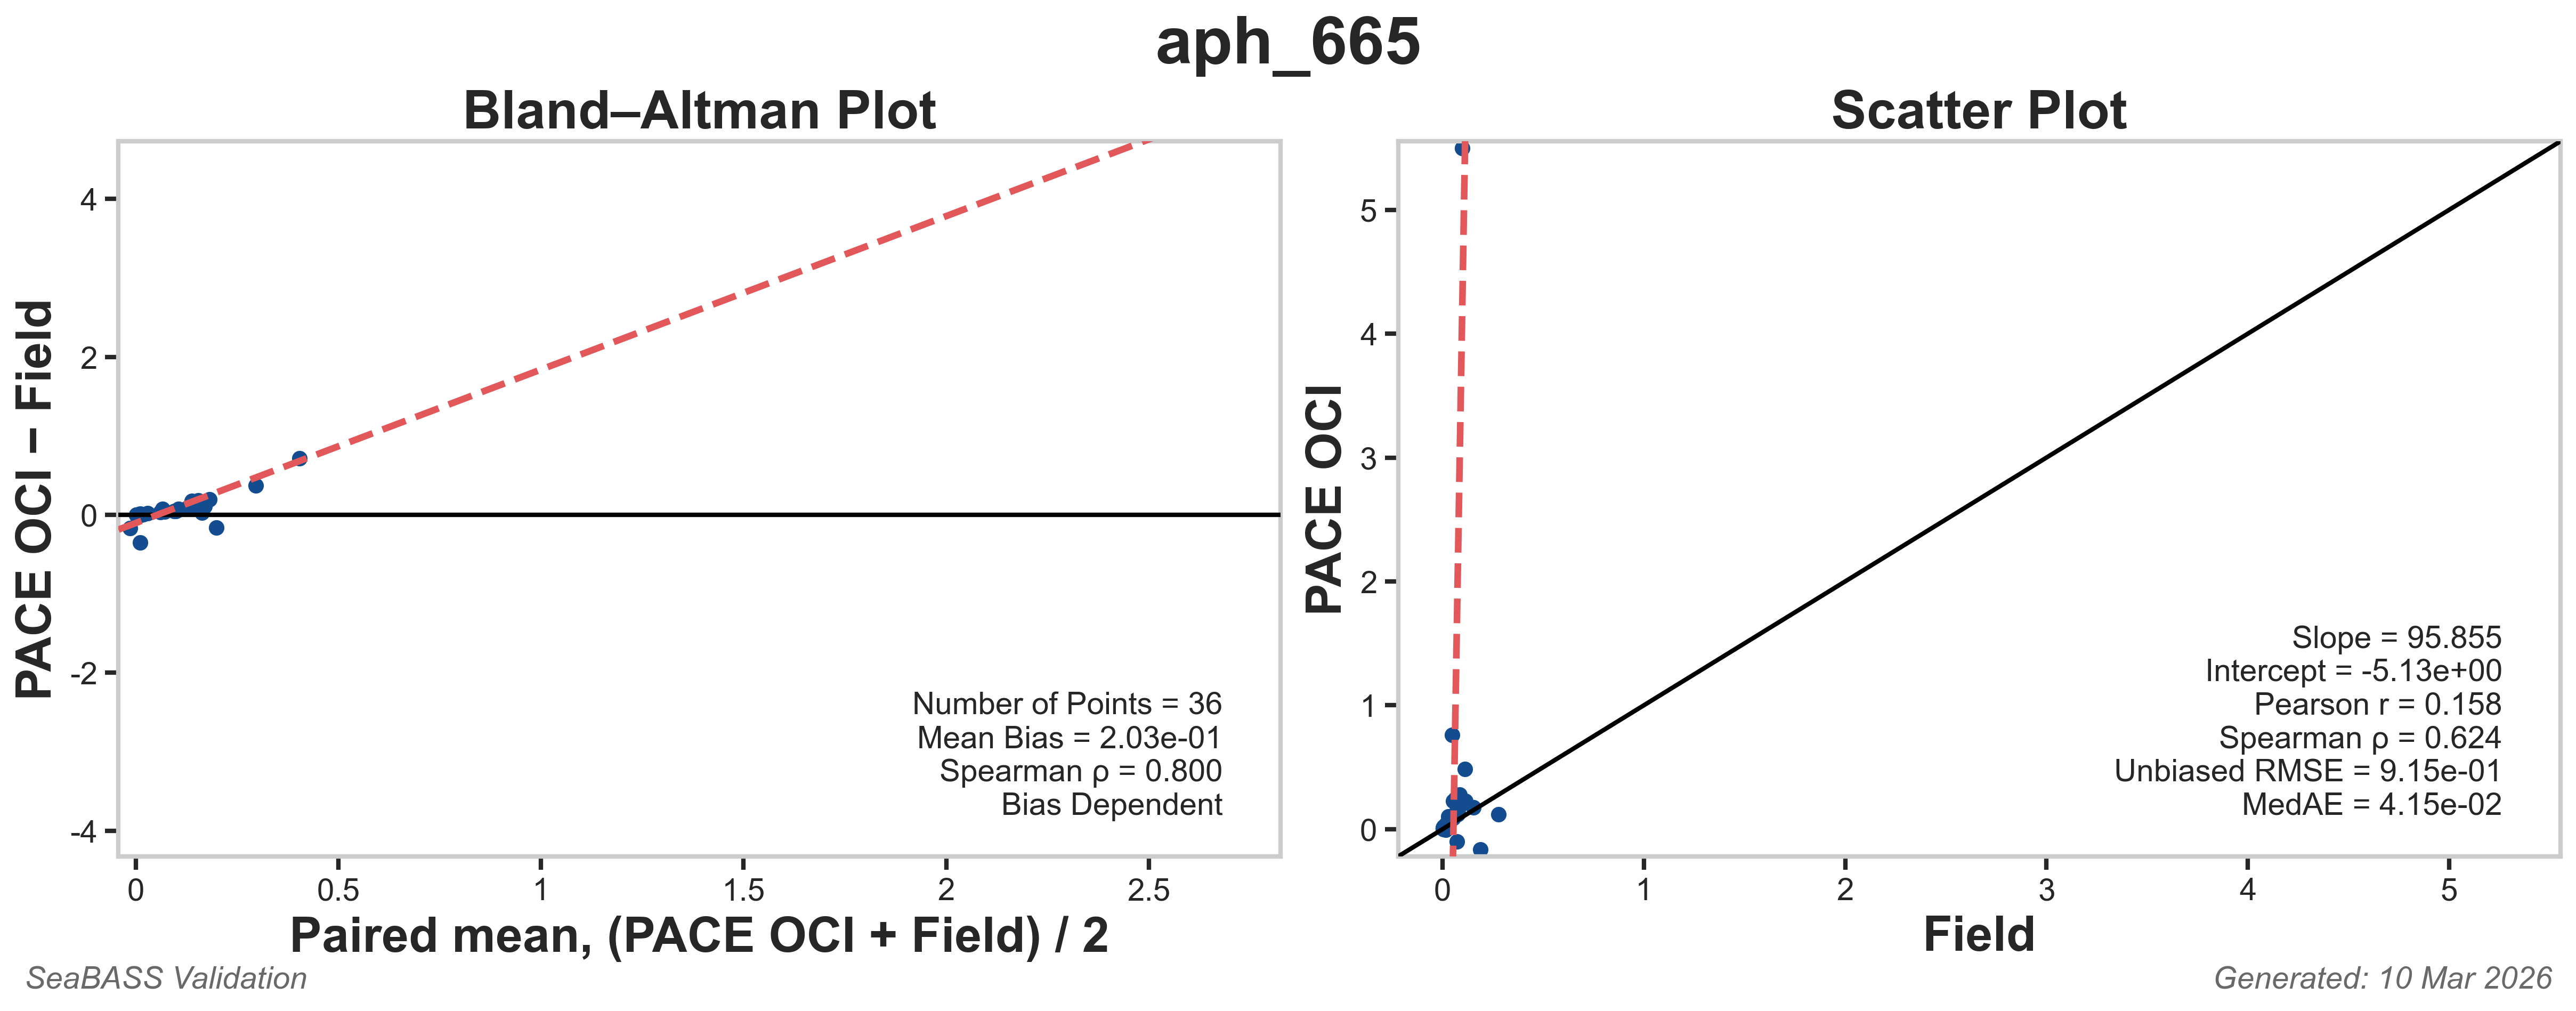
| aph_665 | 0.0654 | -999 | -999 | 4.81 | -0.119 | 0.677 | 0.868 | 0.13 | 0.0208 | Click here |
Disclaimer: The unbiased RMESs and Median Absolute Errors shown in the hyperspectral plots are preliminary. Visitors should expect updated values over time due to incoming datasets with different spatial and temporal variability coverages and dynamic ranges, as well as to algorithm refinements.
aph Matchup Plots
The data plotted below are Bland-Altman plots and Scatter plots for select aph matchups.