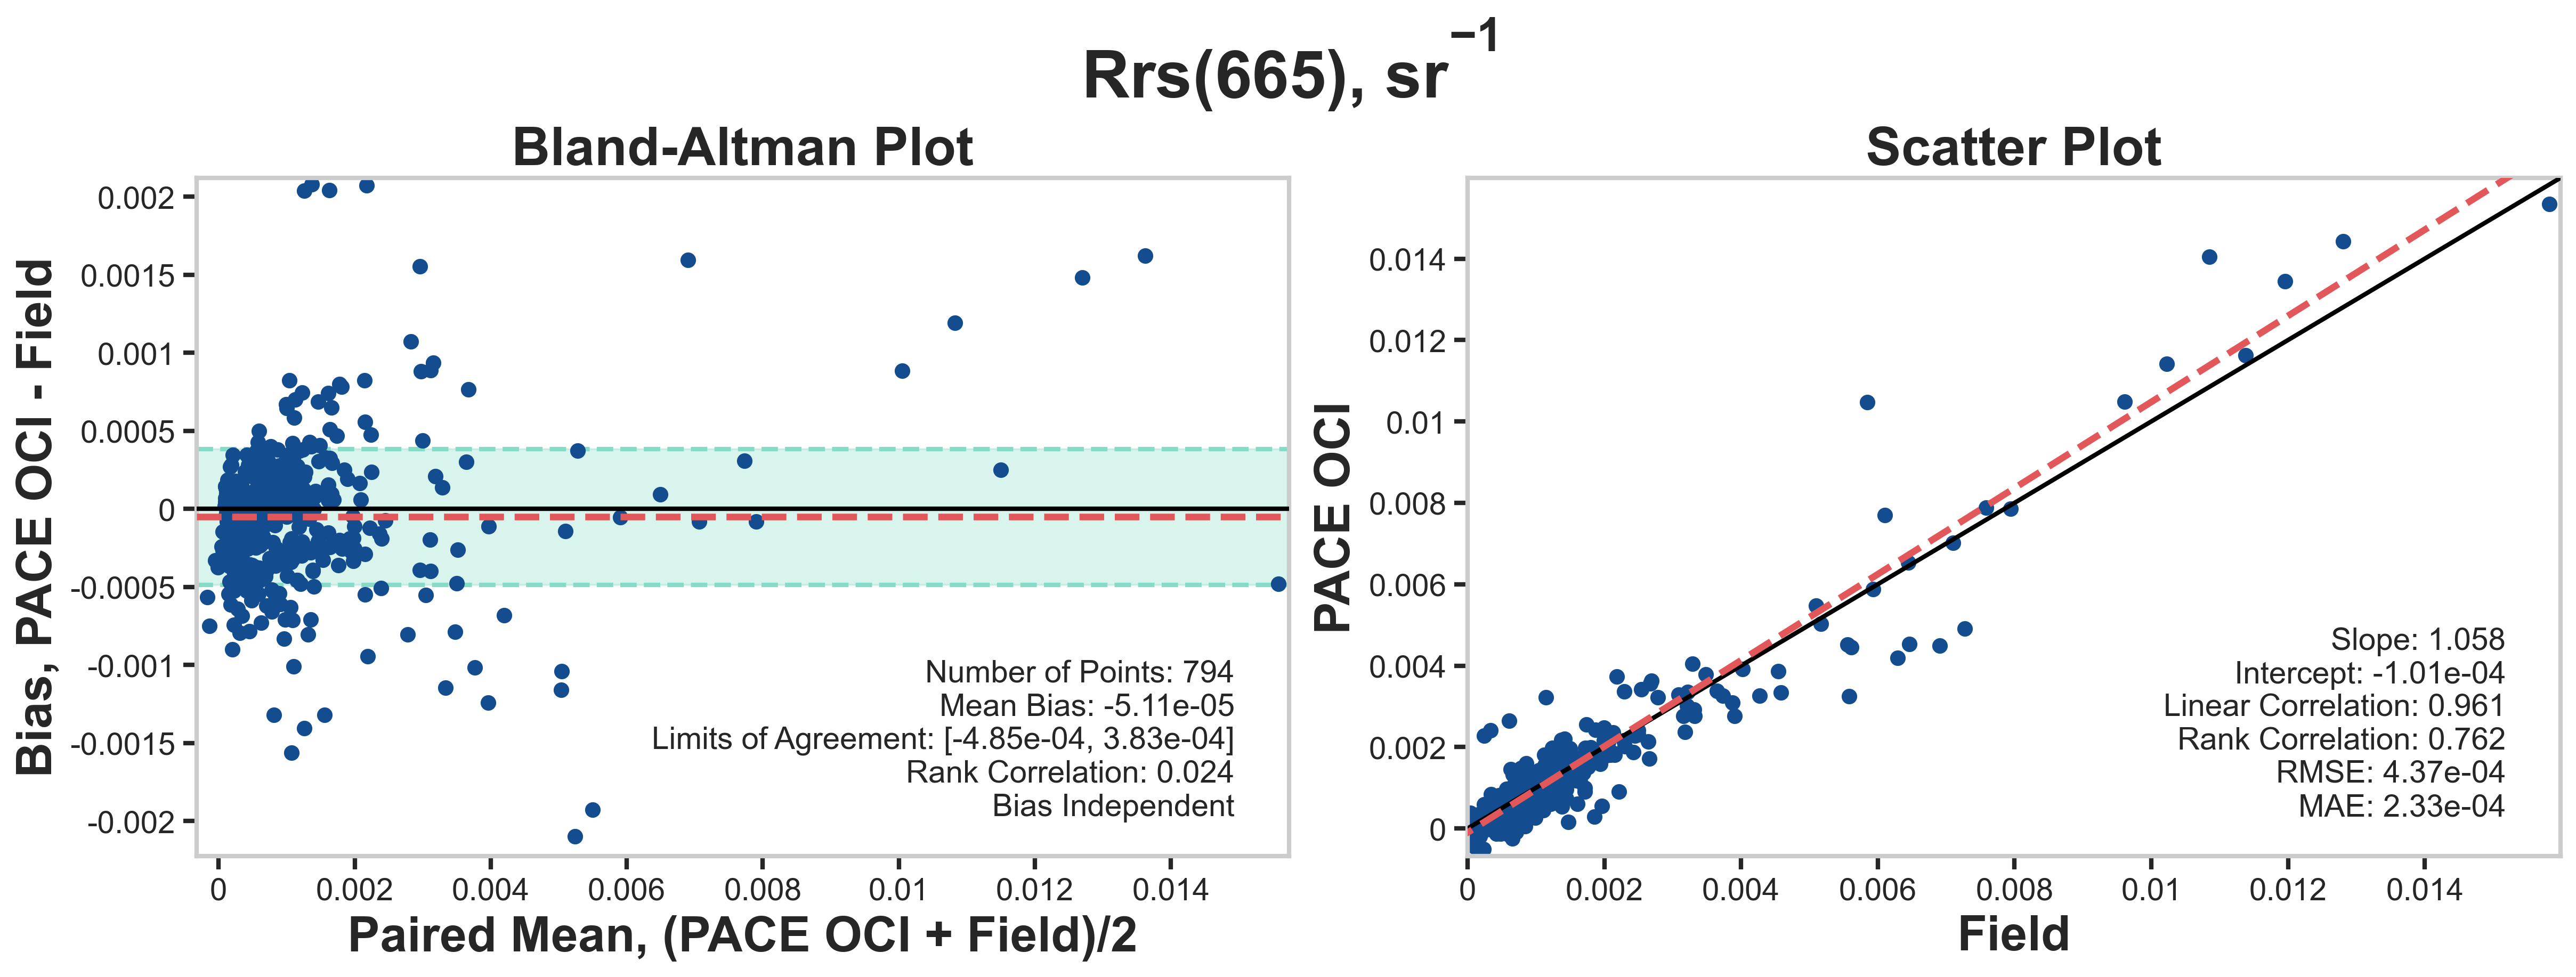

Here, we validate the spectral Remote Sensing Reflectance (Rrs), which is the amount of light leaving the sea surface towards the sensor normalized by the light reaching the sea surface from the entire upward hemisphere. For PACE-OCI, Rrs is derived through a series of quality control and atmospheric correction protocols.
|
Remote Sensing Reflectances (Rrs) Click to download data: Select Rrs matchup statistics | Select Rrs matchups |
||||||||||
|---|---|---|---|---|---|---|---|---|---|---|
| Wavelength | Mean Bias | Limits of Agreement | Linear Slope | Linear Intercept | Linear Correlation | Rank Correlation | uRMSE [View plot] |
MedAE [View plot] |
Matchup Plots | |
| Low | High | |||||||||
| Rrs_400 | 1.38E-05 | -999 | -999 | 1.16 | -0.000638 | 0.873 | 0.815 | 0.00168 | 0.000836 | Click here |
| Rrs_412 | -0.000423 | -999 | -999 | 1.09 | -0.000797 | 0.892 | 0.849 | 0.00146 | 0.000787 | Click here |
| Rrs_443 | -0.000316 | -999 | -999 | 1.04 | -0.000498 | 0.926 | 0.896 | 0.00108 | 0.000639 | Click here |
| Rrs_490 | -0.000221 | -0.00193 | 0.00149 | 1.01 | -0.000286 | 0.952 | 0.918 | 0.000873 | 0.000456 | Click here |
| Rrs_510 | -0.000116 | -0.00166 | 0.00143 | 1.02 | -0.000194 | 0.961 | 0.882 | 0.000787 | 0.000362 | Click here |
| Rrs_560 | -6.49E-05 | -00145 | 0.00132 | 1.03 | -0.000186 | 0.976 | 0.935 | 0.000707 | 0.00028 | Click here |
| Rrs_620 | -5.33E-05 | -999 | -999 | 1.01 | -6.14E-05 | 0.959 | 0.863 | 0.000441 | 0.000168 | Click here |
| Rrs_665 | -6.33E-05 | -999 | -999 | 0.981 | -4.91E-05 | 0.937 | 0.802 | 0.000375 | 0.000131 | Click here |
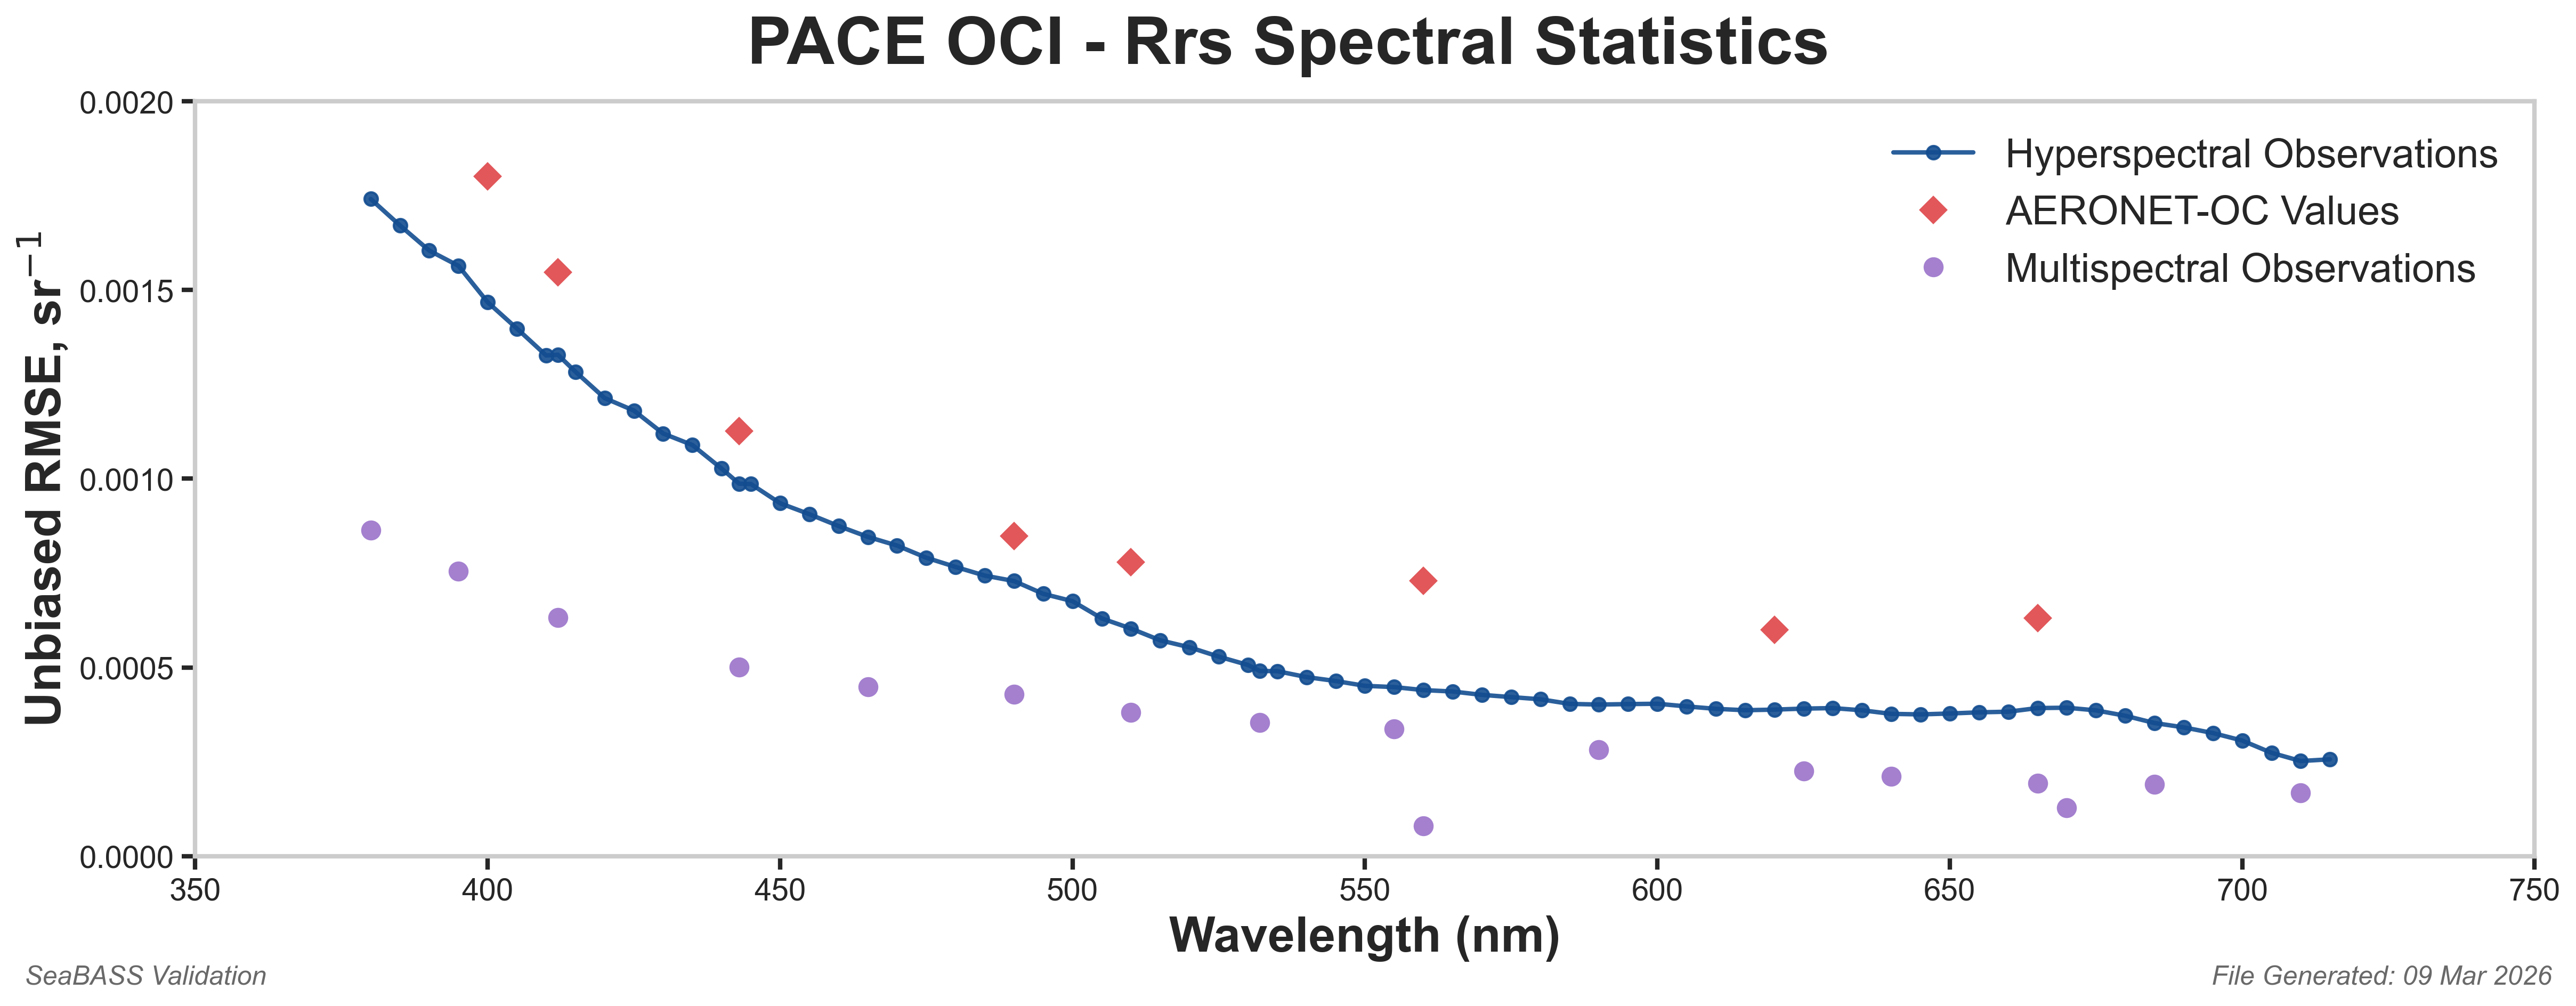
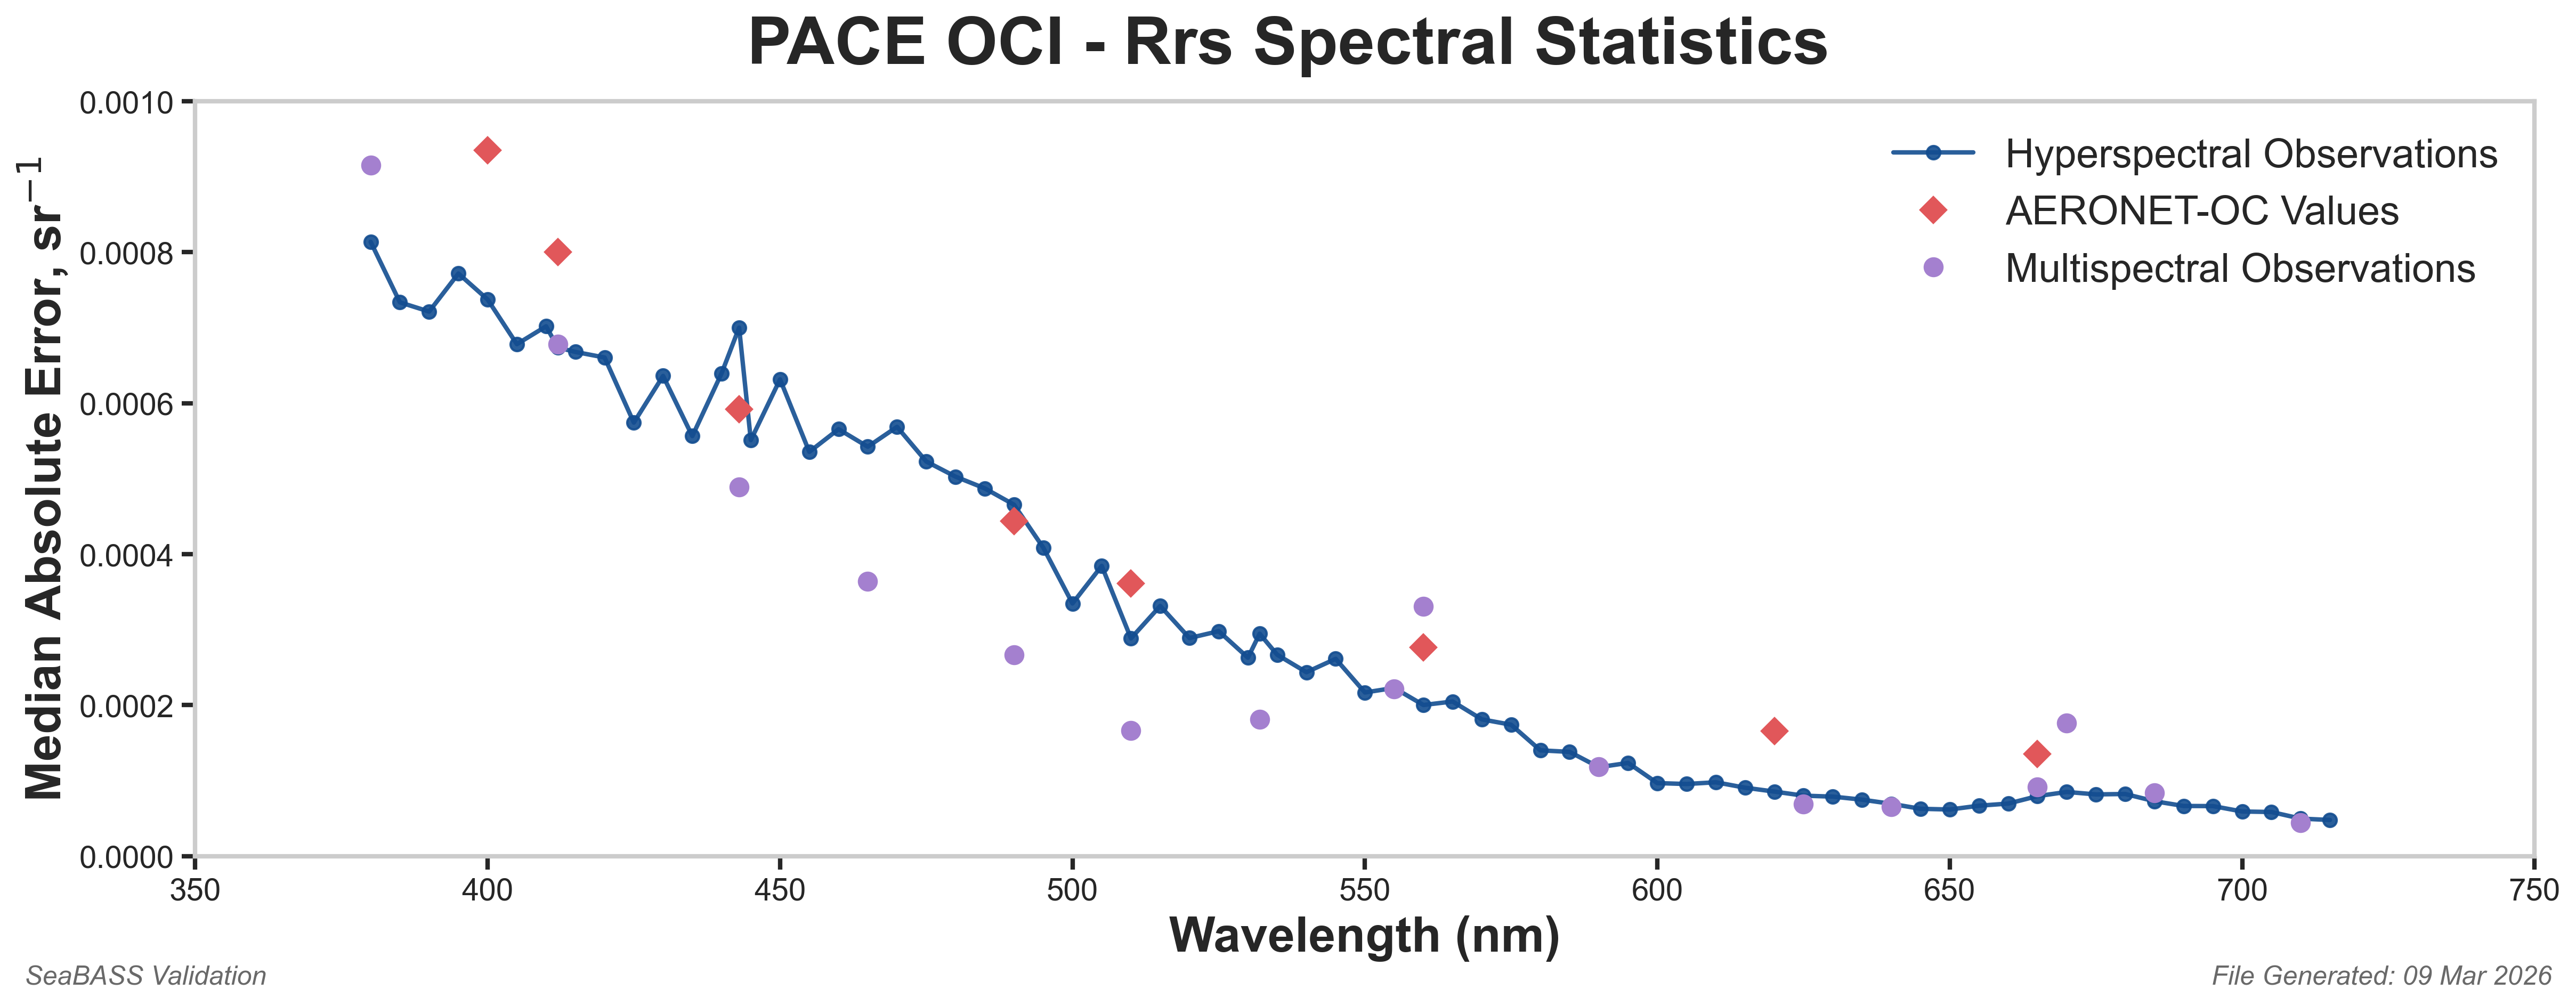
Disclaimer: The unbiased RMESs and Median Absolute Errors shown in the hyperspectral plots are preliminary. Visitors should expect updated values over time due to incoming datasets with different spatial and temporal variability coverages and dynamic ranges, as well as to algorithm refinements.
Rrs Matchup Plots
The data plotted below are Bland-Altman plots and Scatter plots for select Rrs matchups. In the select Rrs matchups file, Aeronet-OC data have the "env_" prefix. PACE data have the "oci_" prefix. For clarity in regions with many overlapping matchups, the scatter points are colored by relative local point density. The color scale shows relative local point density, with lower values representing more isolated matchups and higher values representing denser clusters of nearby matchups. This density coloring is used only to improve plot readability and does not change the matchup statistics shown above.