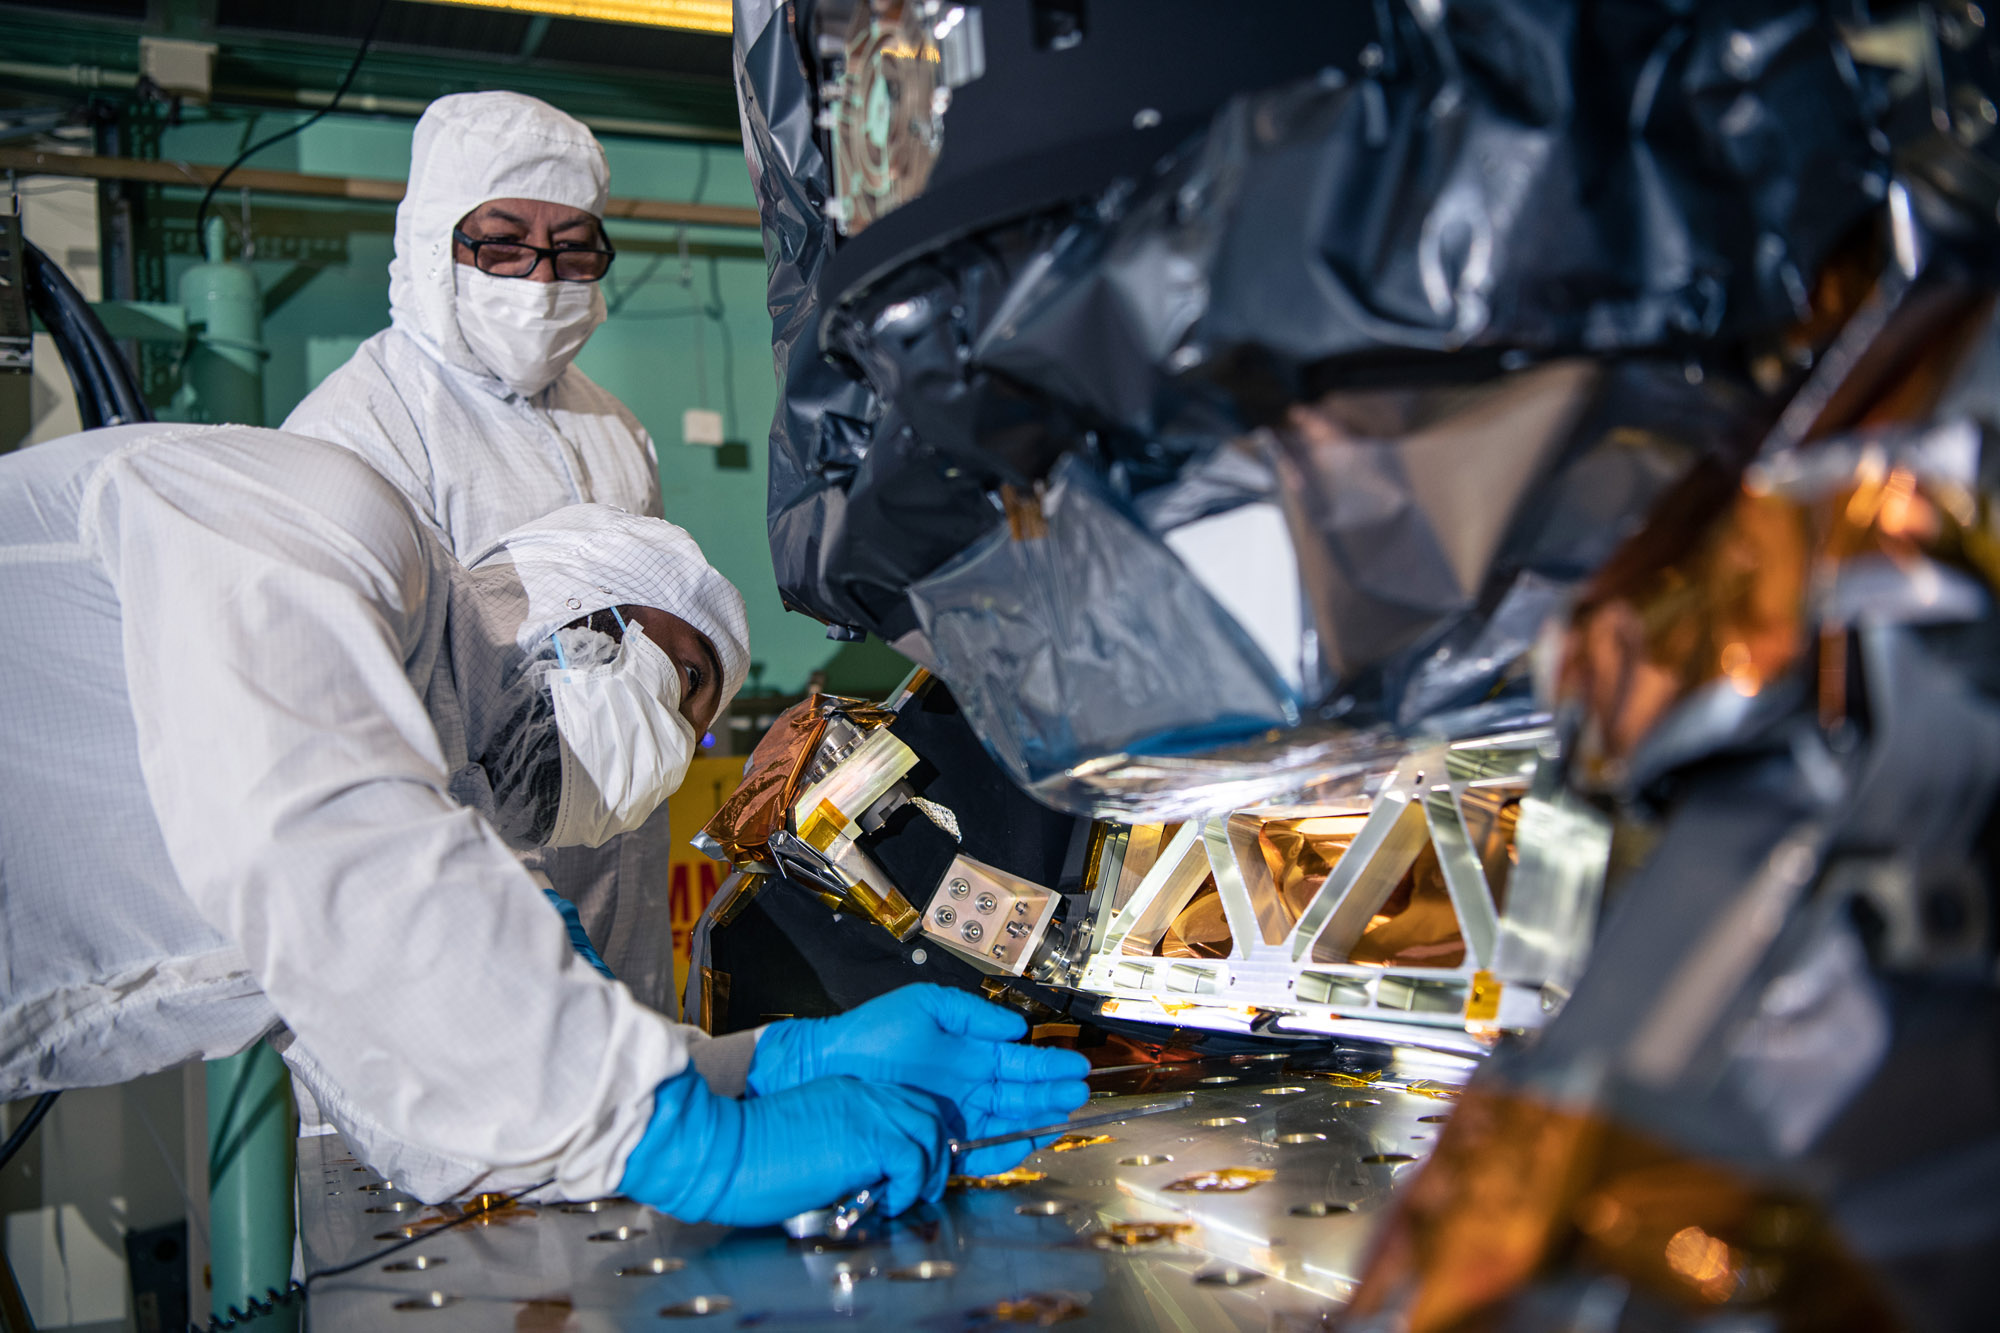
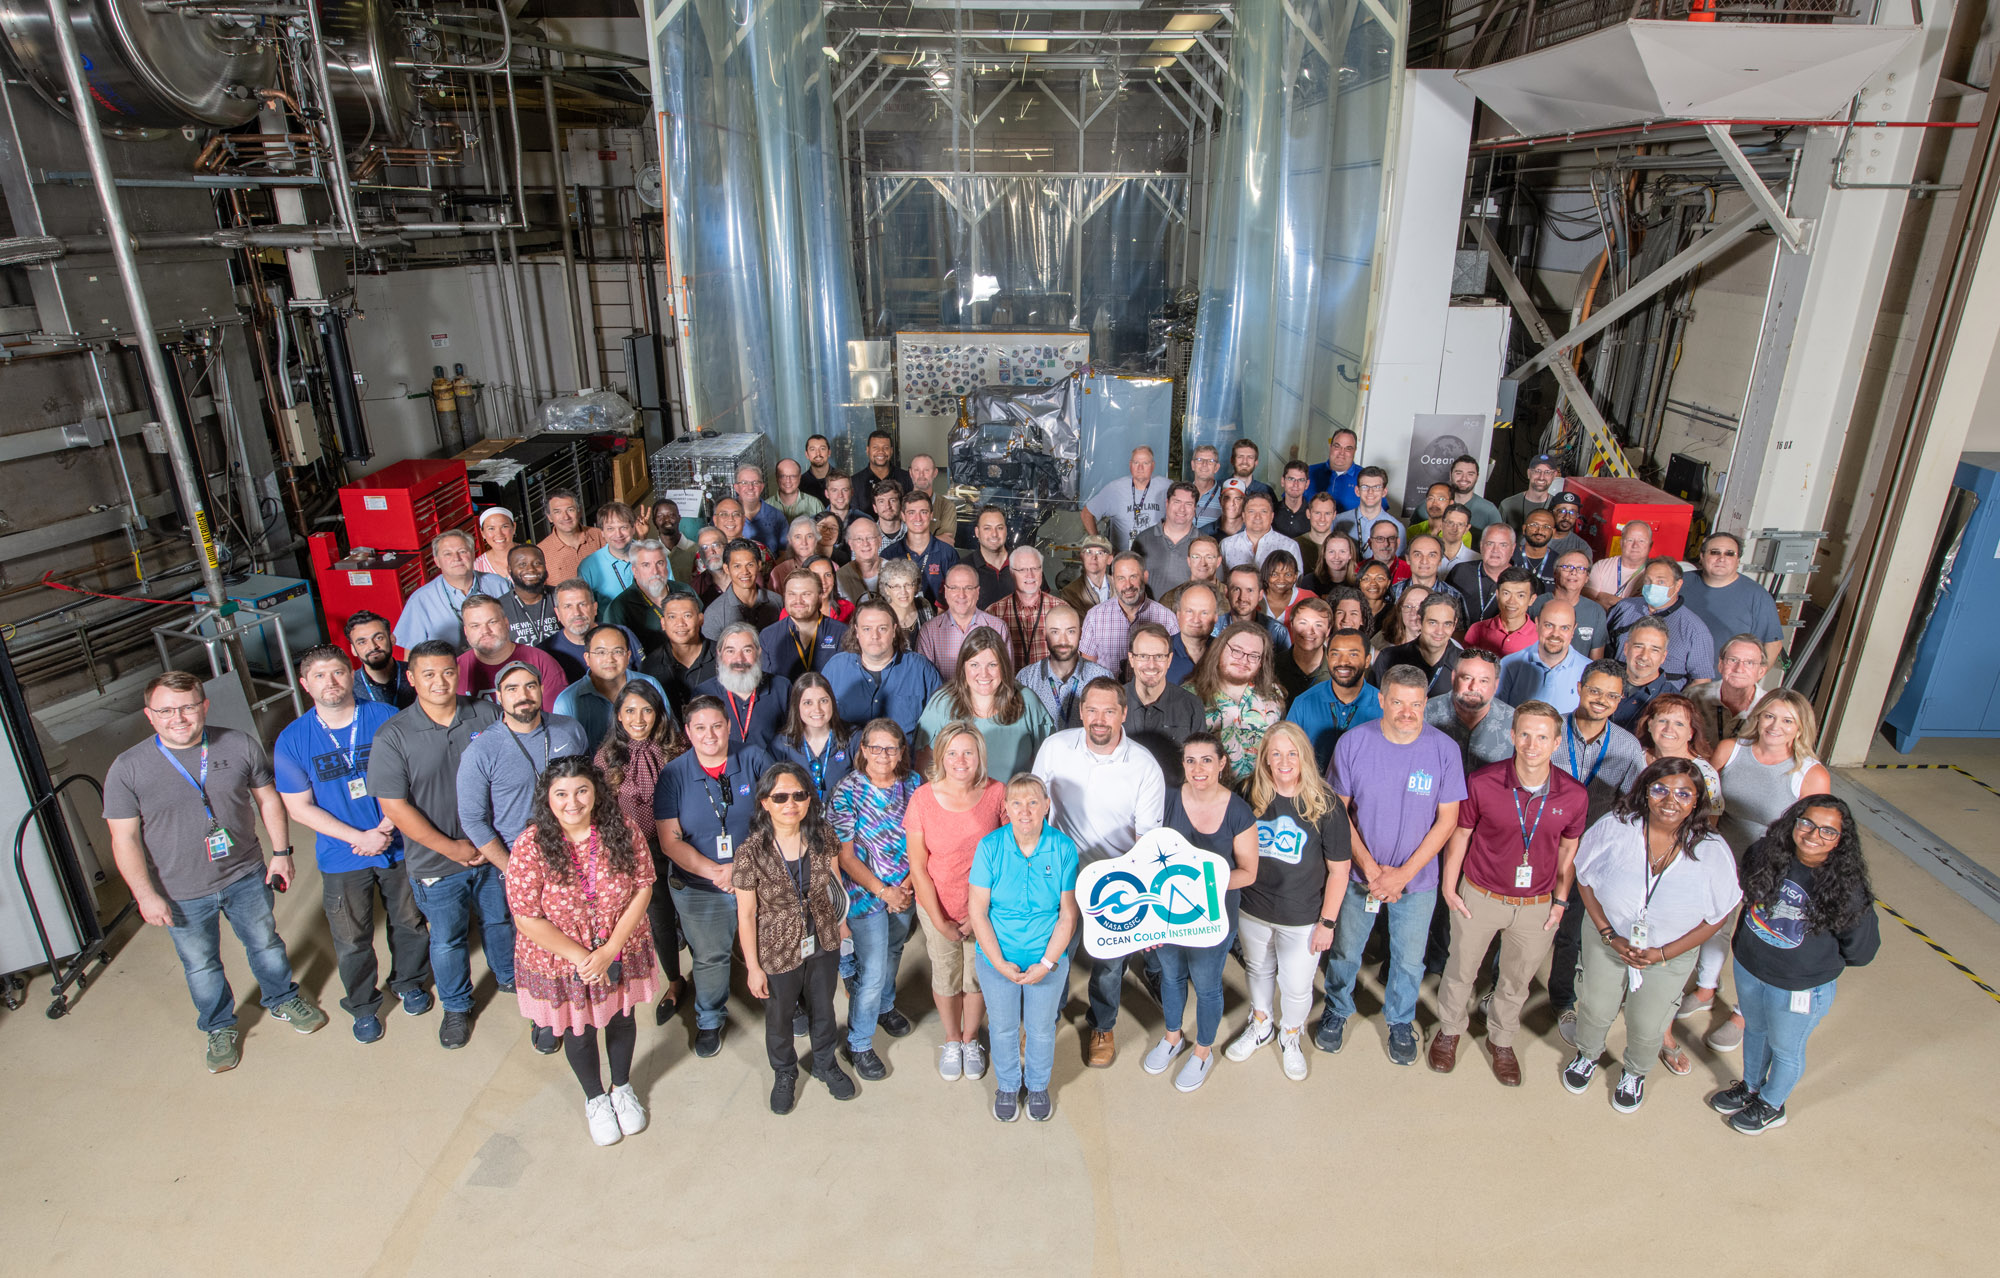
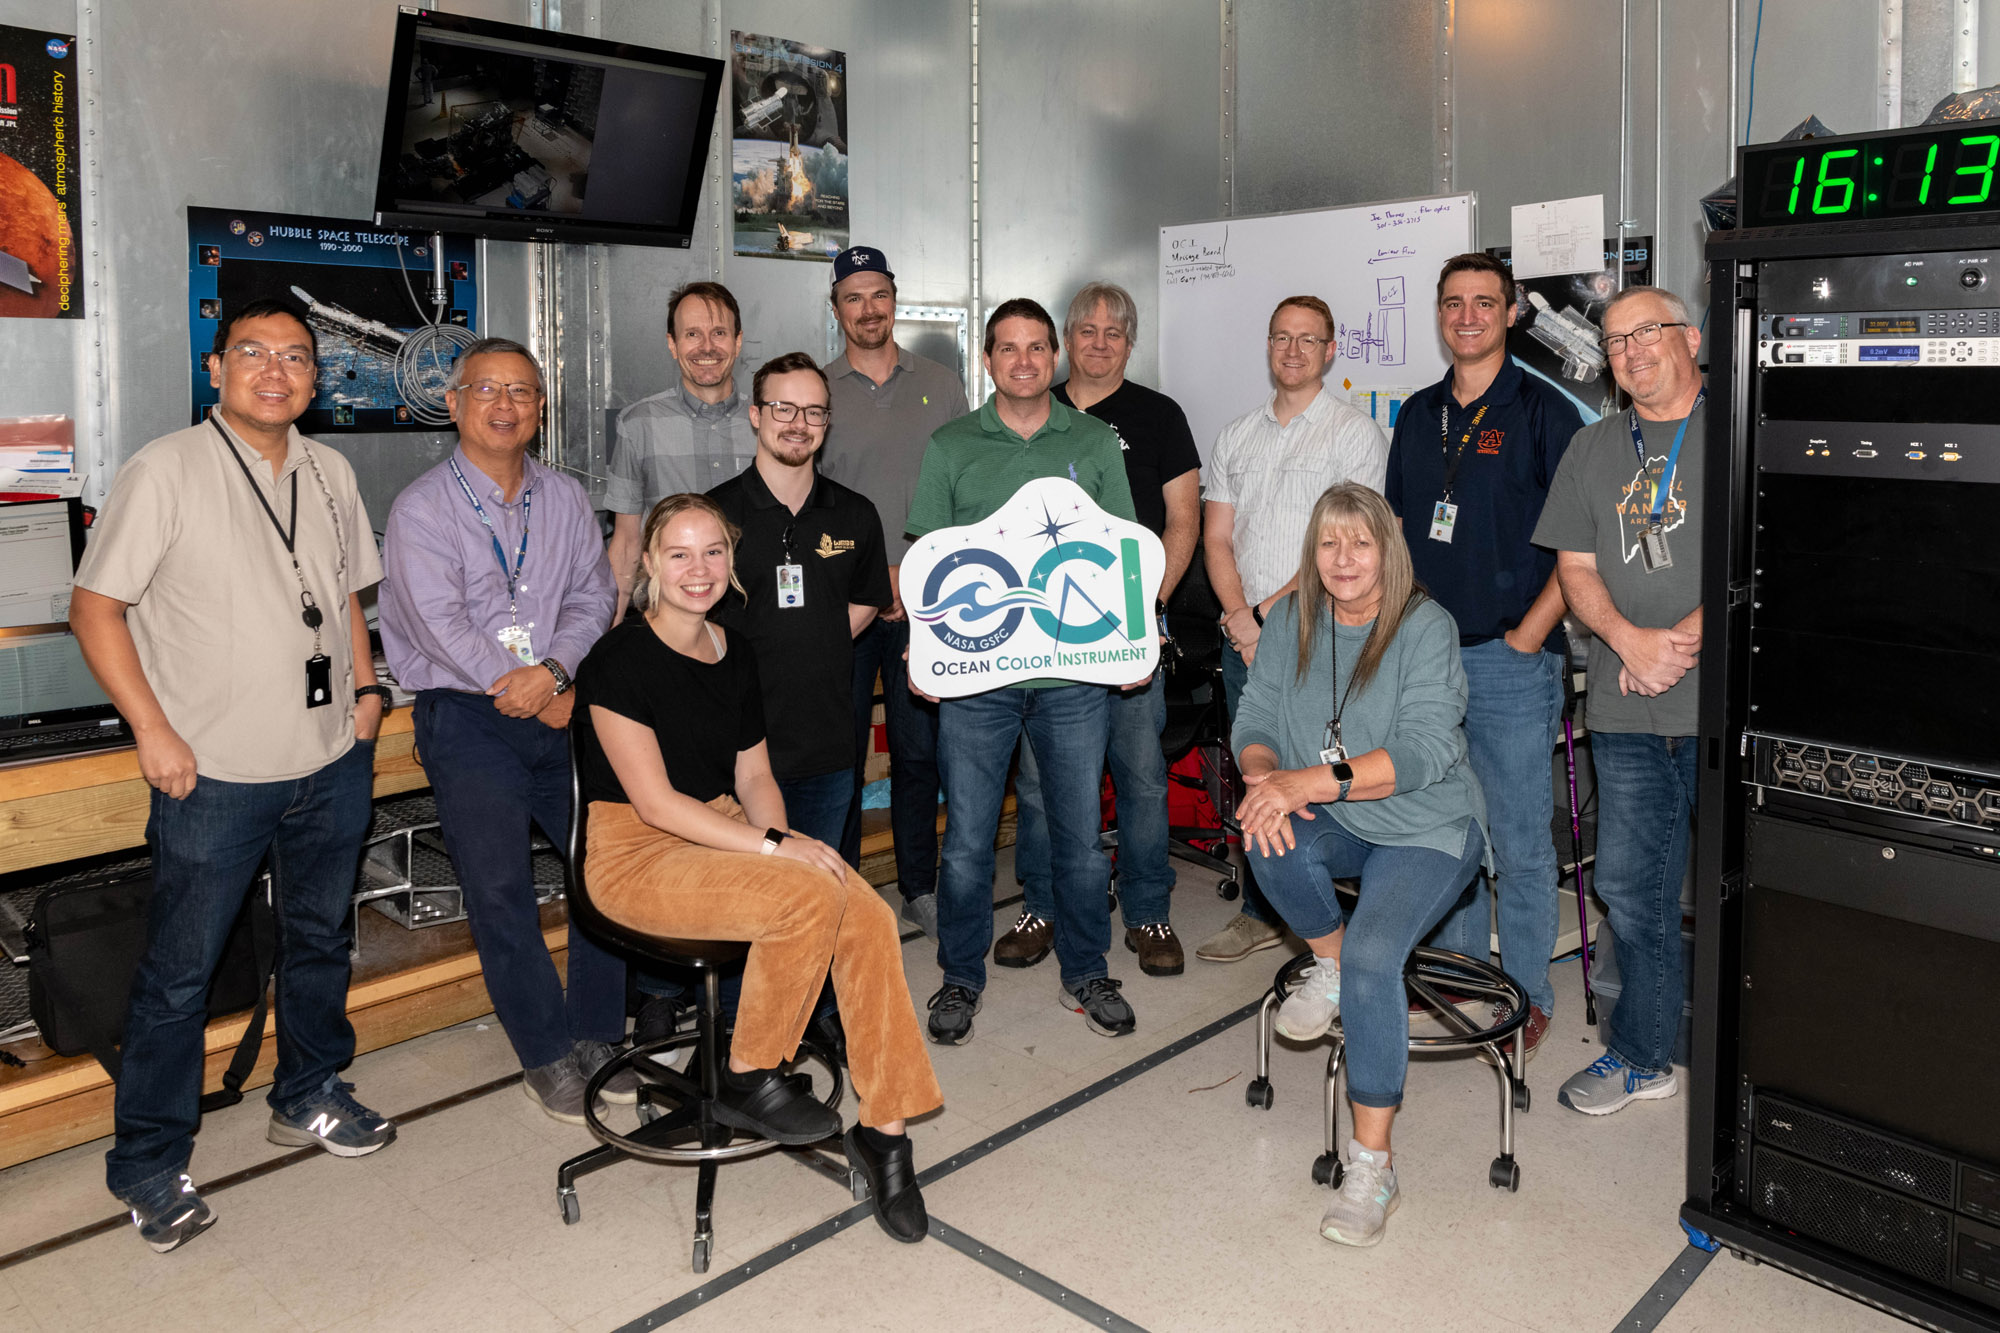
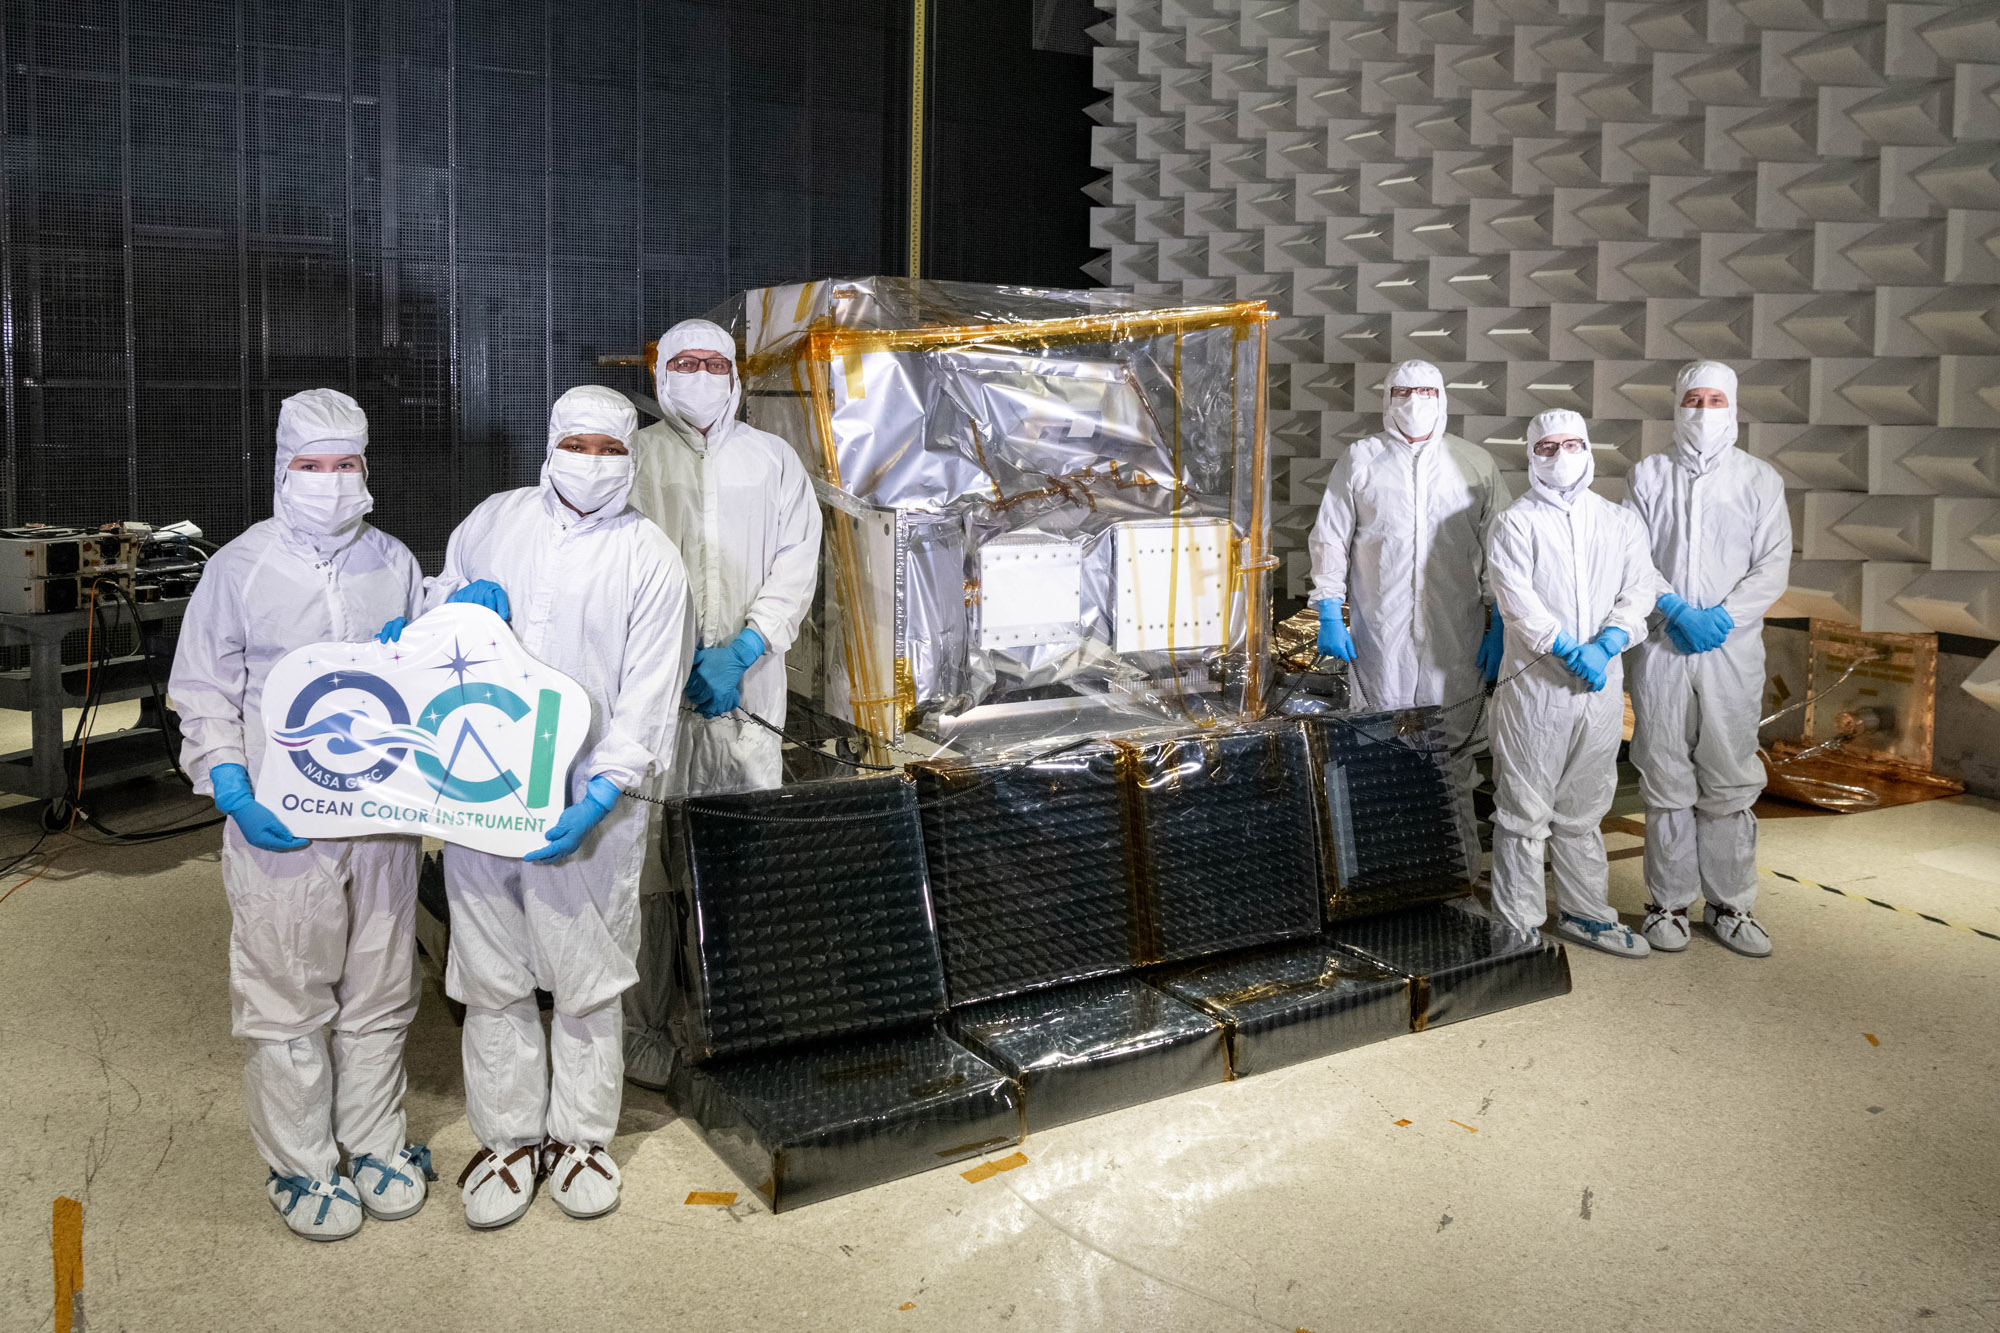
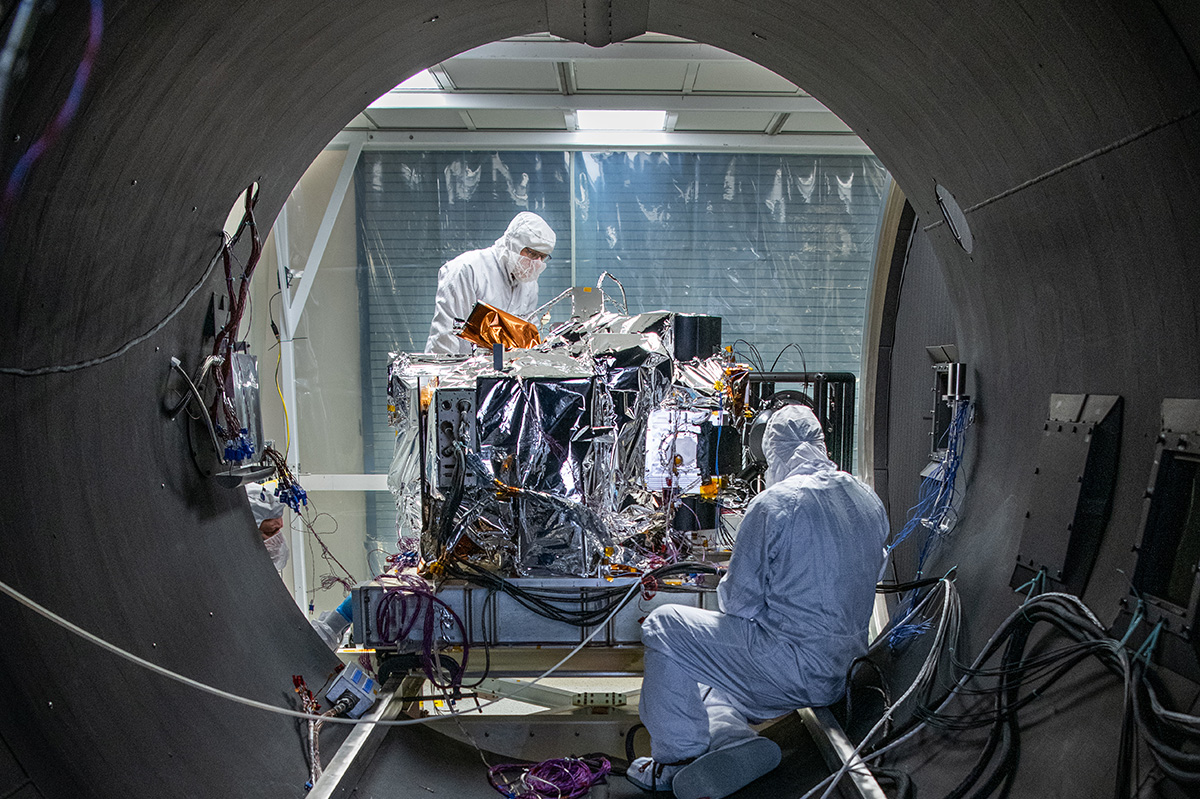
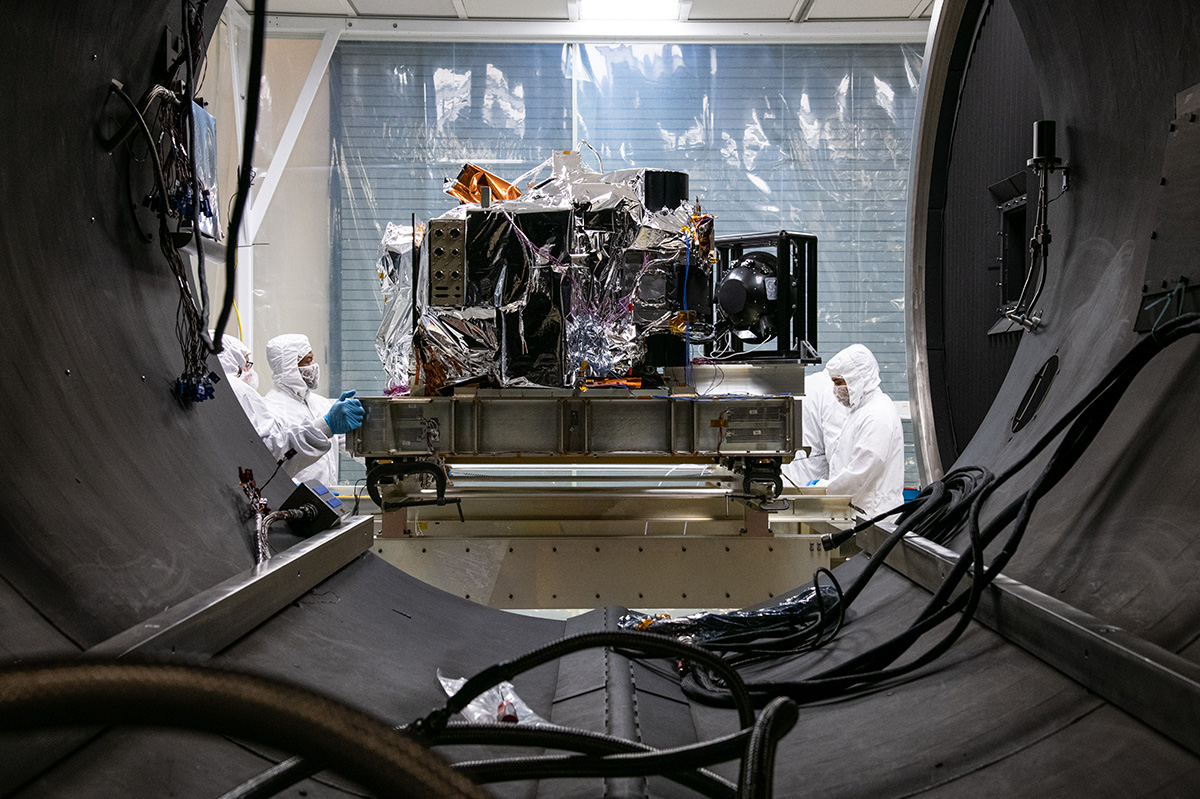
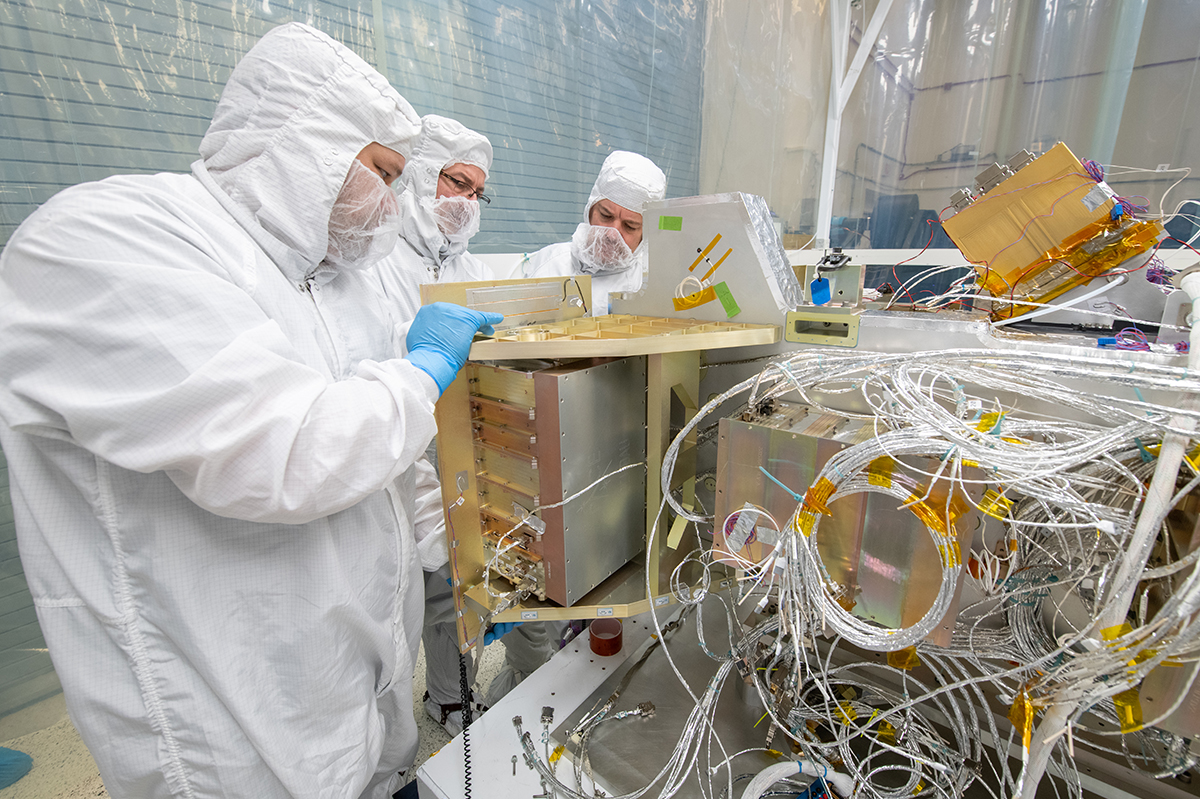
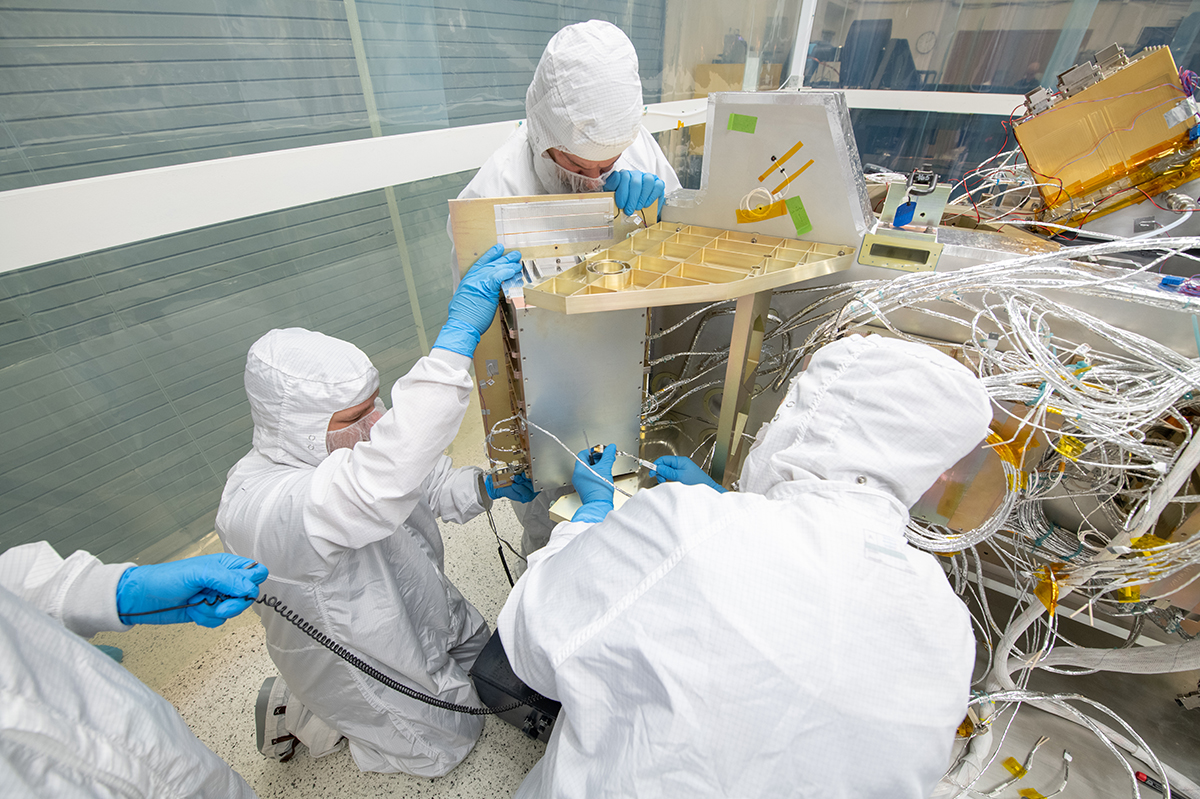
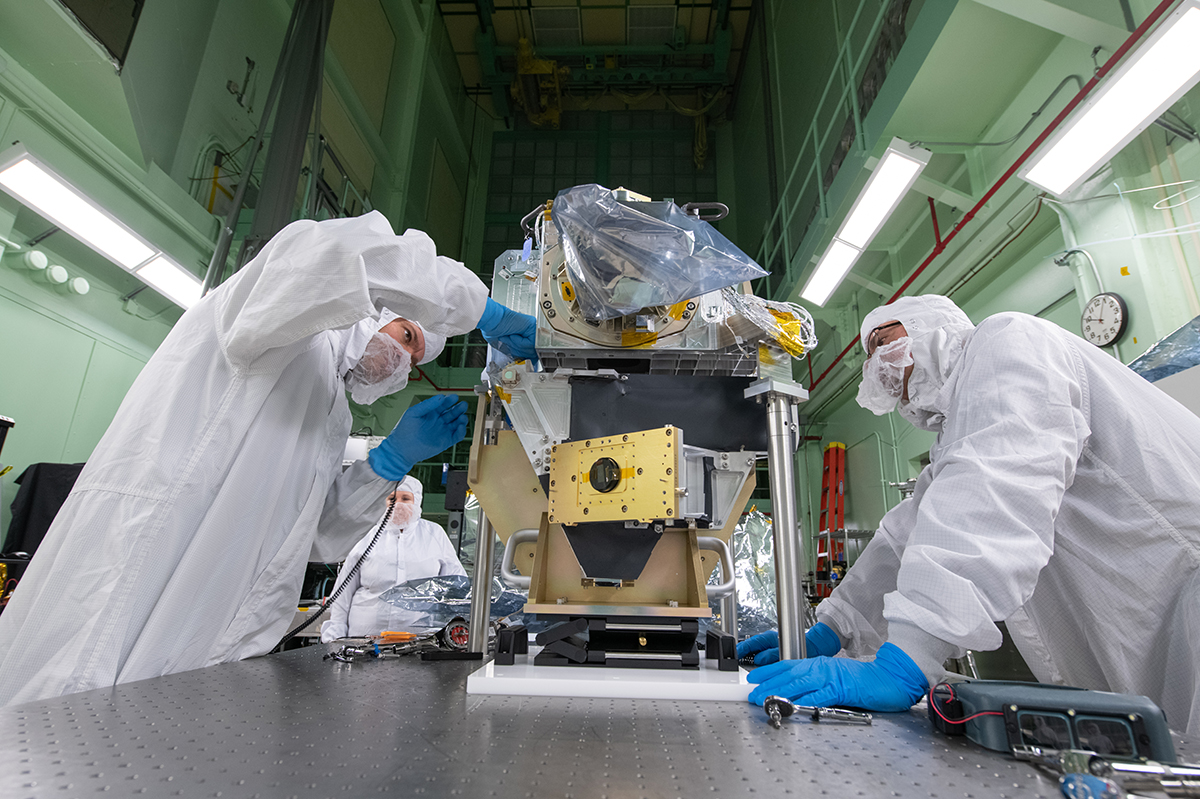
PACE’s primary sensor, the Ocean Color Instrument (OCI), is a highly advanced optical spectrometer that measures properties of light over portions of the electromagnetic spectrum. It enables continuous measurement of light at finer wavelength resolution than previous NASA satellite sensors, extending key system ocean color data records for climate studies.
The color of the ocean is determined by the interaction of sunlight with substances or particles present in seawater such as chlorophyll, a green pigment found in most phytoplankton species. By monitoring global phytoplankton distribution and abundance with unprecedented detail, the OCI helps us to better understand the complex systems that drive ocean ecology. OCI data are also being used to better understand our atmosphere and land vegetation.
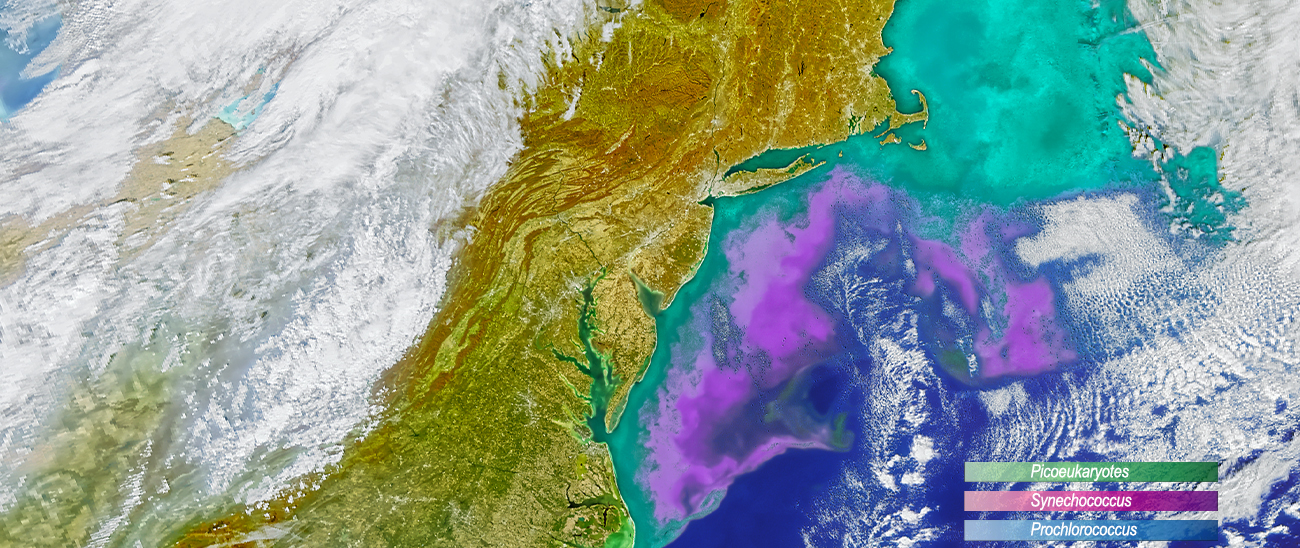 OCI allows us to identify phytoplankton types from space for the first time. Pink, green and blue colors indicate concentrations of specific groups of extremely tiny organisms known as “picophytoplankton.”OCI allows us to identify phytoplankton types from space for the first time. Pink, green and blue colors indicate concentrations of specific groups of extremely tiny organisms known as “picophytoplankton.”OCI allows us to identify phytoplankton types from space for the first time. Pink, green and blue colors indicate concentrations of specific groups of extremely tiny organisms known as “picophytoplankton.”
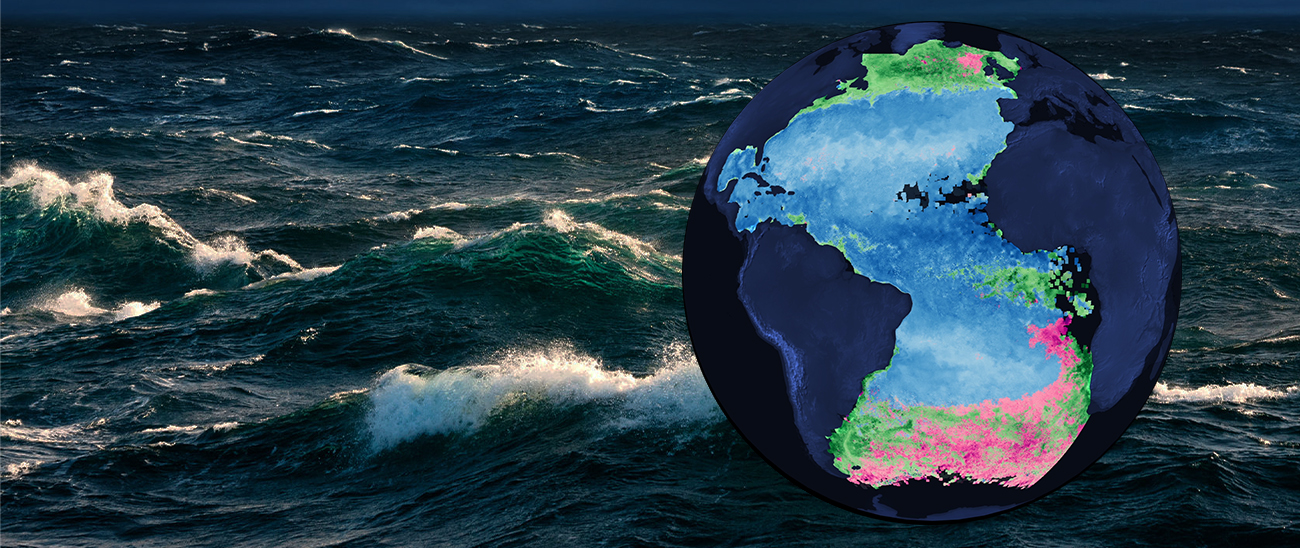 Each day, OCI provides 5-10X more data points than the largest dataset of picophytoplankton, allowing us to better understand, monitor and predict the key role they play in our oceanEach day, OCI provides 5-10X more data points than the largest dataset of picophytoplankton, allowing us to better understand, monitor and predict the key role they play in our oceanEach day, OCI provides 5-10X more data points than the largest dataset of picophytoplankton, allowing us to better understand, monitor and predict the key role they play in our ocean
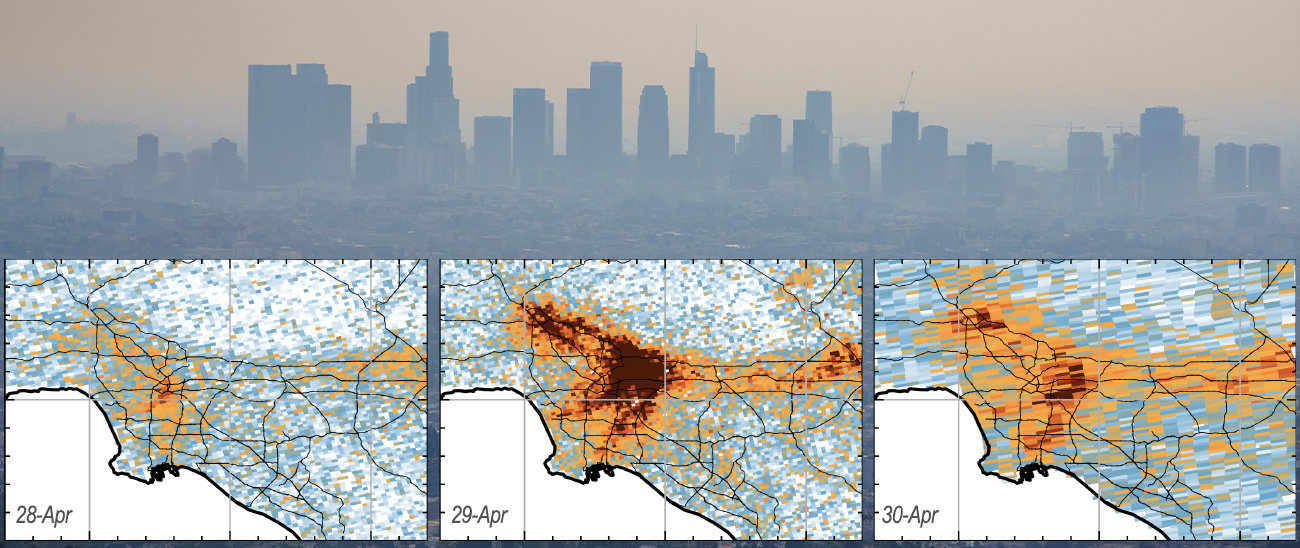 OCI's ground-breaking, high spatial resolution data products reveal more fine details of nitrogen dioxide (NO2) sources such as vehicle emissions and power plantsOCI's ground-breaking, high spatial resolution data products reveal more fine details of nitrogen dioxide (NO2) sources such as vehicle emissions and power plantsOCI's ground-breaking, high spatial resolution data products reveal more fine details of nitrogen dioxide (NO2) sources such as vehicle emissions and power plants
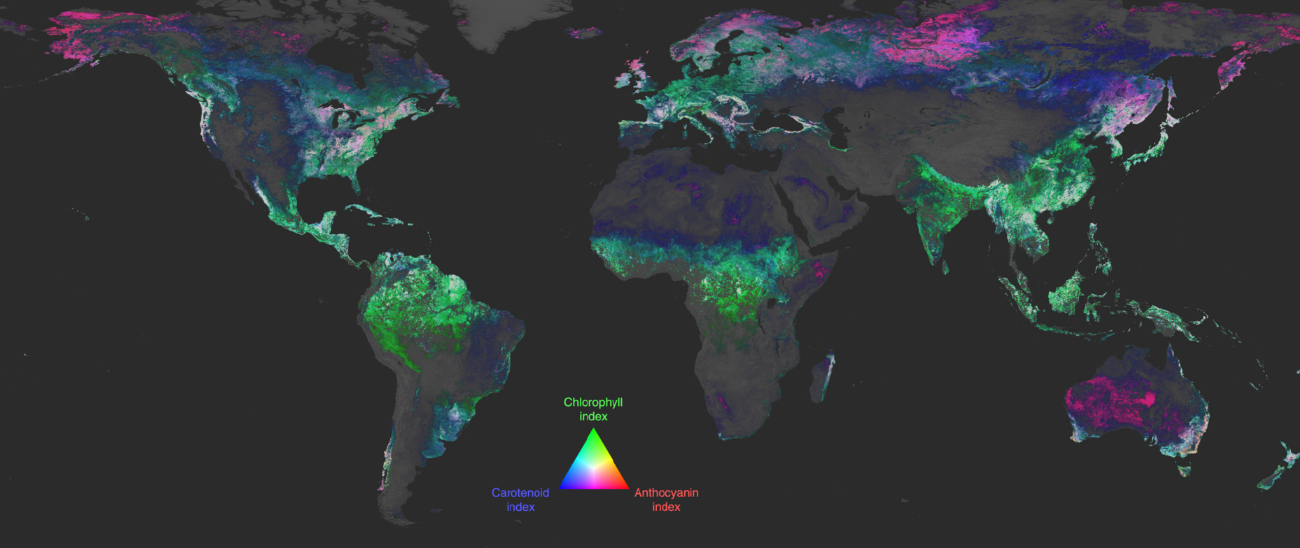 OCI's hyperspectral-enabled pigment indices provide new information about vegetation type, health status, productivity and leaf area. Only PACE can provide this information globally, every 1-2 days.OCI's hyperspectral-enabled pigment indices provide new information about vegetation type, health status, productivity and leaf area. Only PACE can provide this information globally, every 1-2 days.OCI's hyperspectral-enabled pigment indices provide new information about vegetation type, health status, productivity and leaf area. Only PACE can provide this information globally, every 1-2 days.
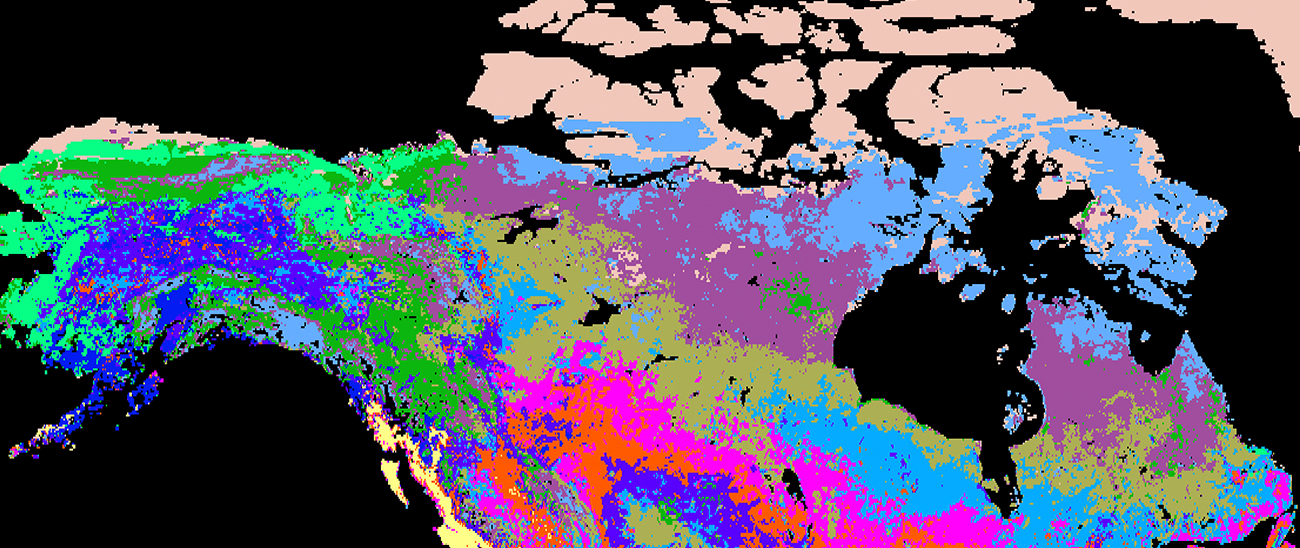 OCI data are being used to classify key factors related to ecosystem productivity of land vegetation. These environmental factors are important for humans and animals living in the region.OCI data are being used to classify key factors related to ecosystem productivity of land vegetation. These environmental factors are important for humans and animals living in the region.OCI data are being used to classify key factors related to ecosystem productivity of land vegetation. These environmental factors are important for humans and animals living in the region.
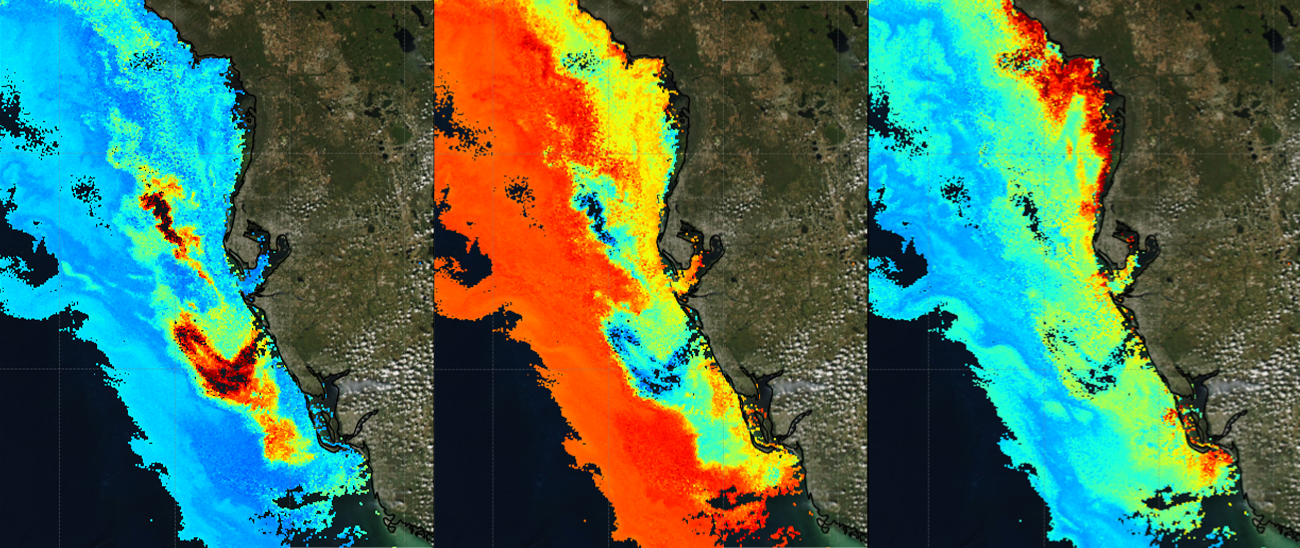 OCI hyperspectral information and AI synergy have been used to develop advanced tools for Gulf Coast phytoplankton monitoring and harmful algal bloom detectionOCI hyperspectral information and AI synergy have been used to develop advanced tools for Gulf Coast phytoplankton monitoring and harmful algal bloom detectionOCI hyperspectral information and AI synergy have been used to develop advanced tools for Gulf Coast phytoplankton monitoring and harmful algal bloom detection
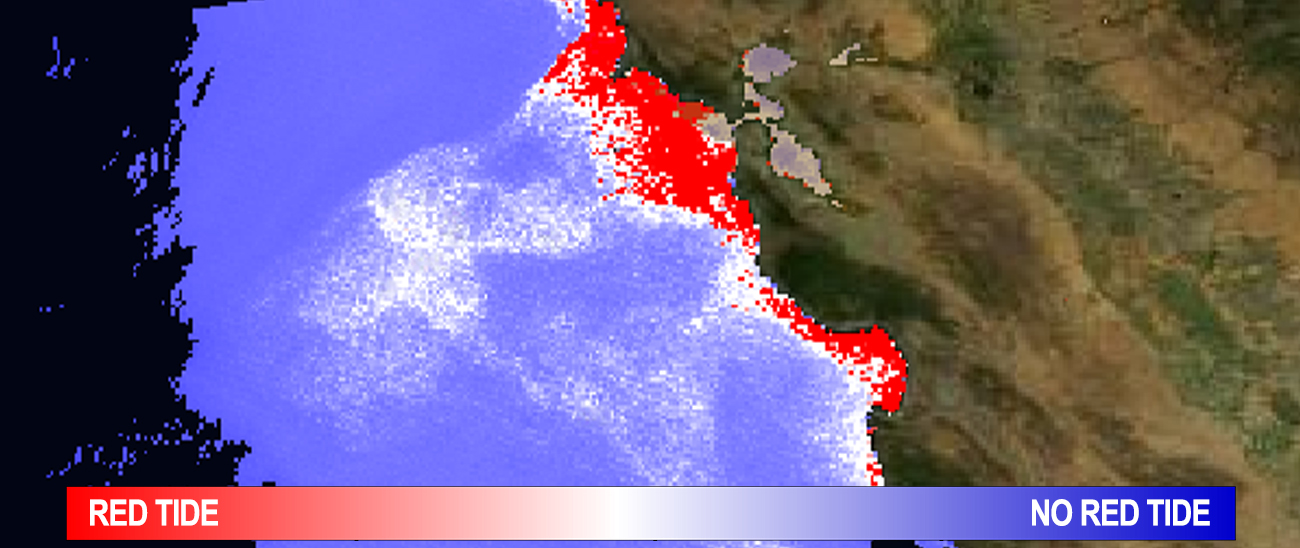 Thanks to OCI's unique hyperspectral, visible and ultraviolet data, a red tide bloom was detected off the California coast during PACE-PAX satellite validation effortsThanks to OCI's unique hyperspectral, visible and ultraviolet data, a red tide bloom was detected off the California coast during PACE-PAX satellite validation effortsThanks to OCI's unique hyperspectral, visible and ultraviolet data, a red tide bloom was detected off the California coast during PACE-PAX satellite validation efforts
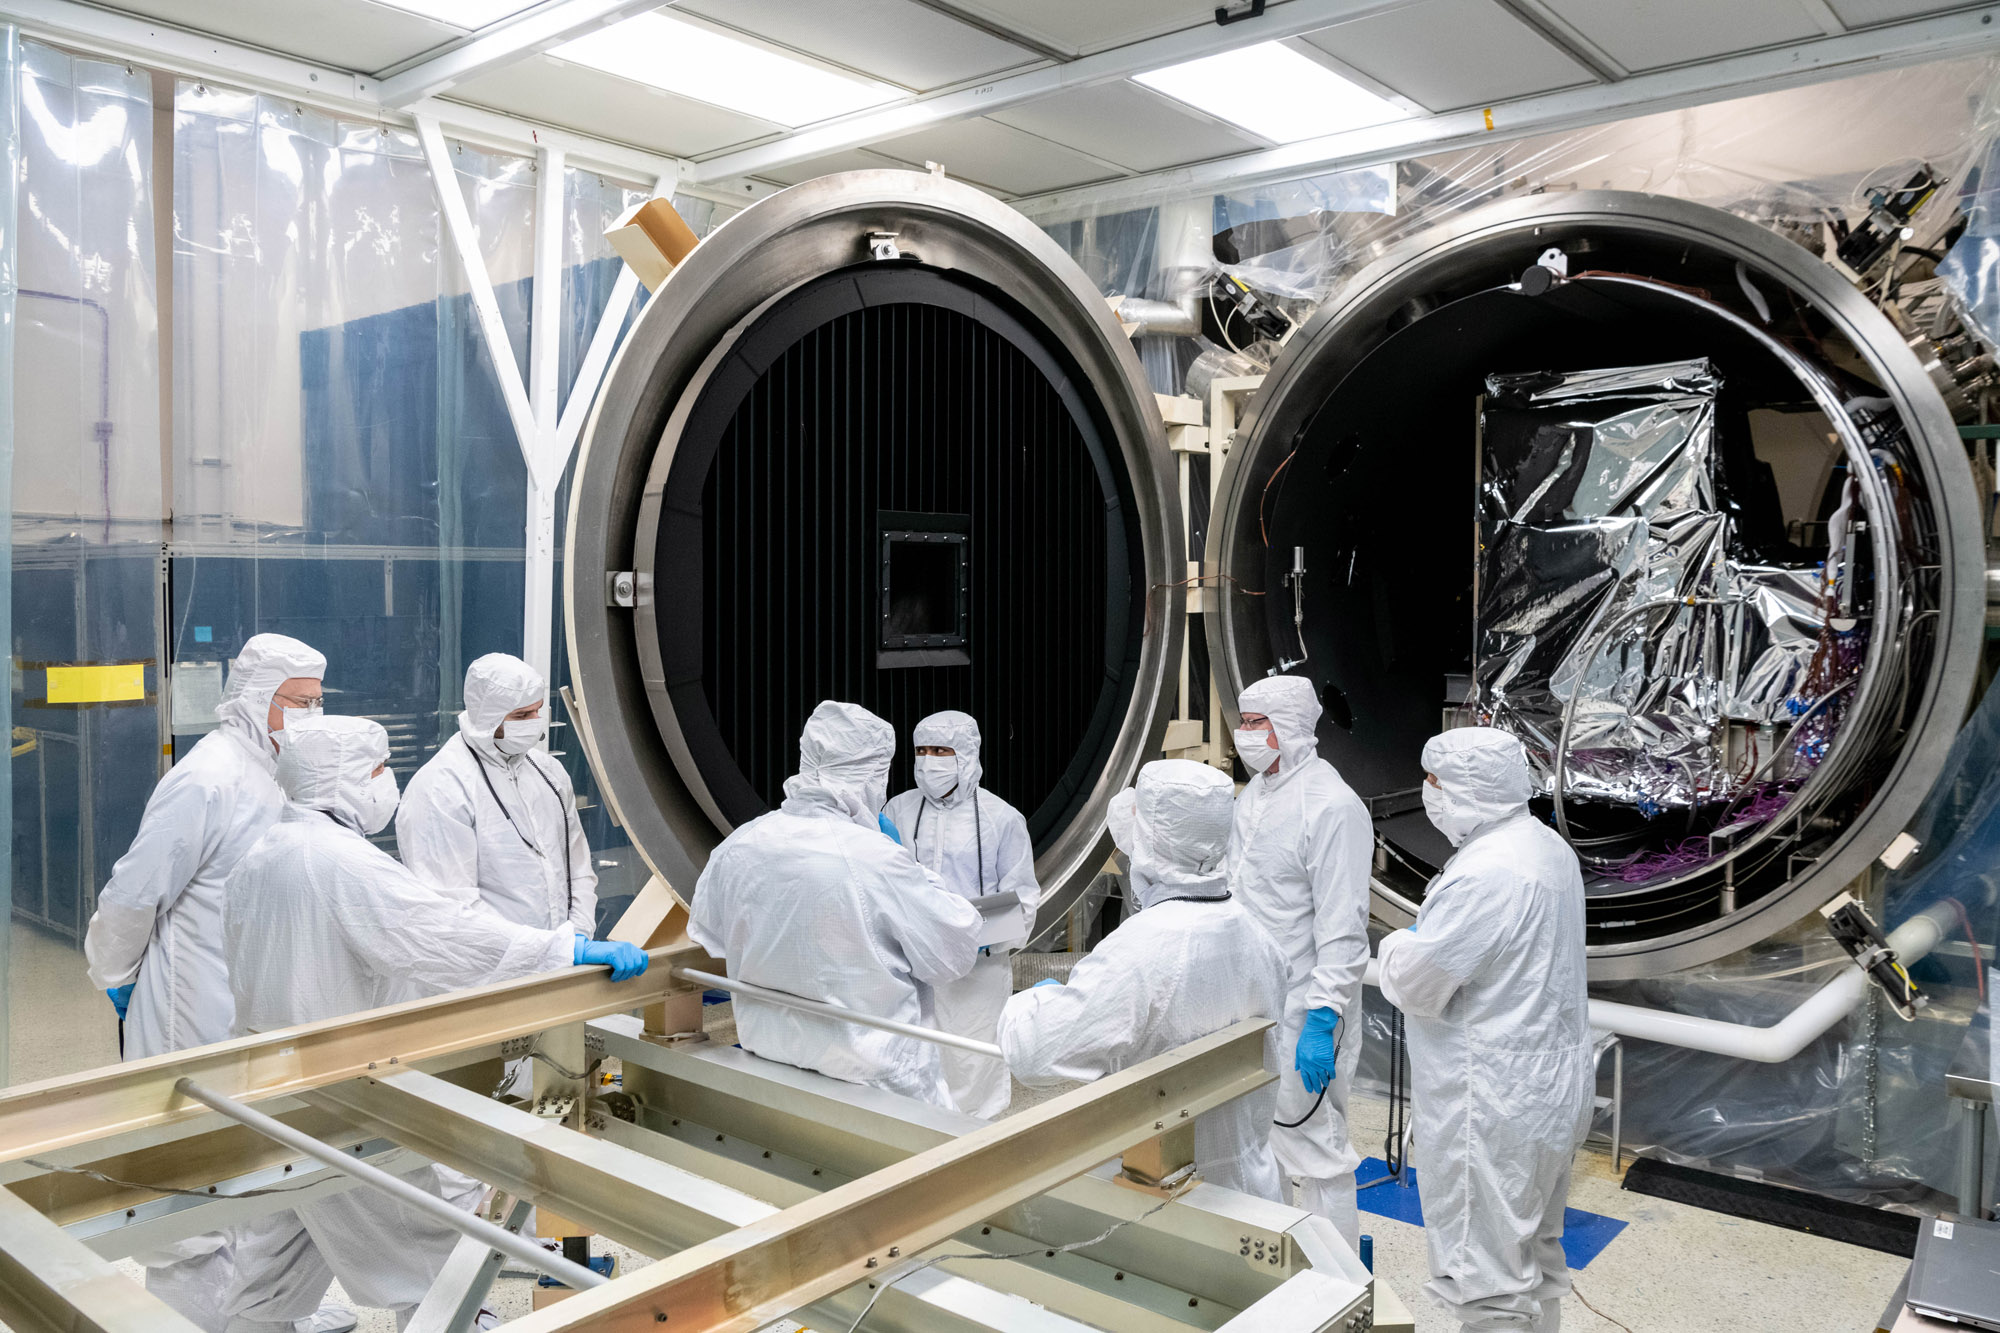
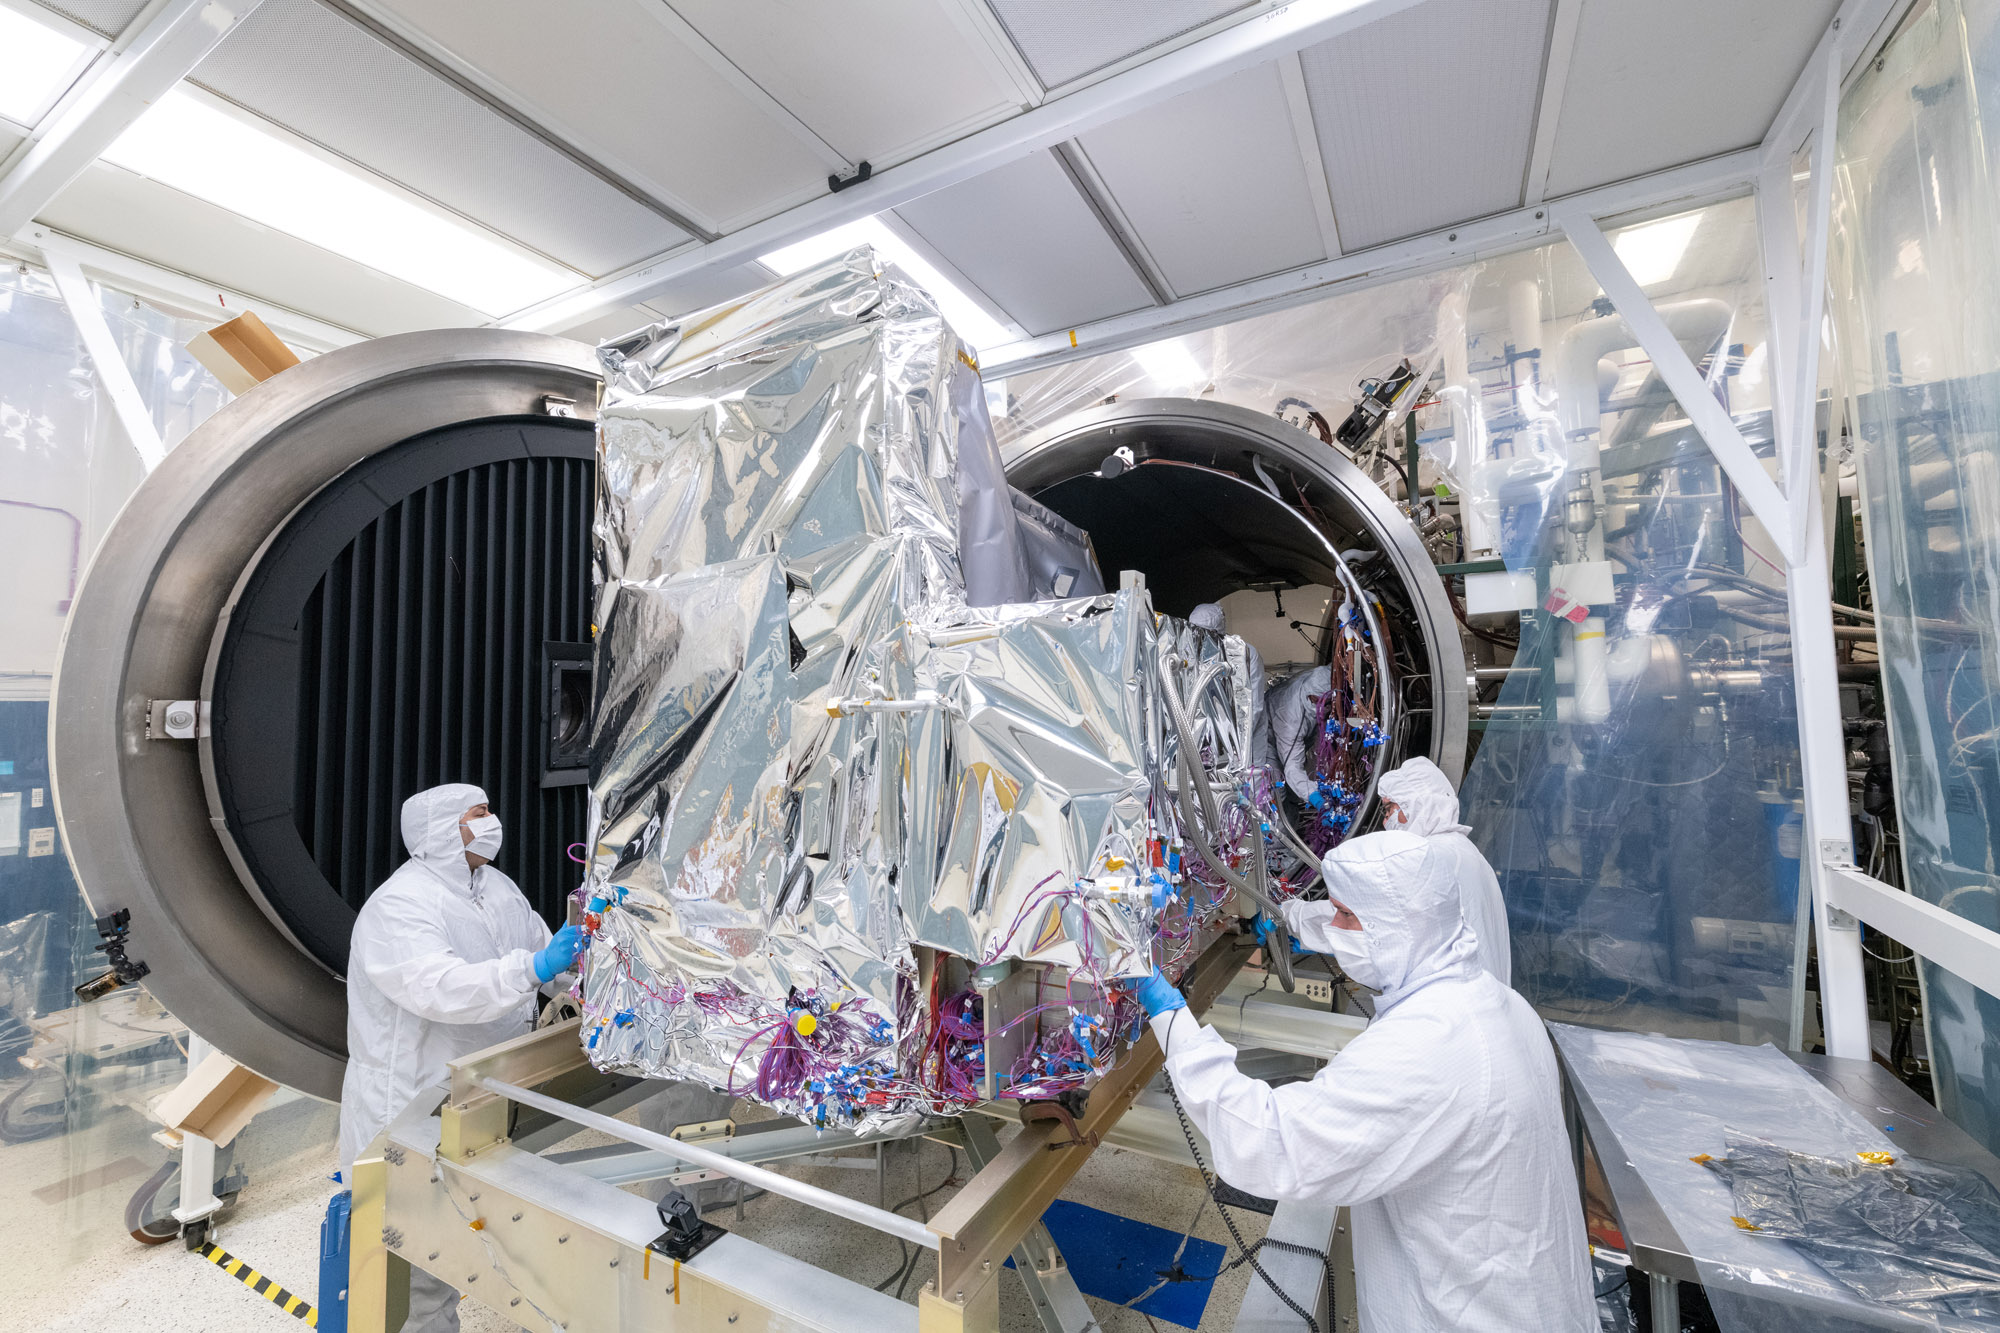
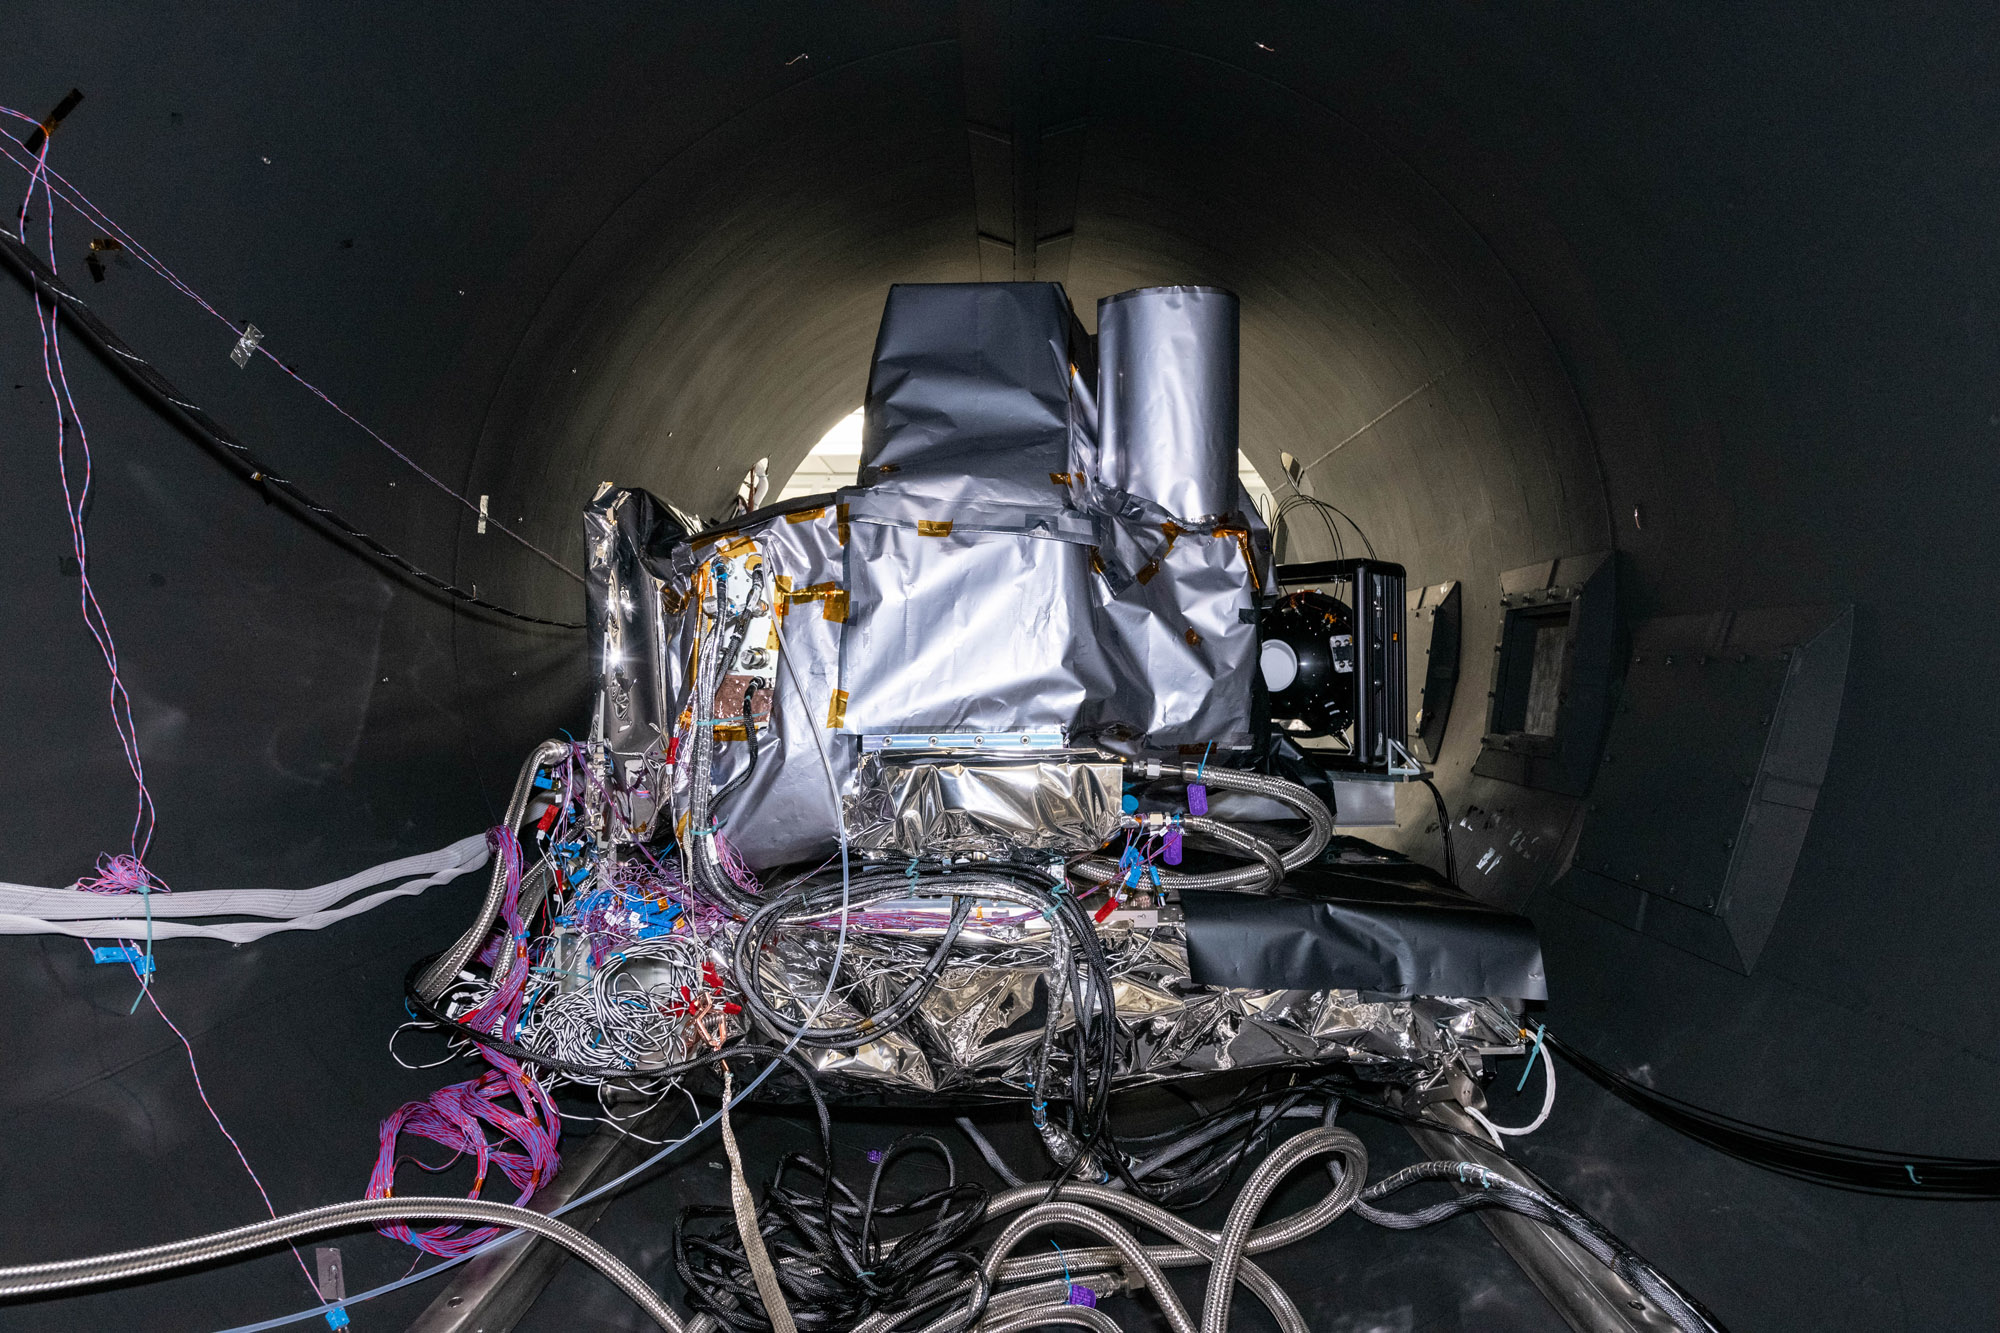
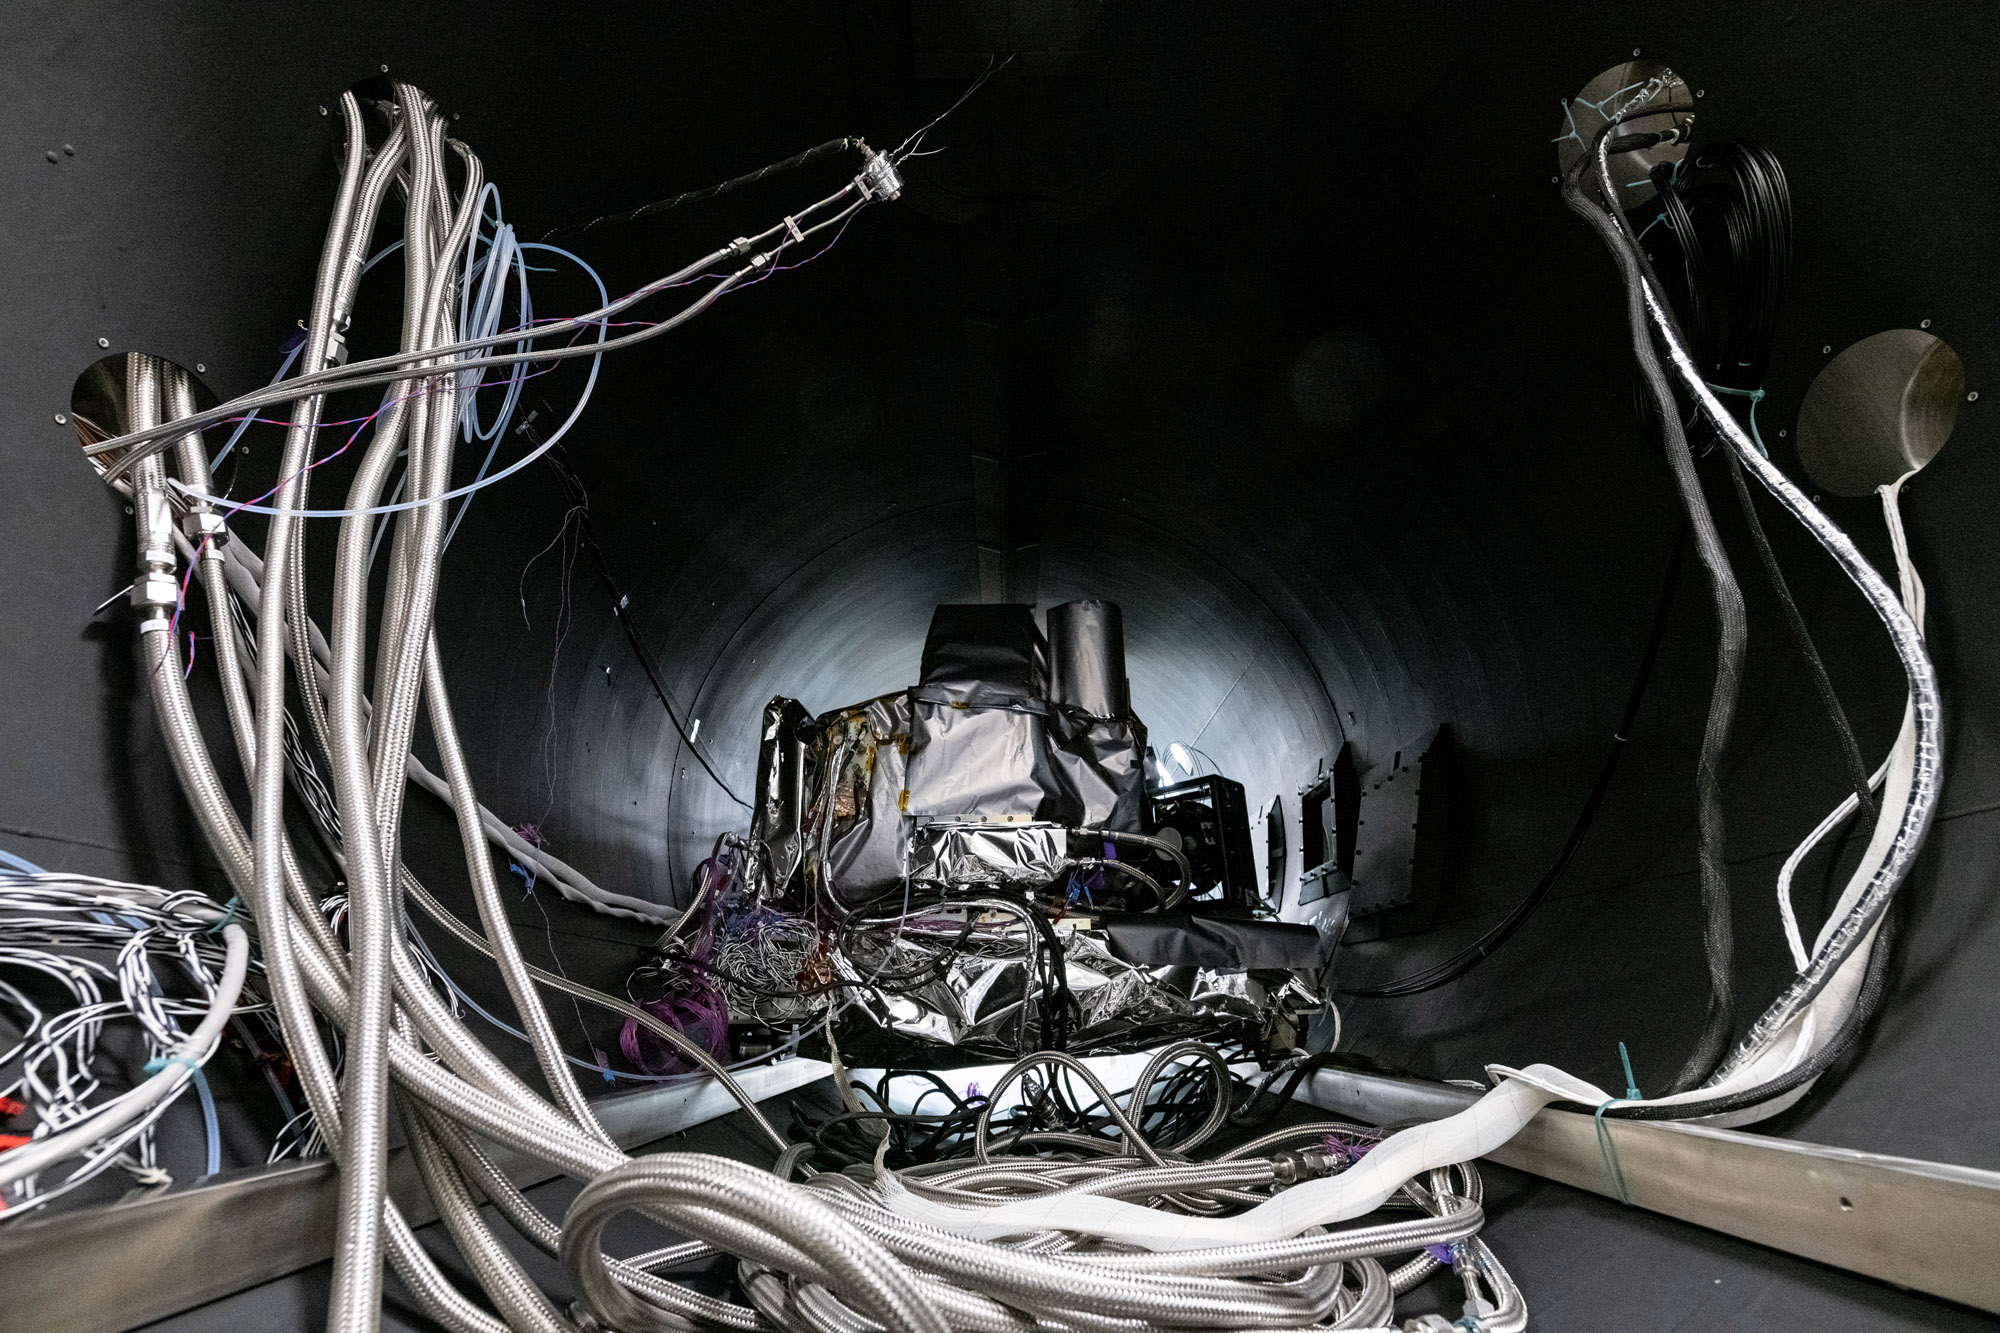
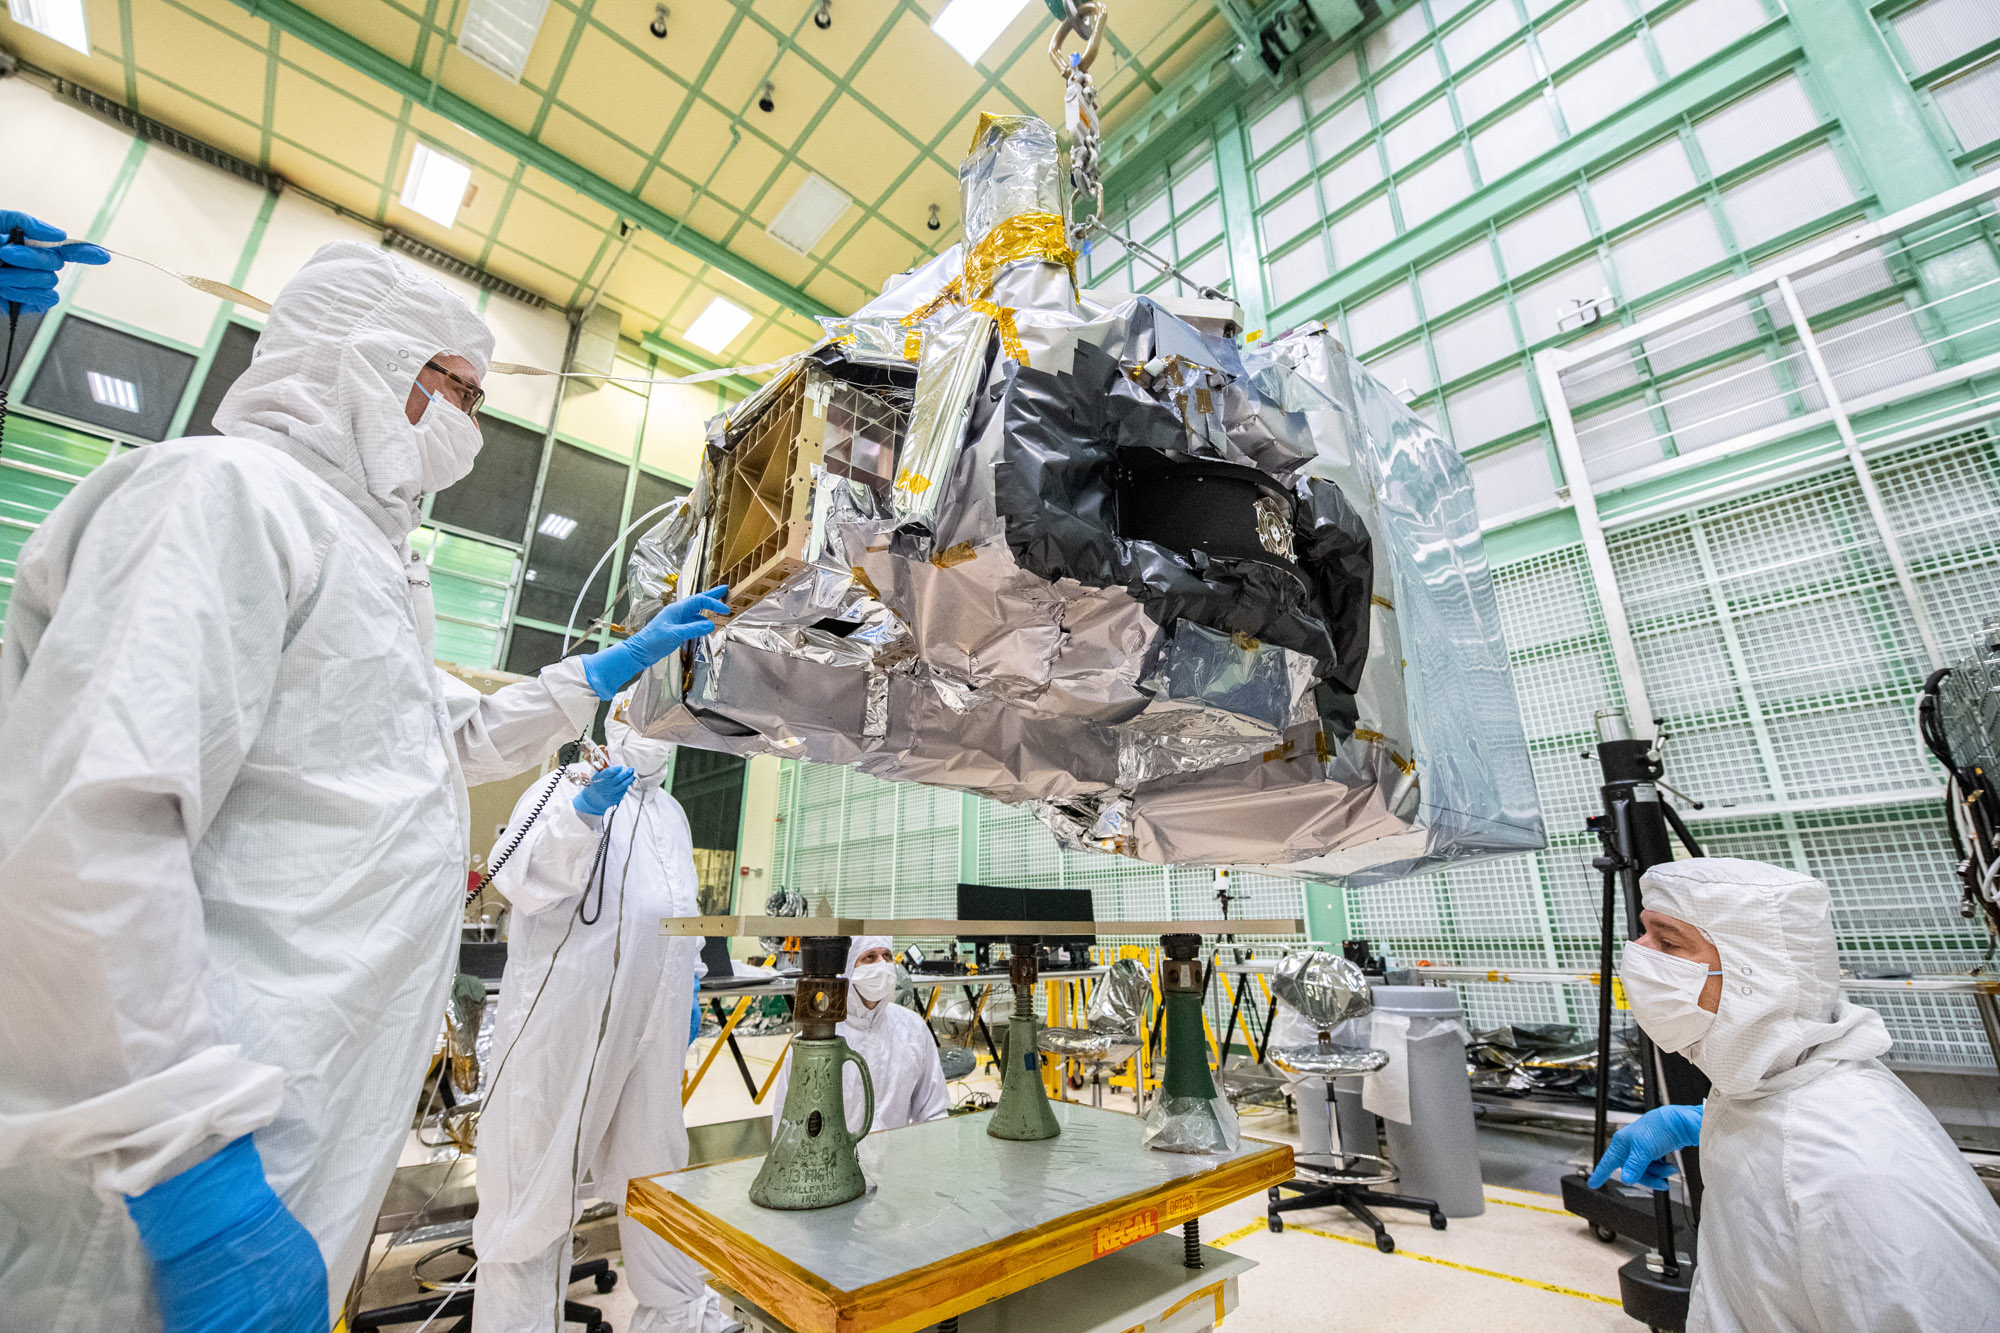
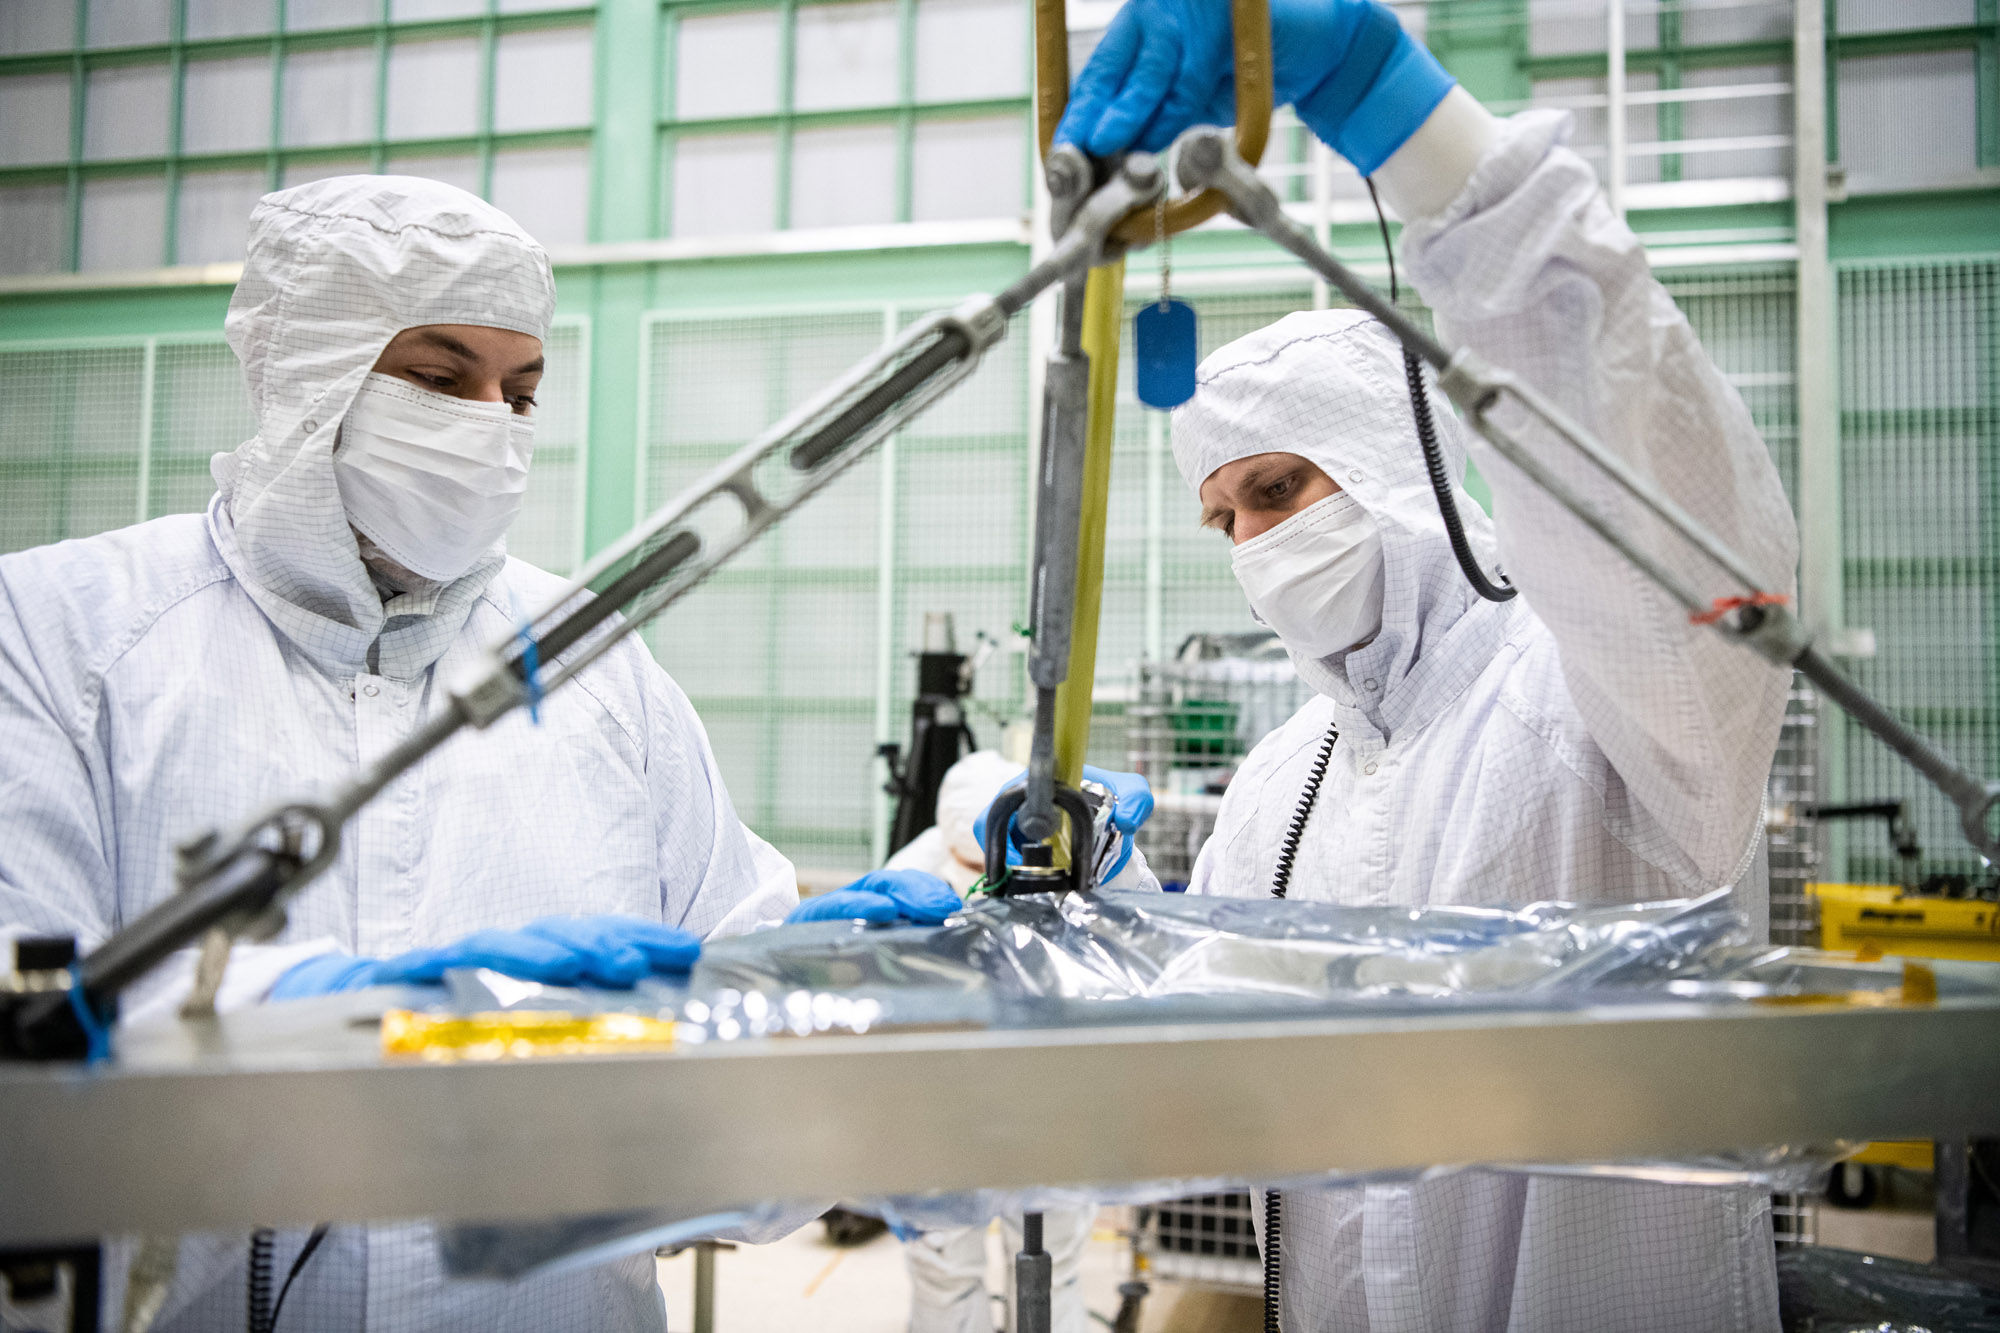
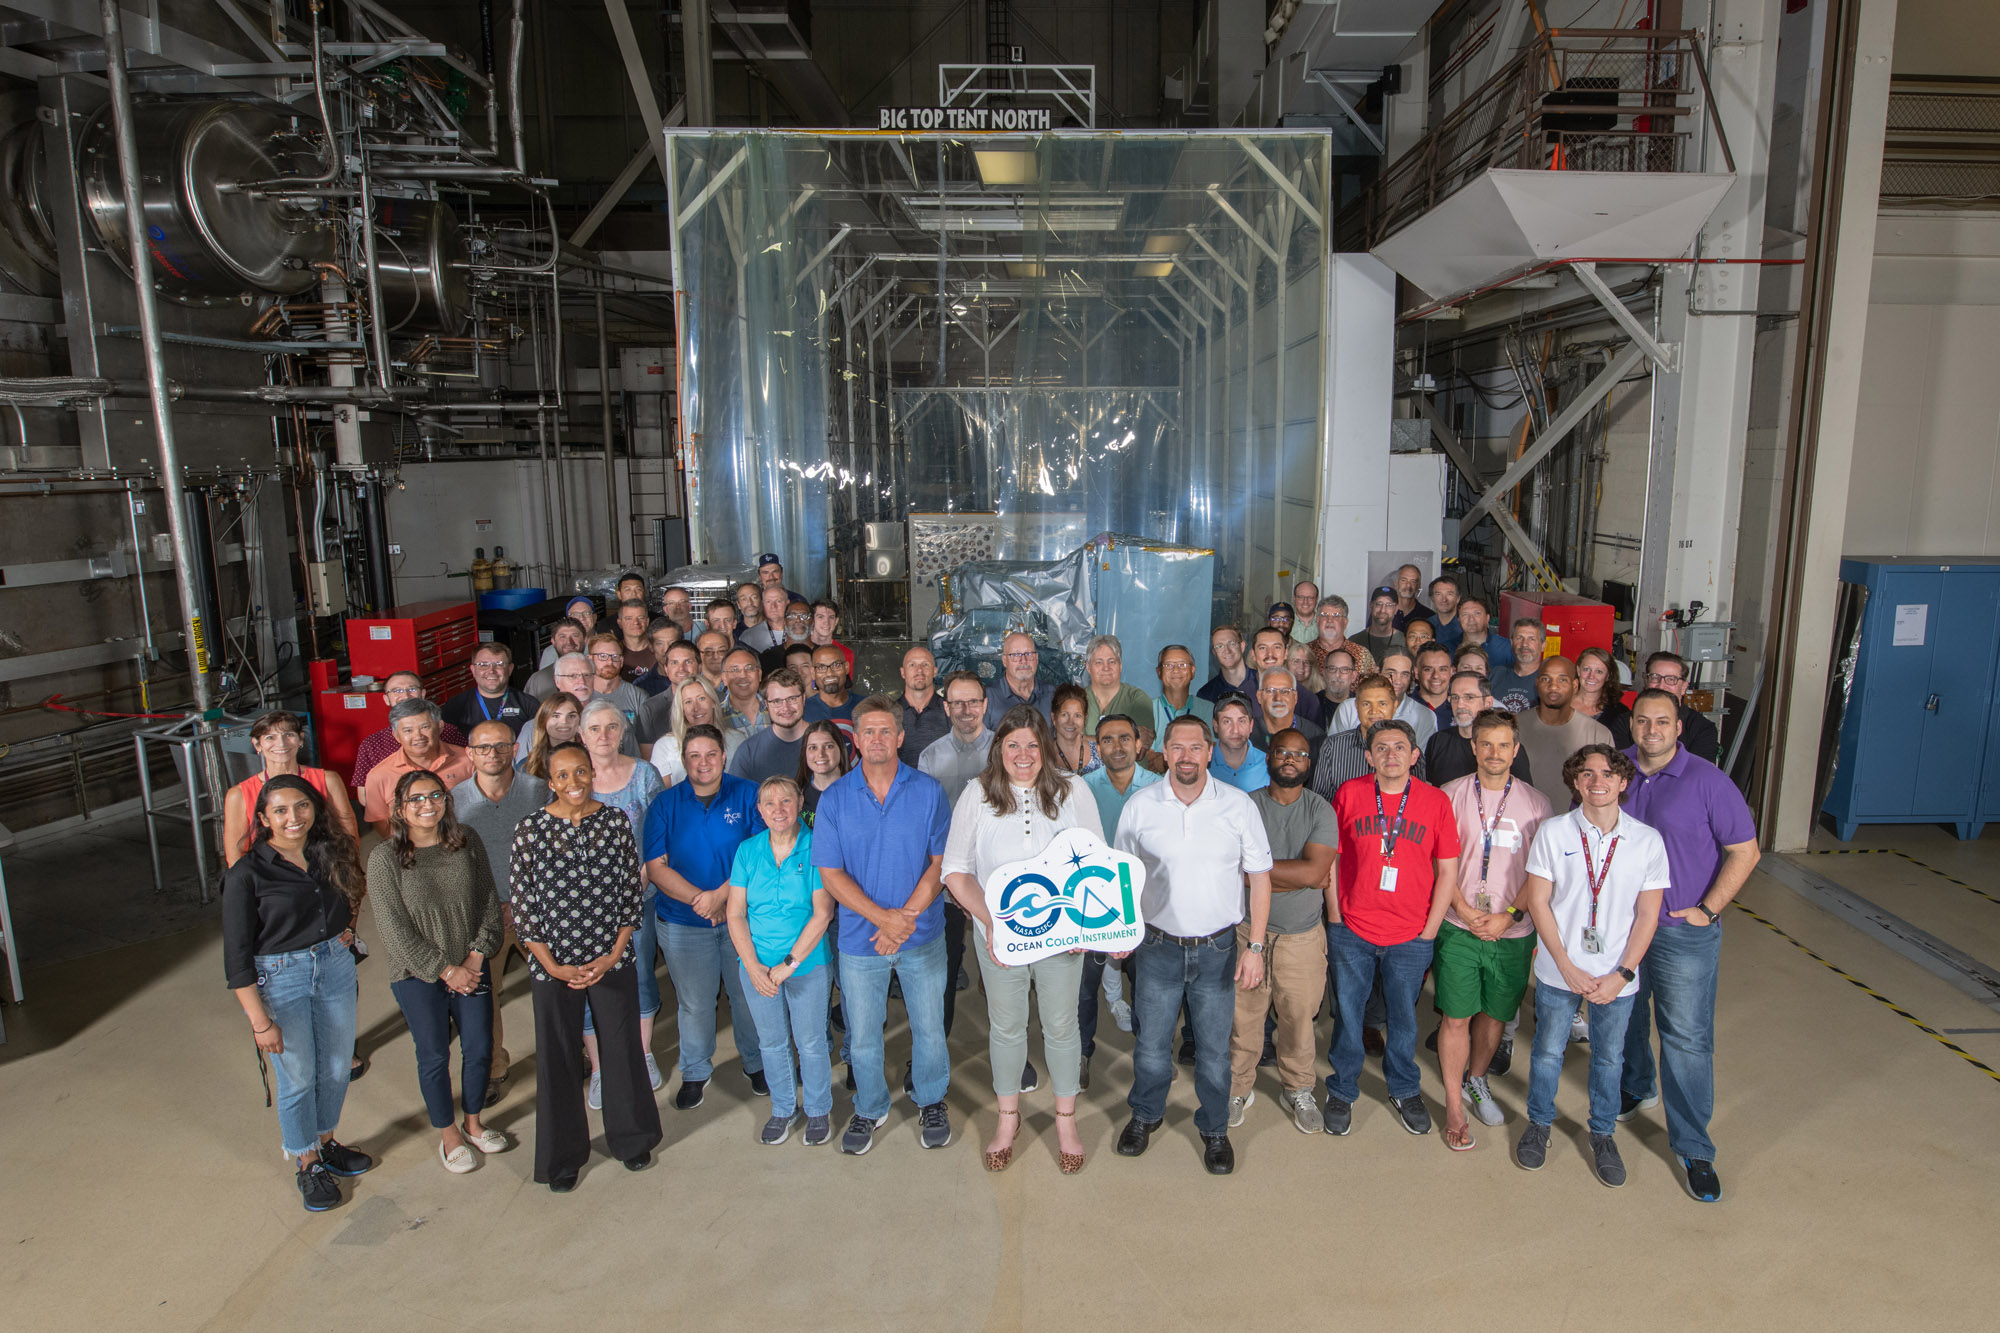
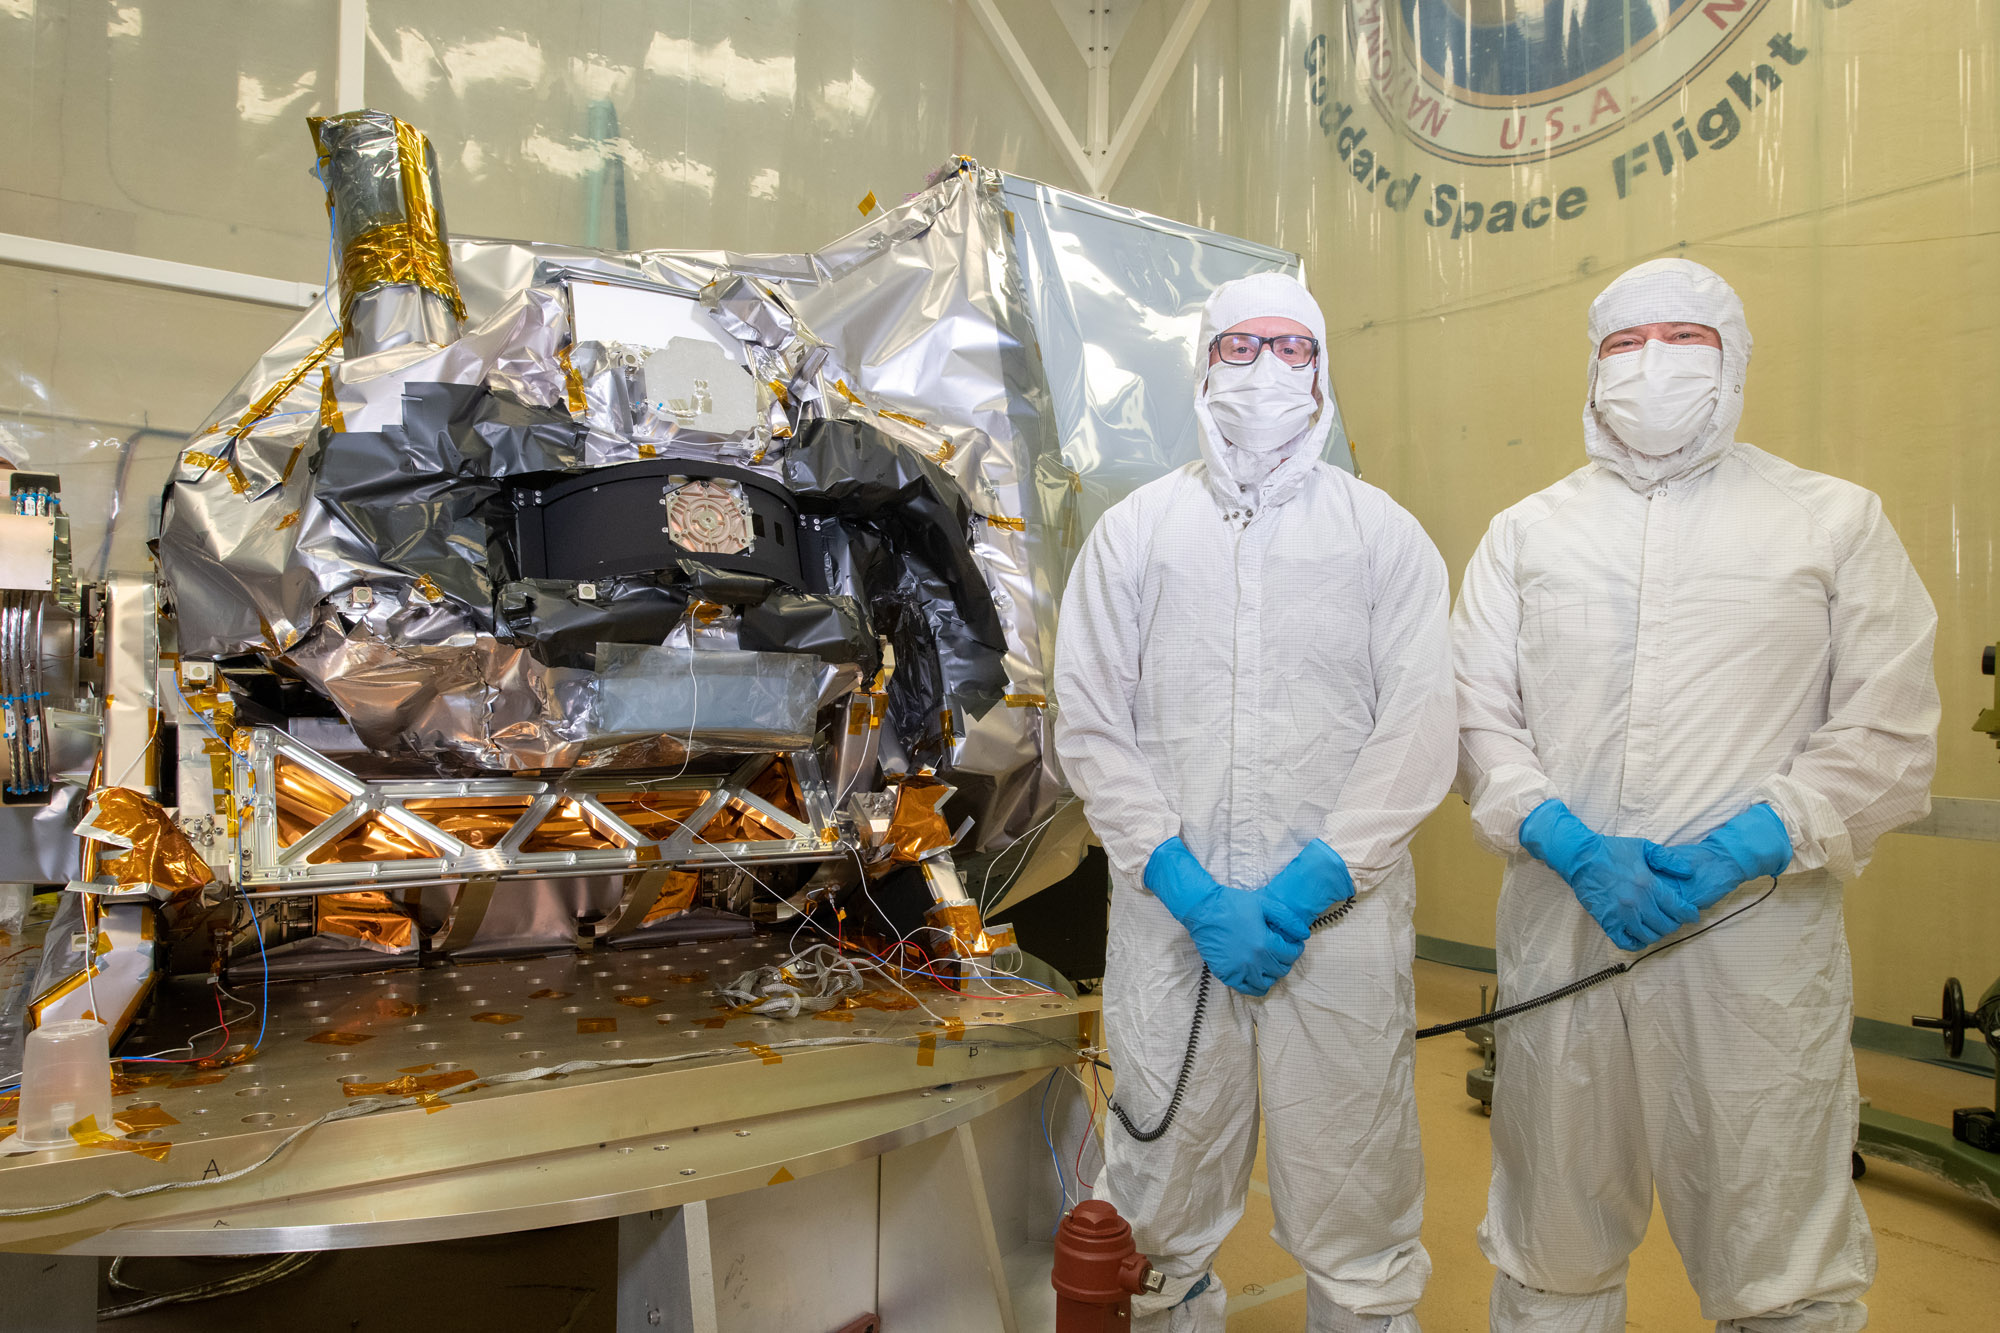
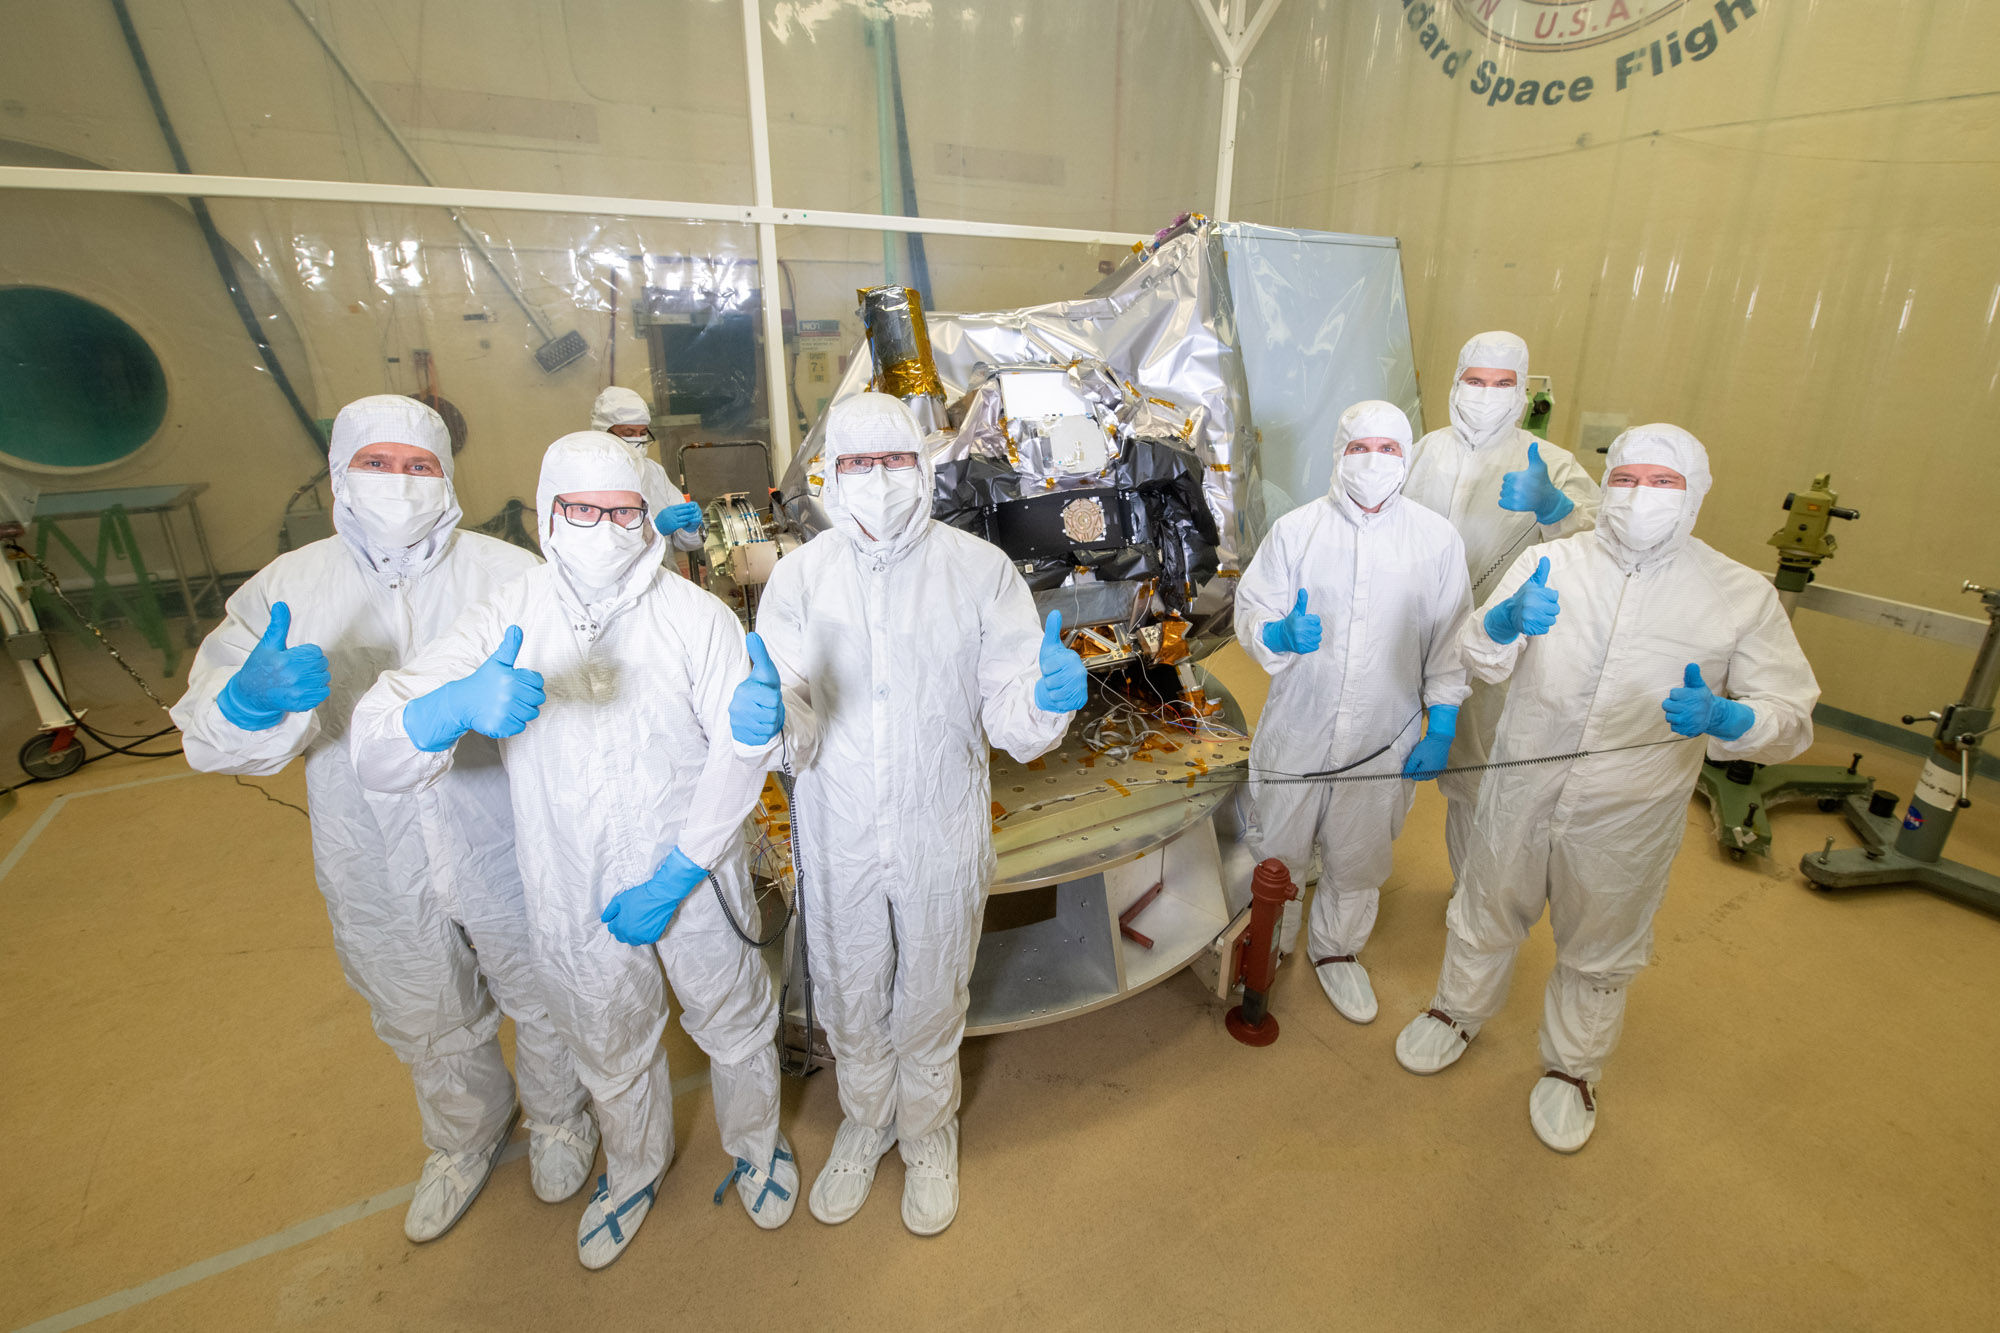
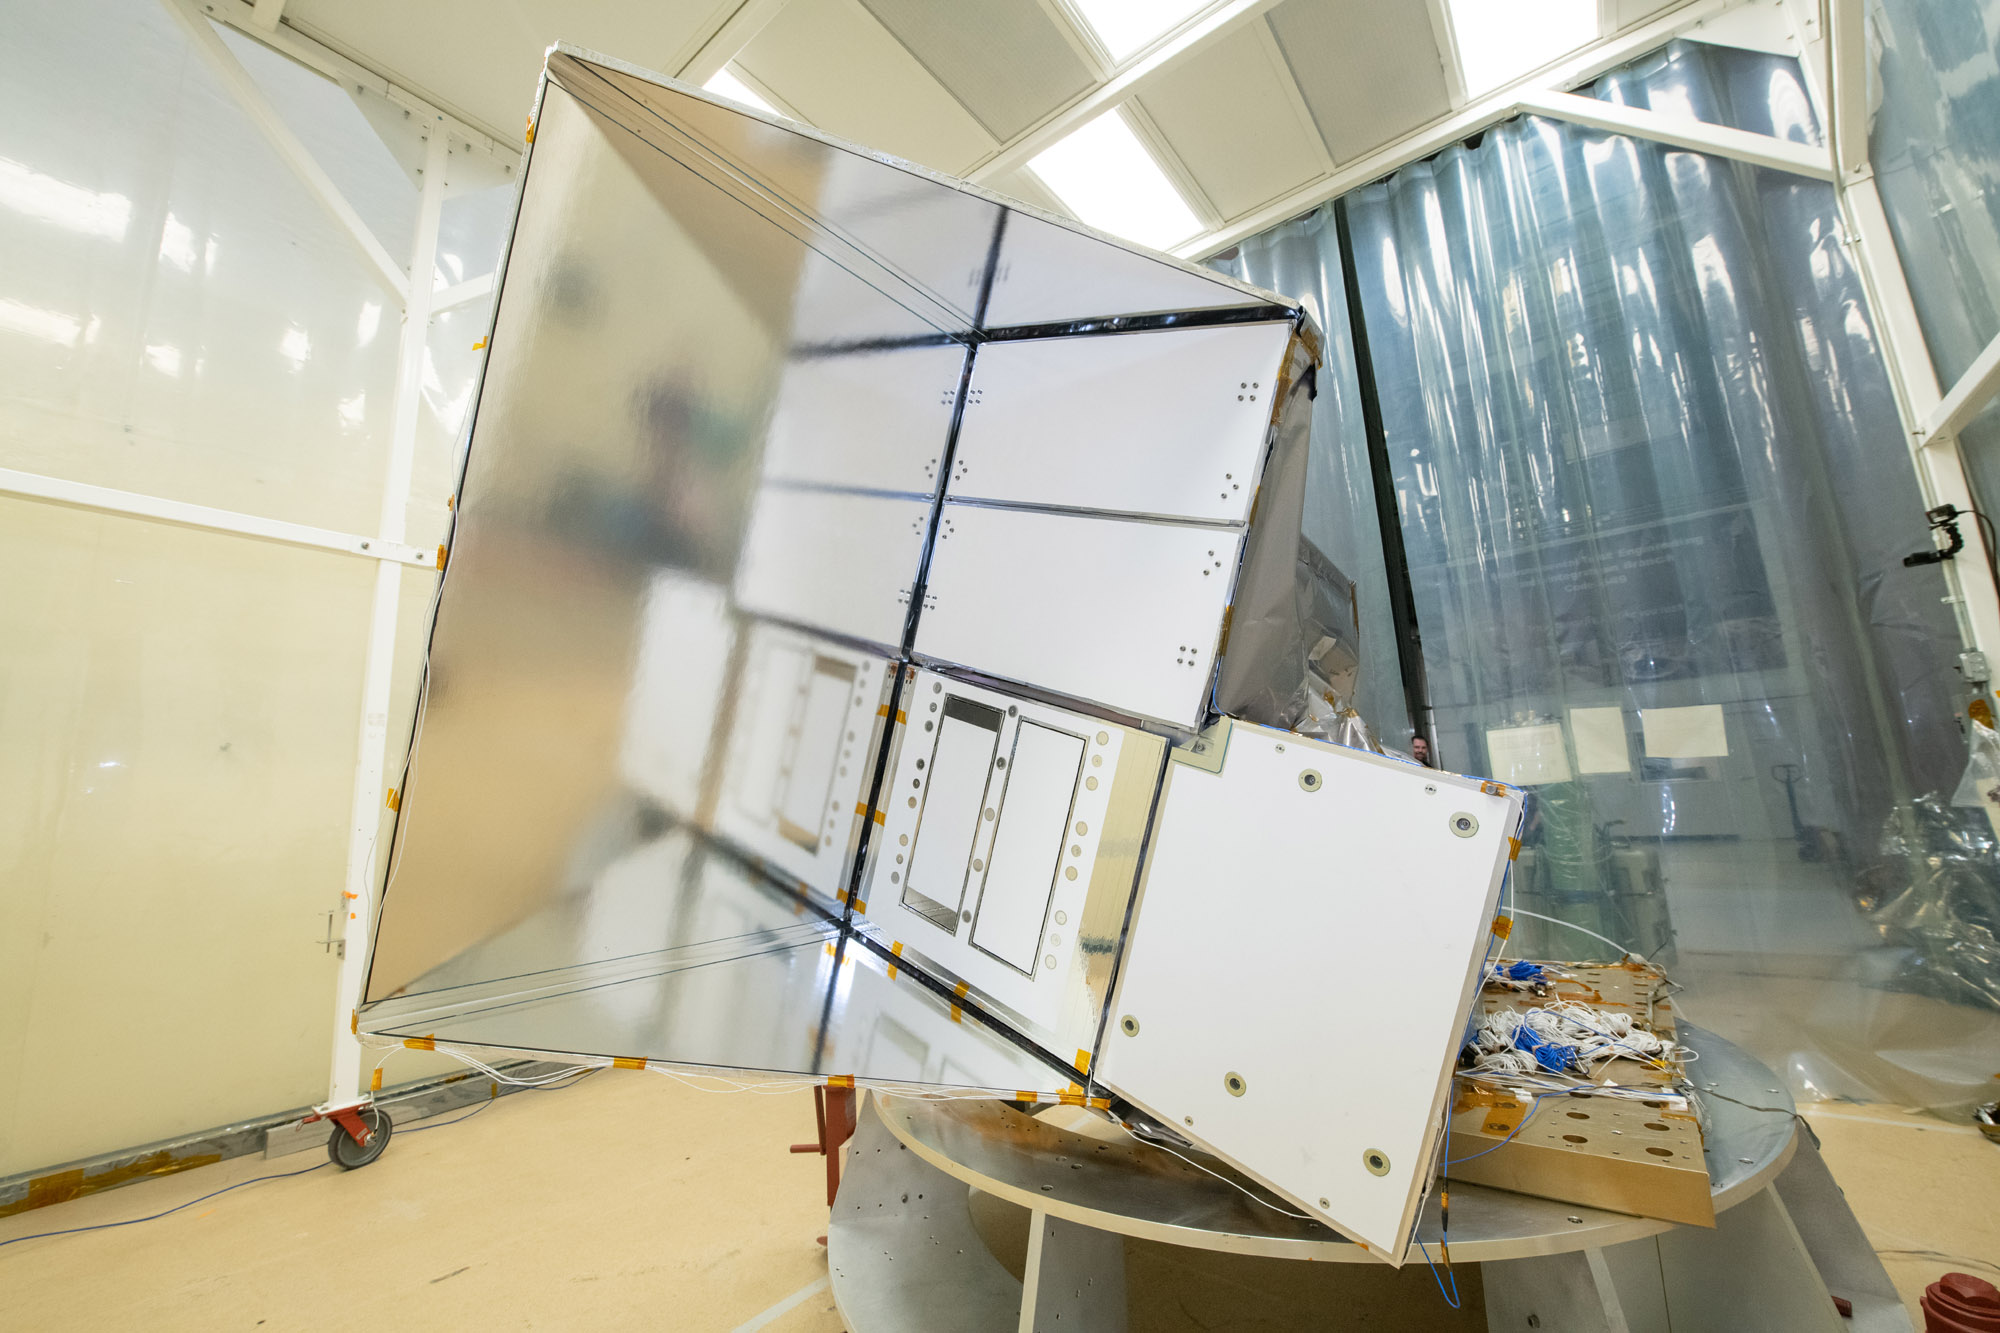
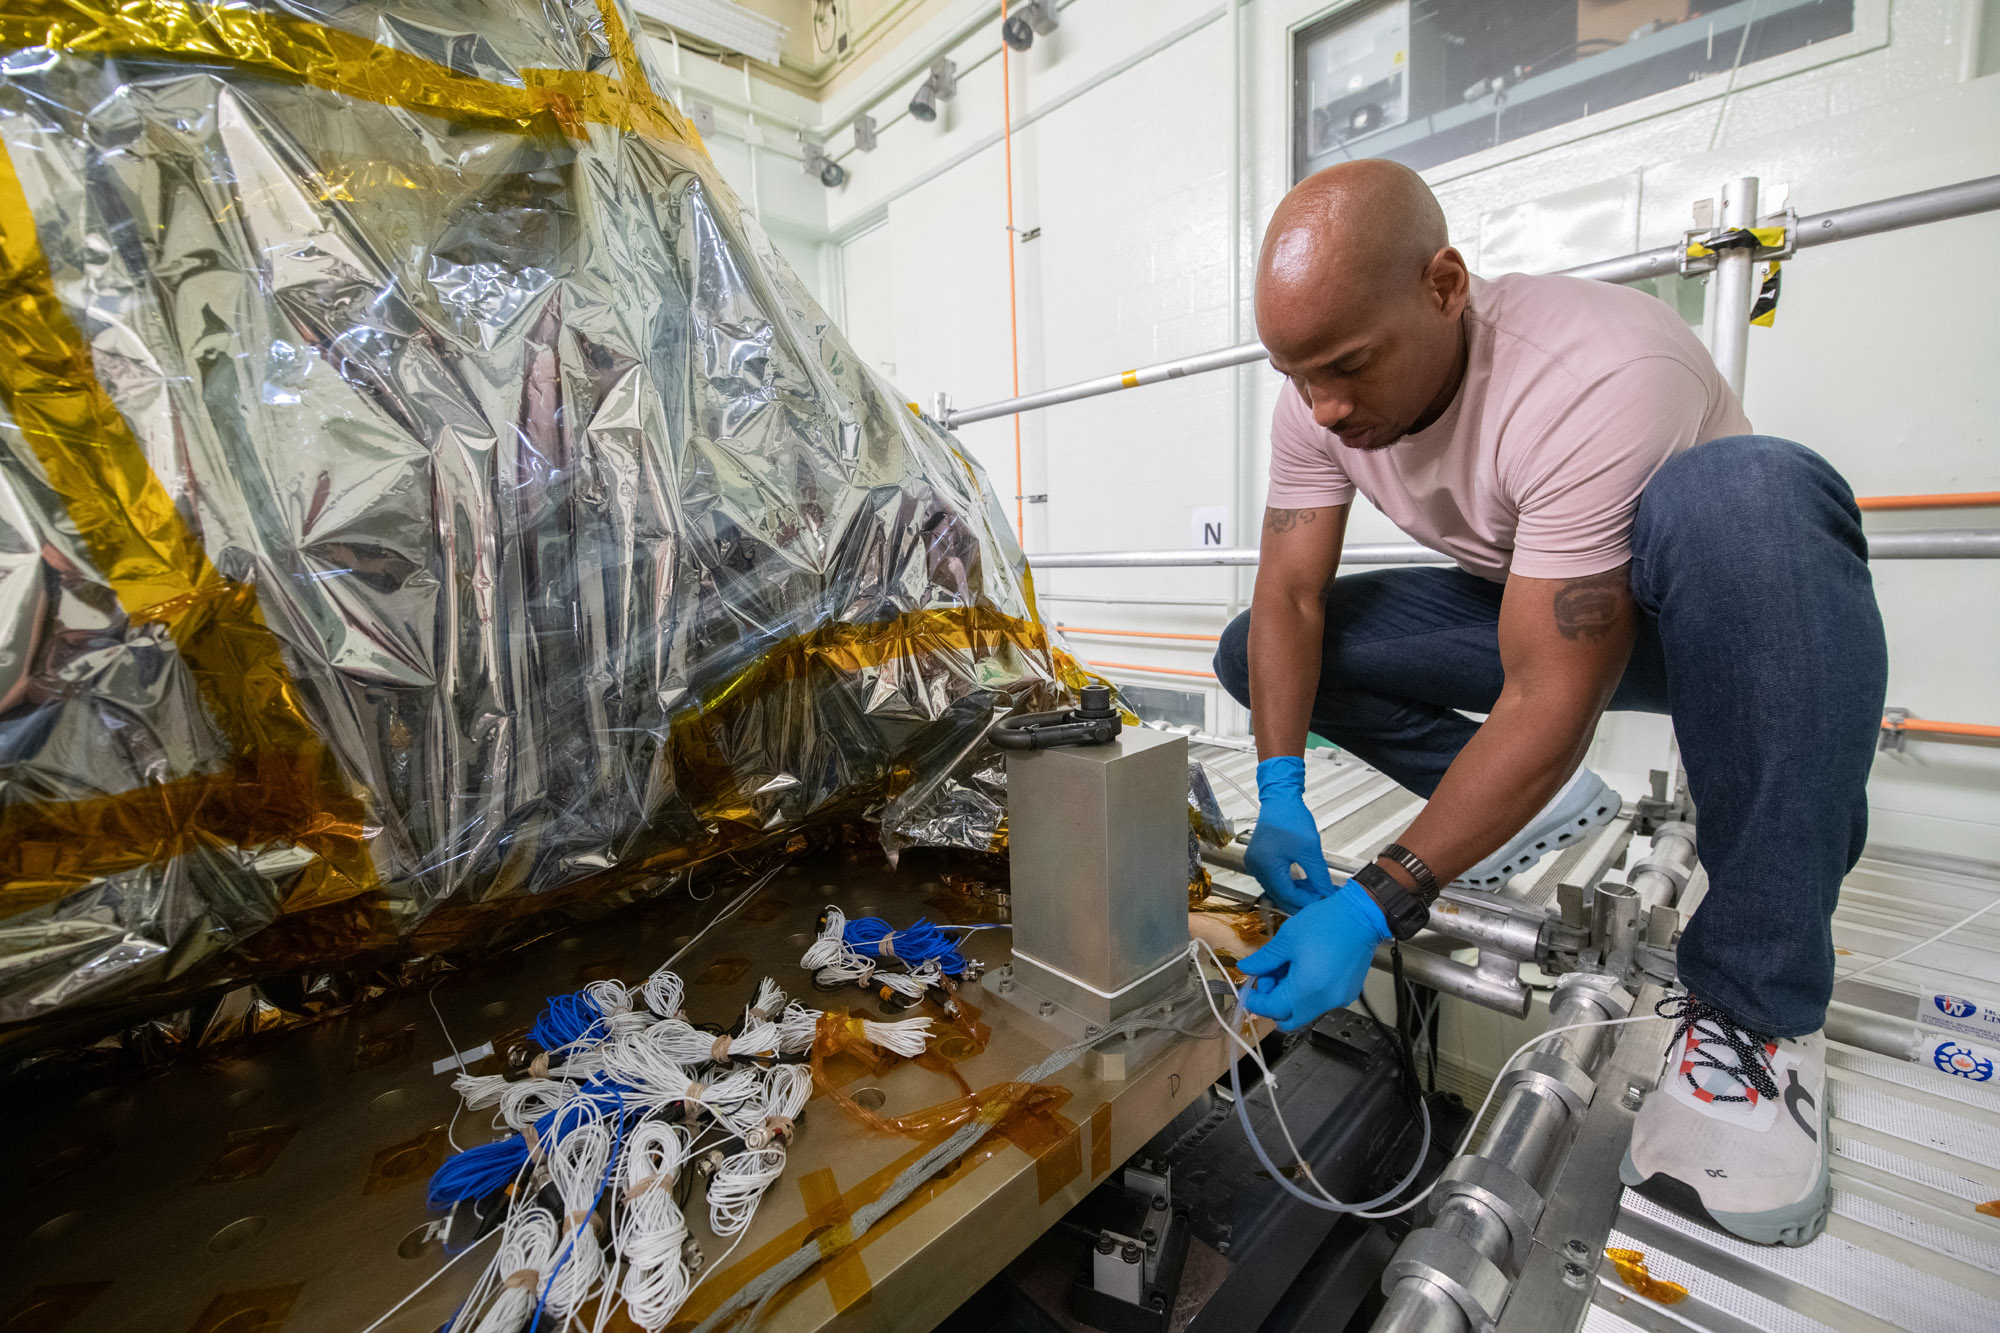
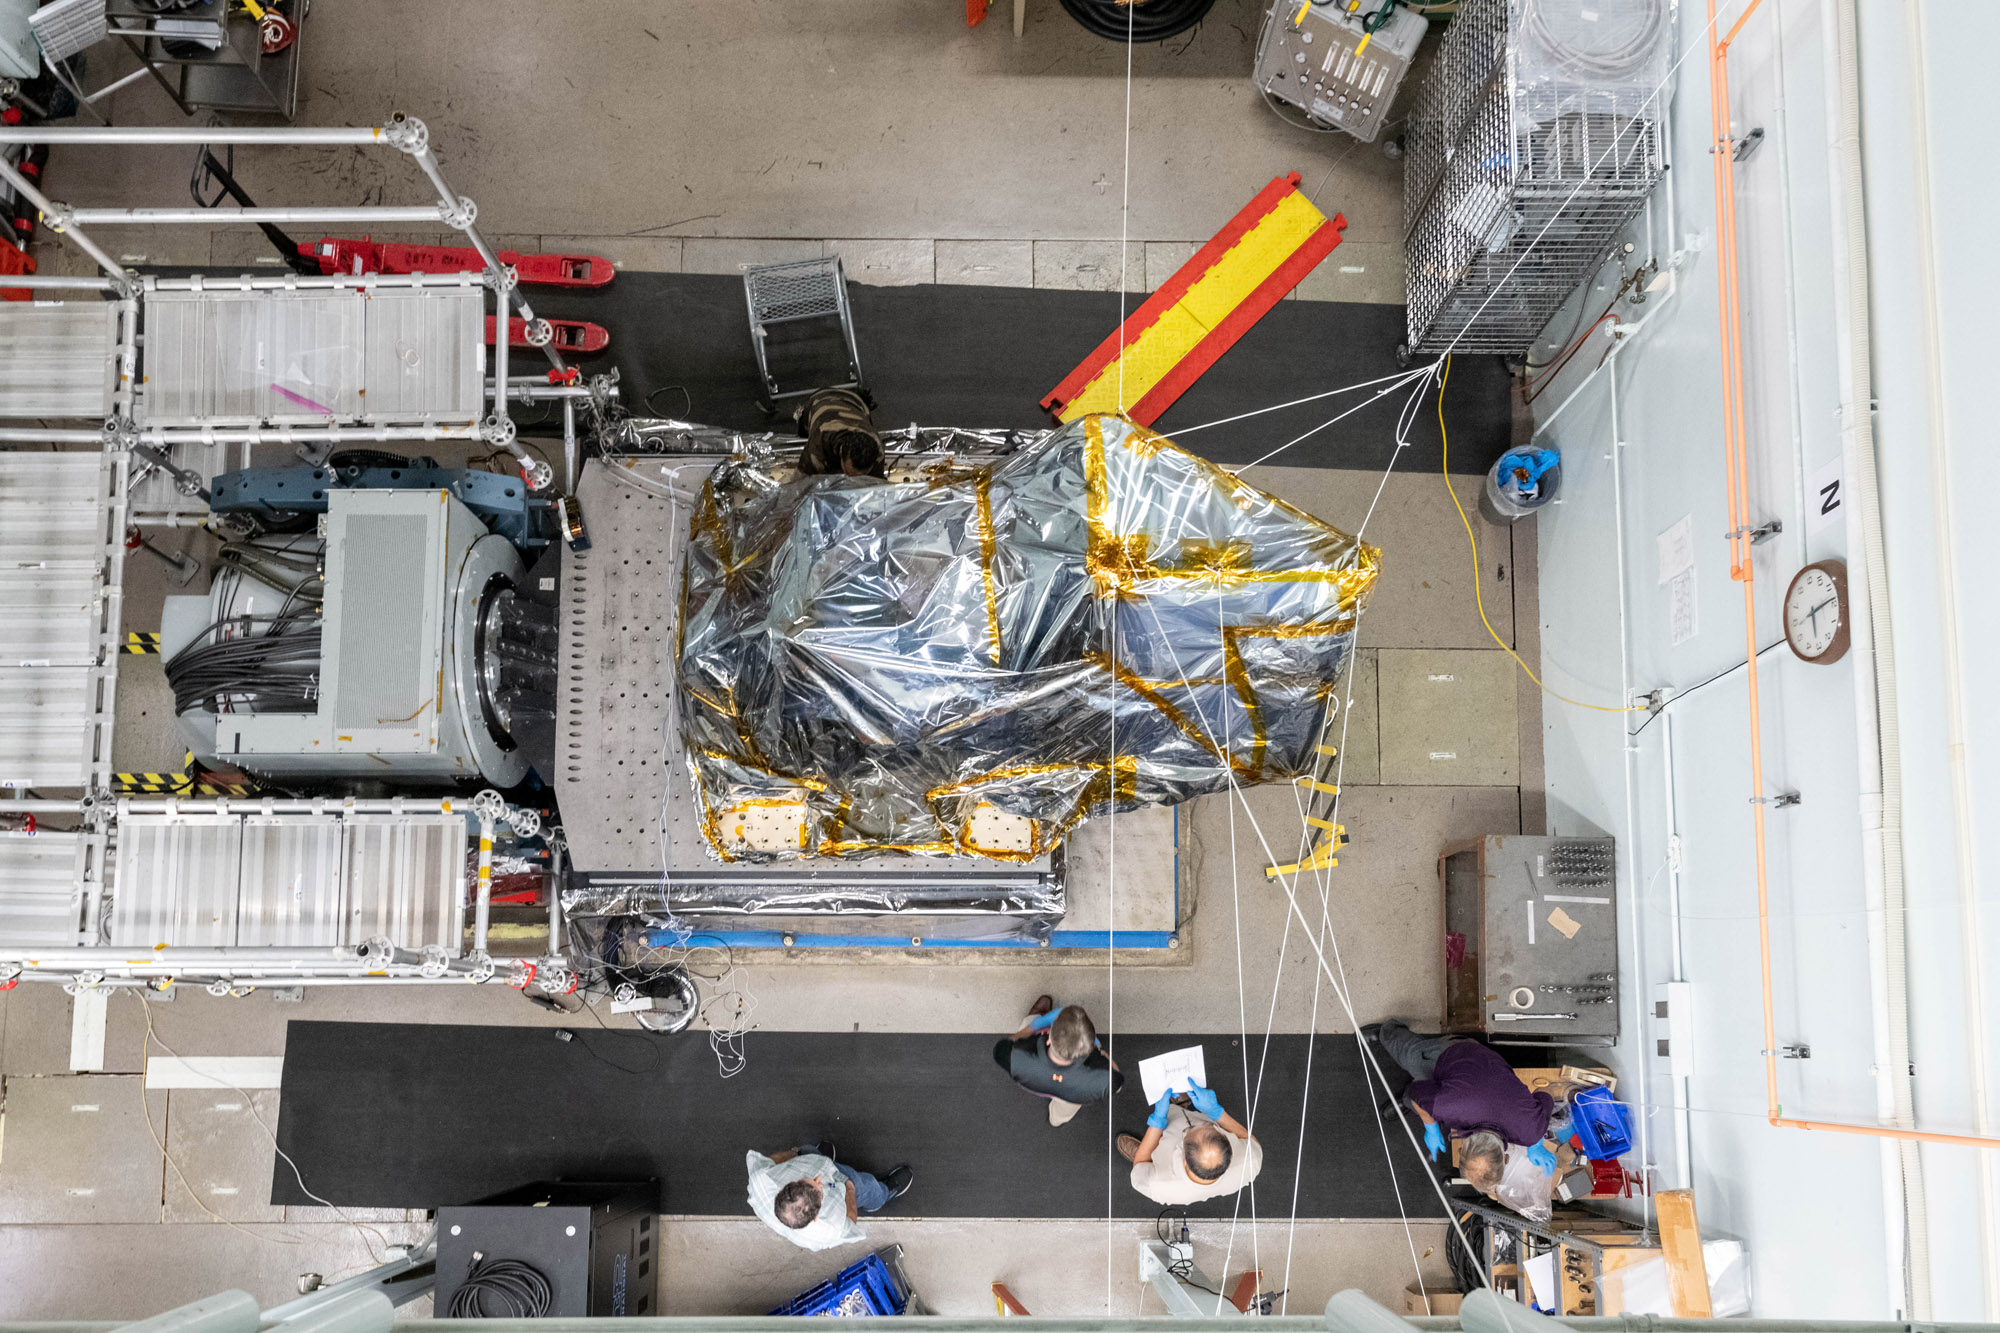
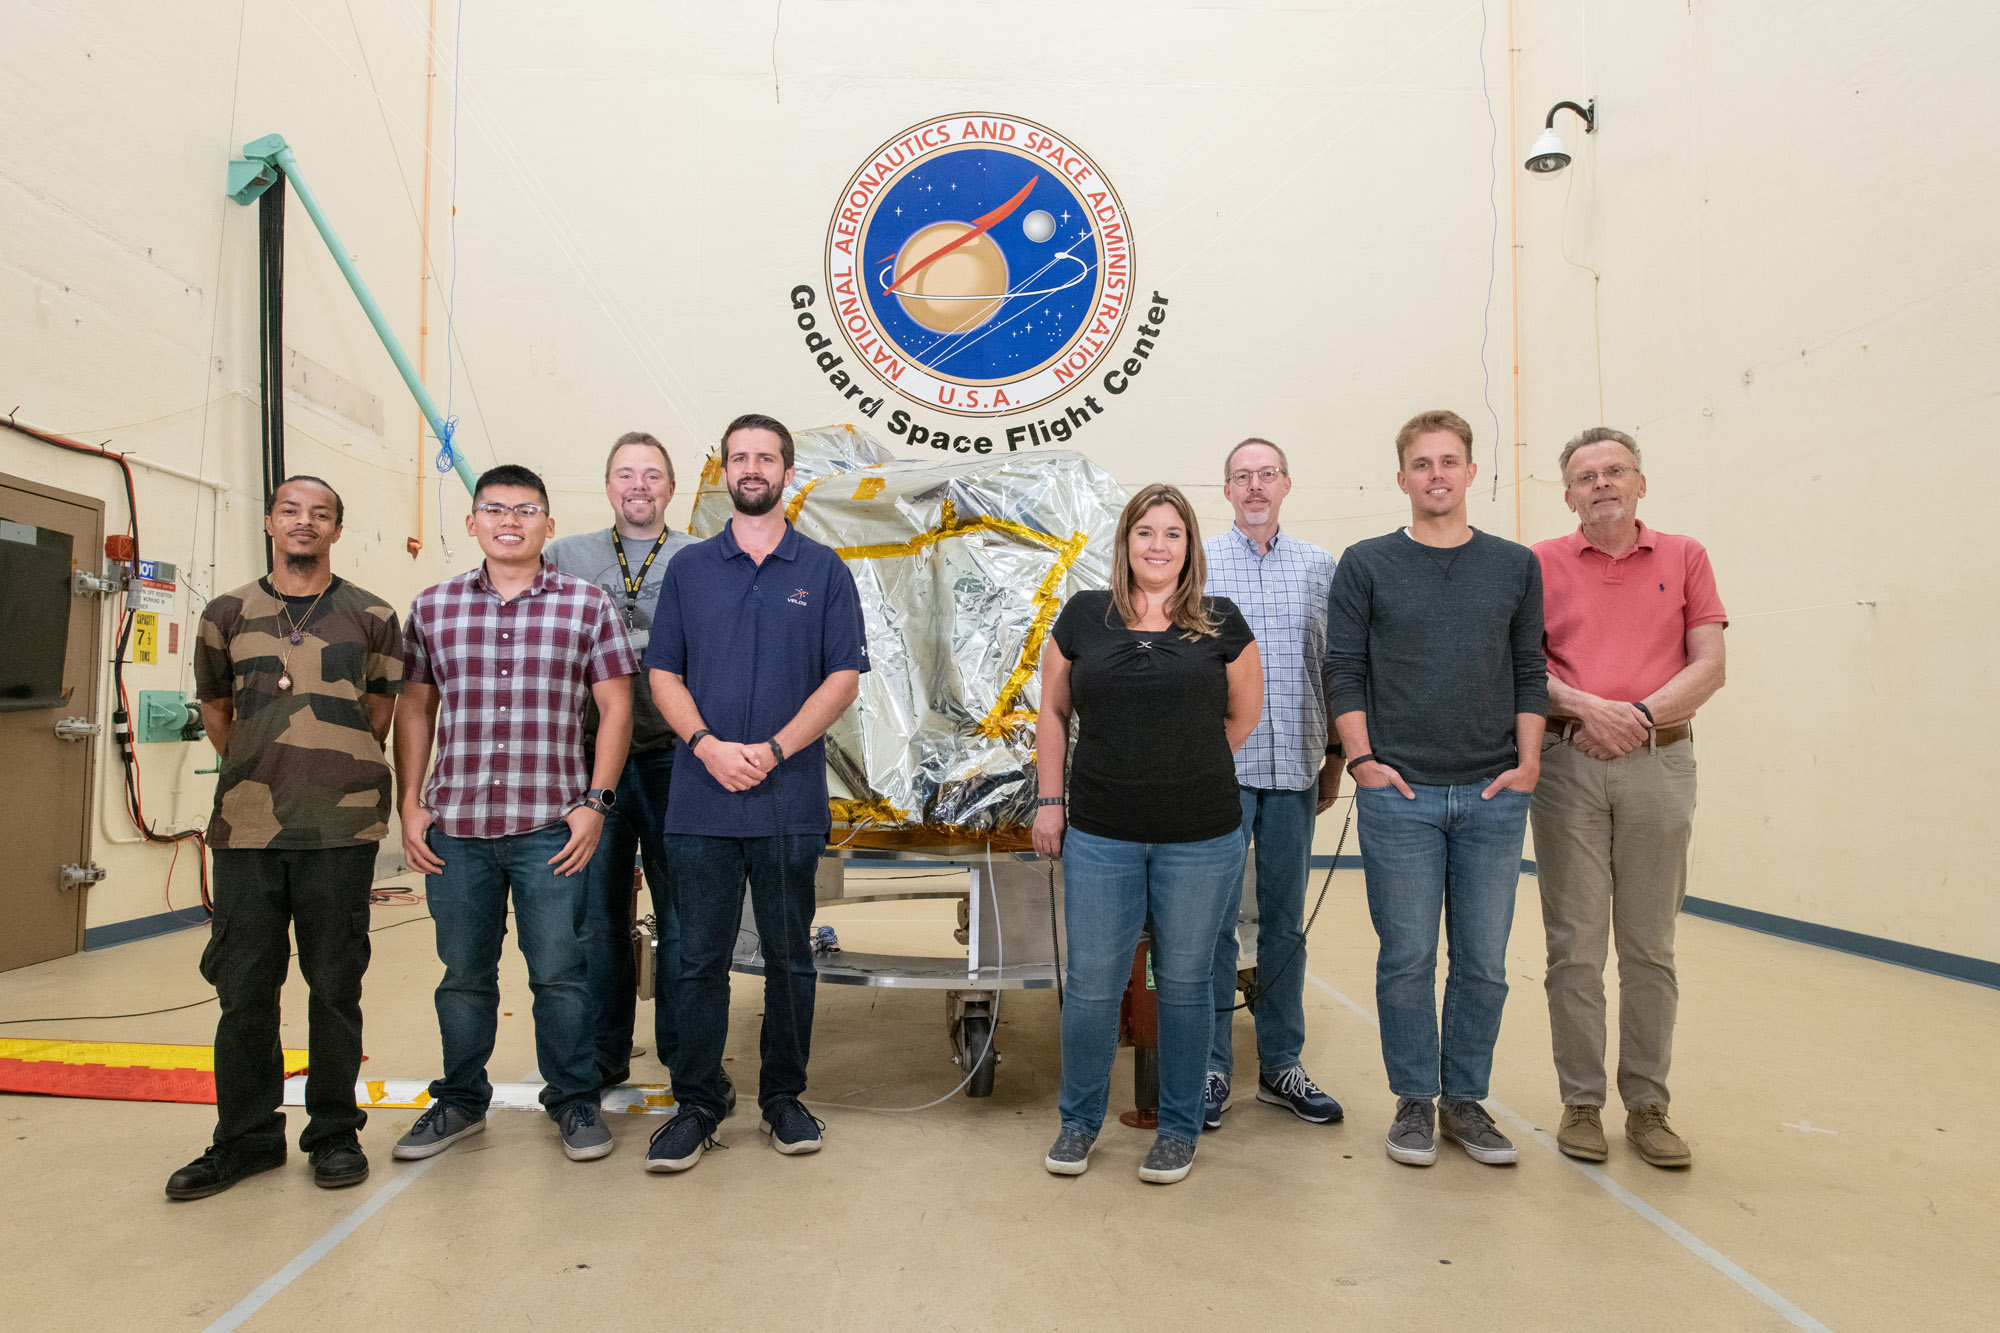
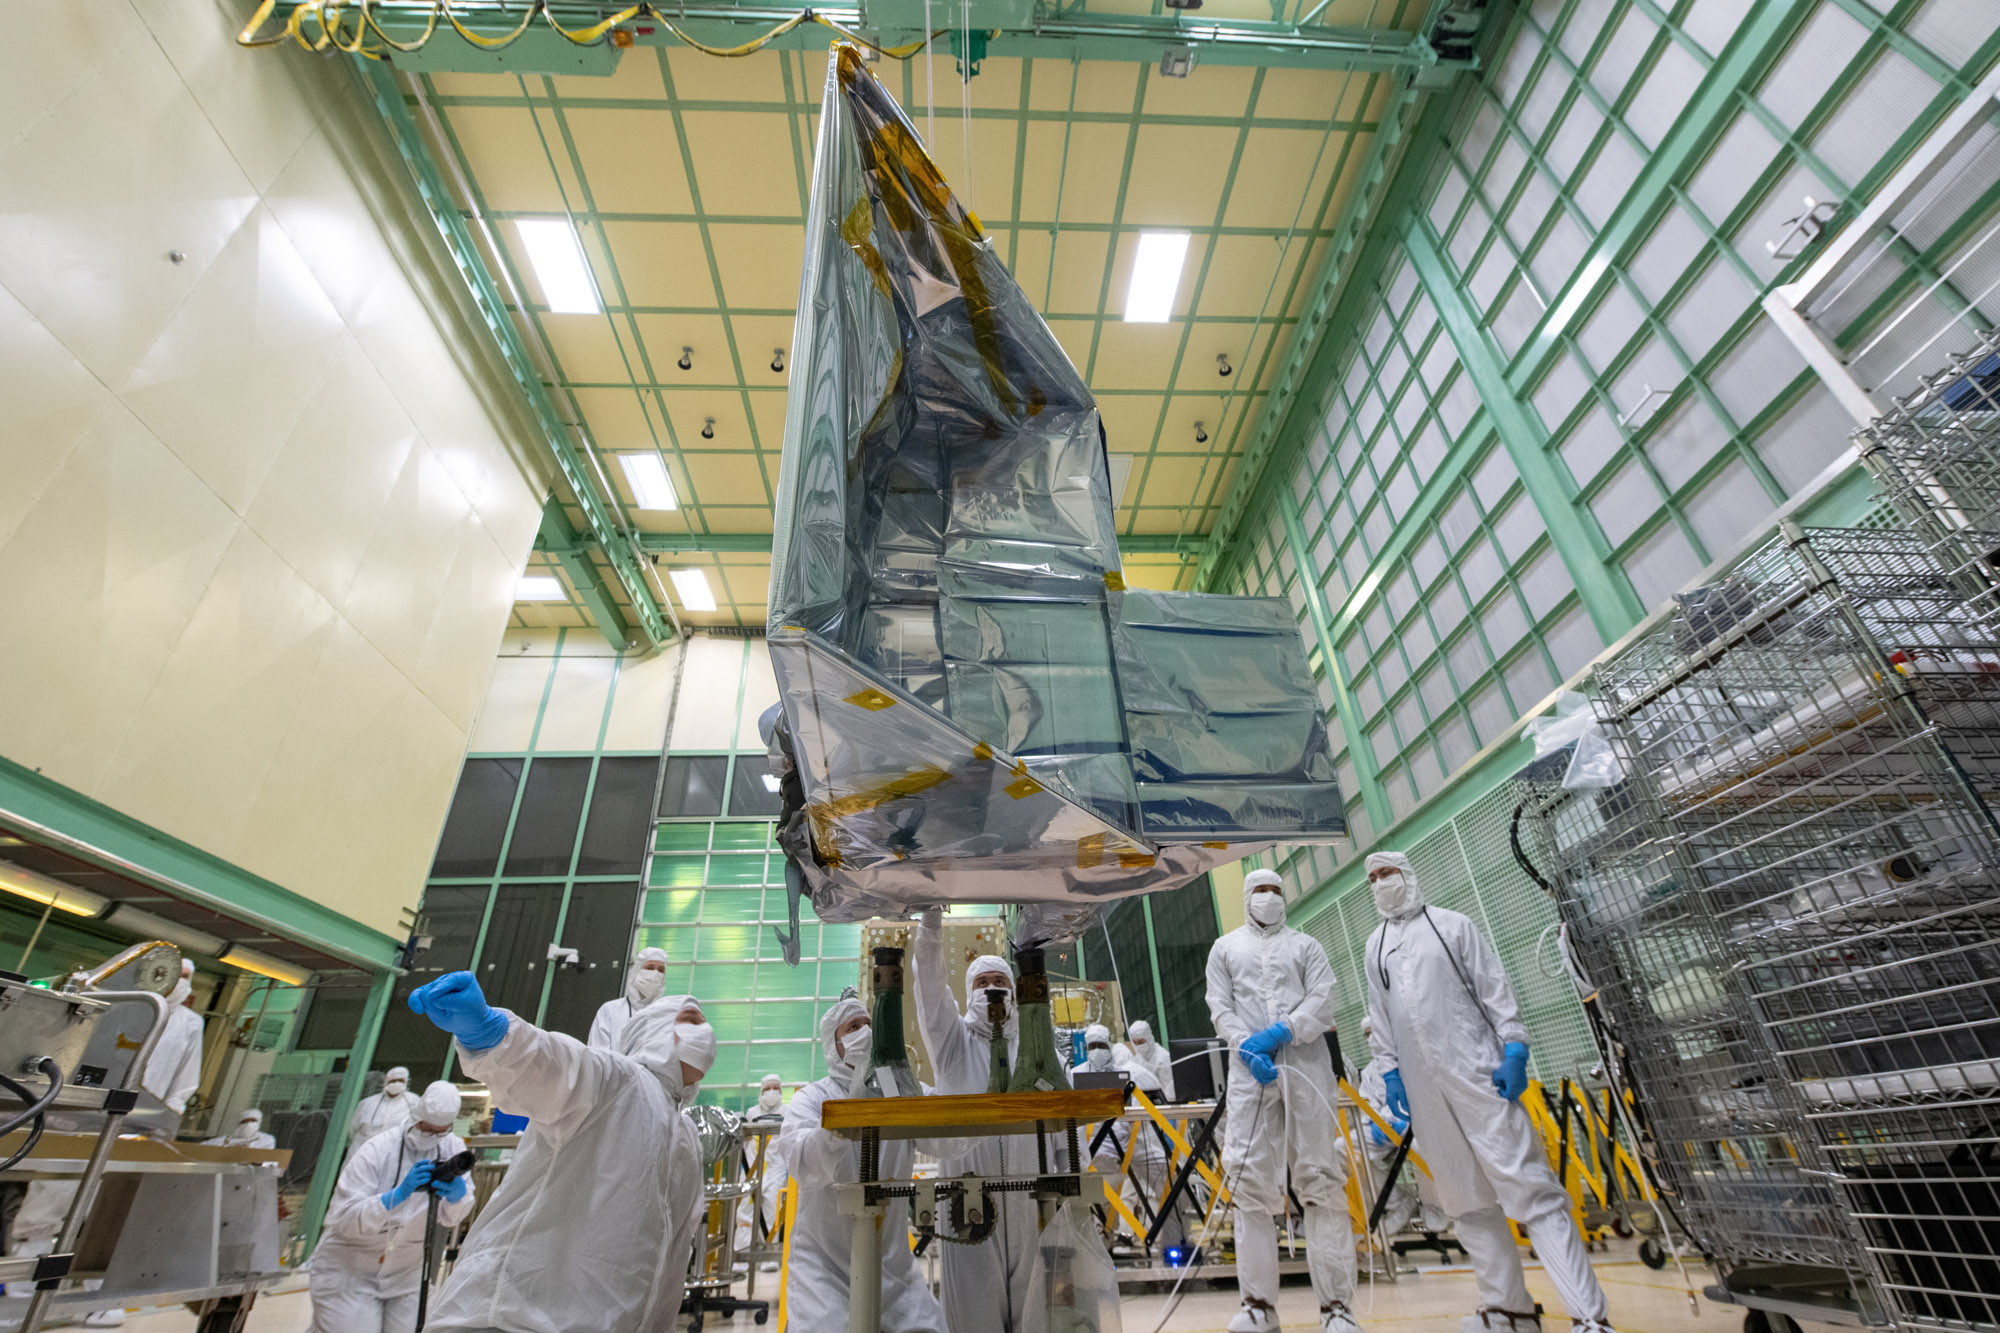
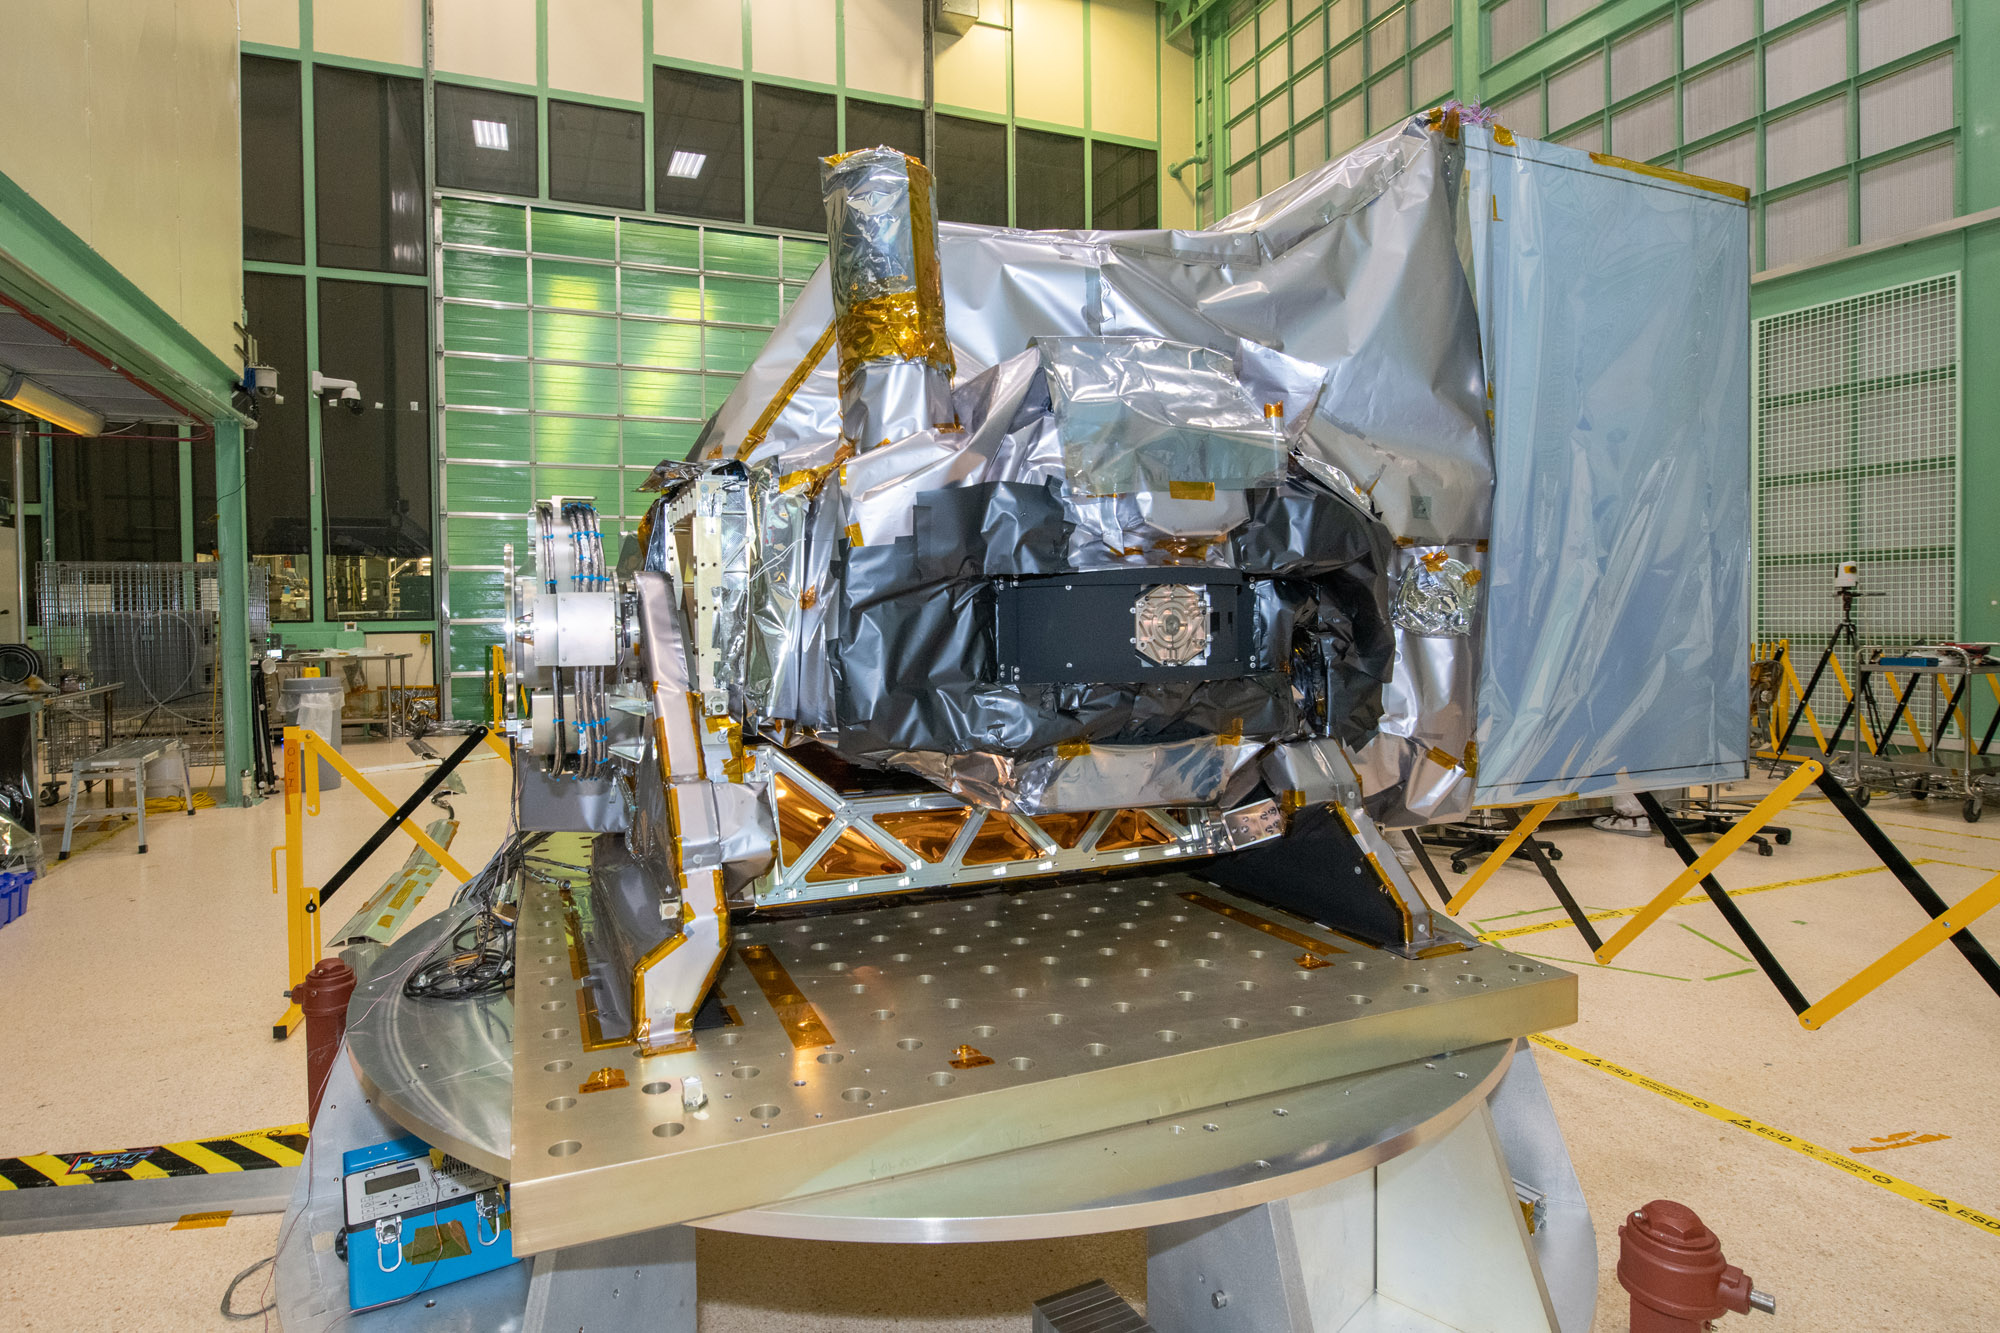
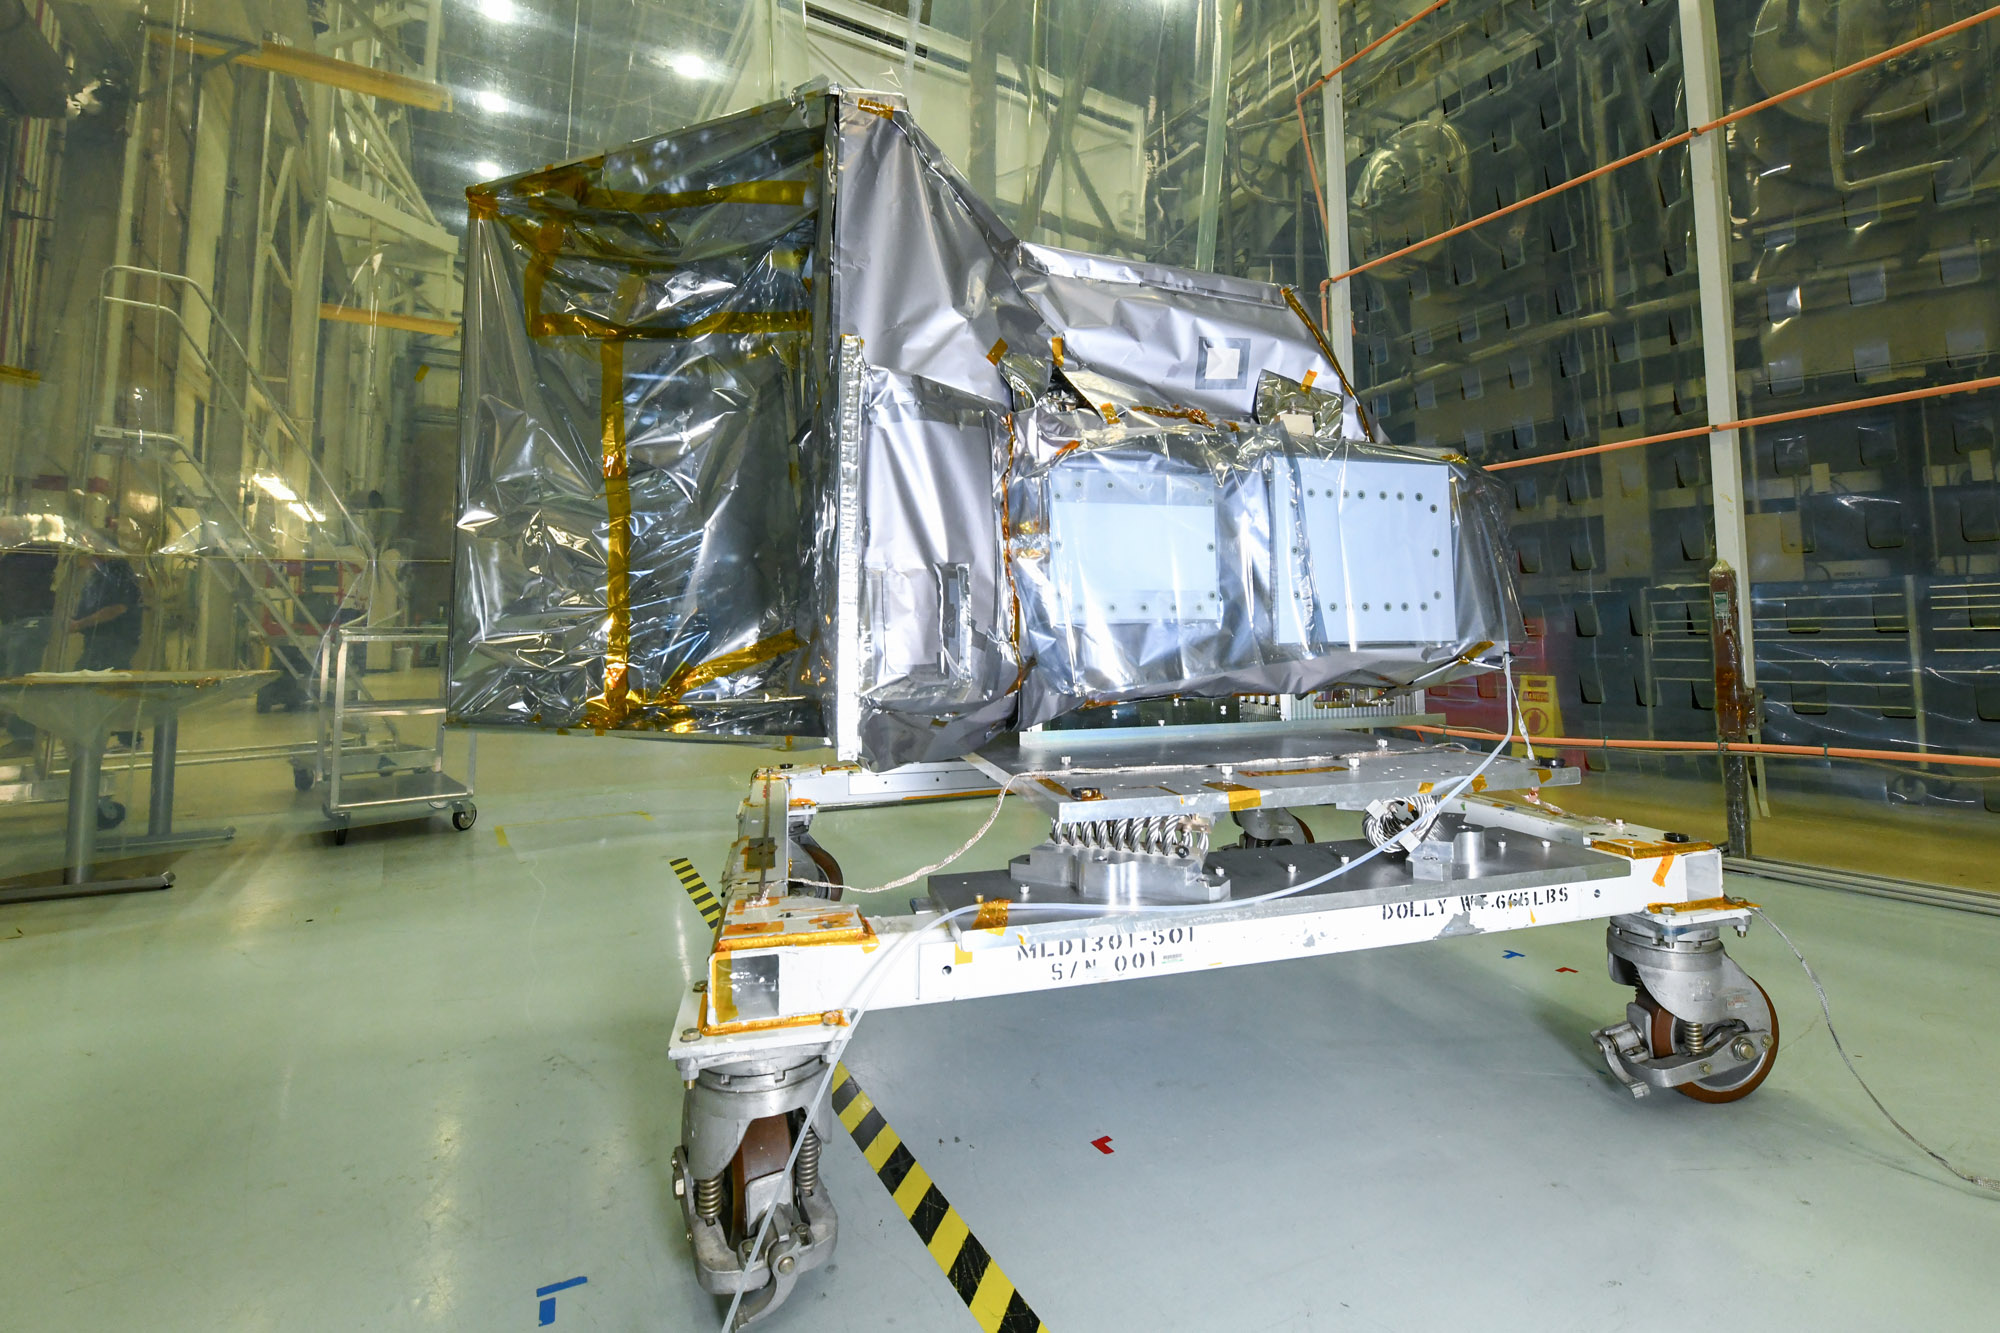
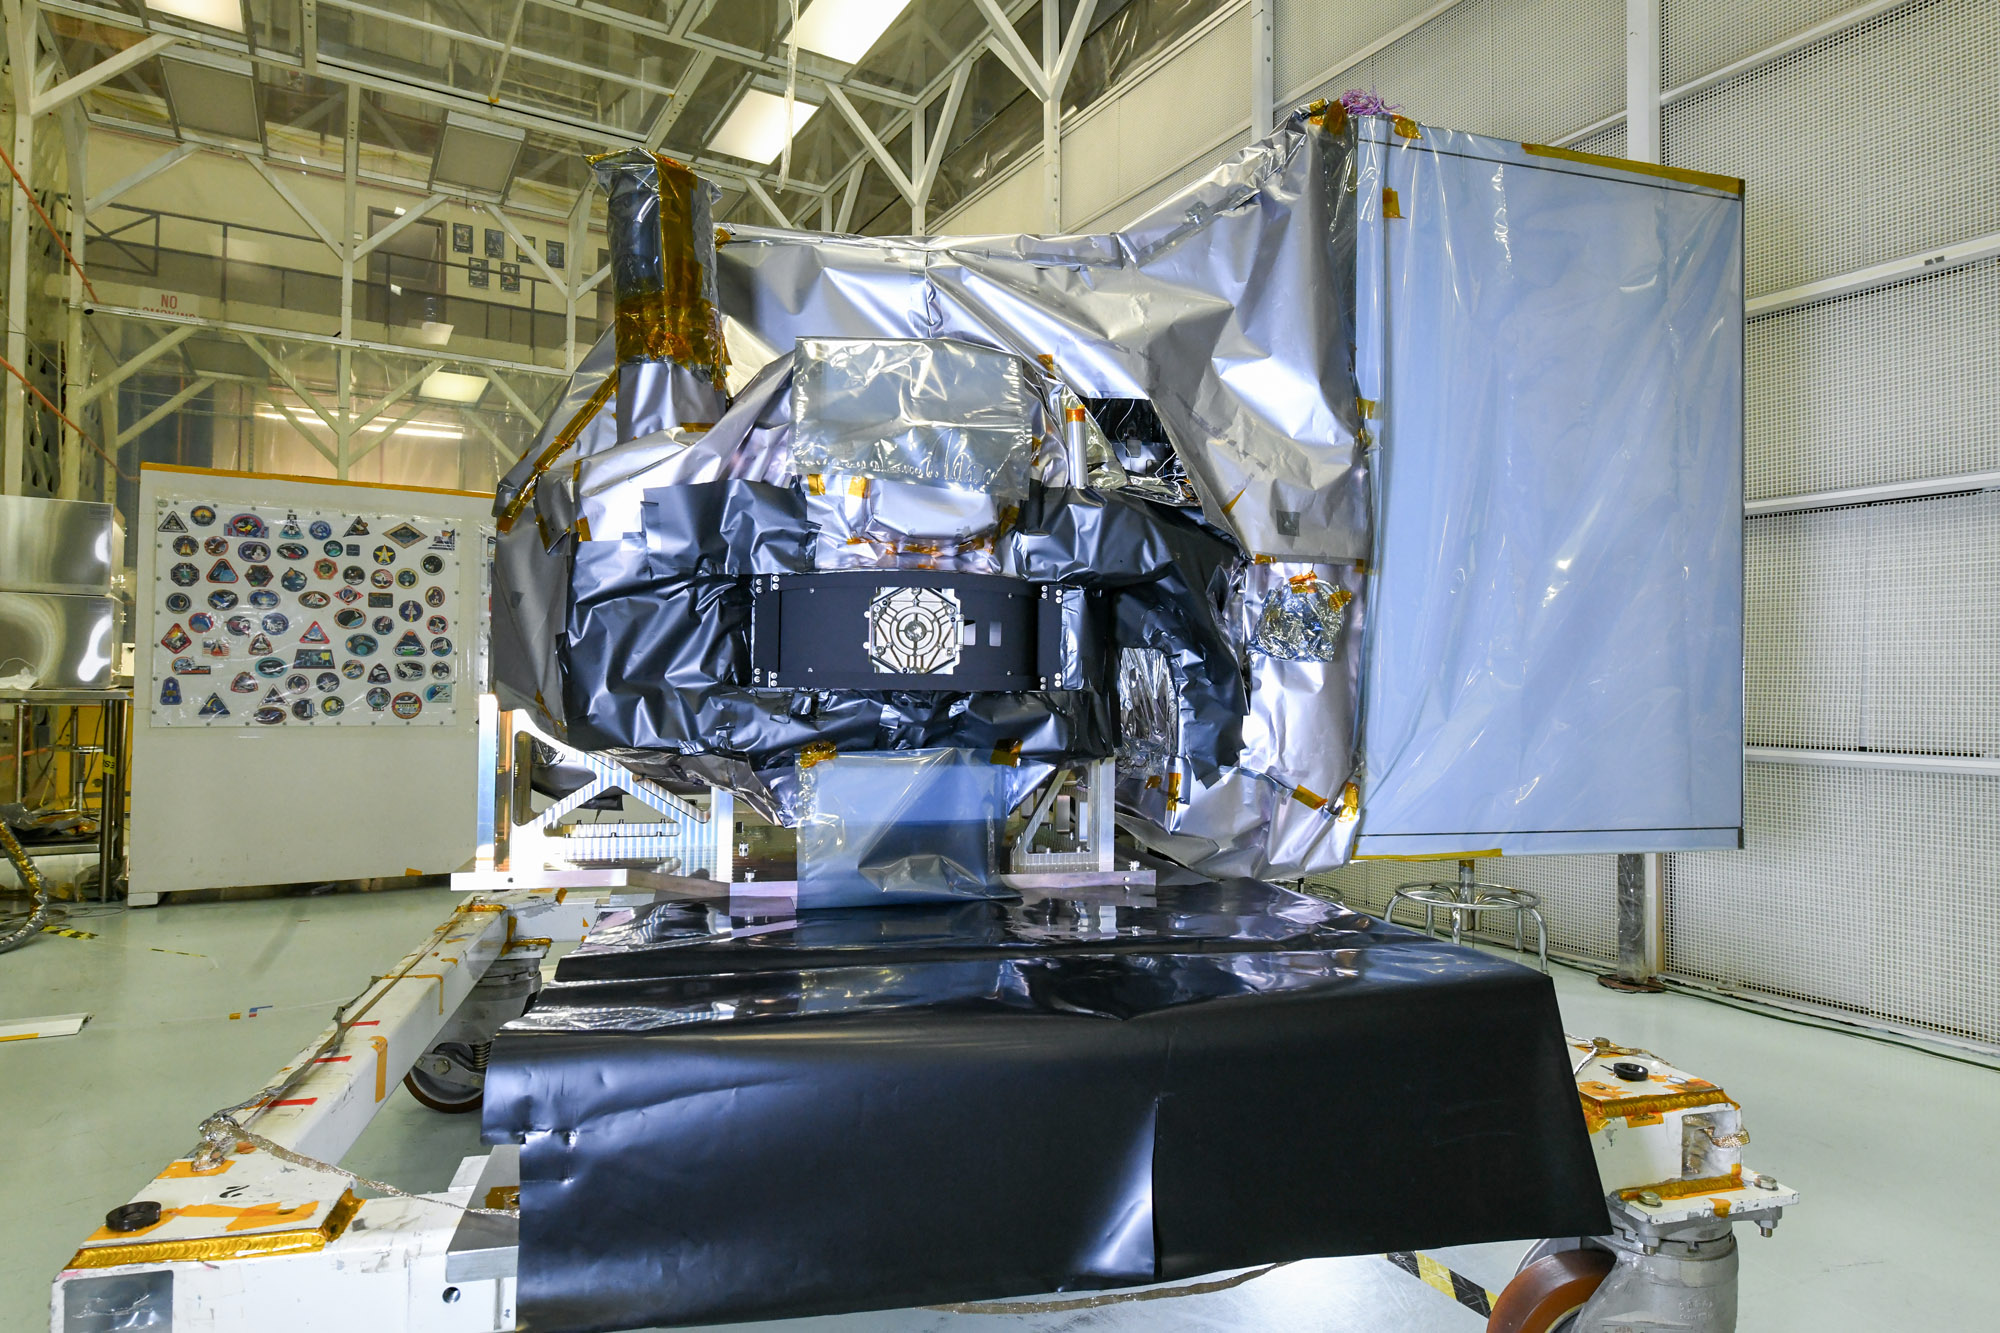
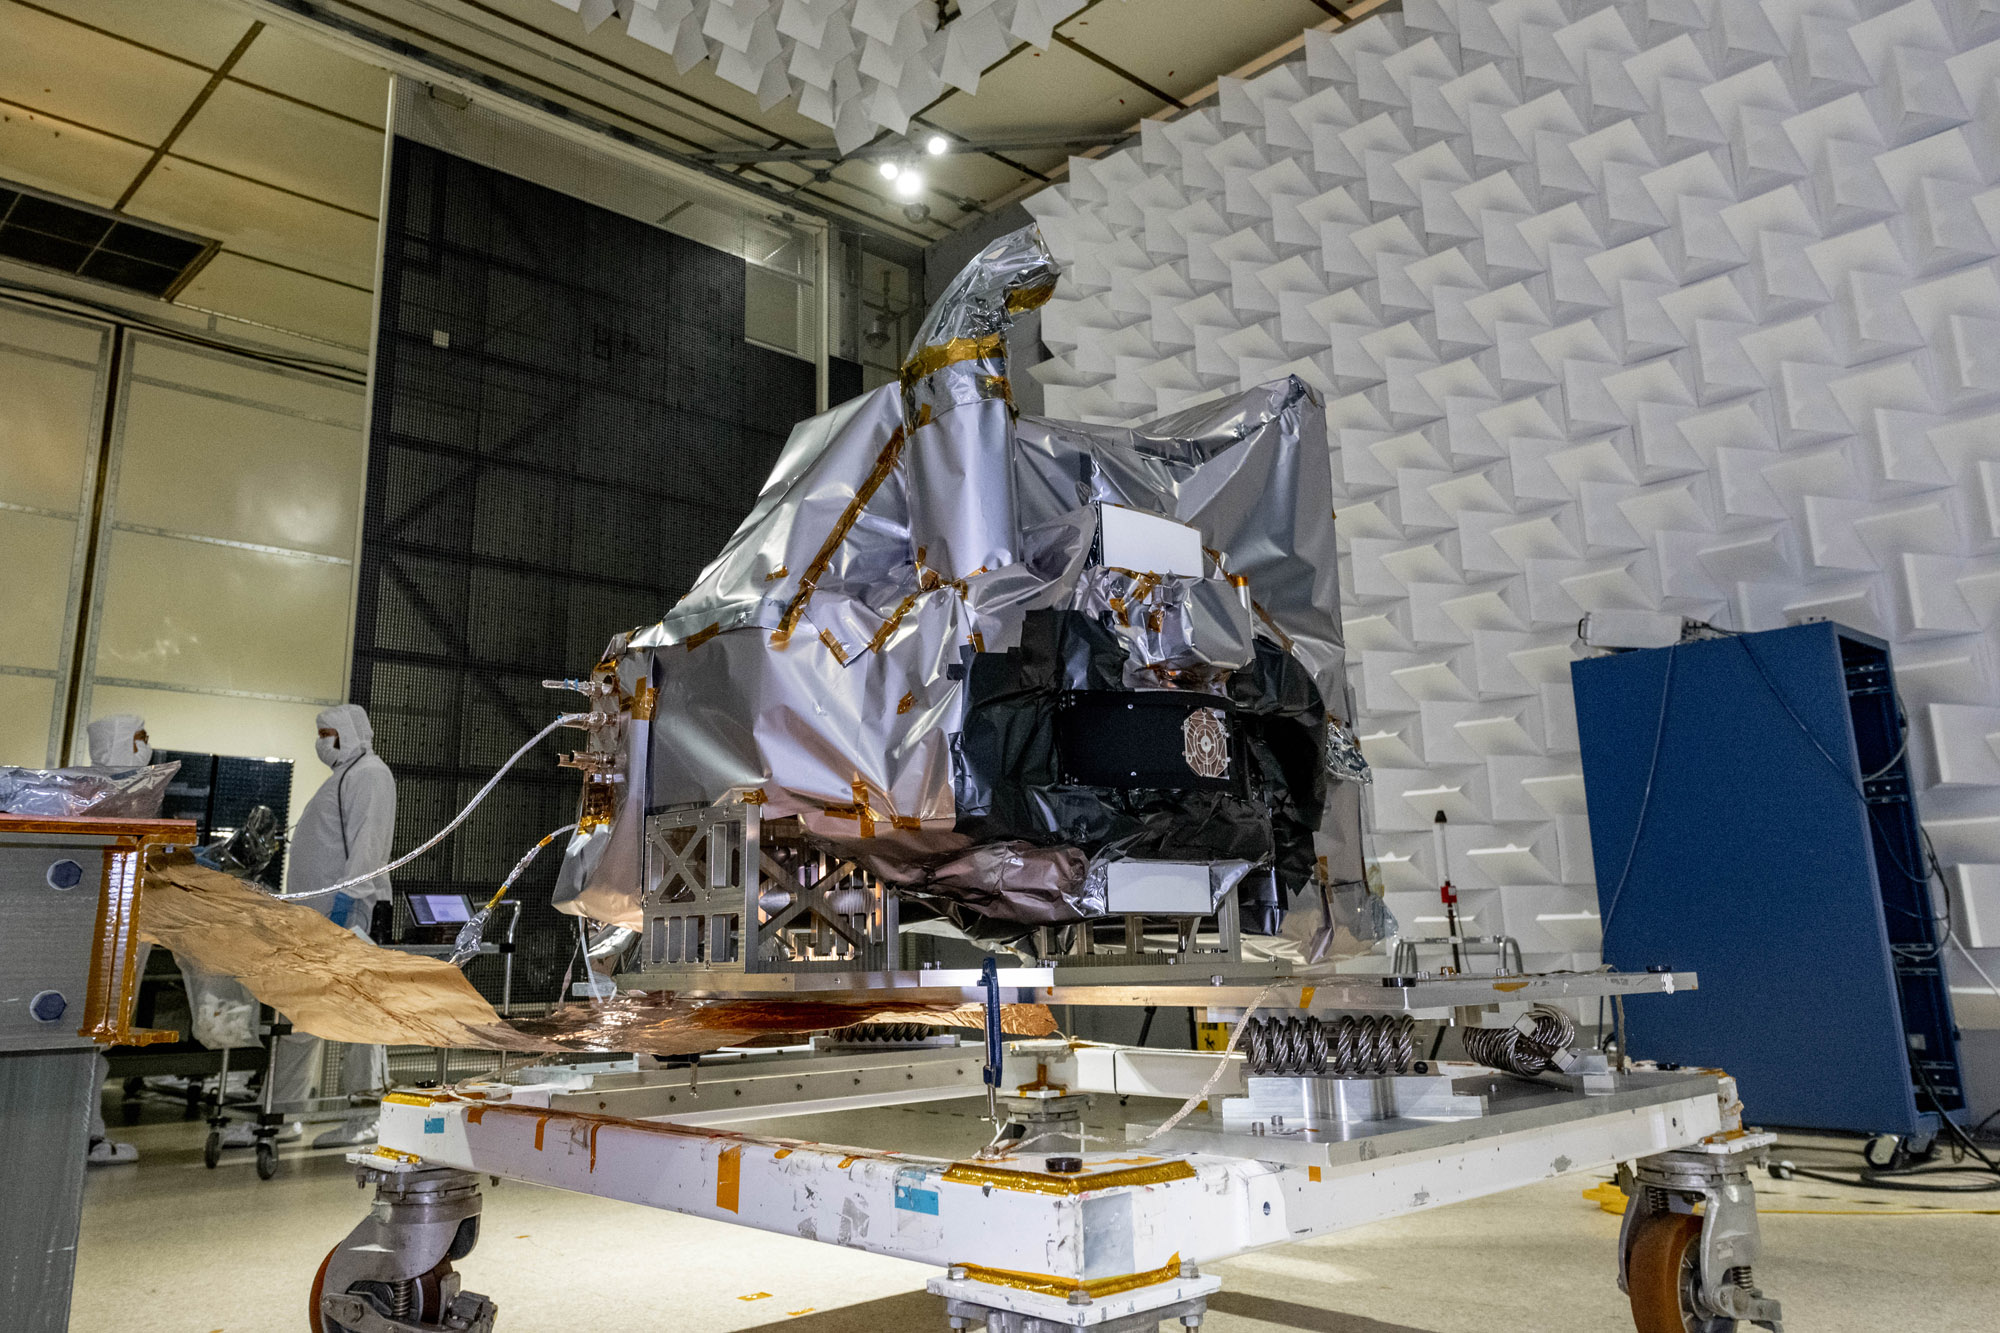
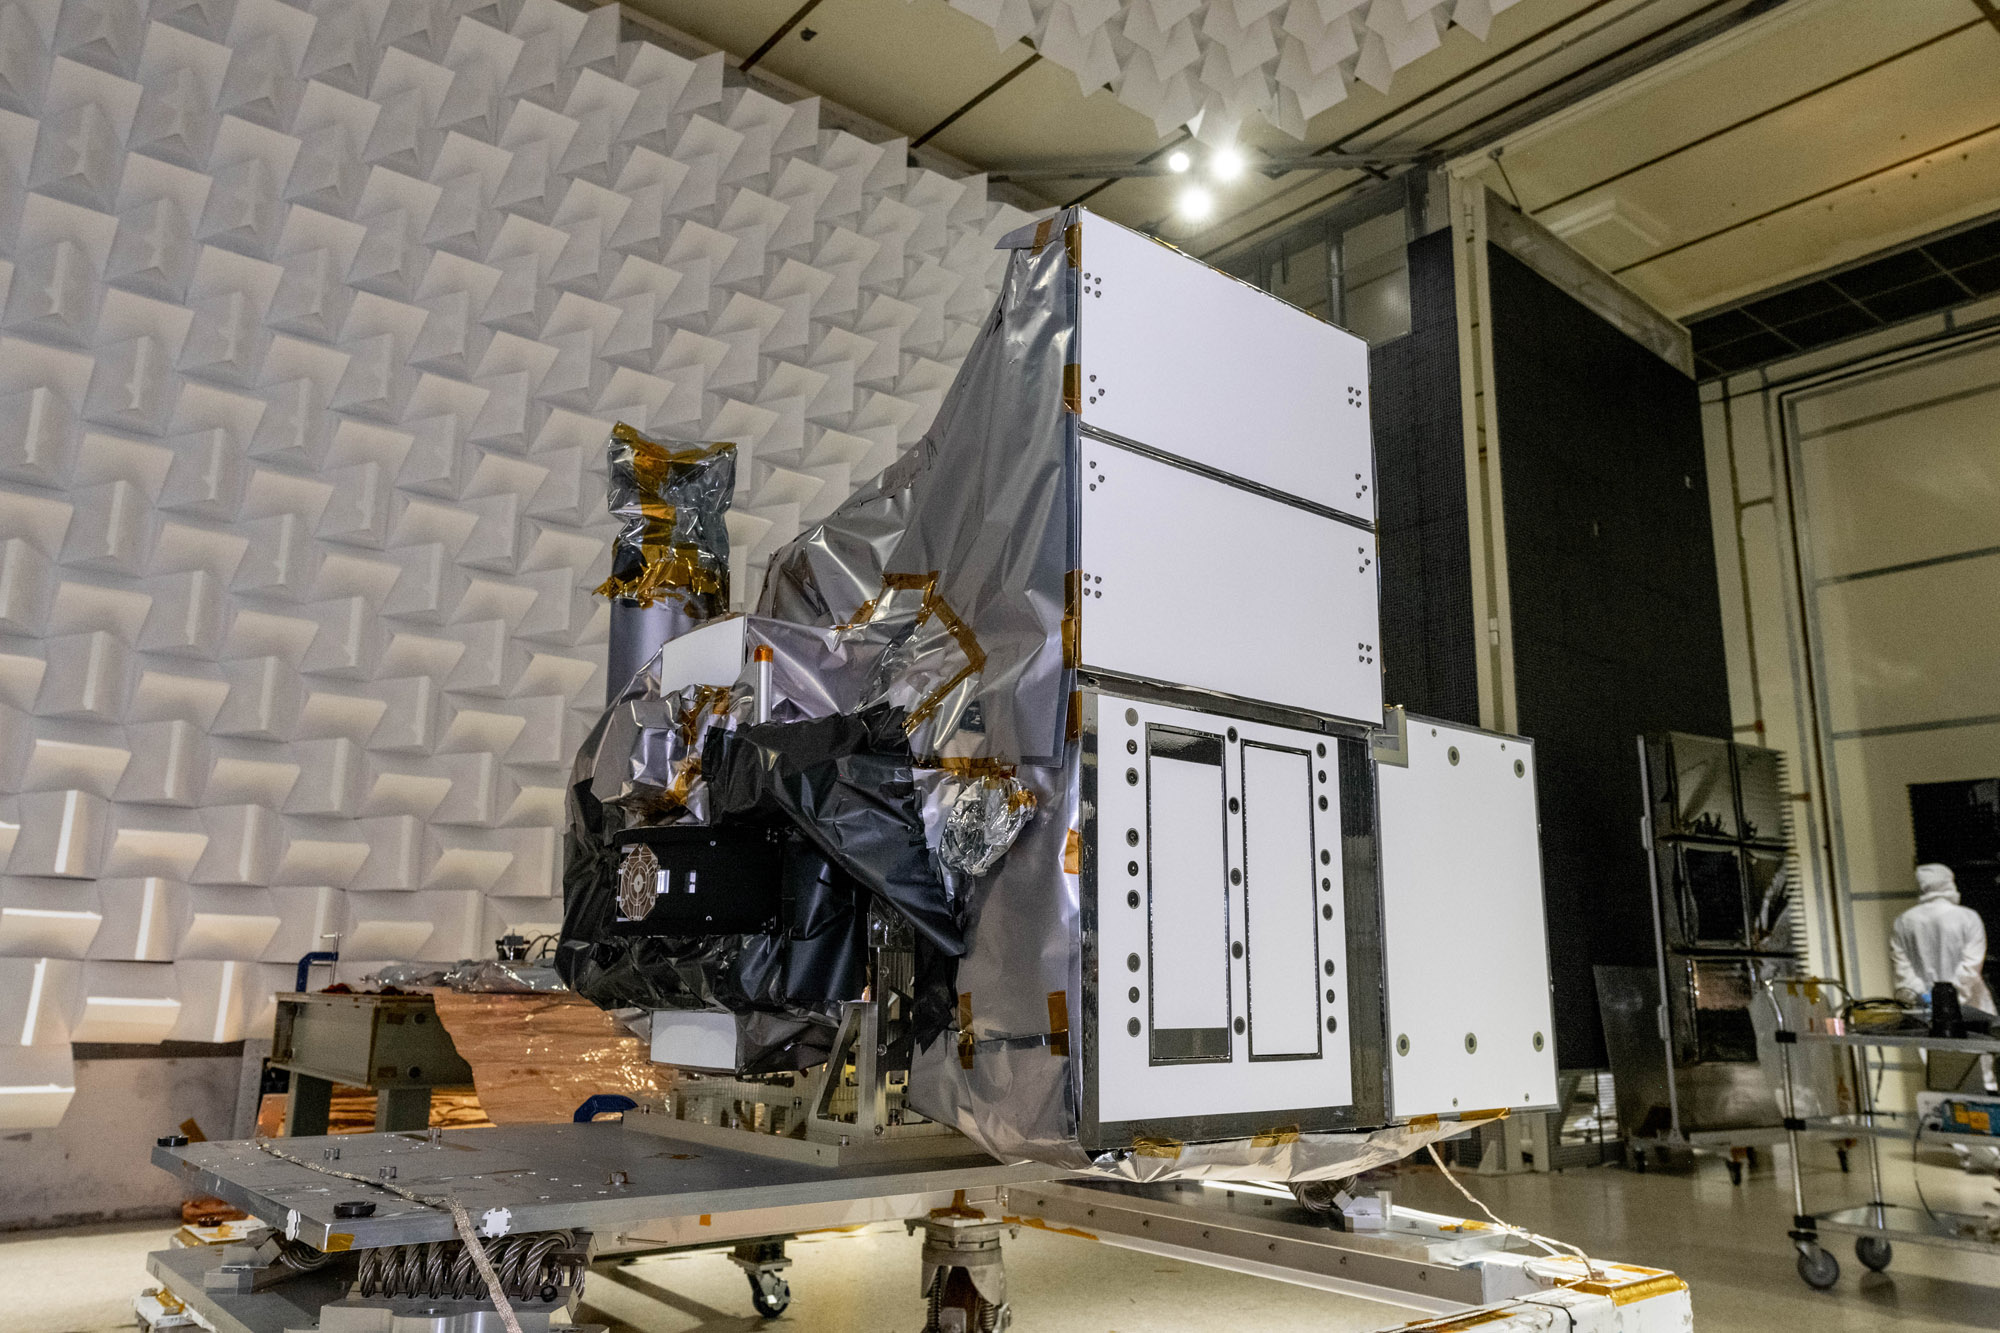
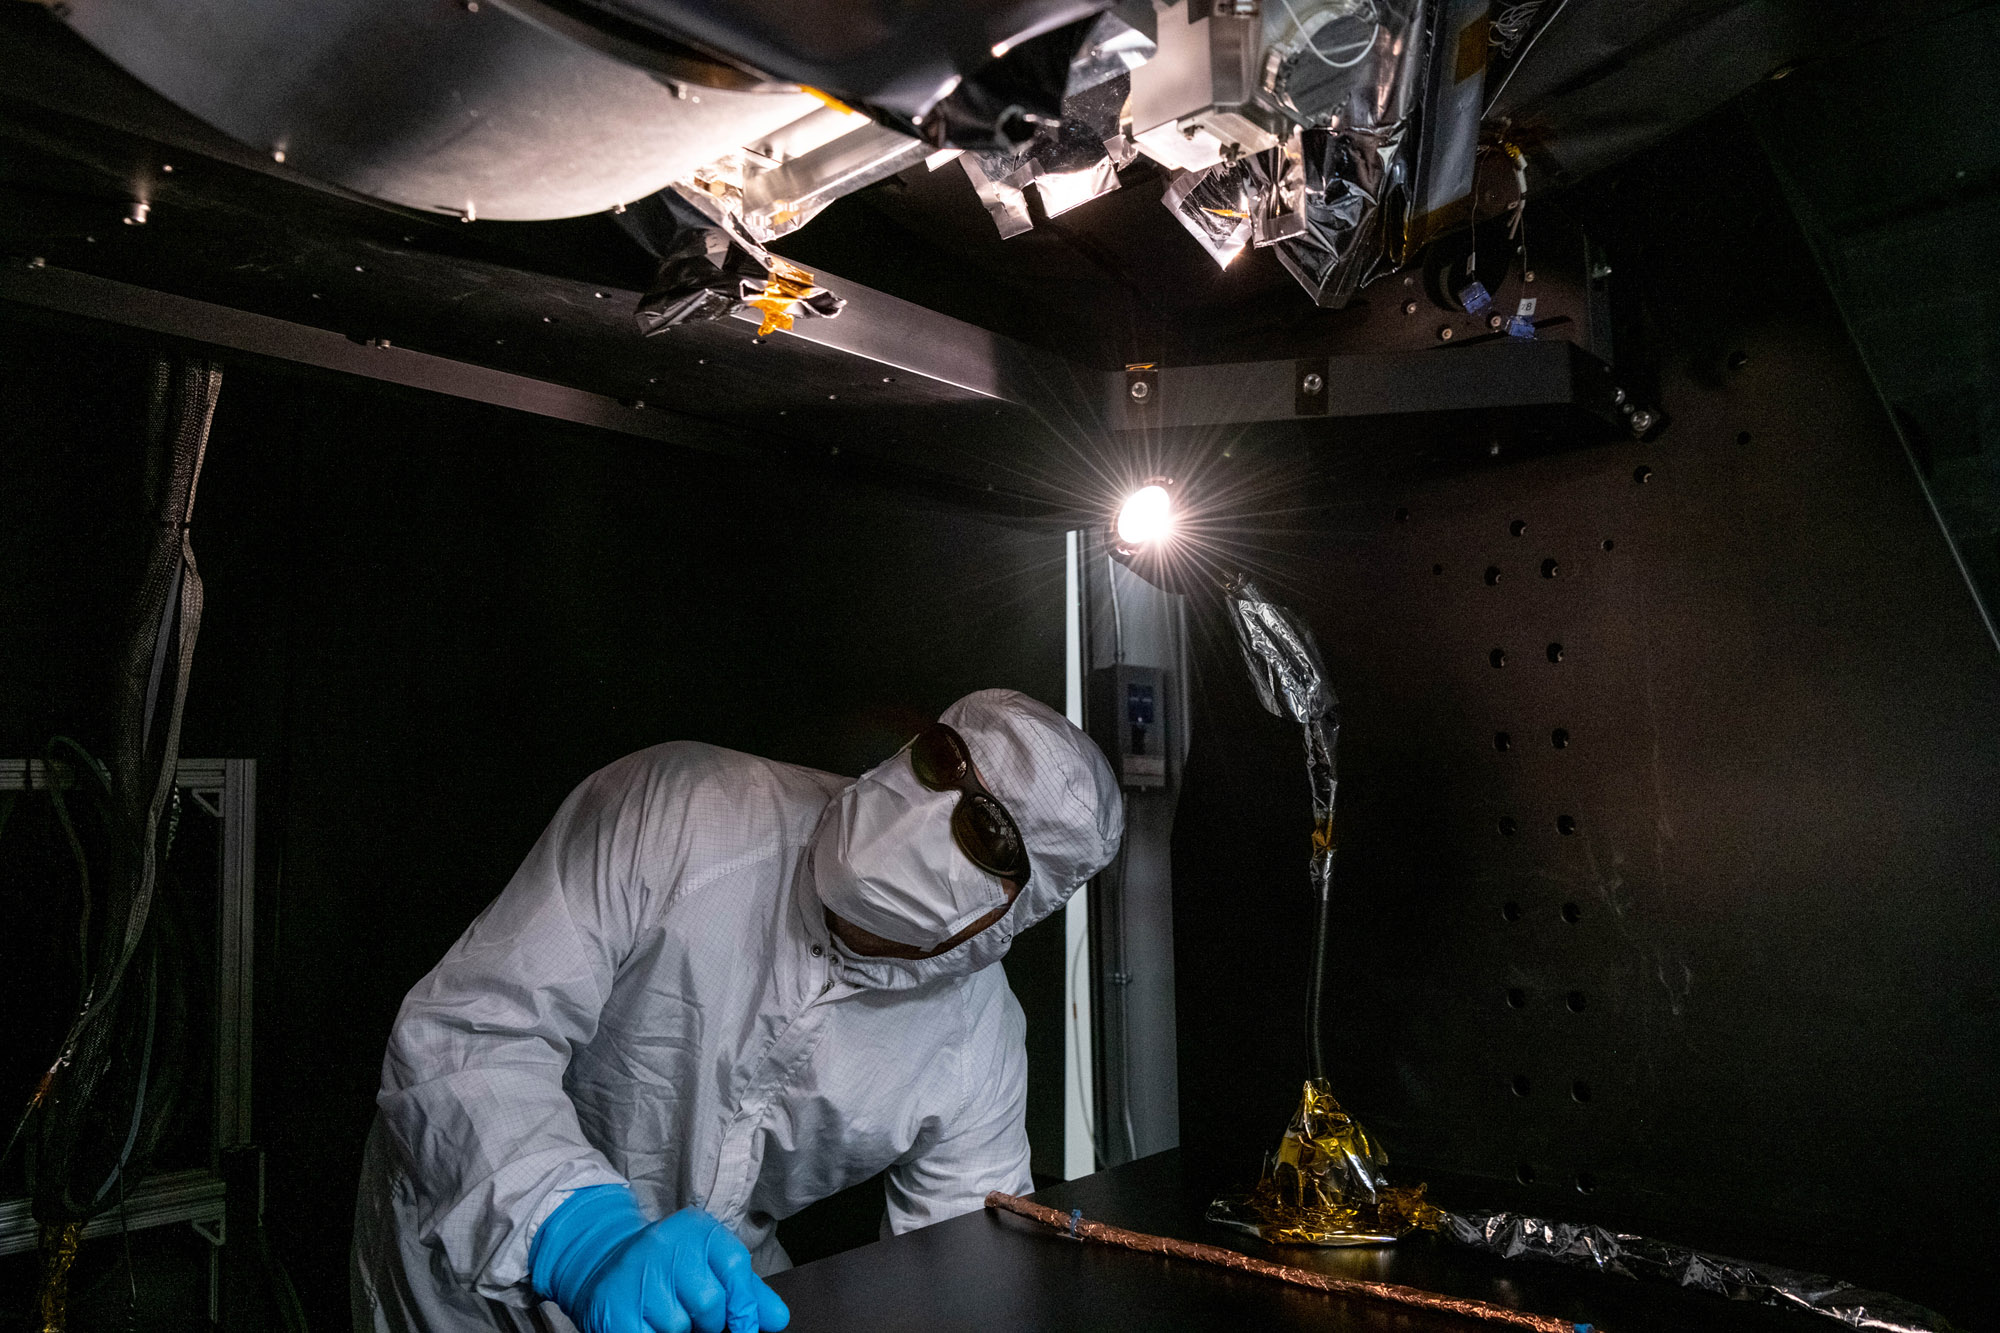
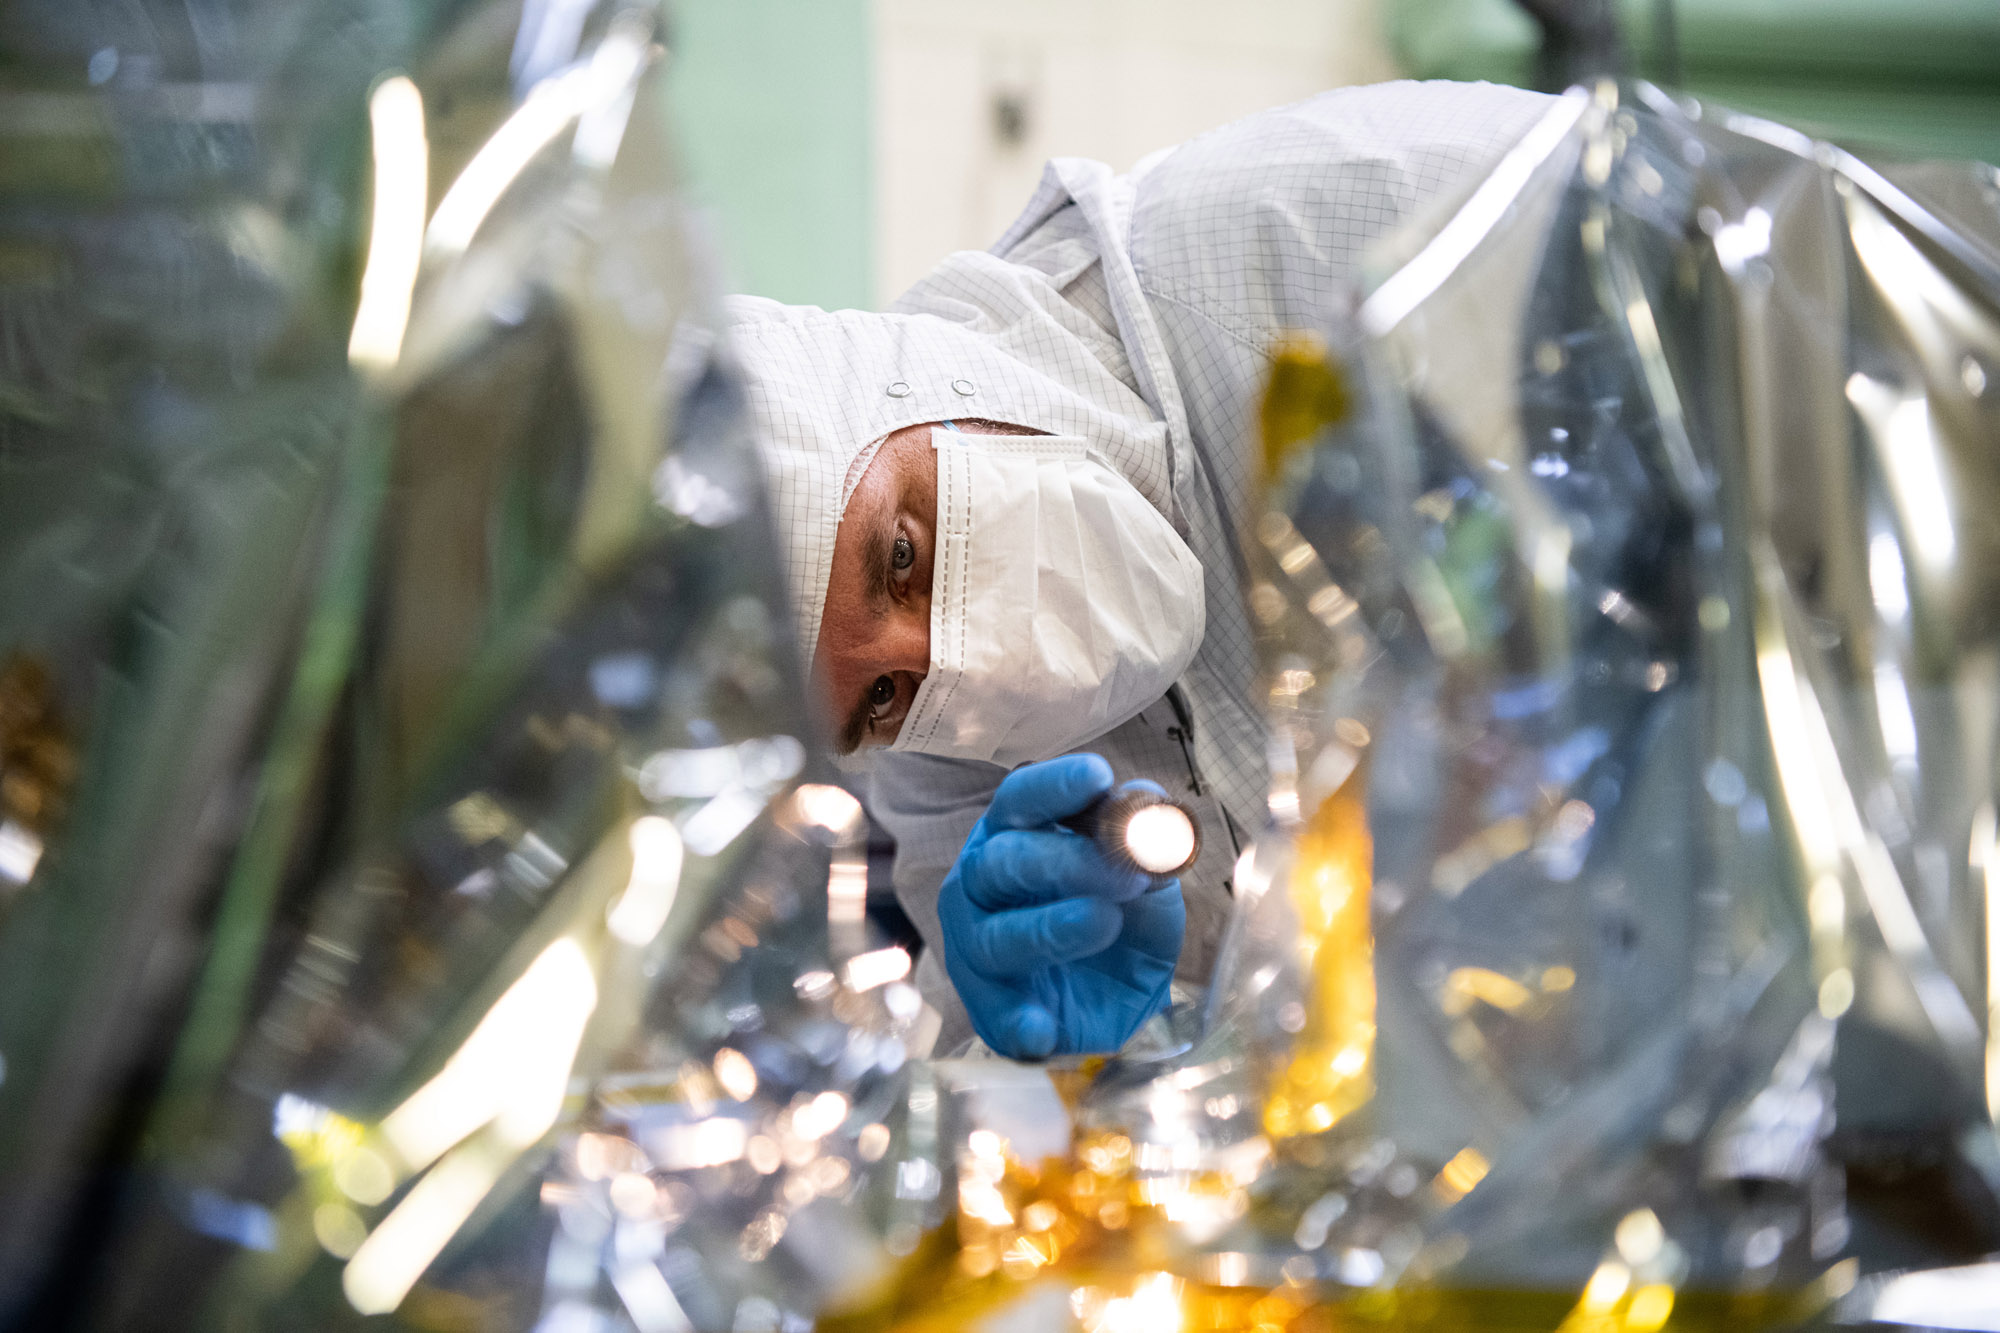
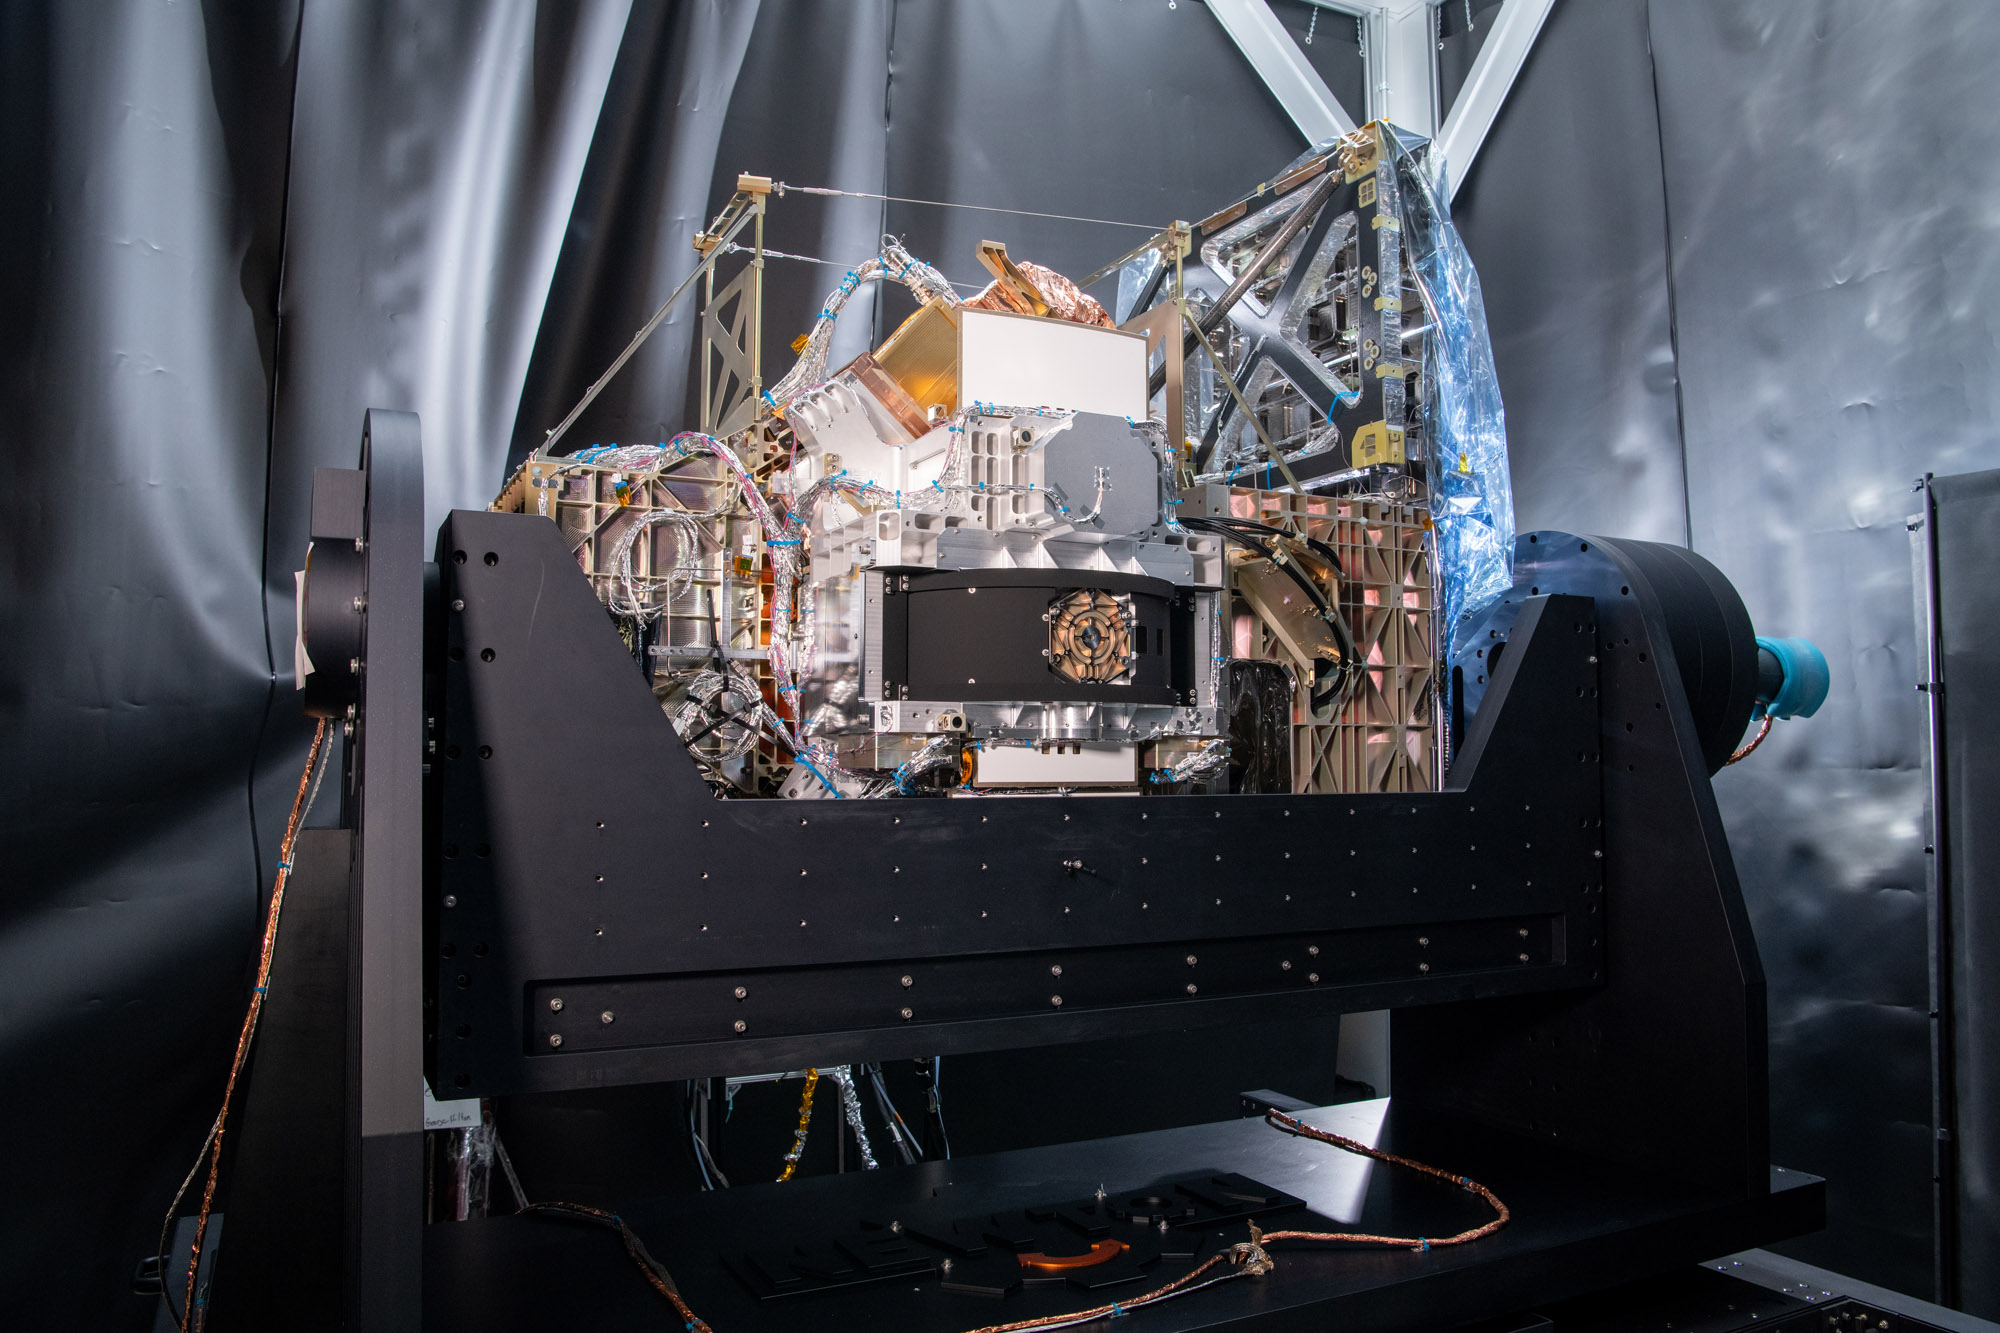
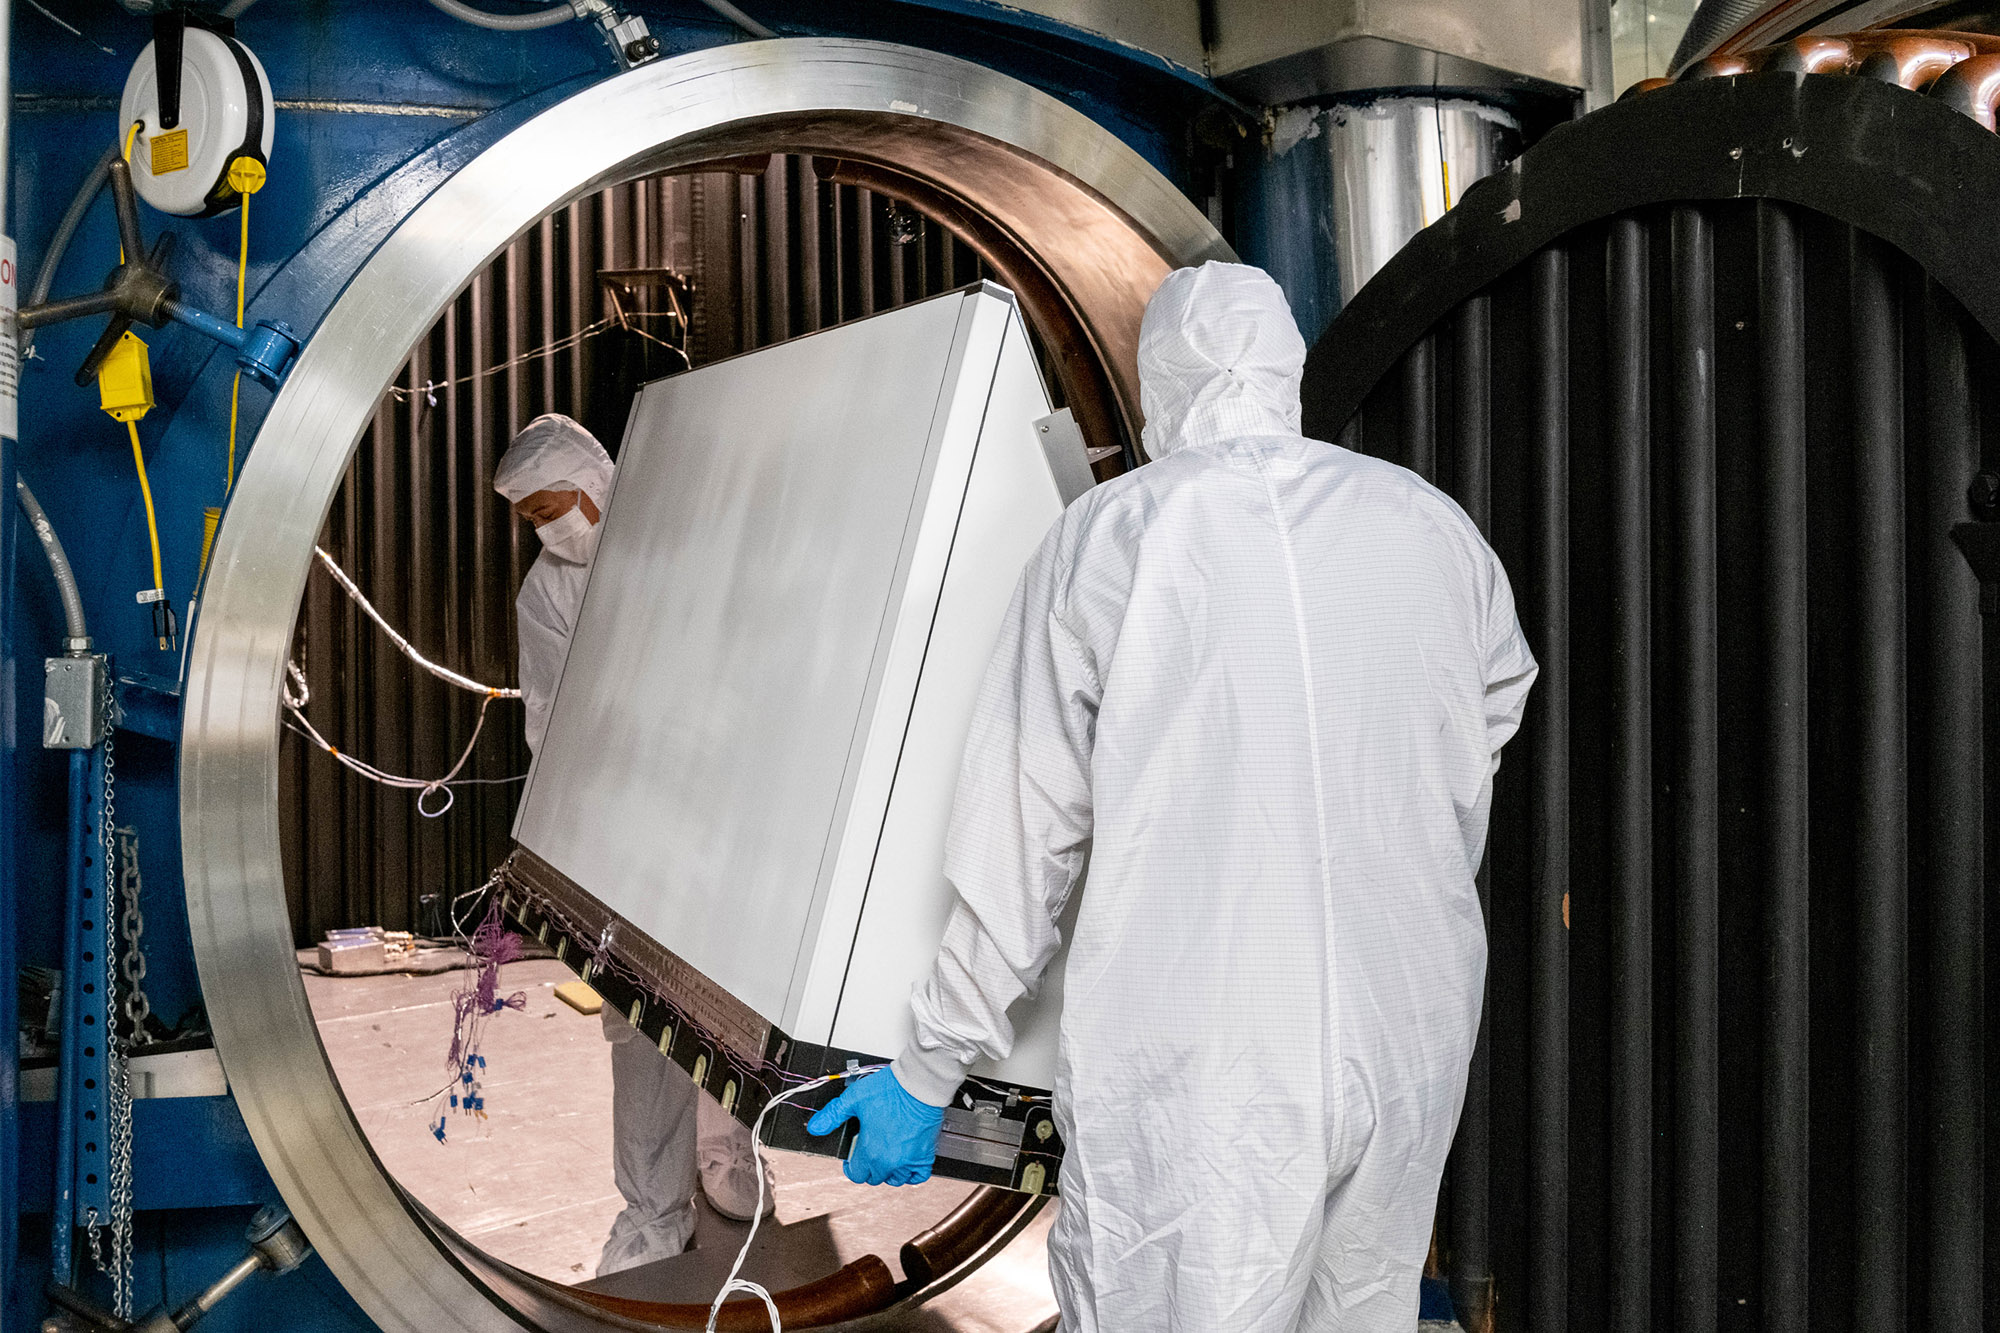
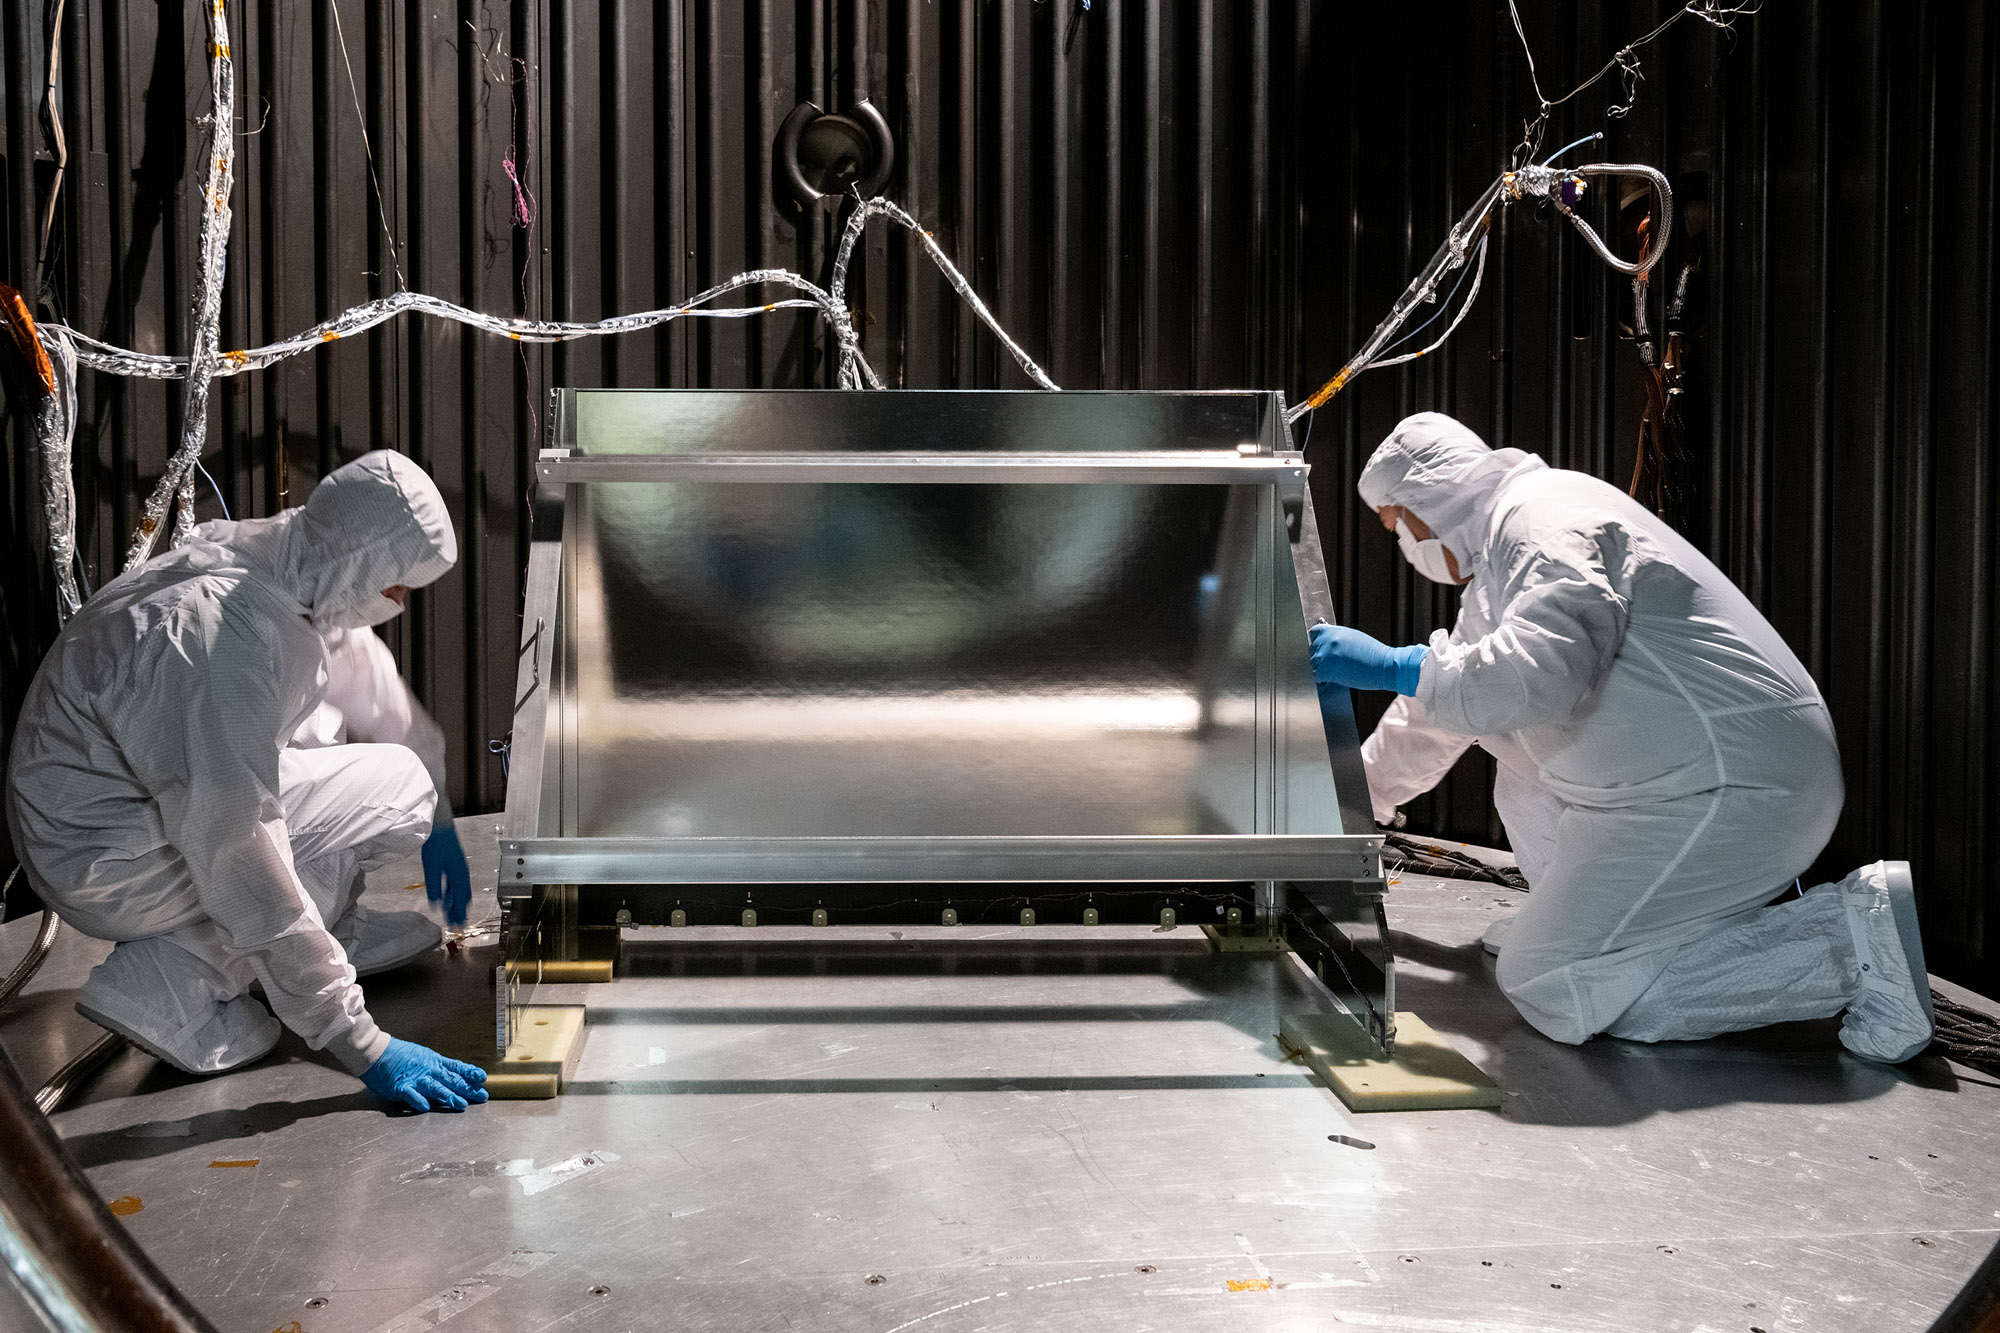
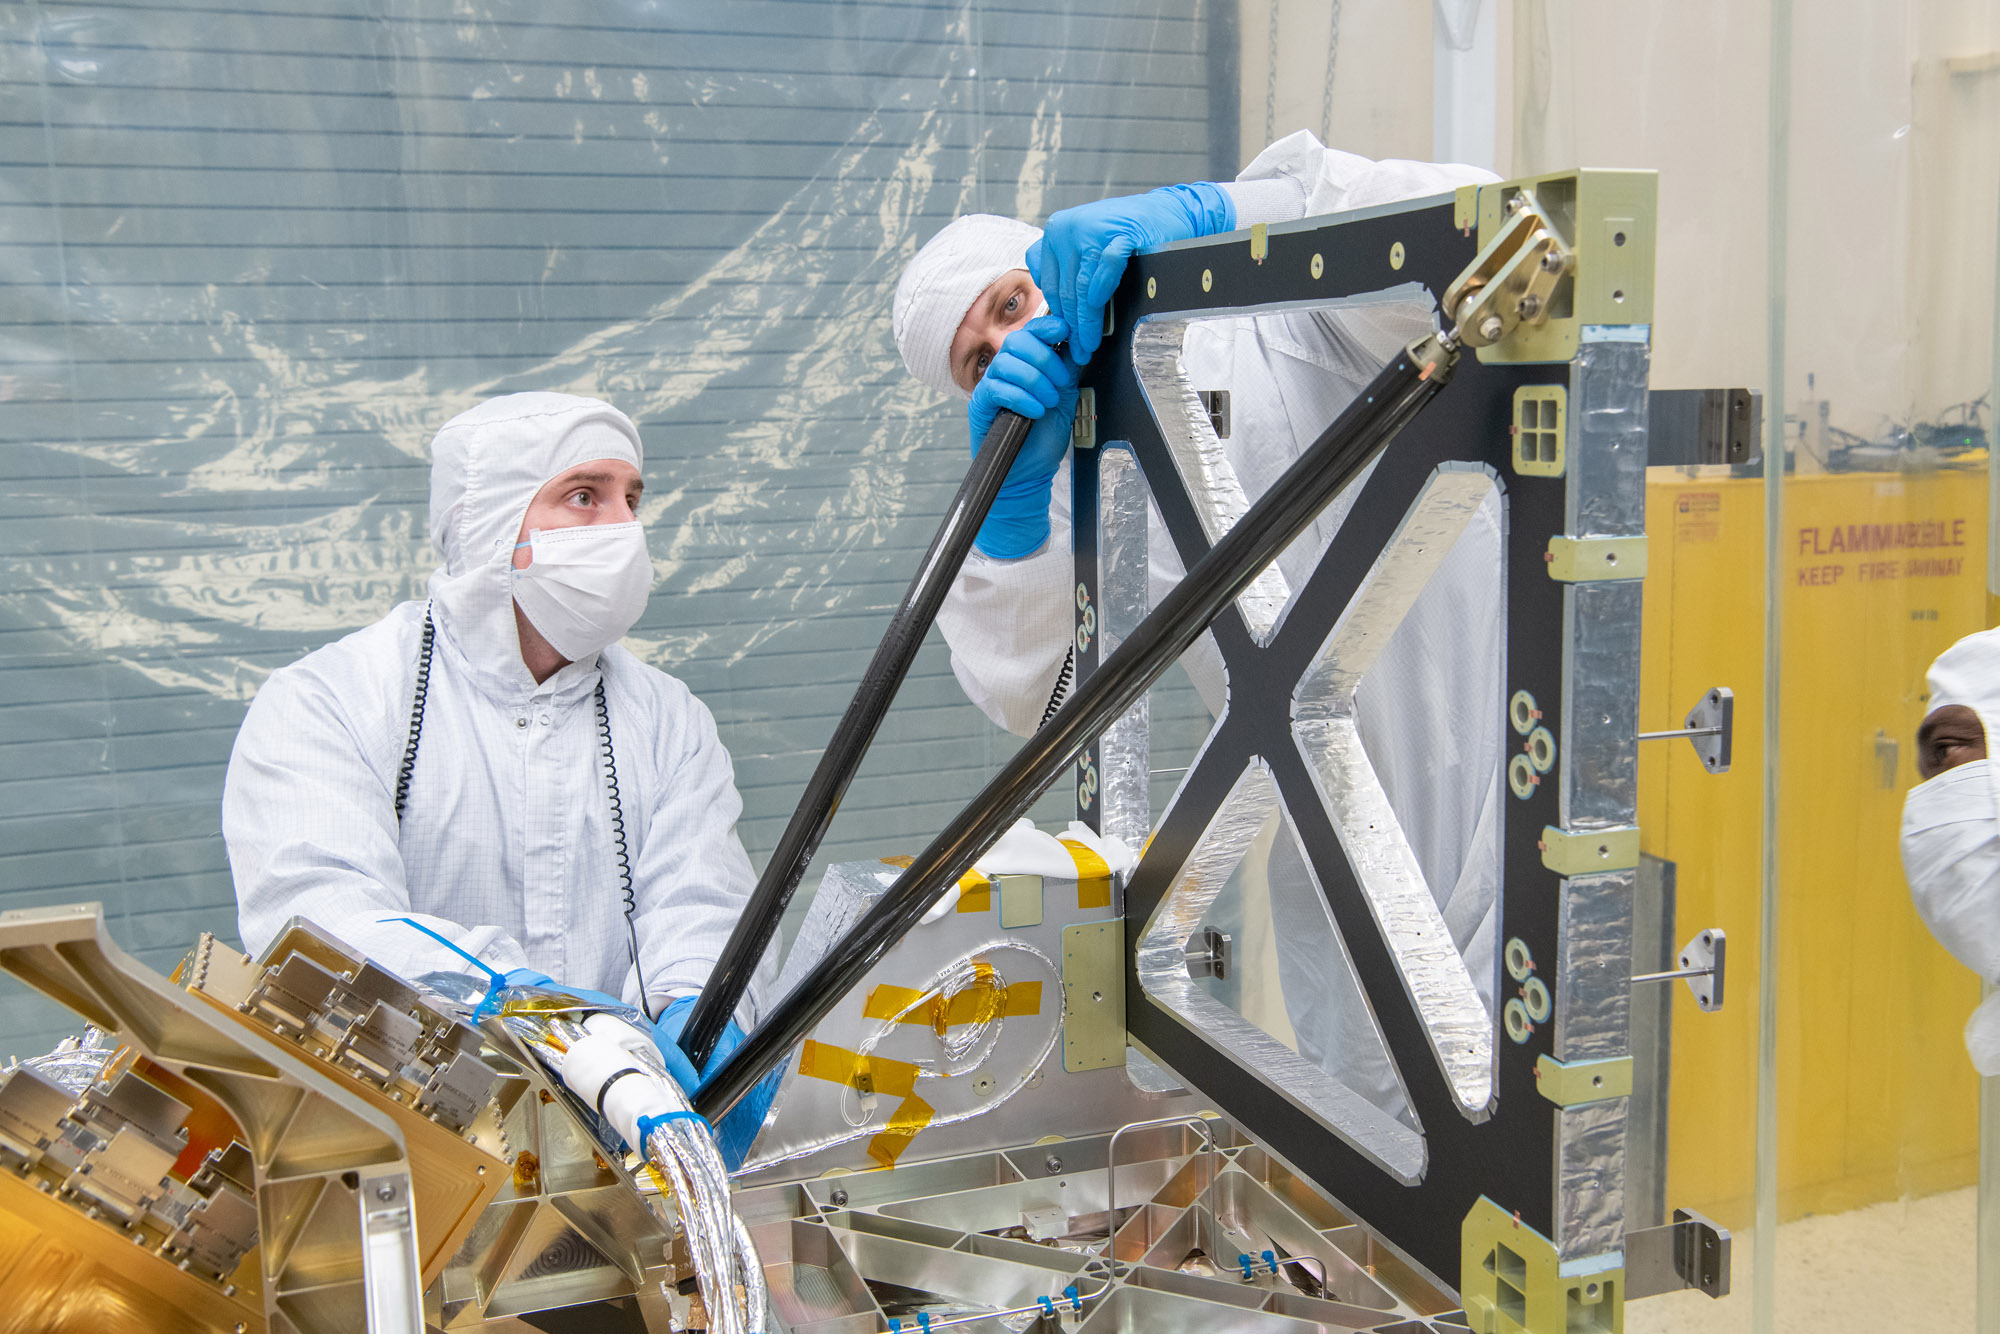
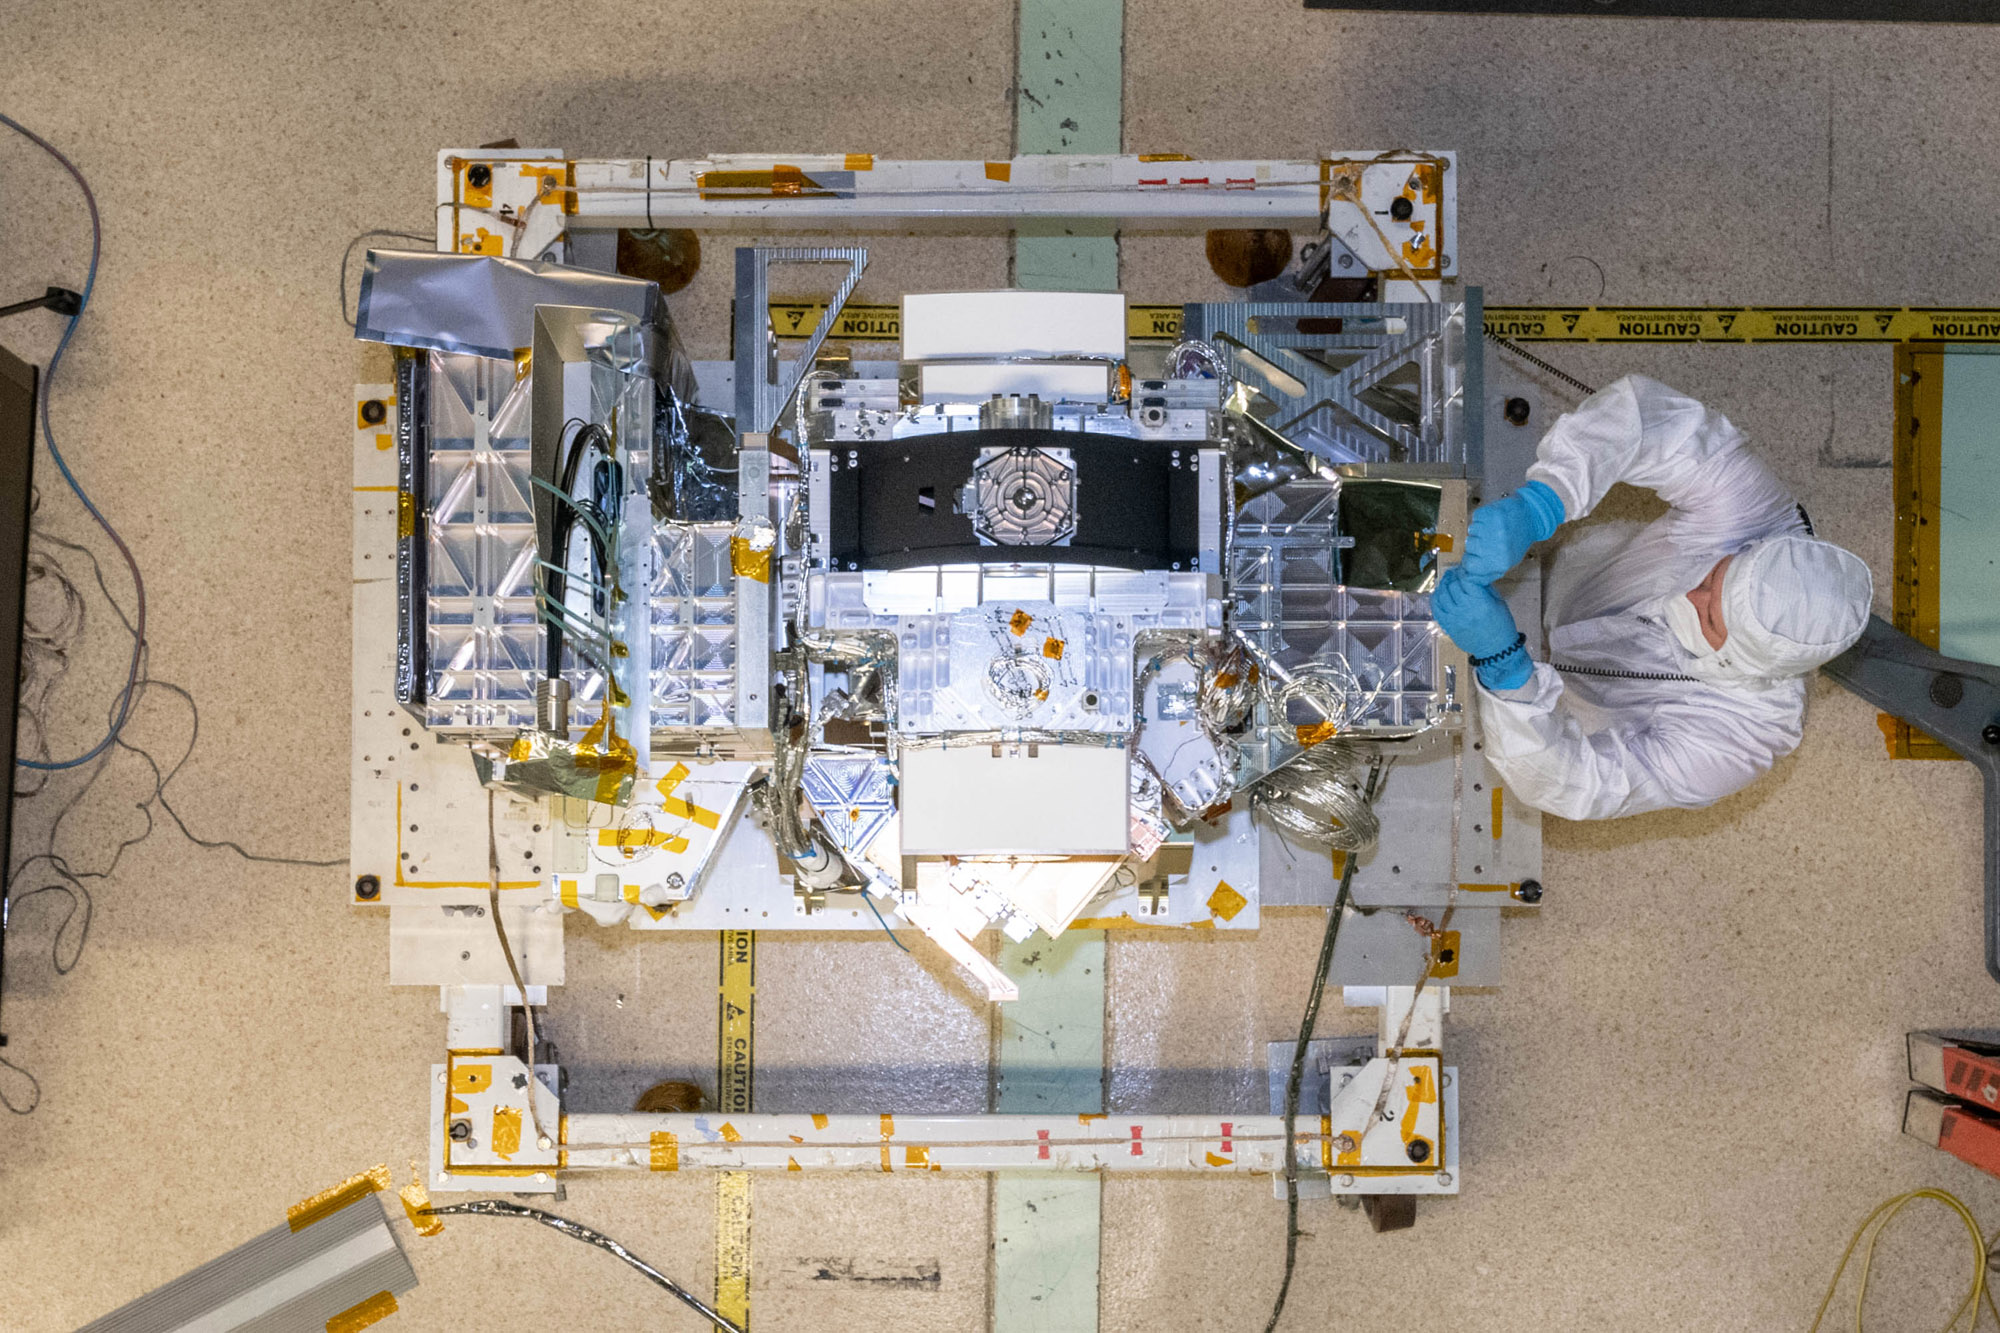
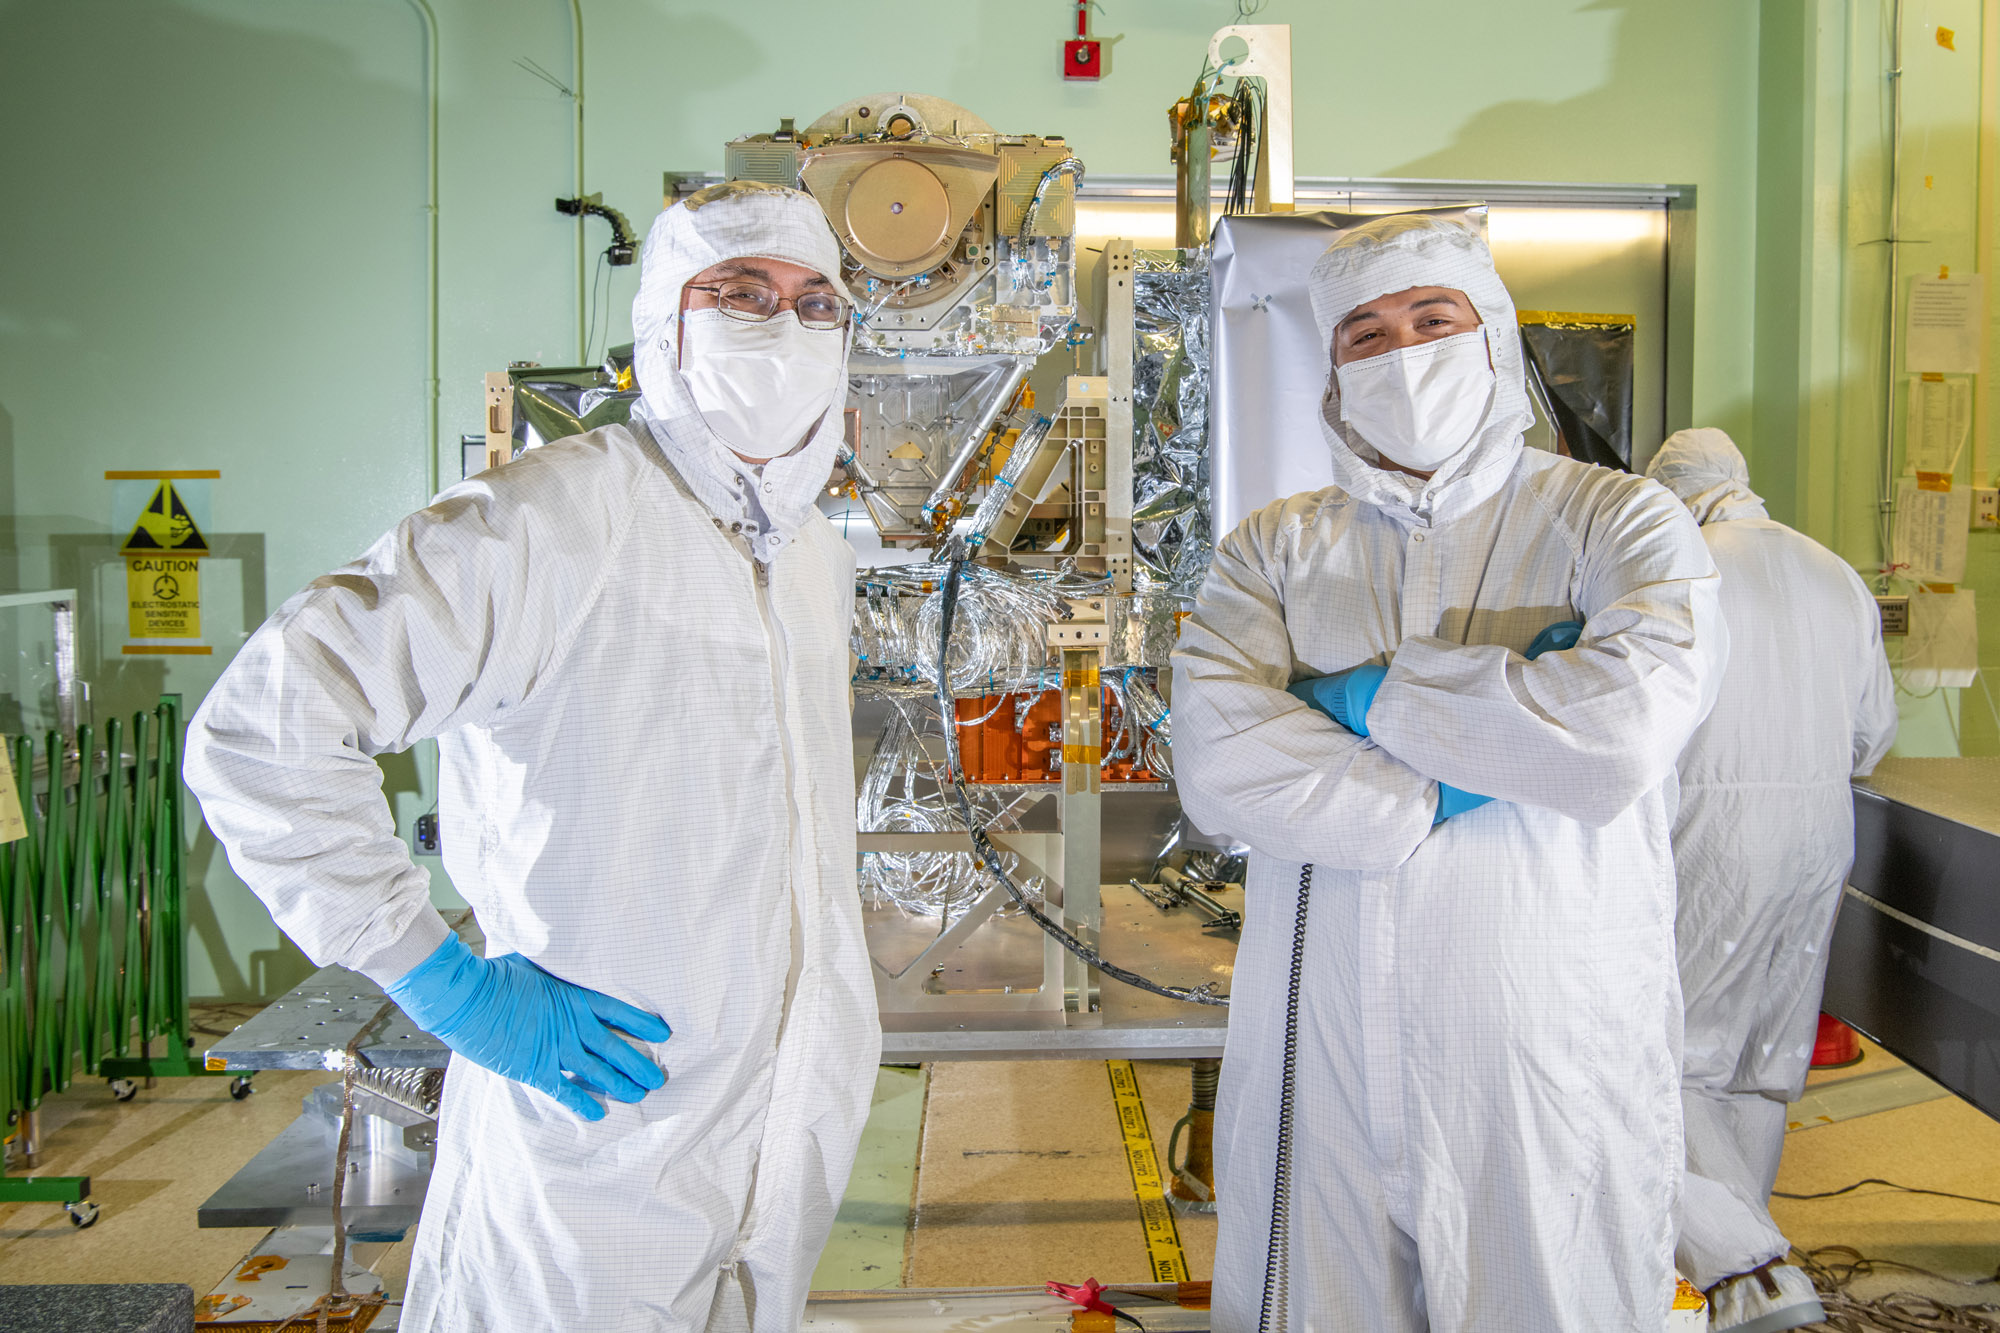
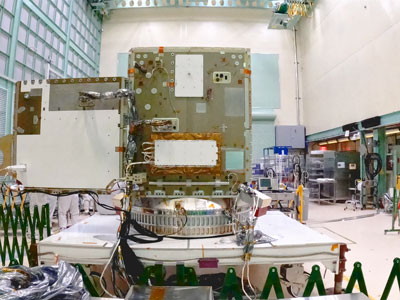
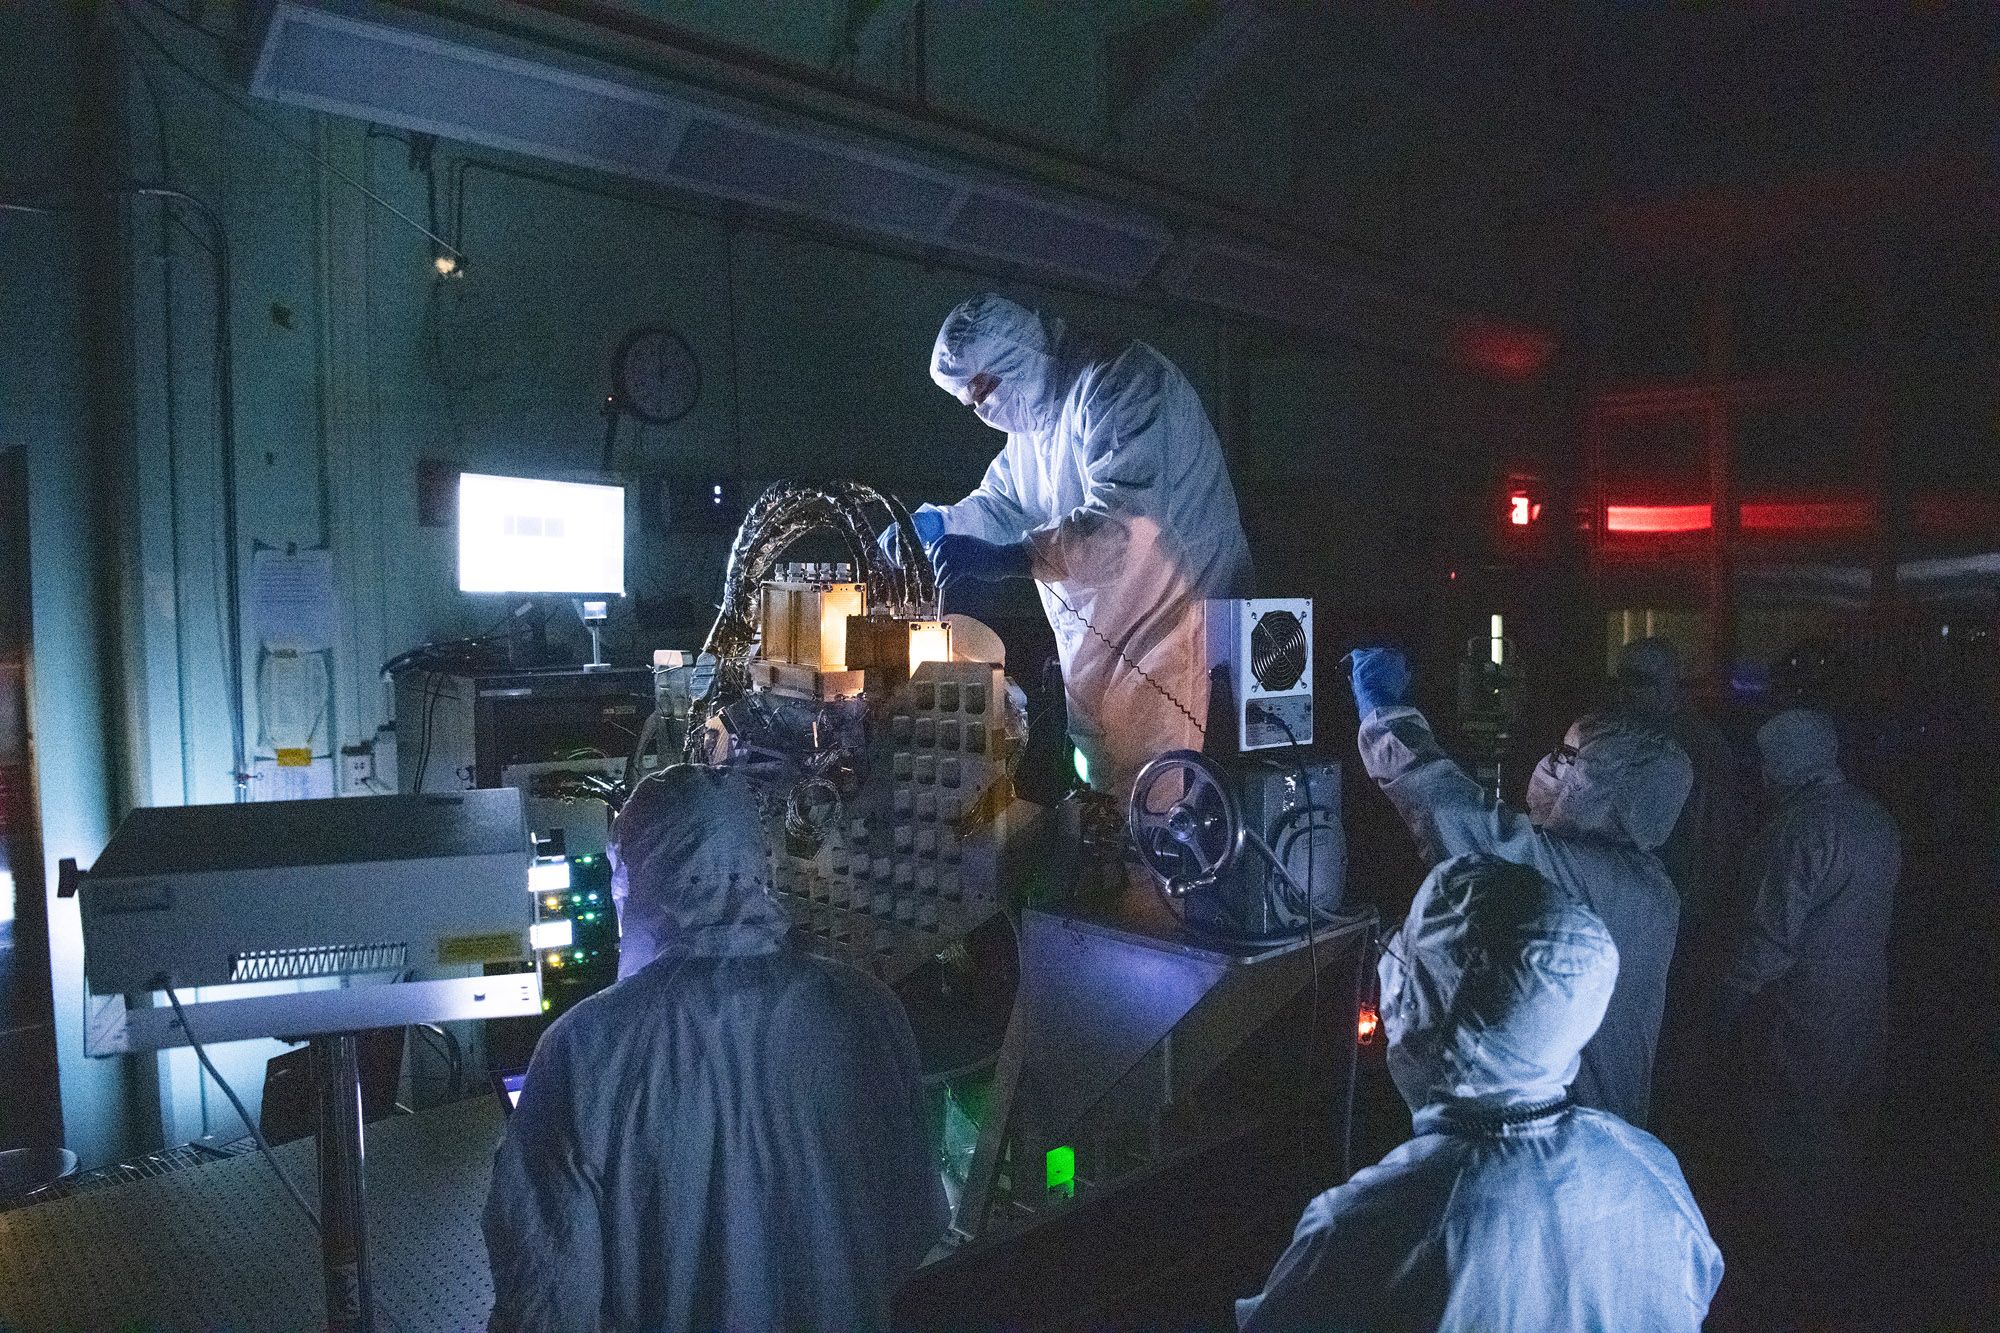
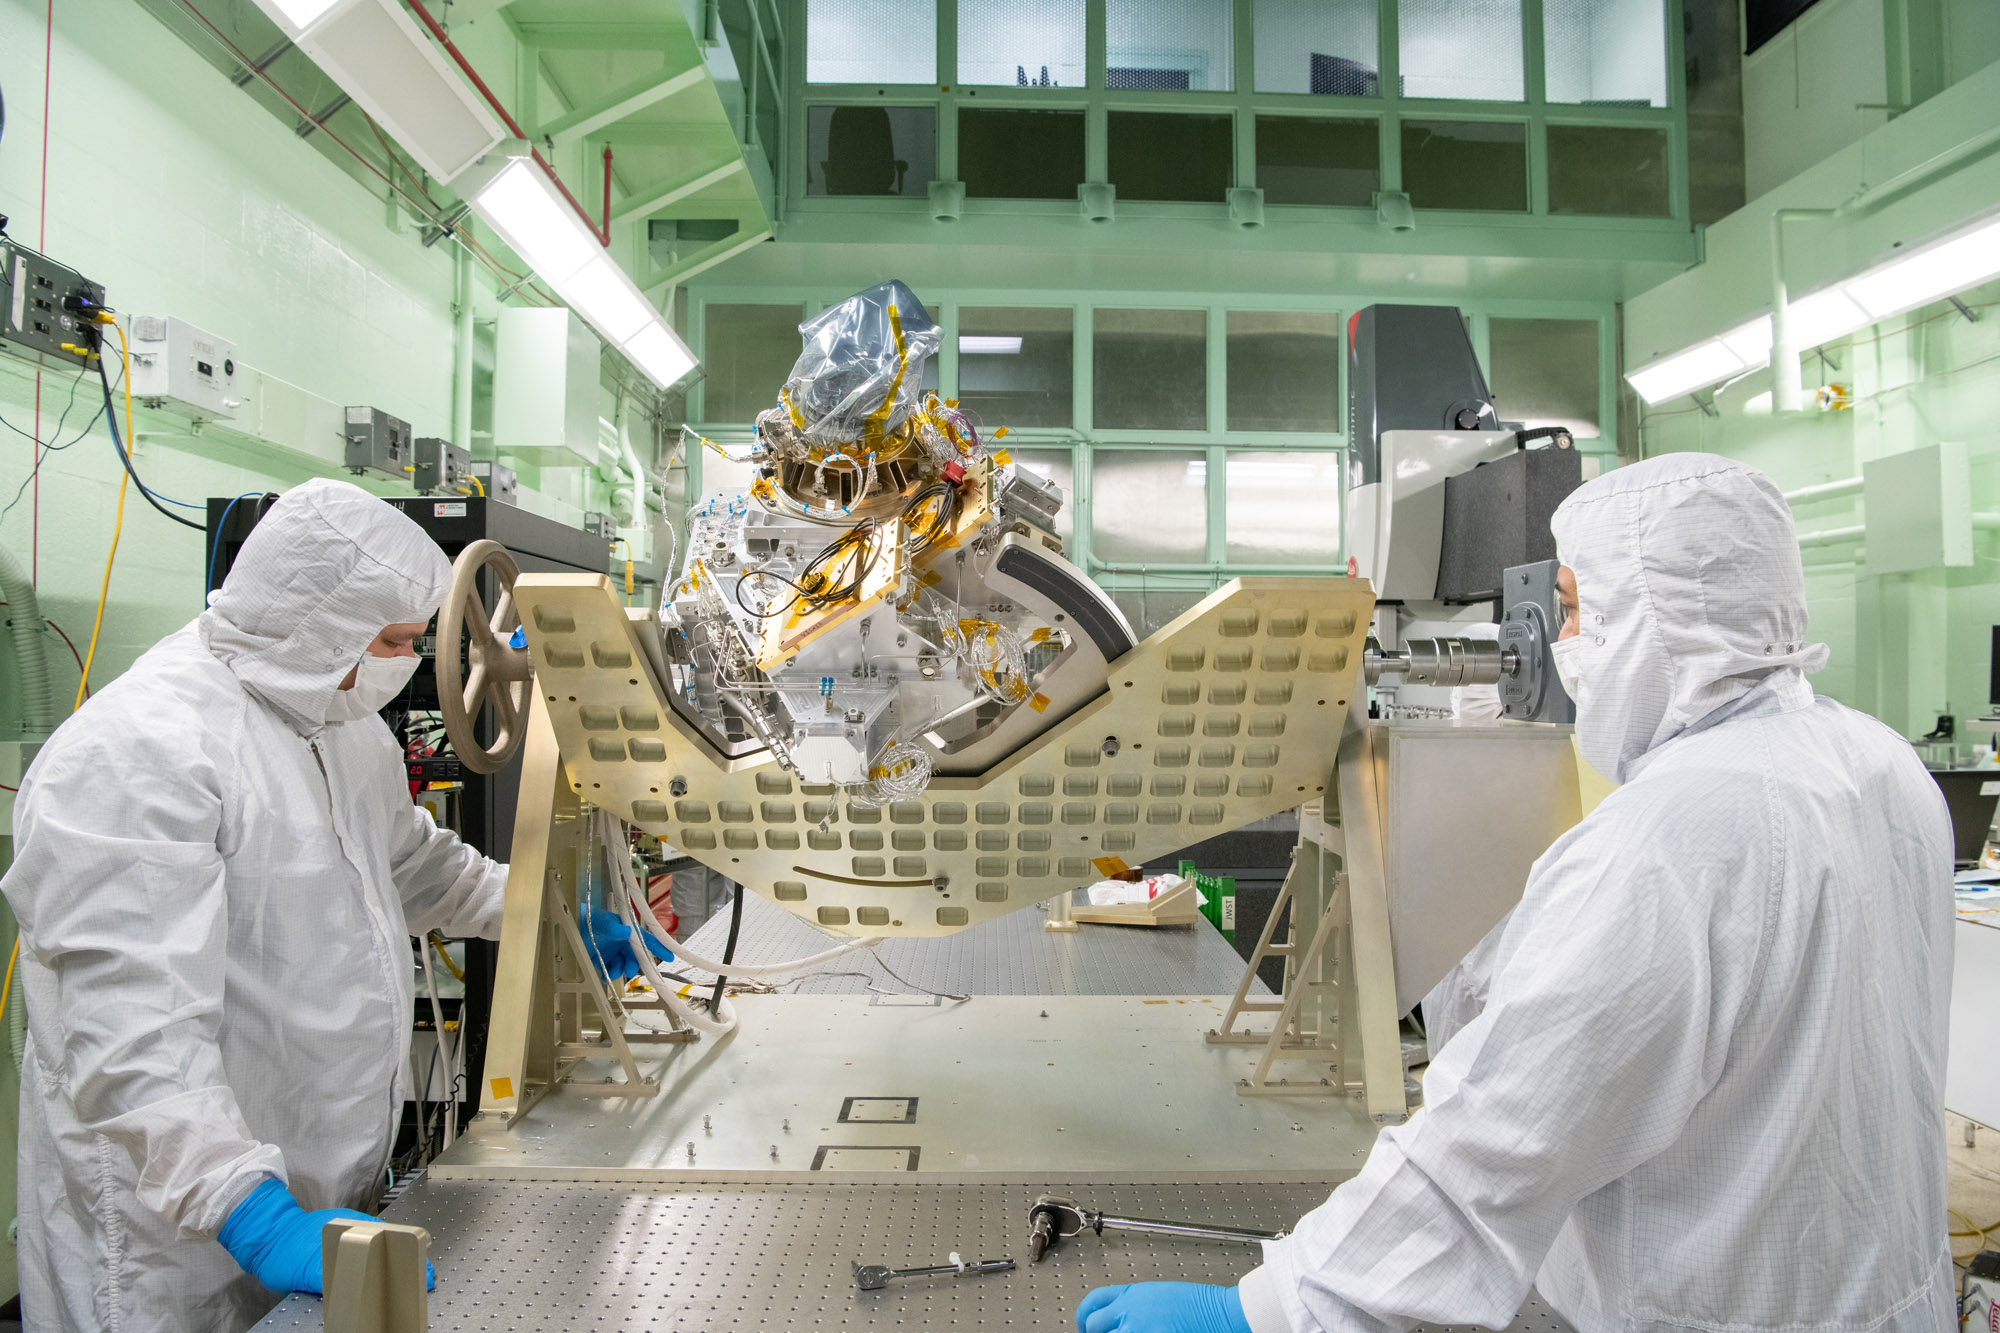
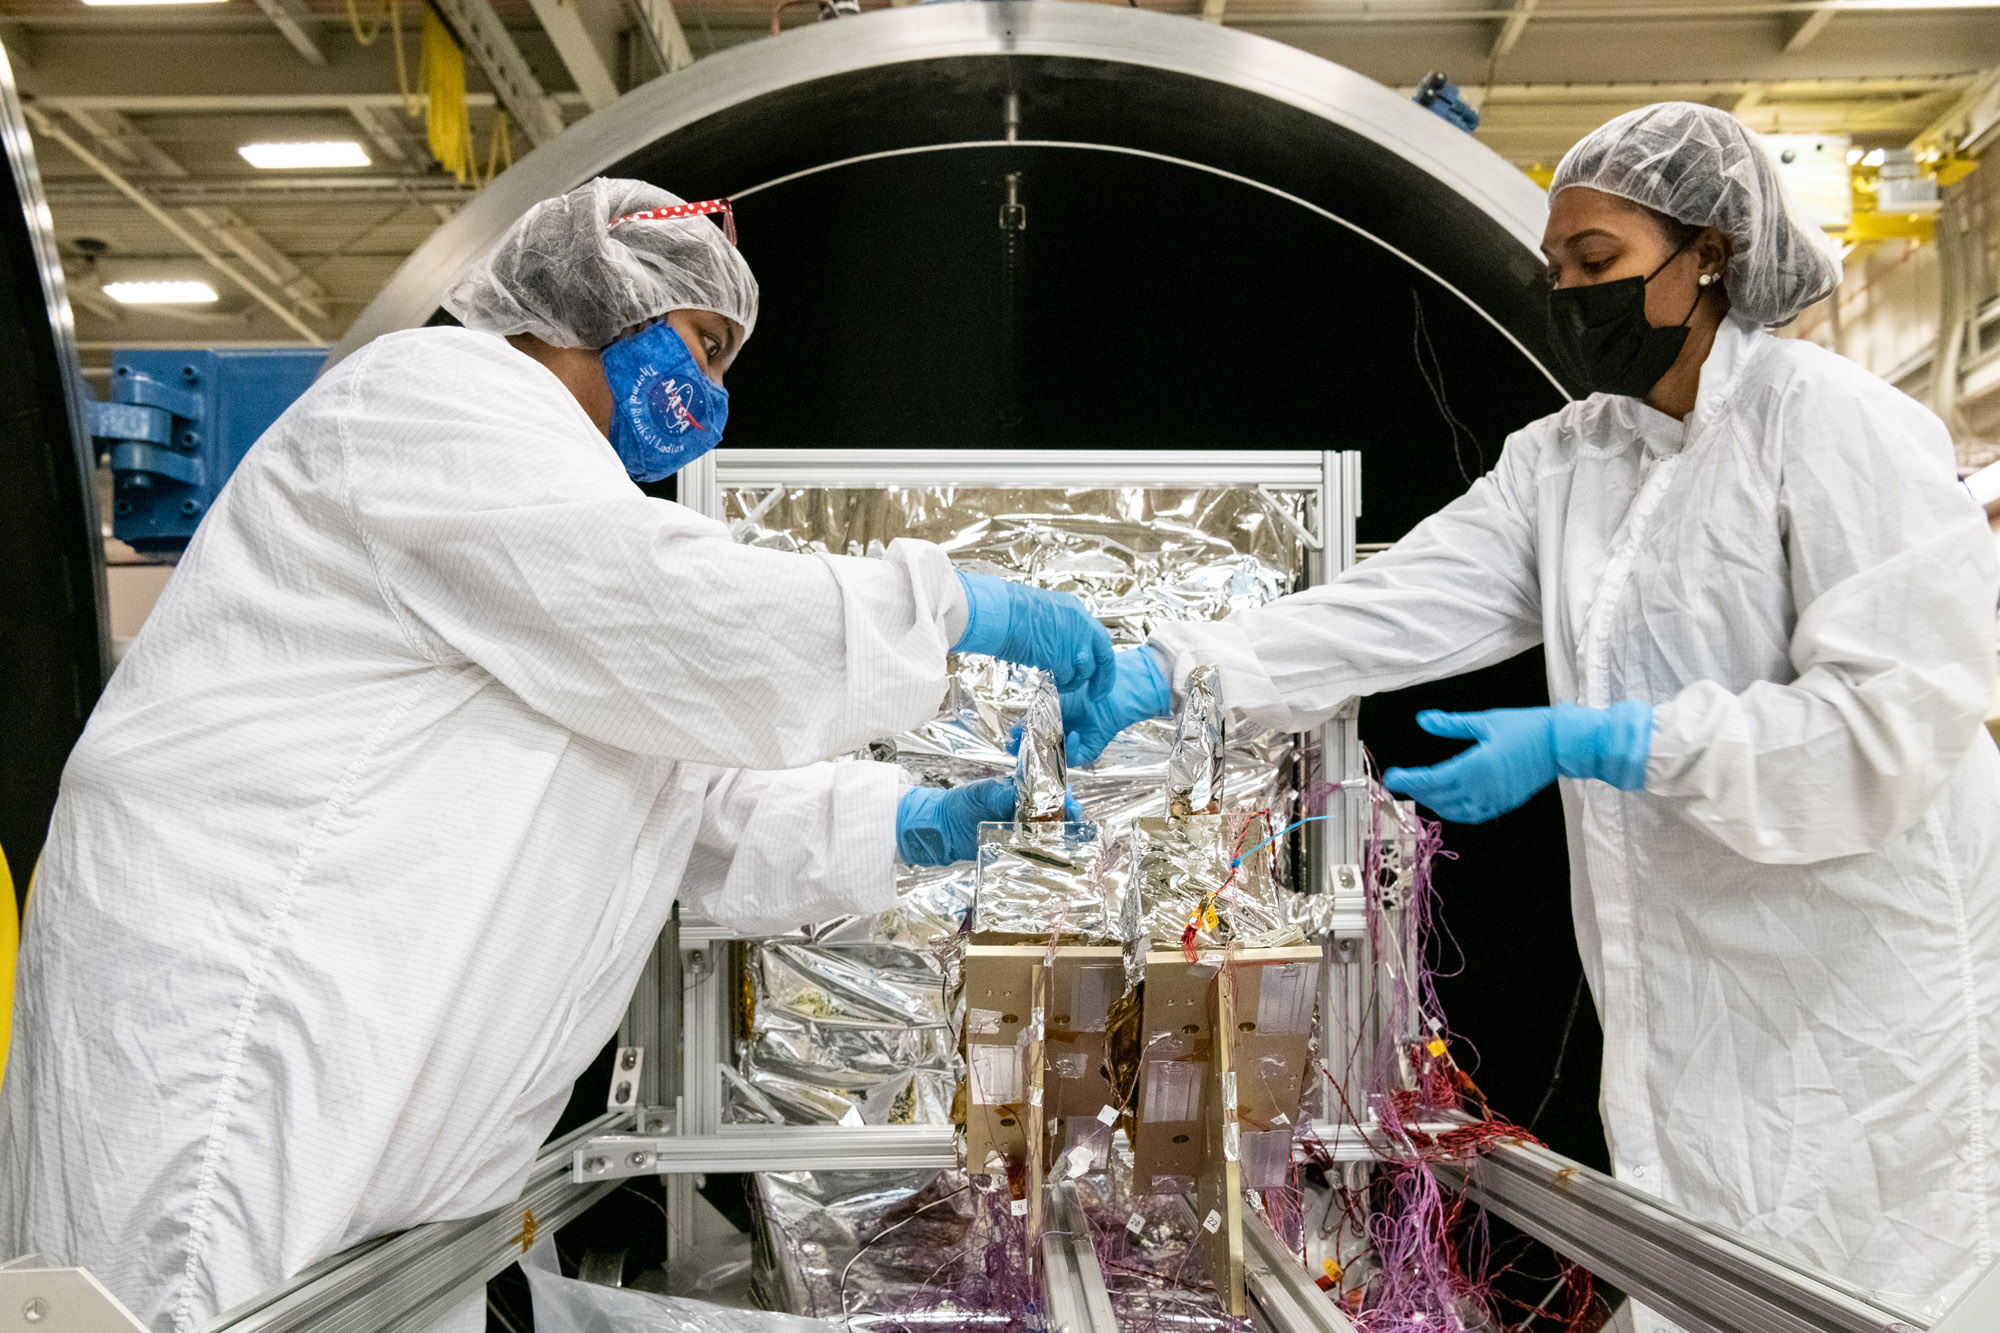
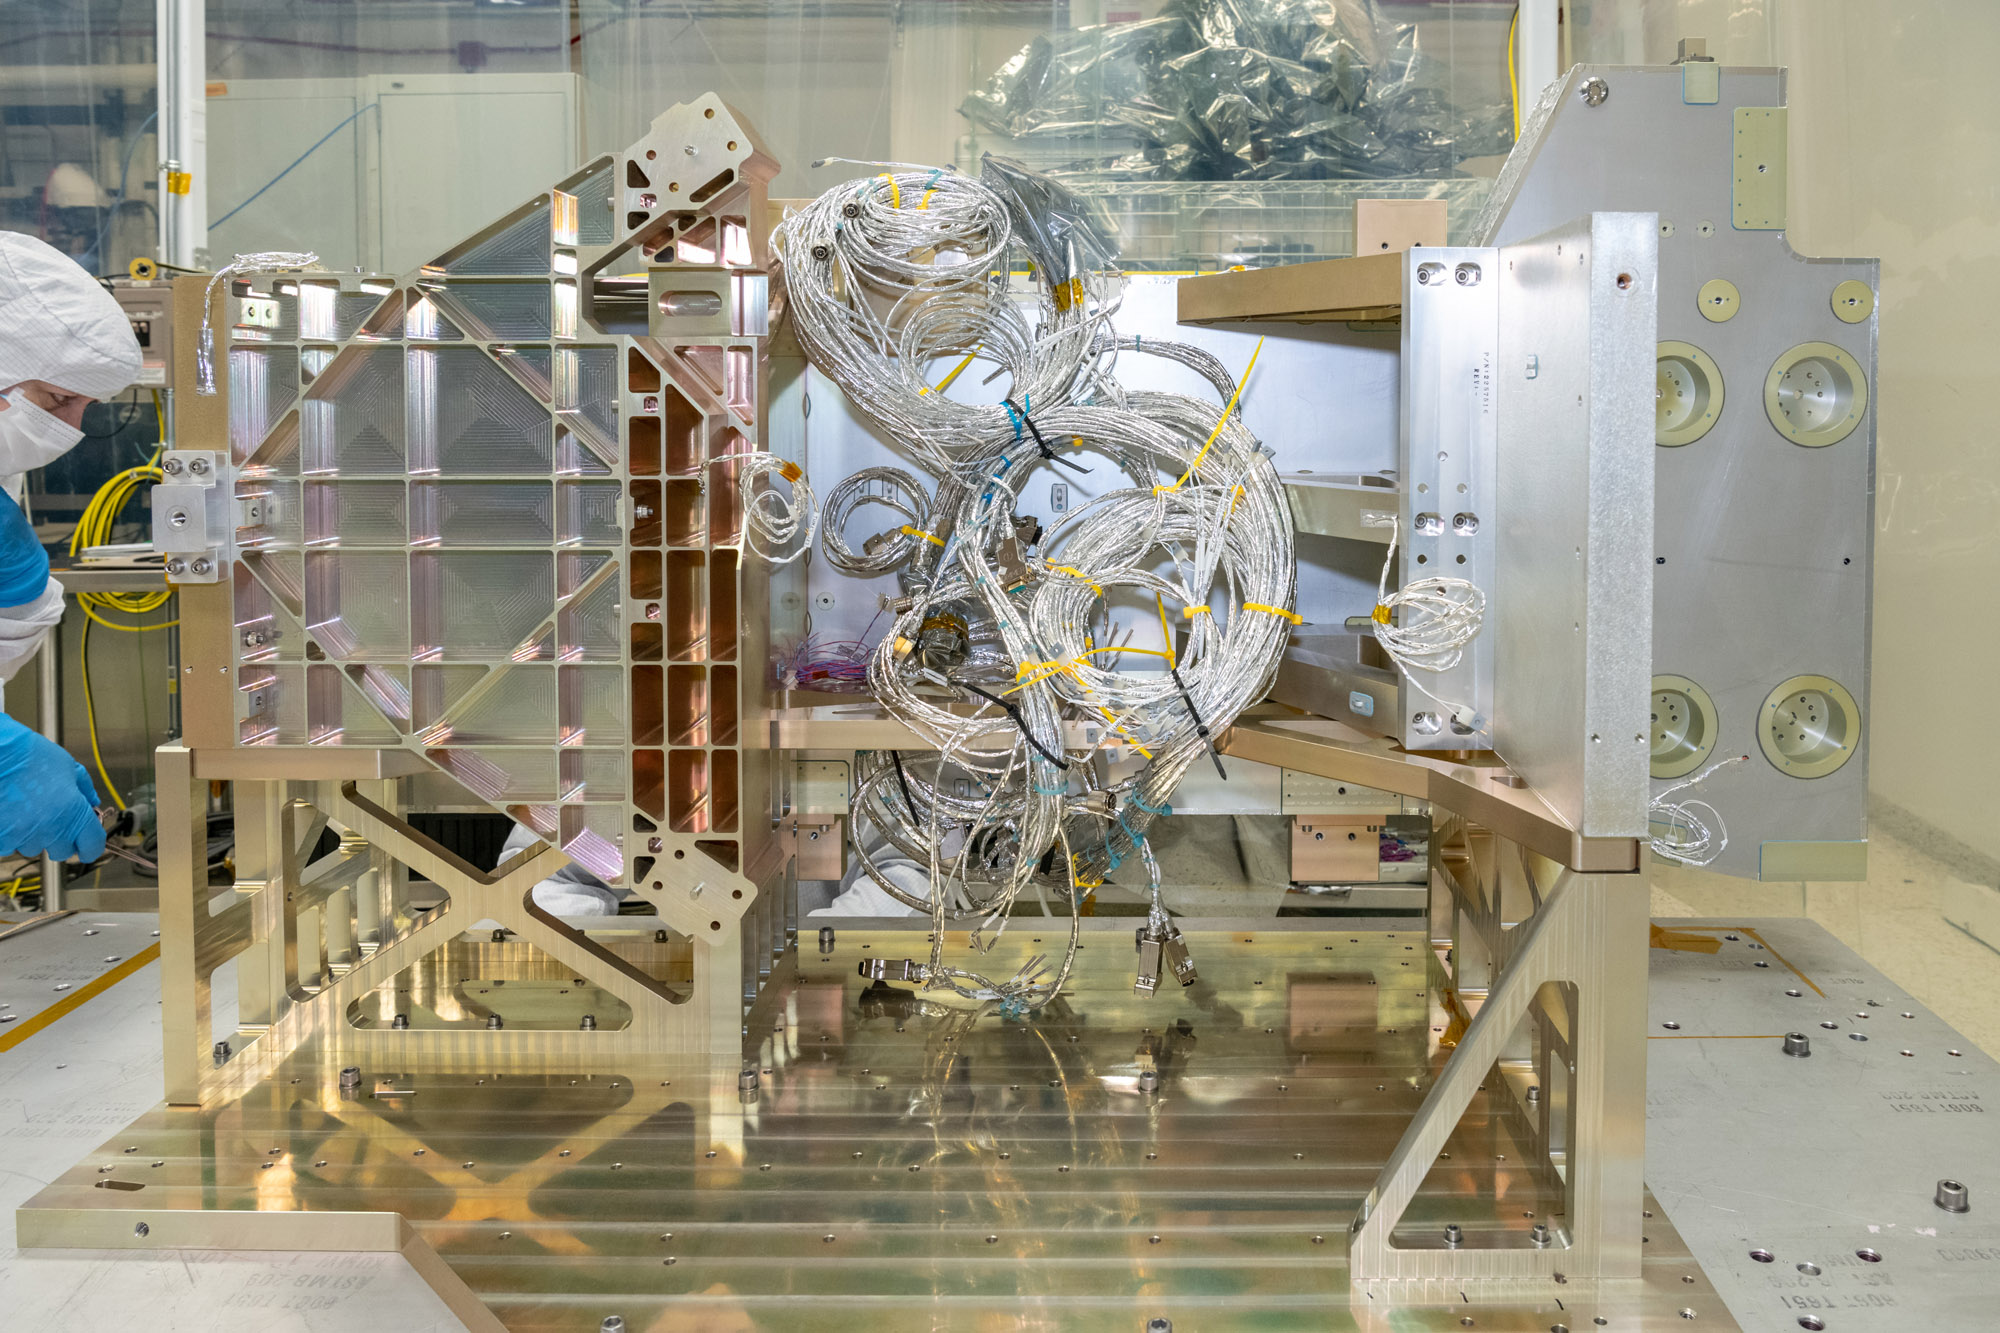
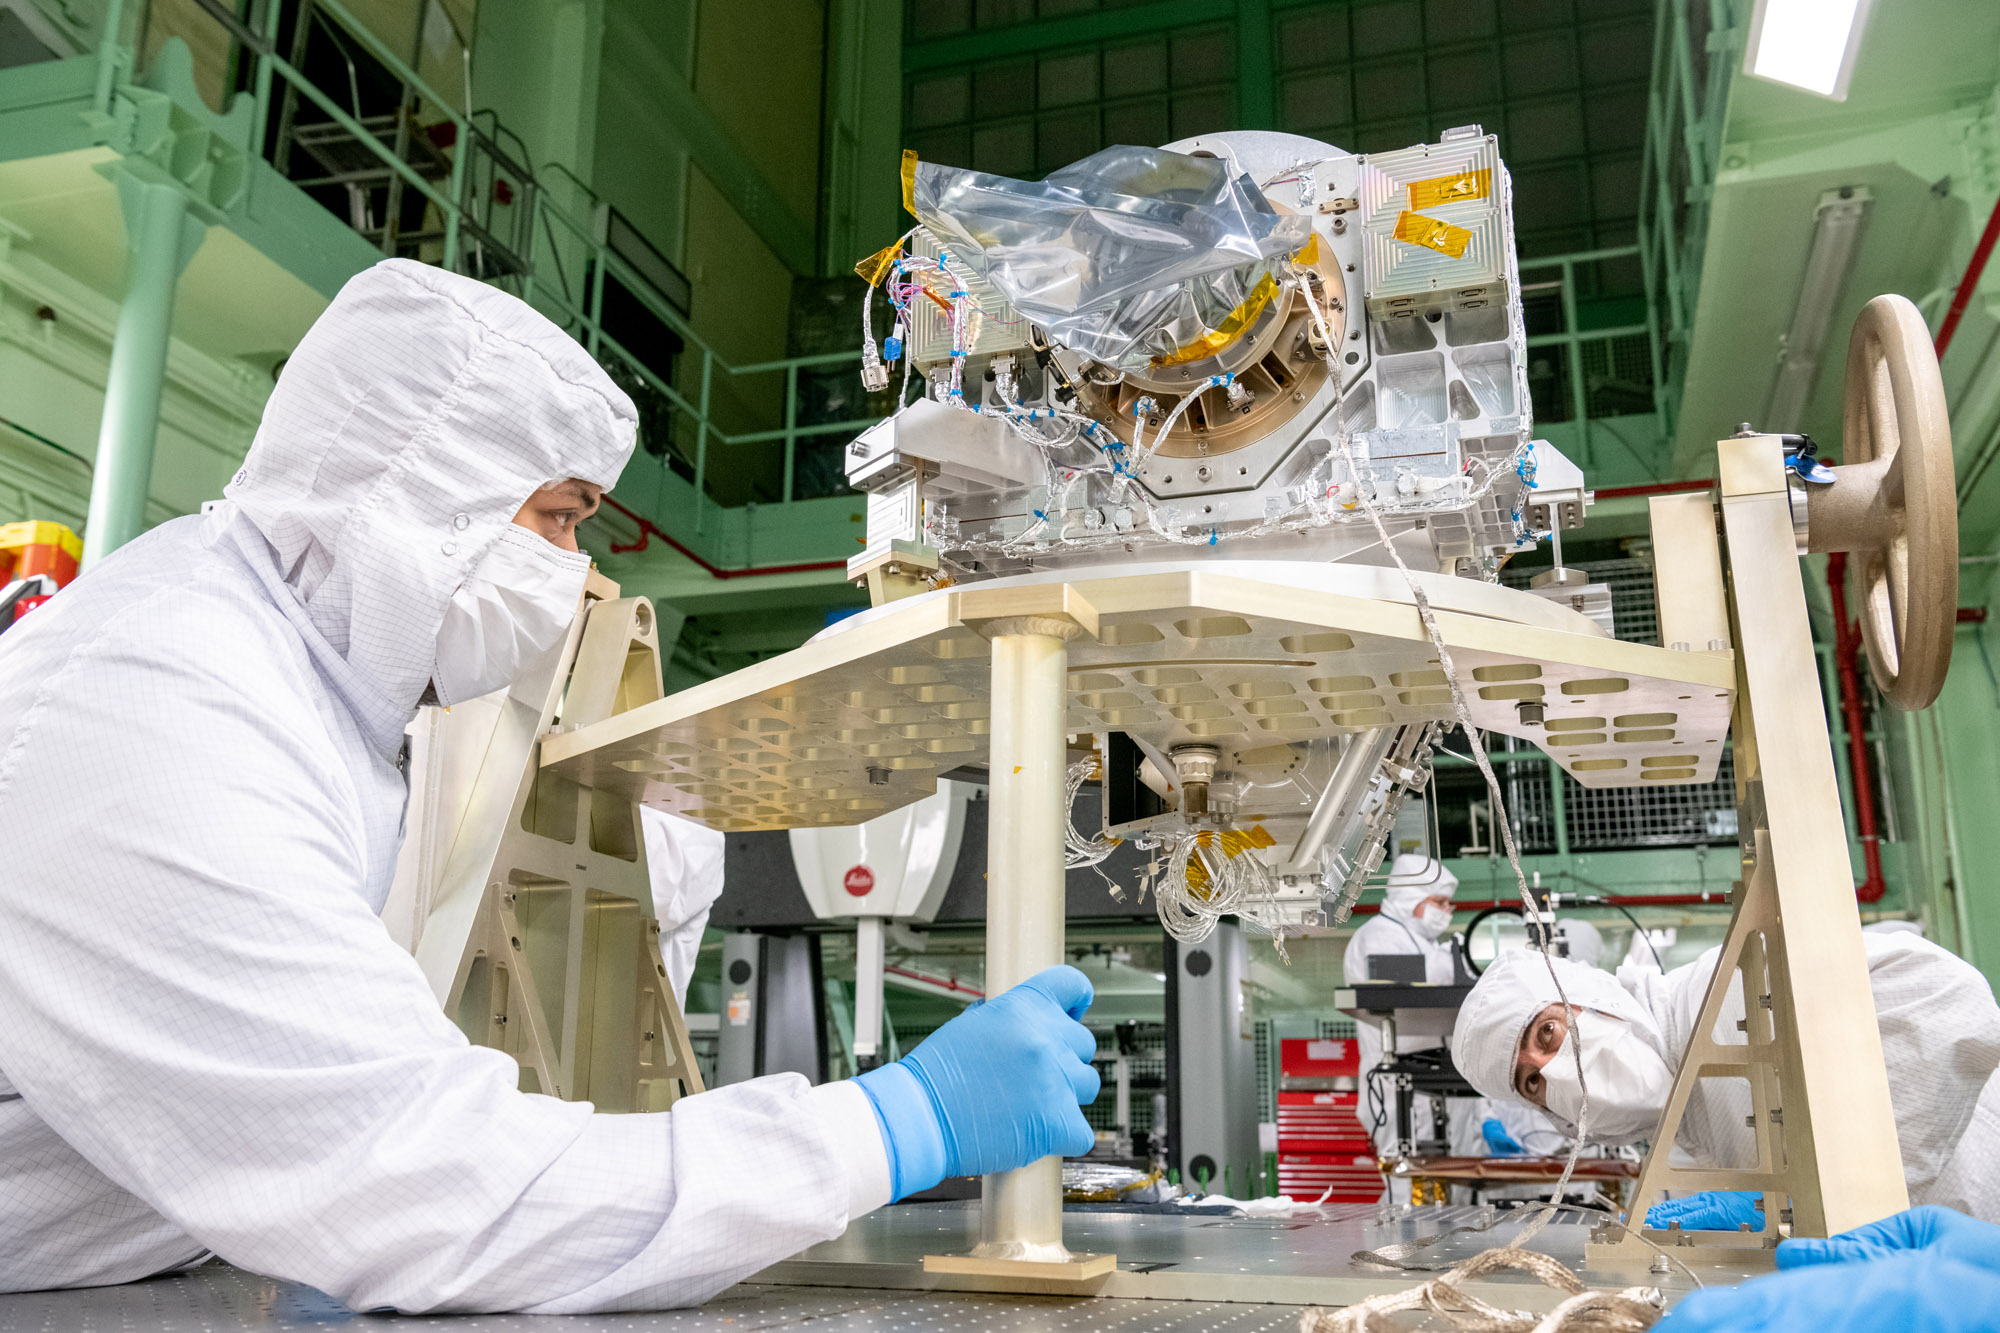
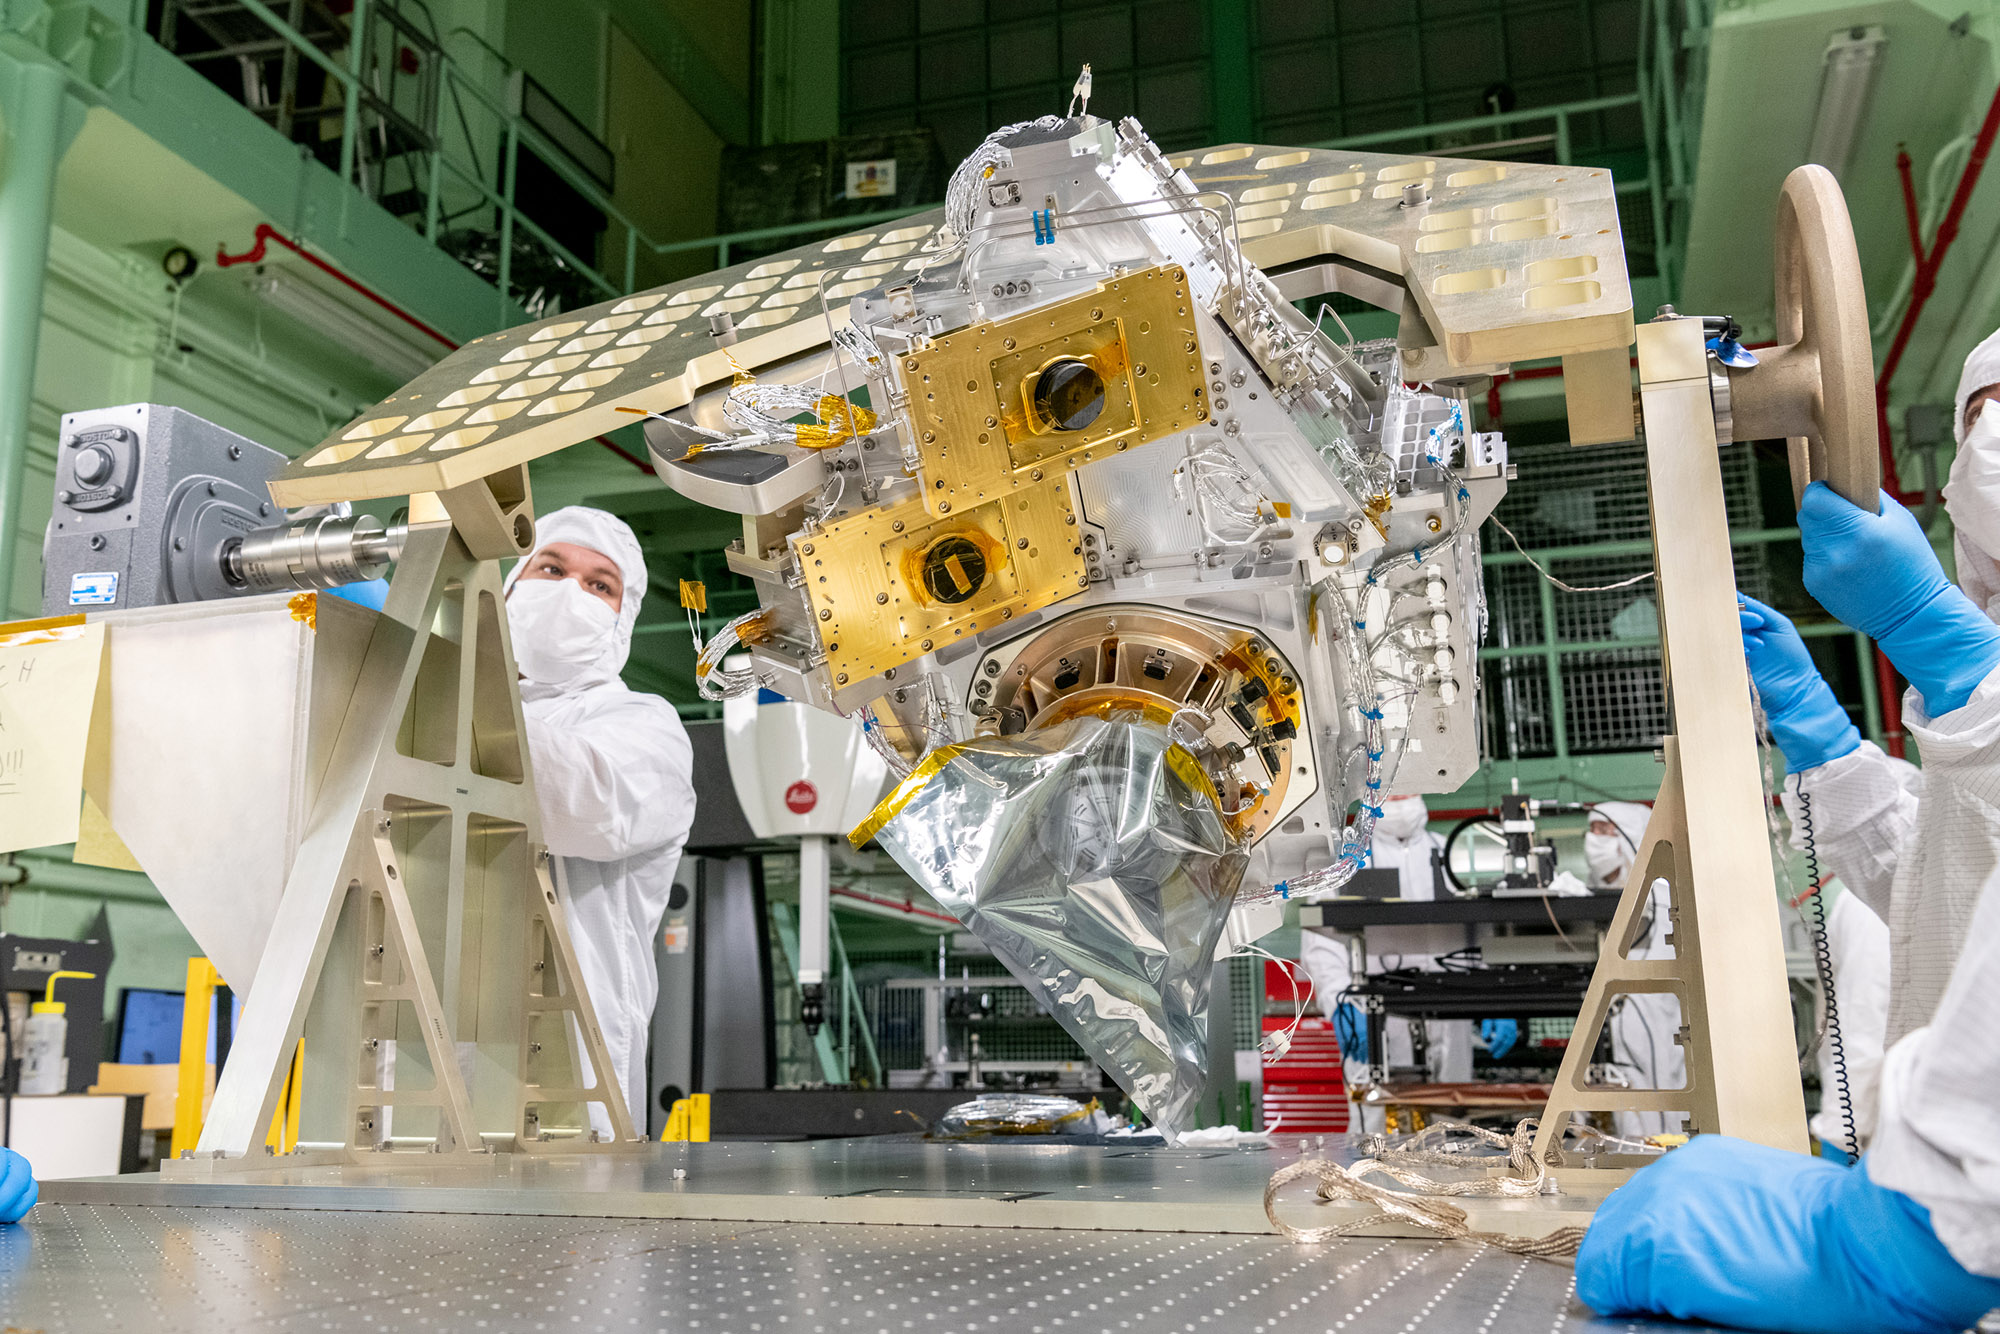
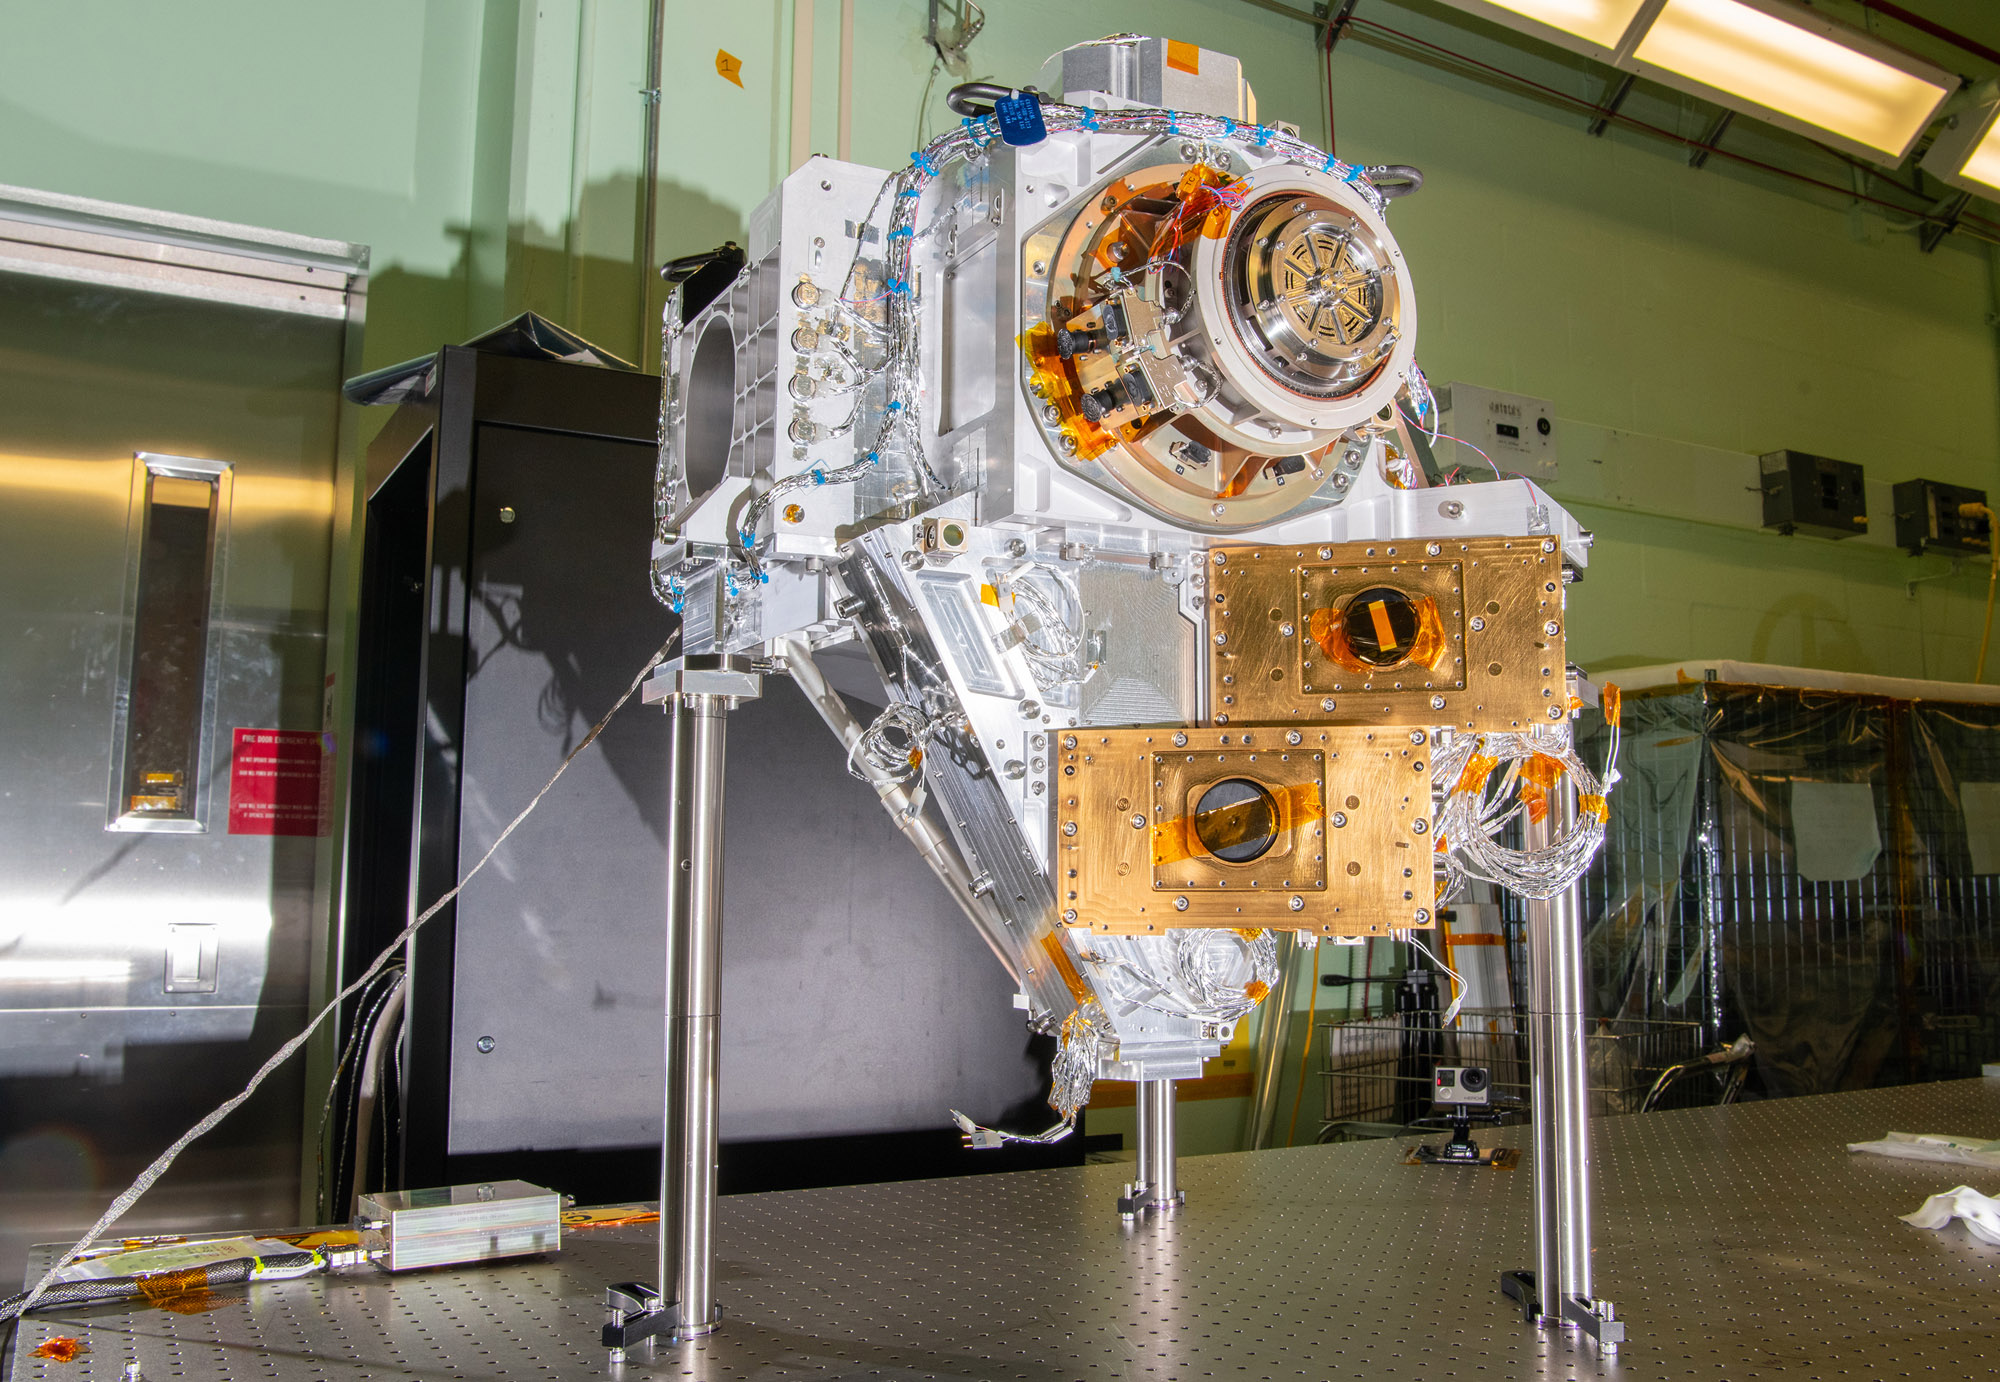
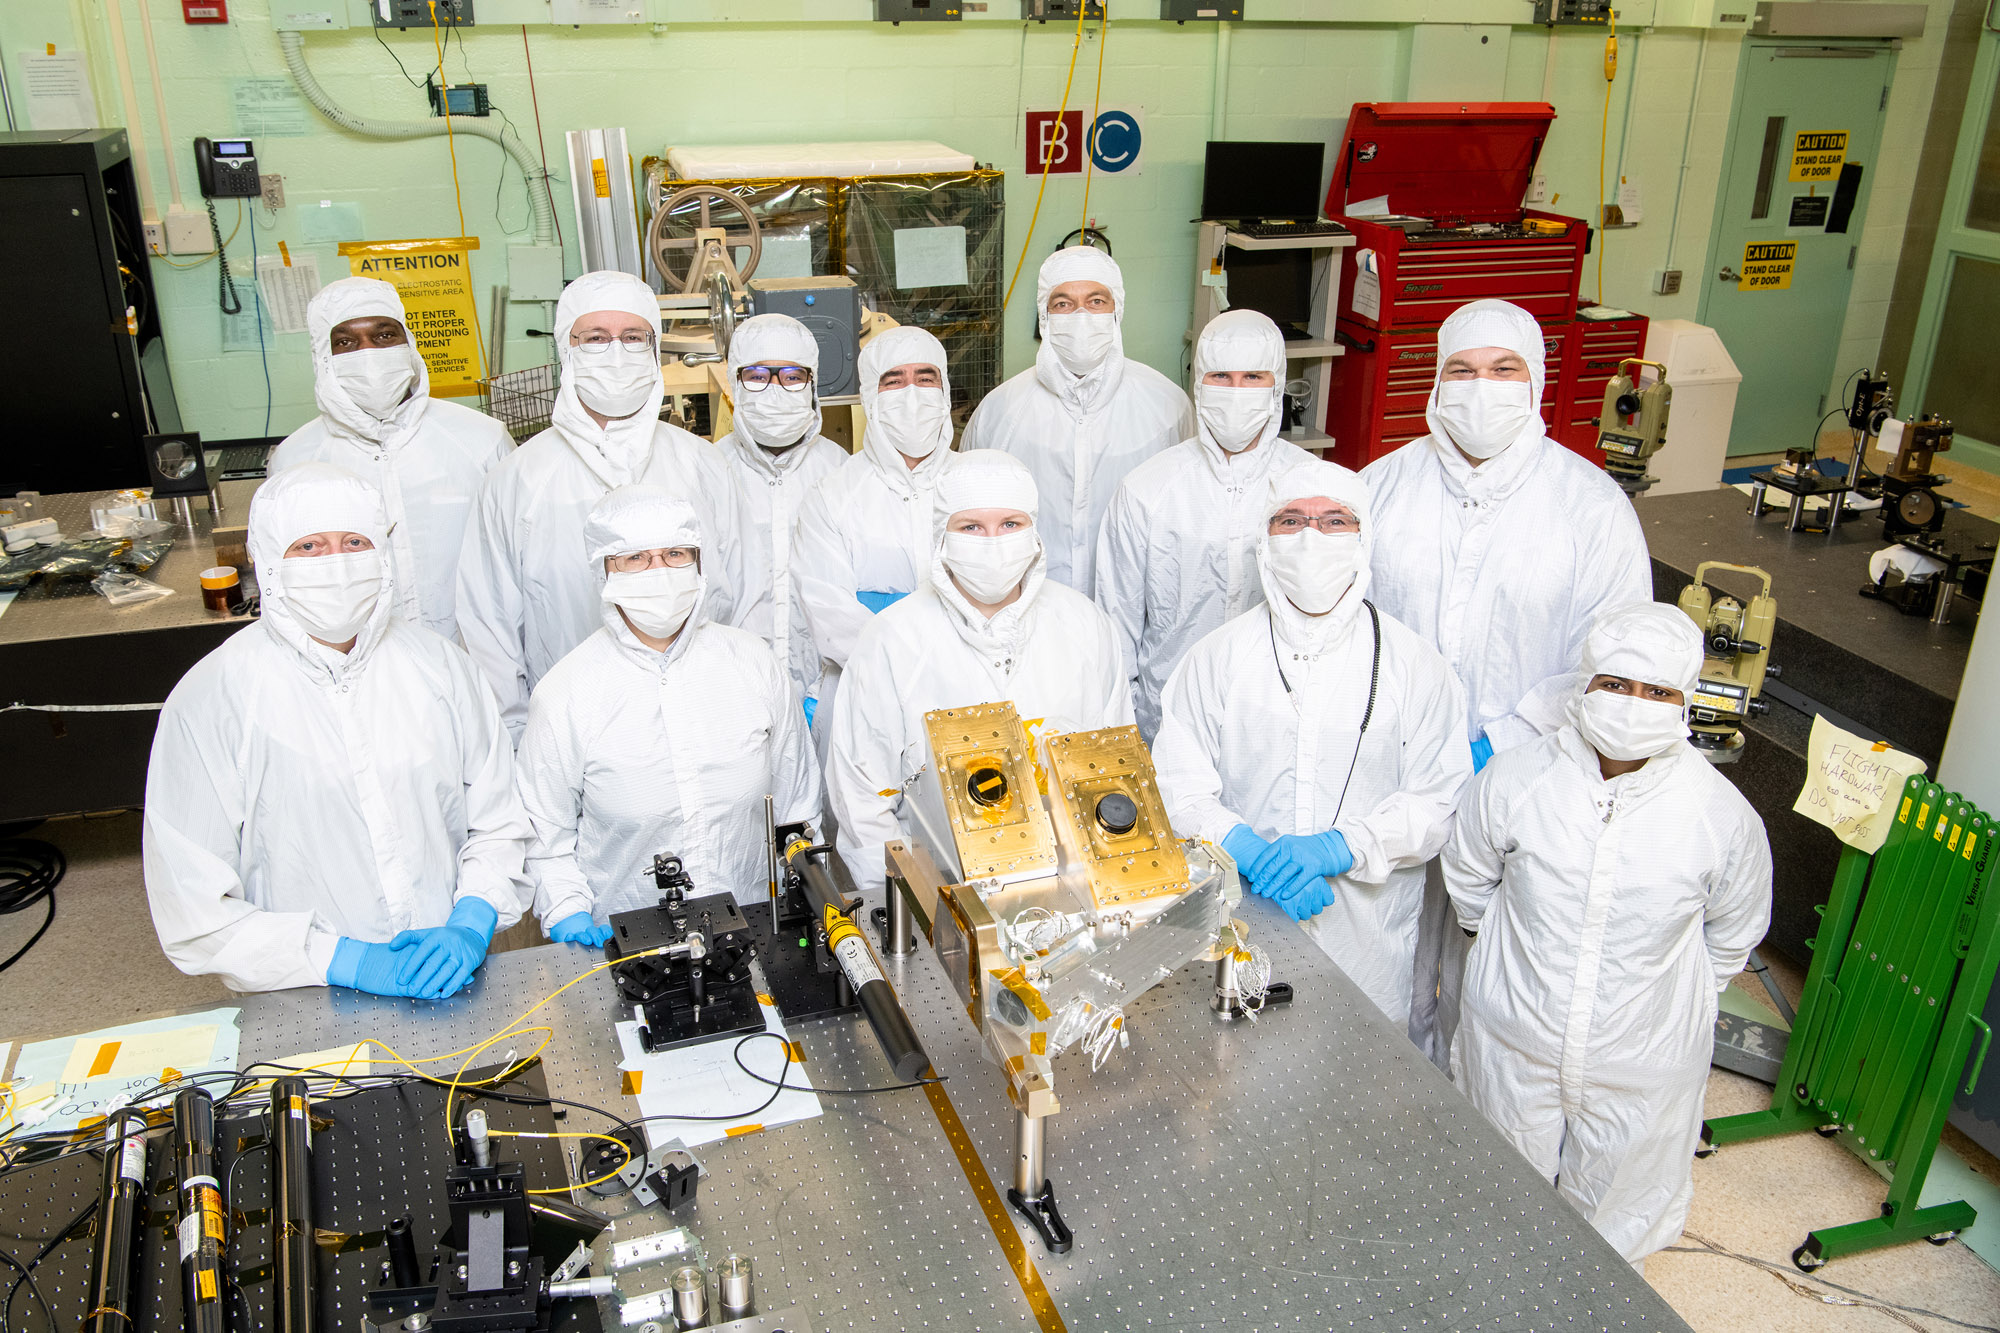
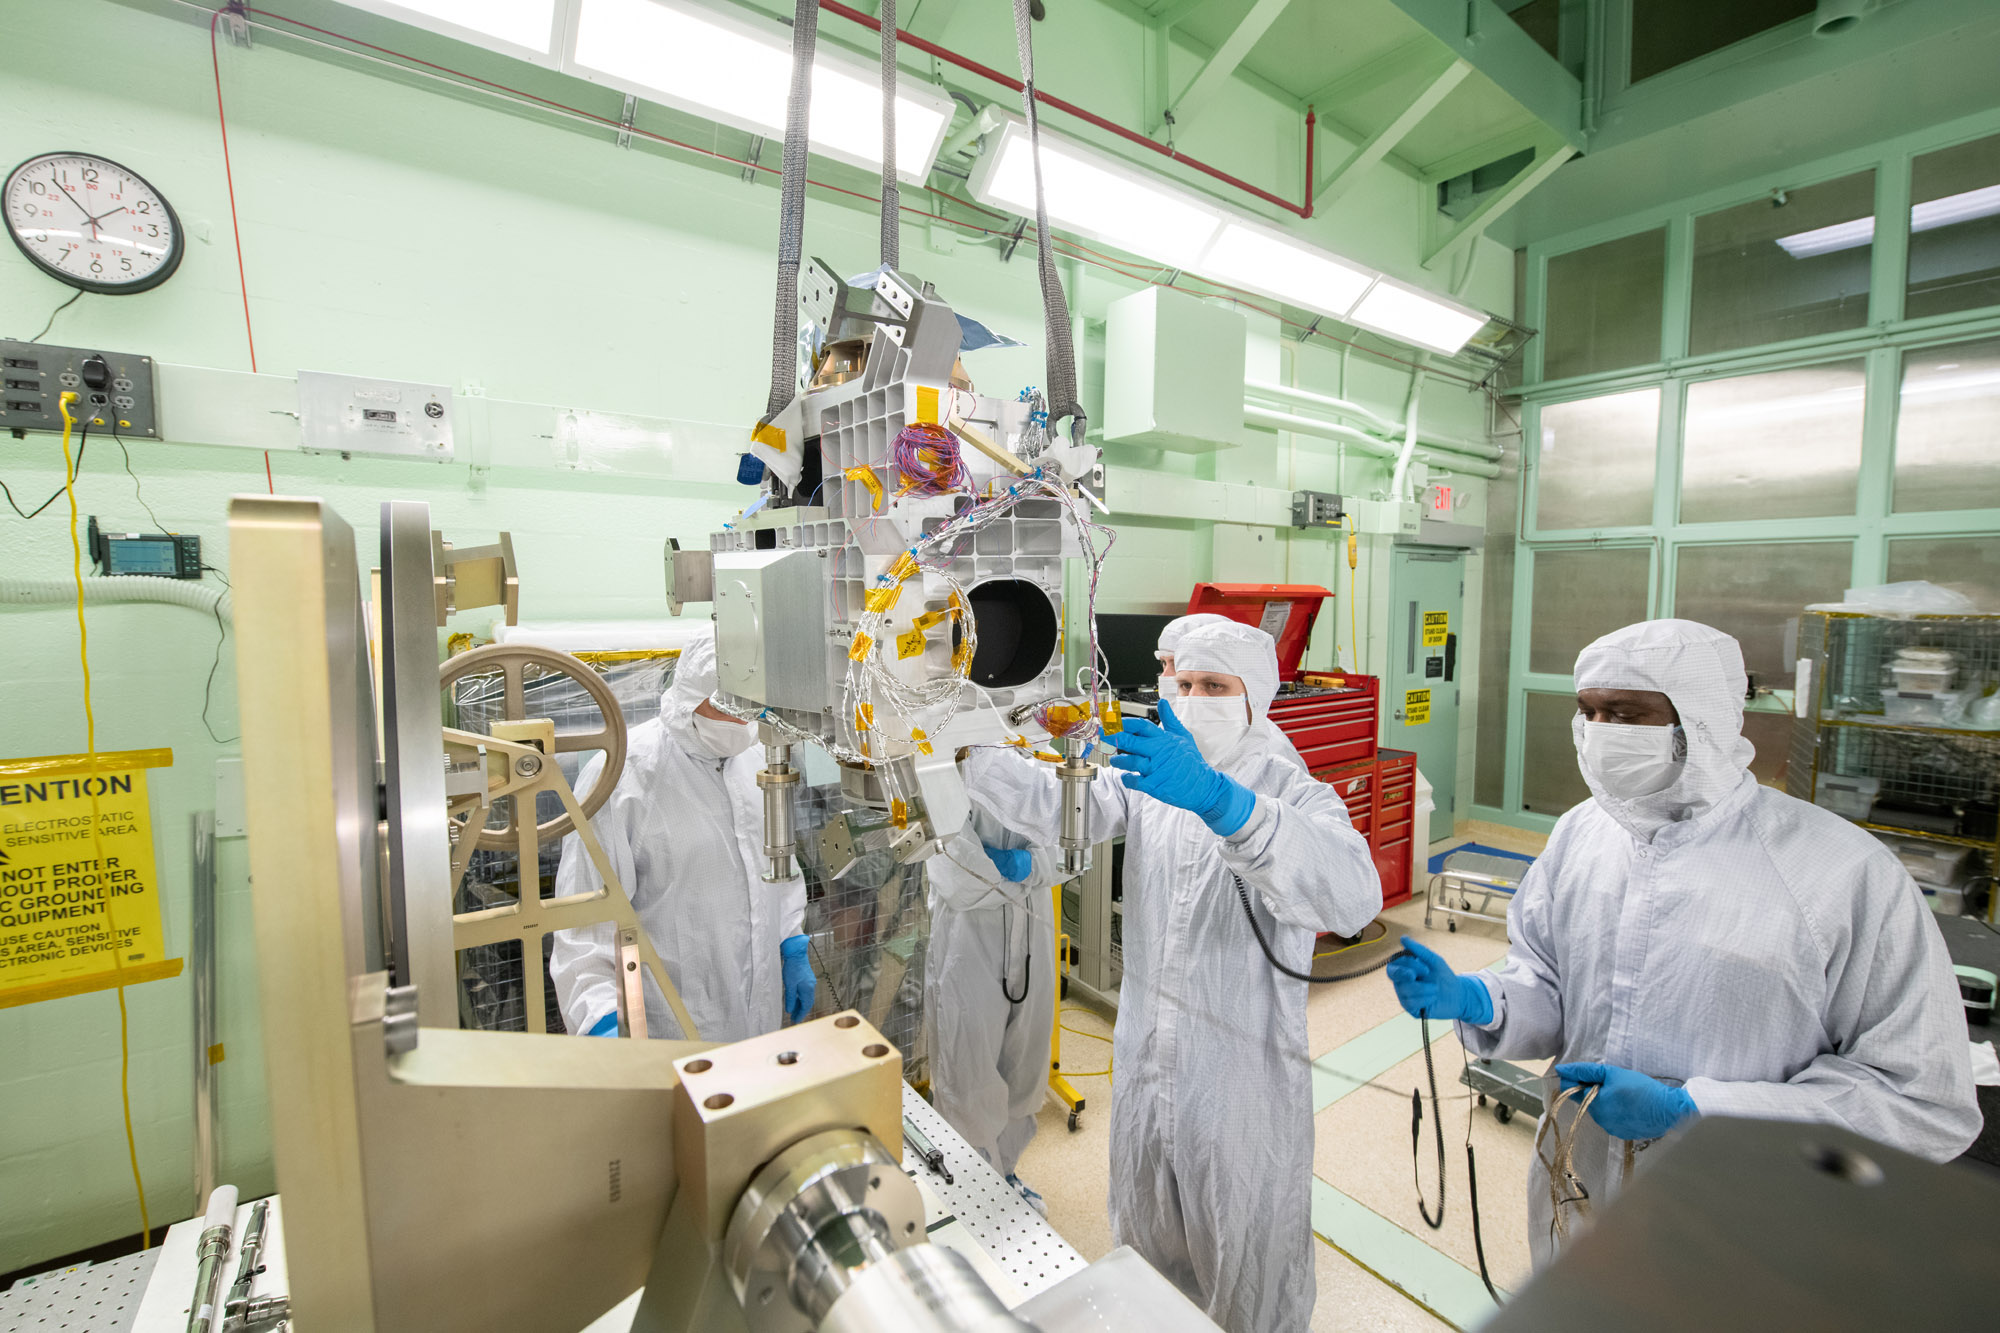
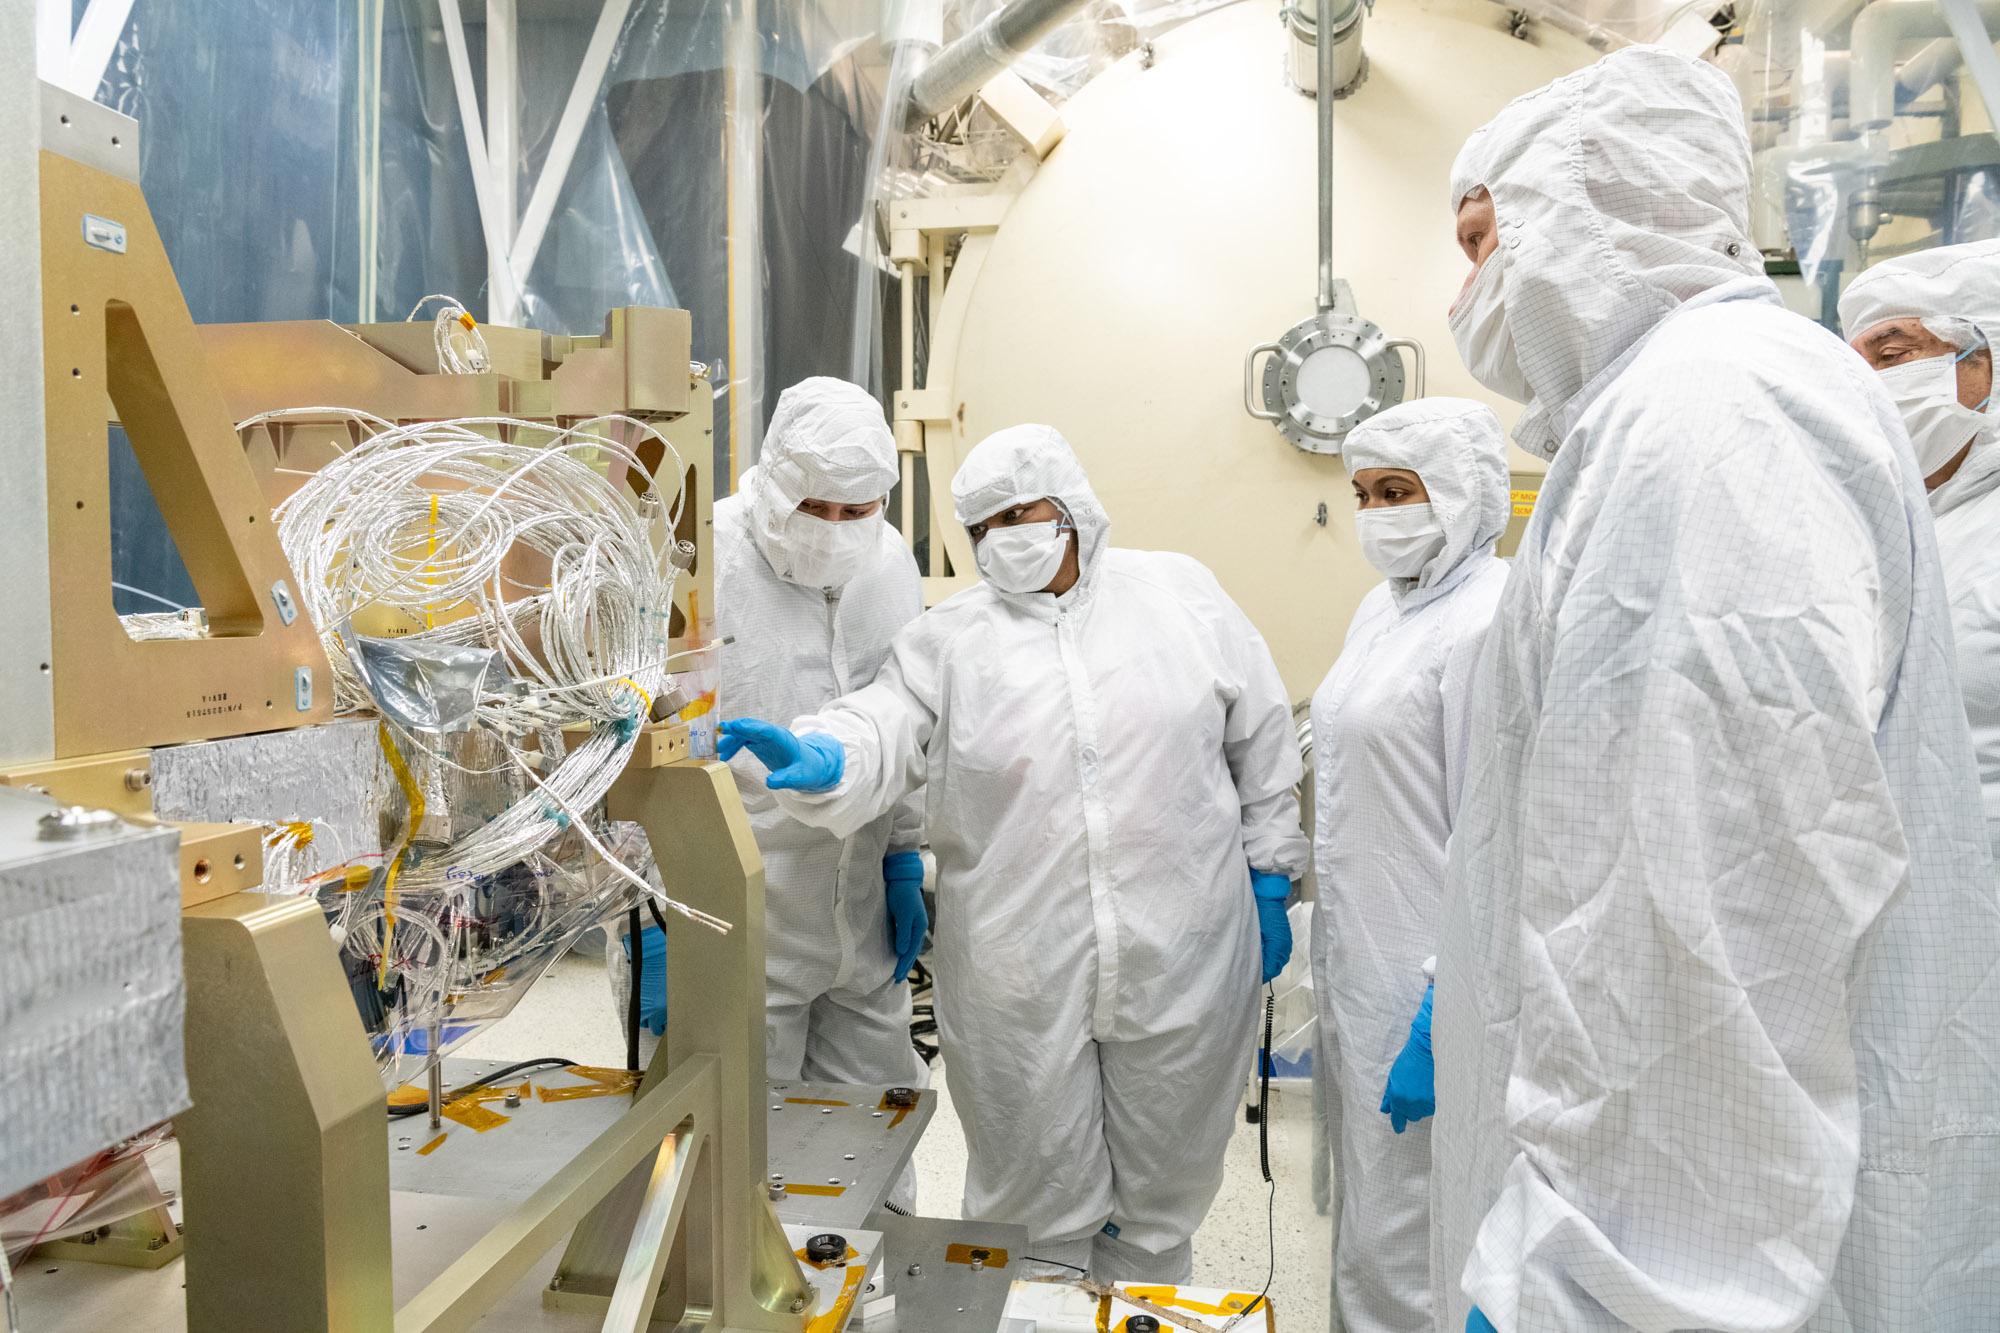
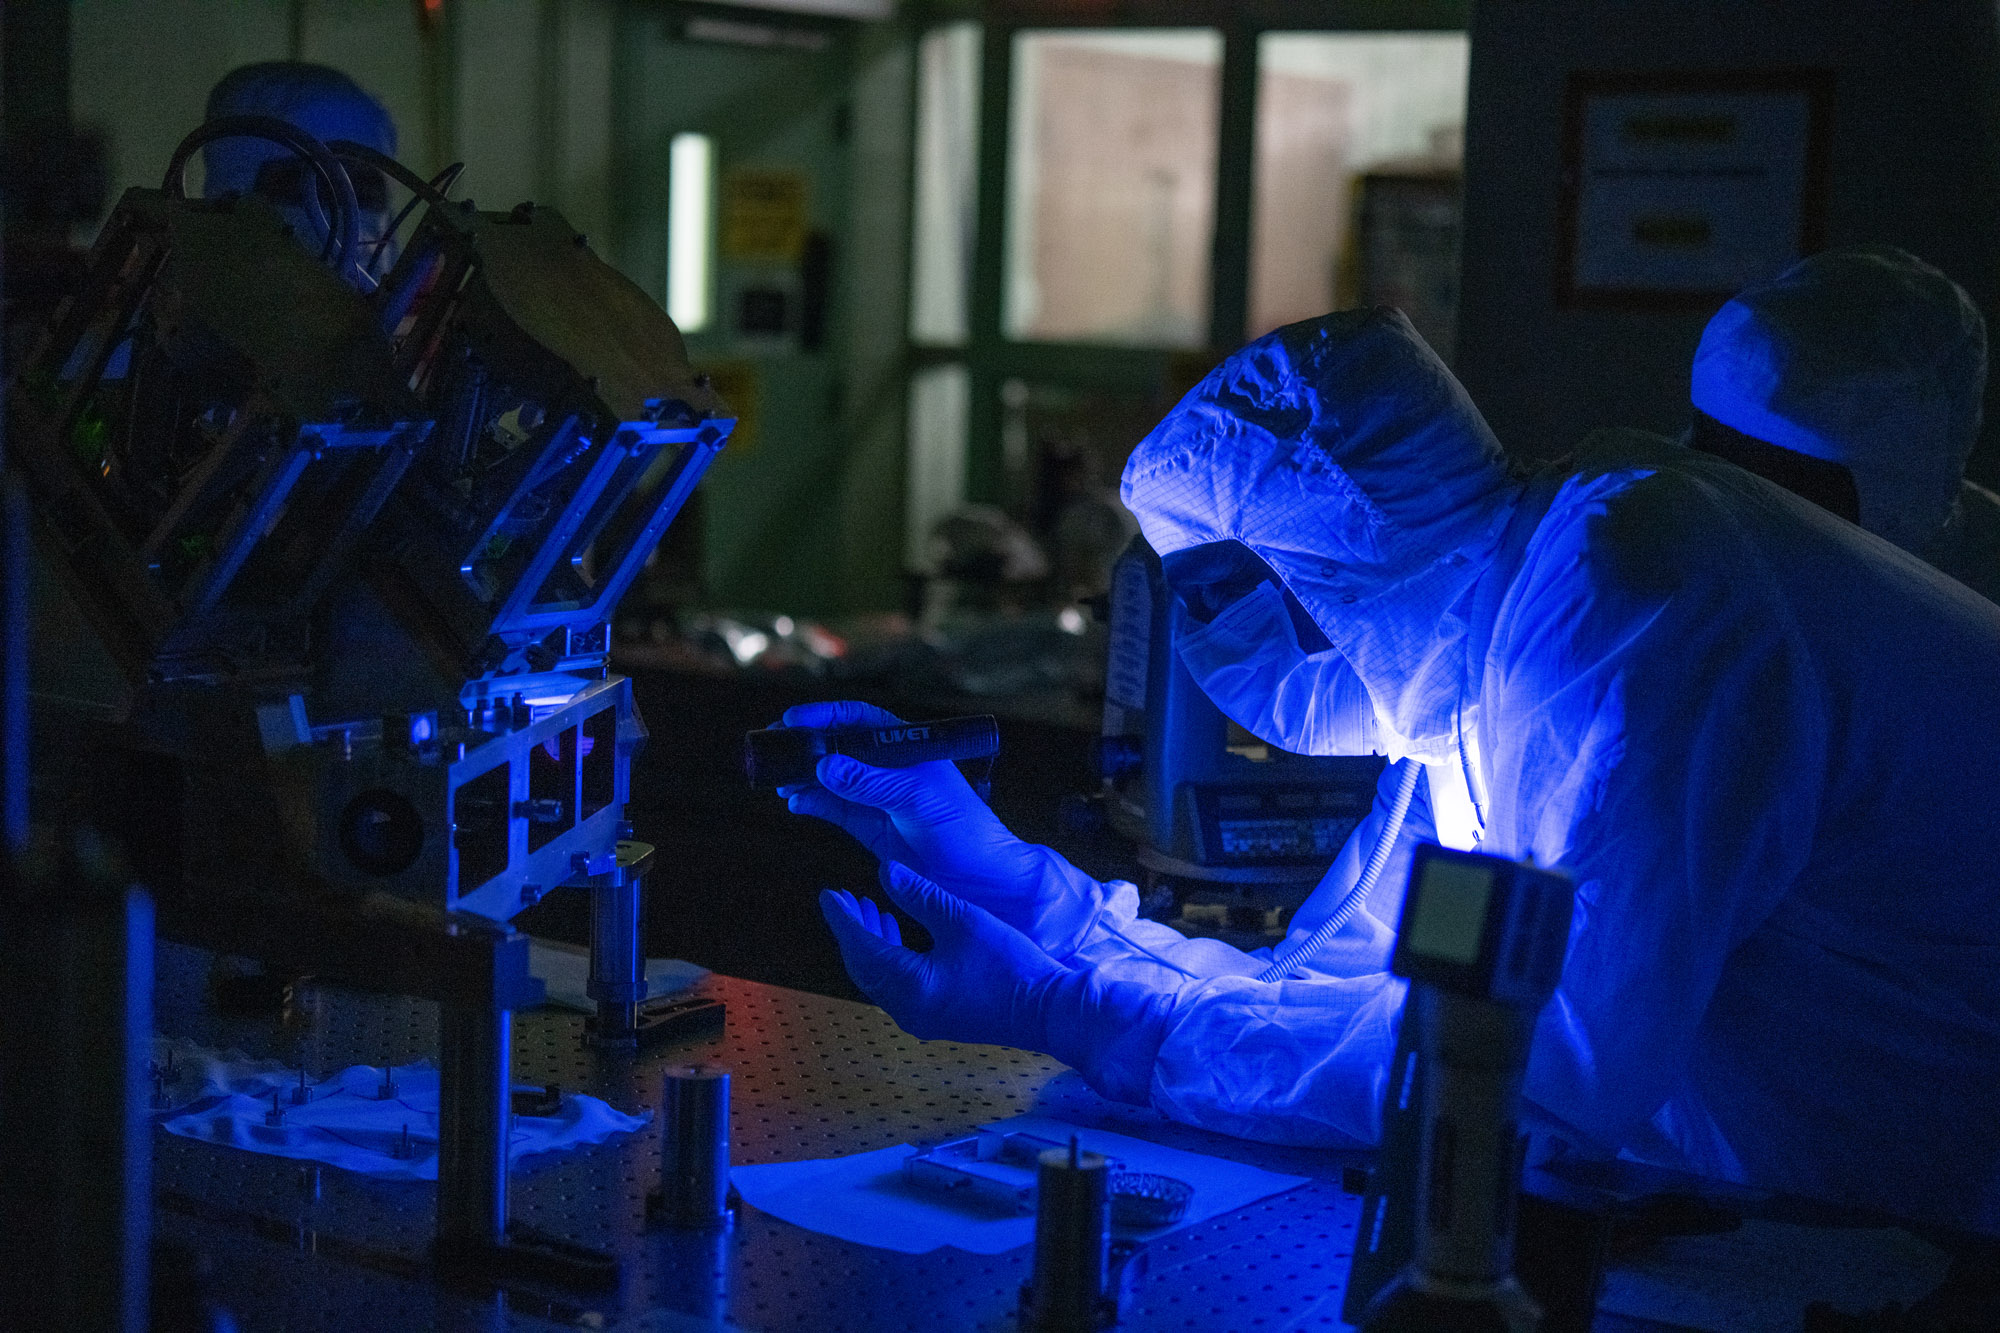
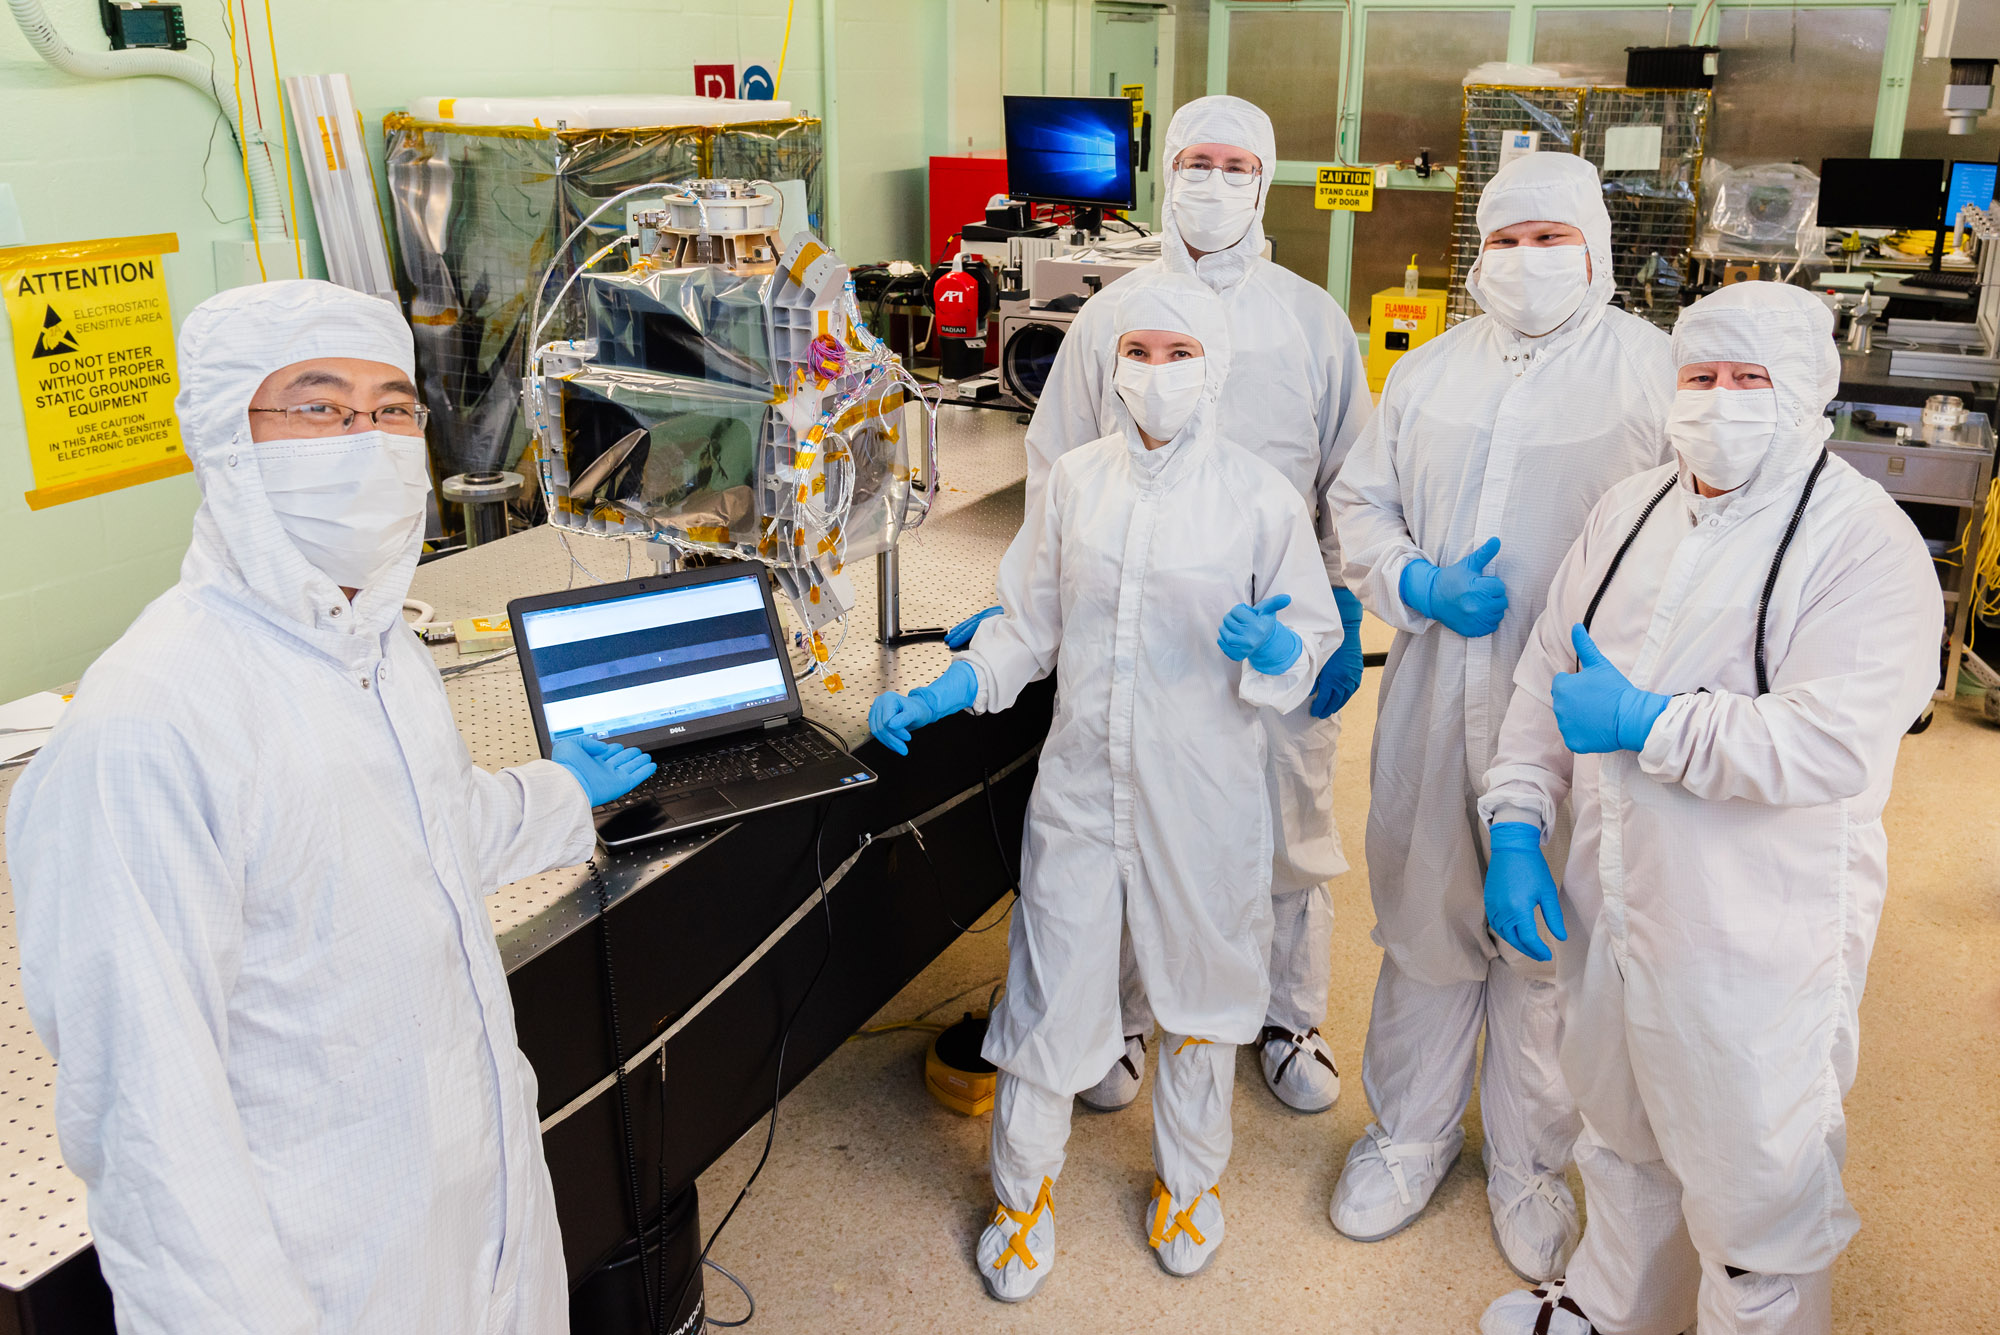
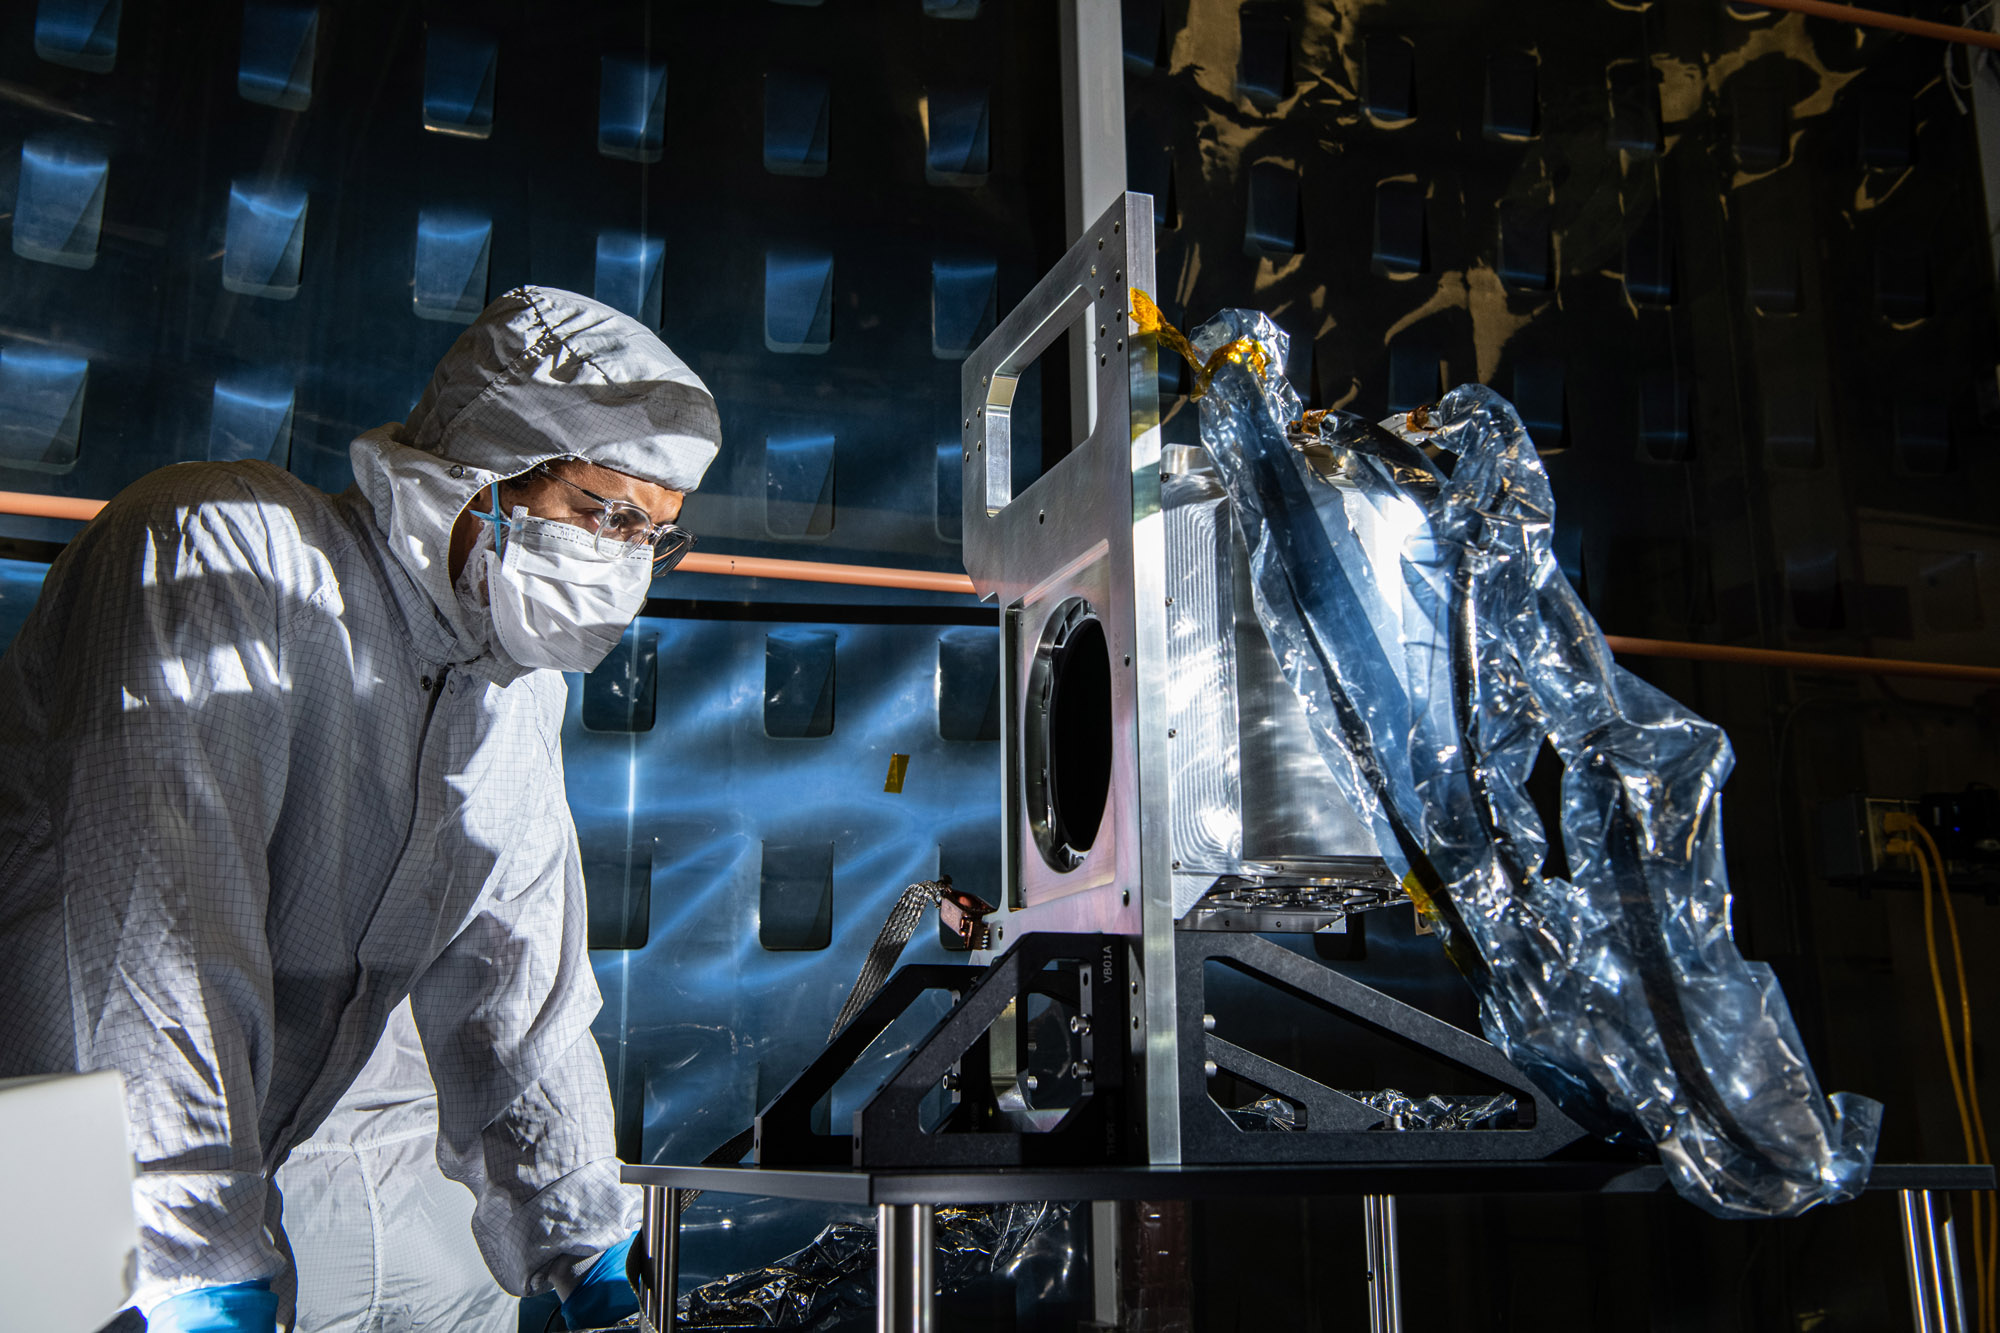
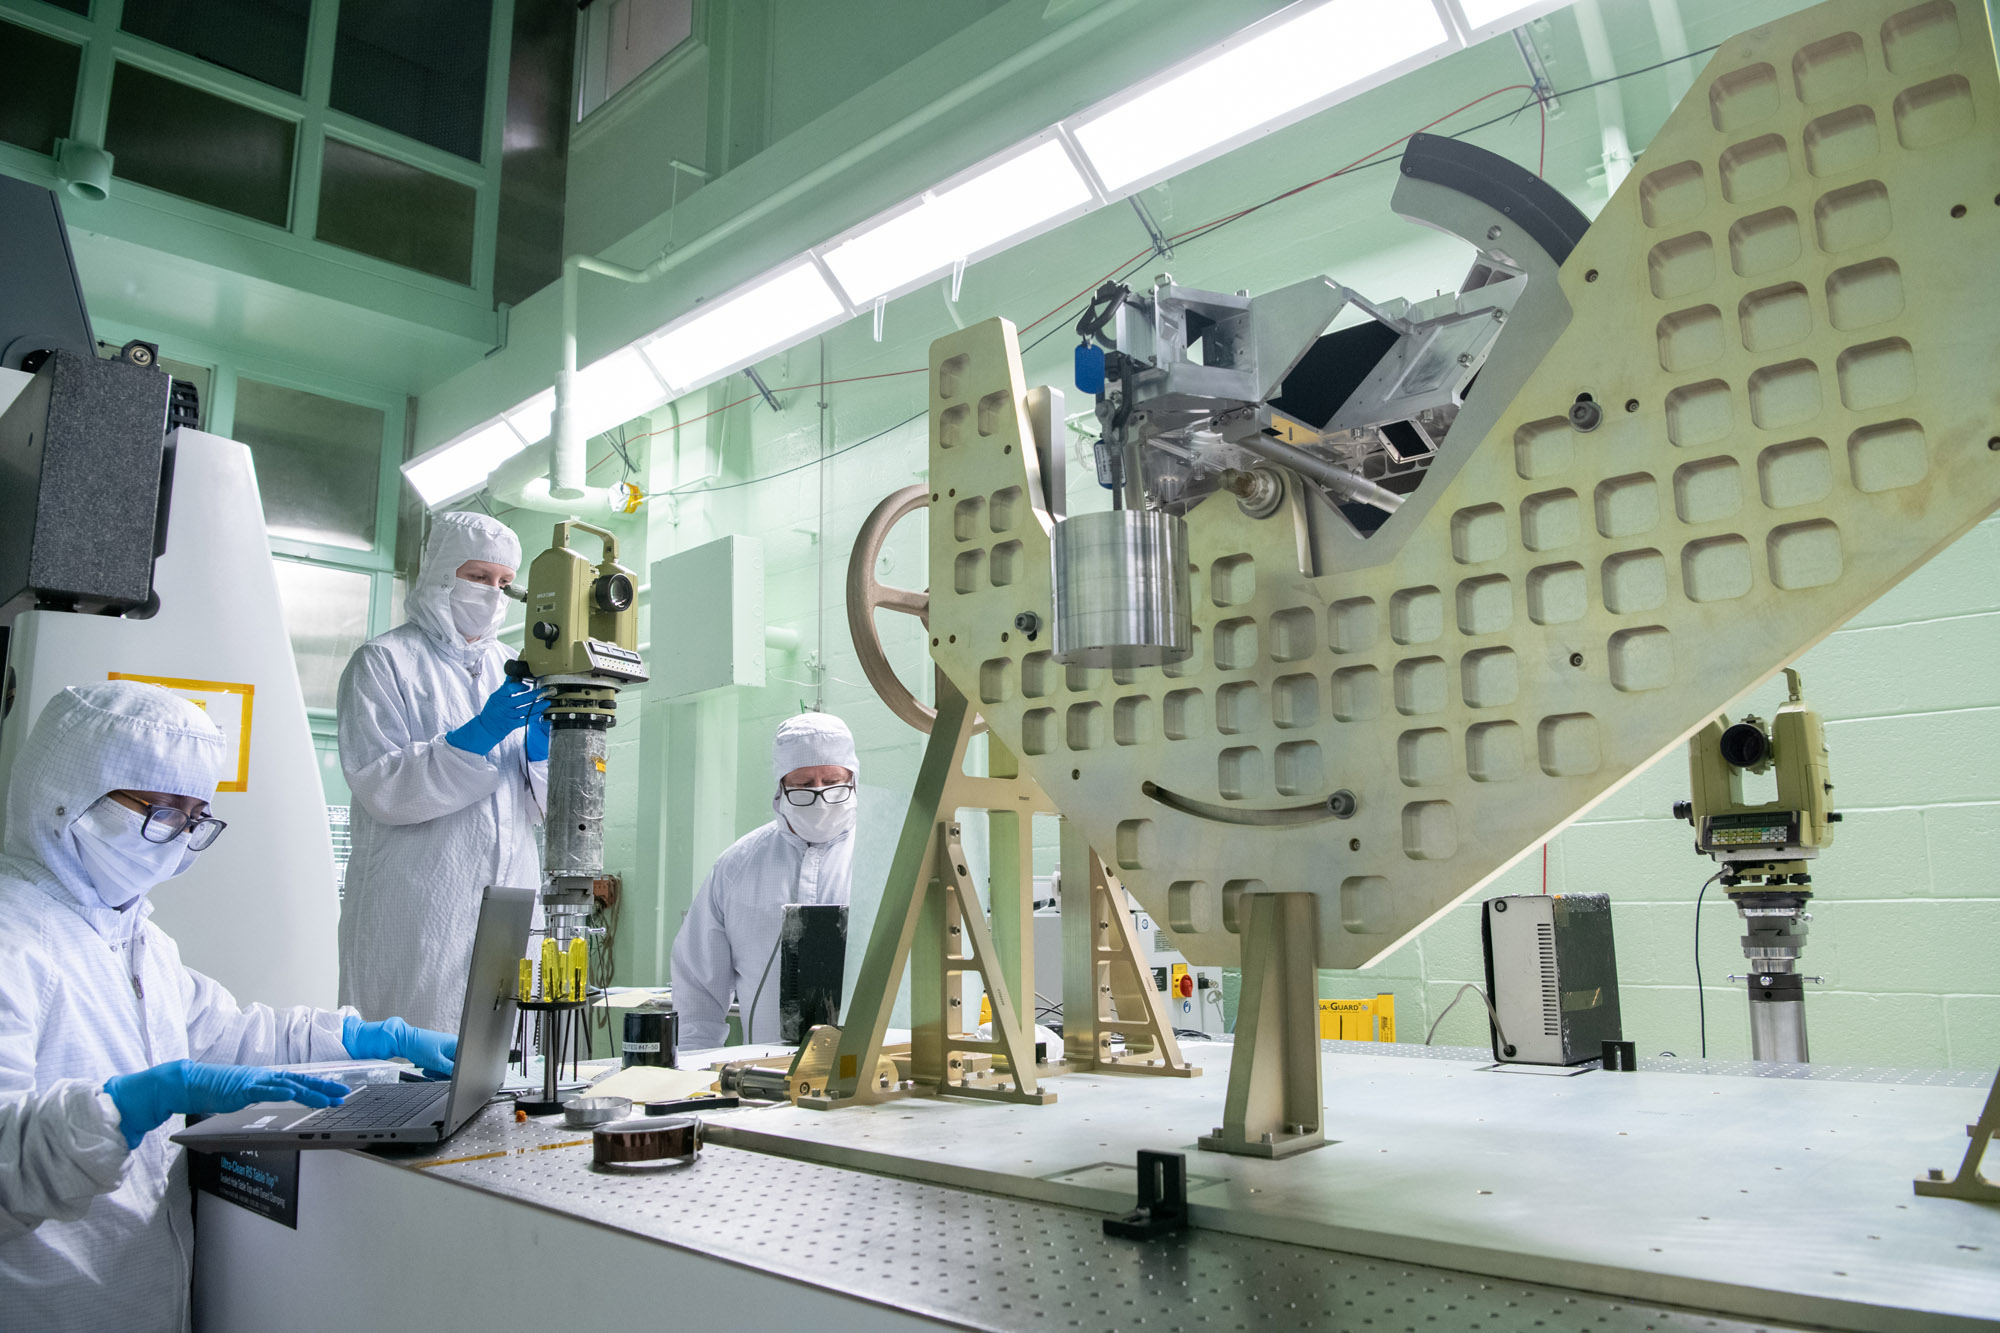
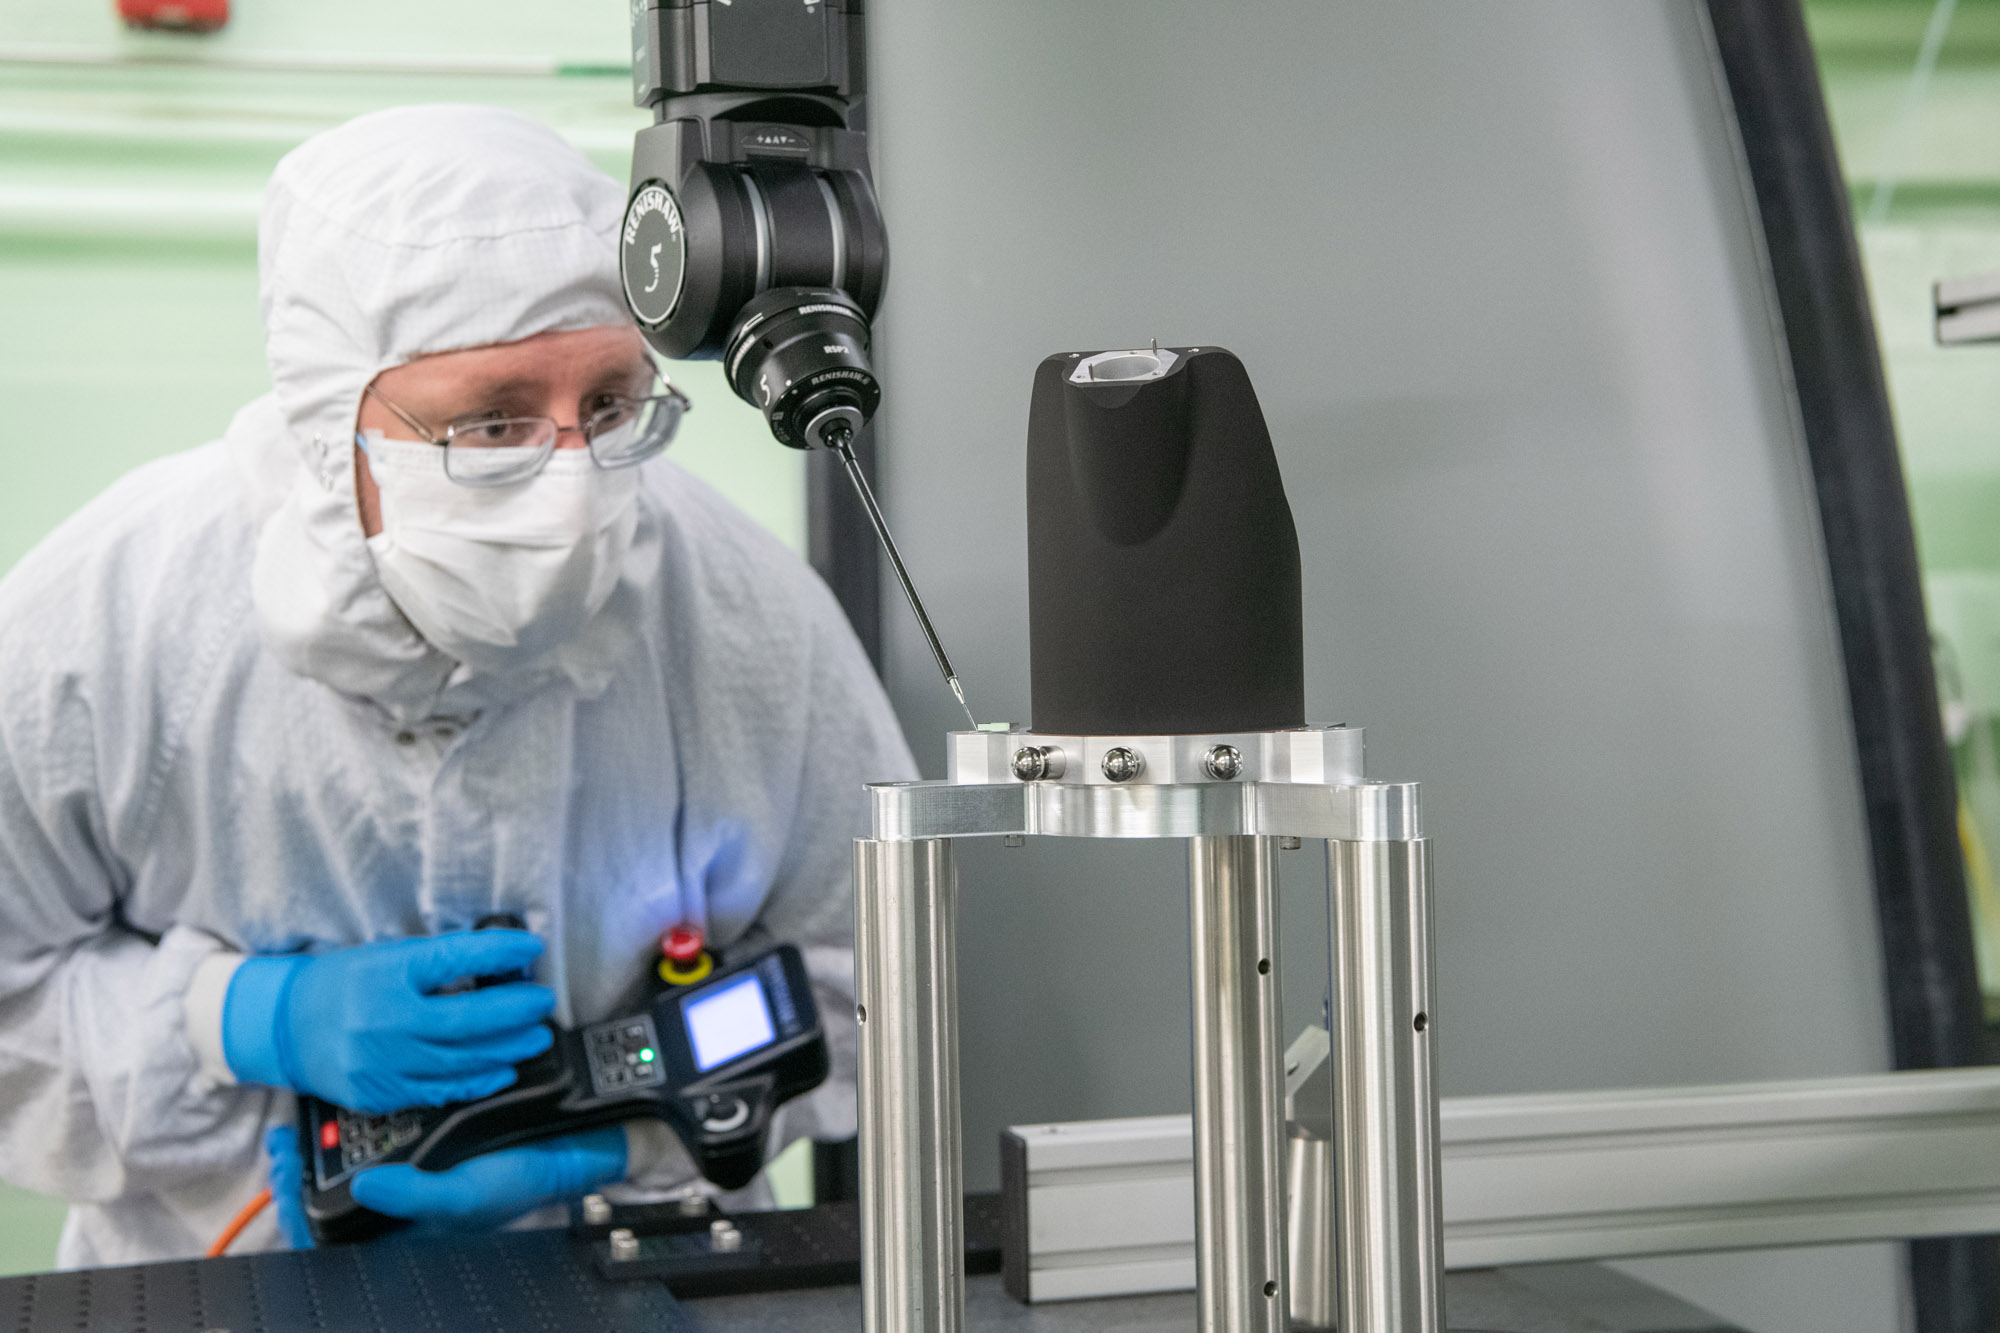
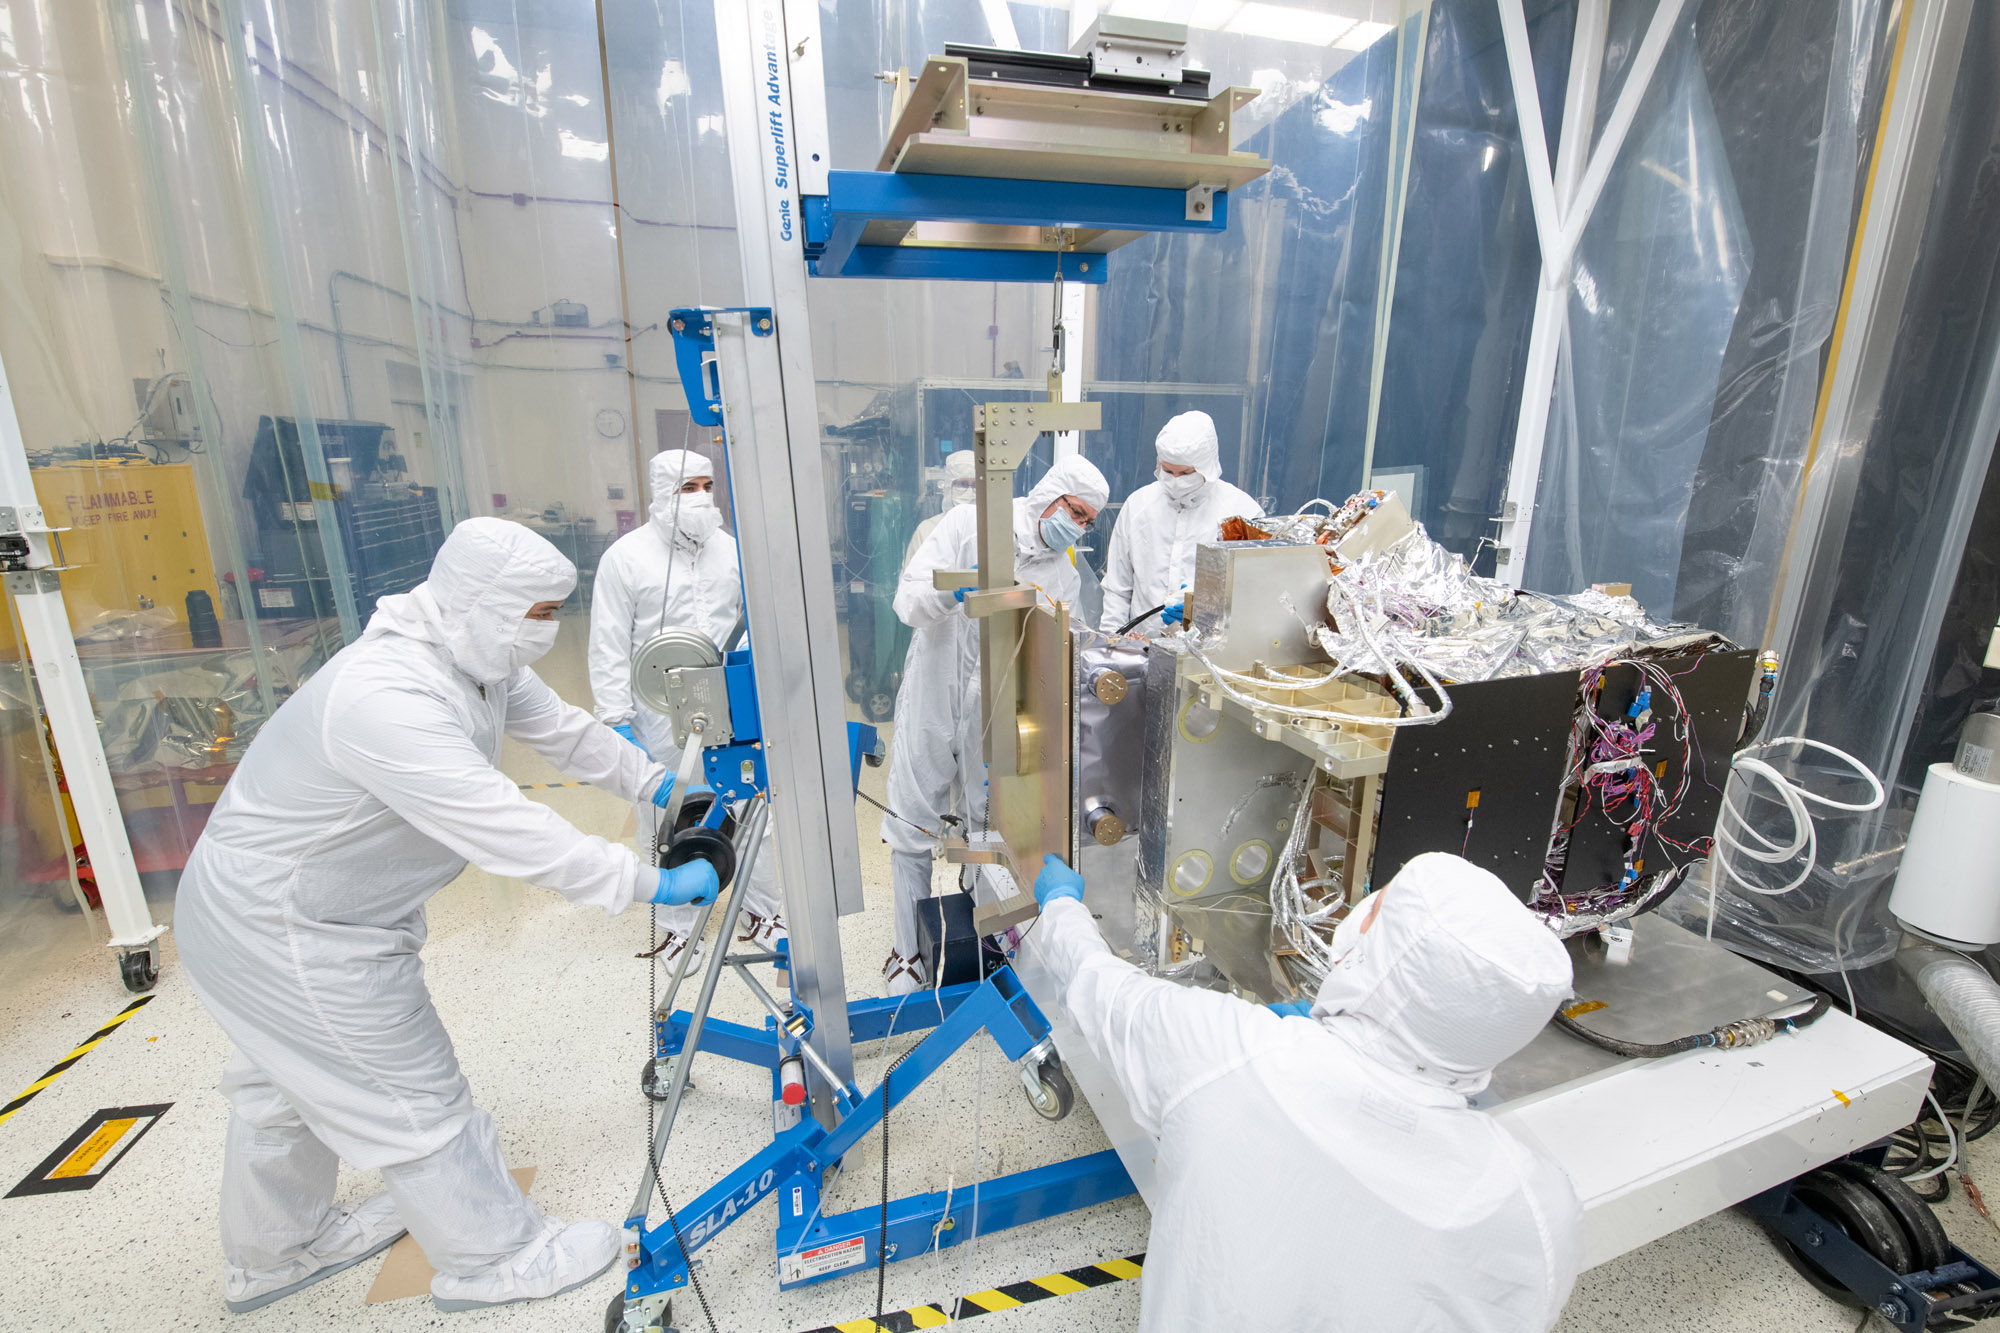
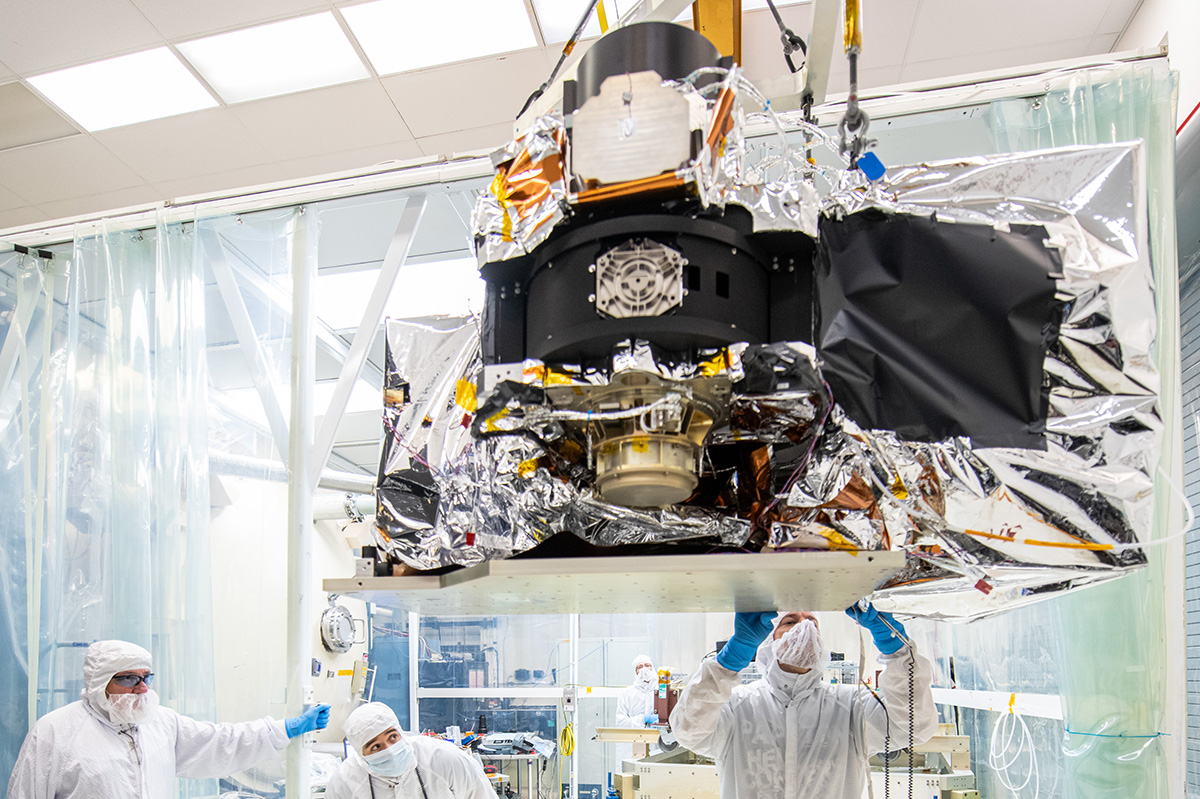
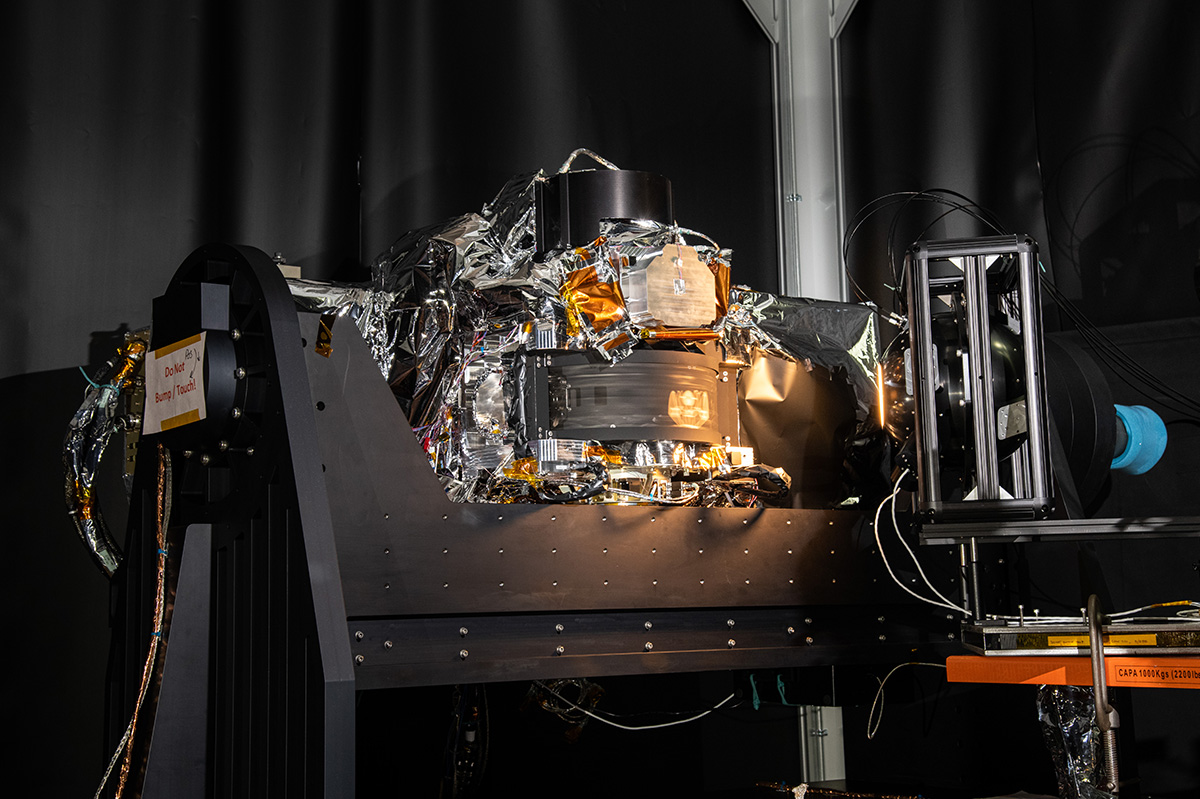
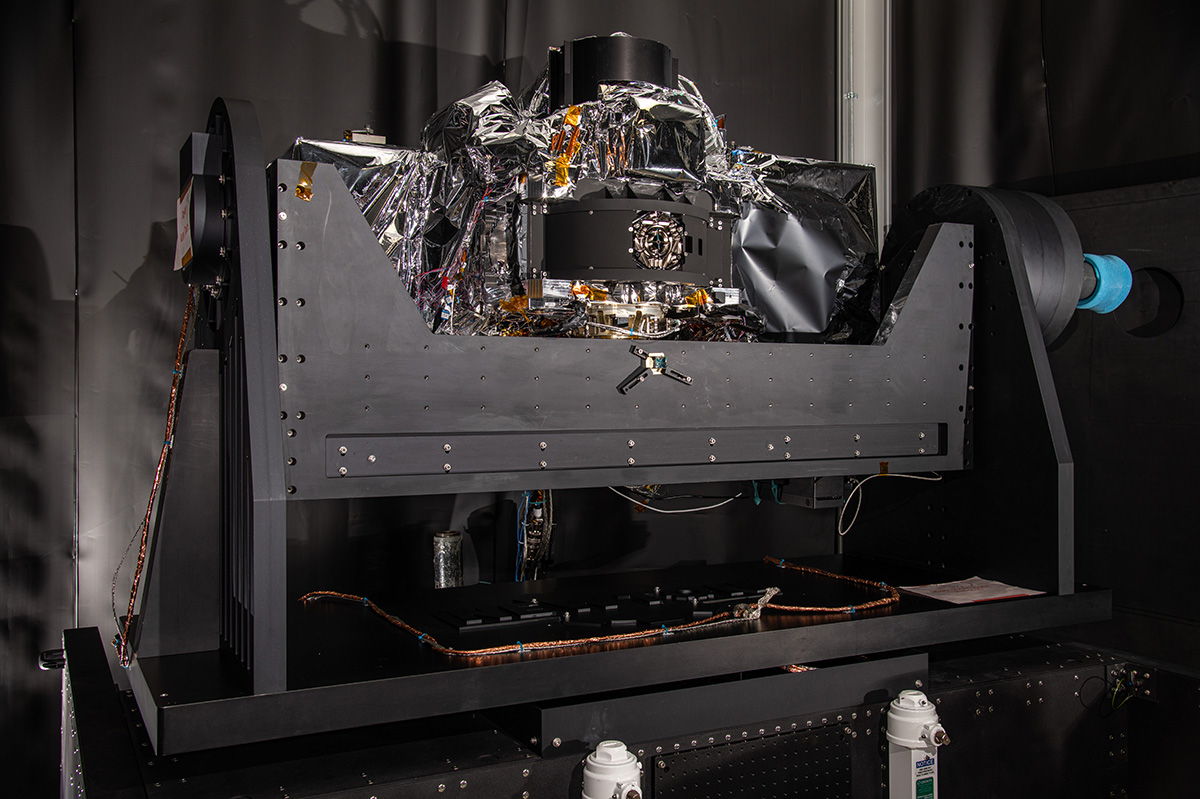
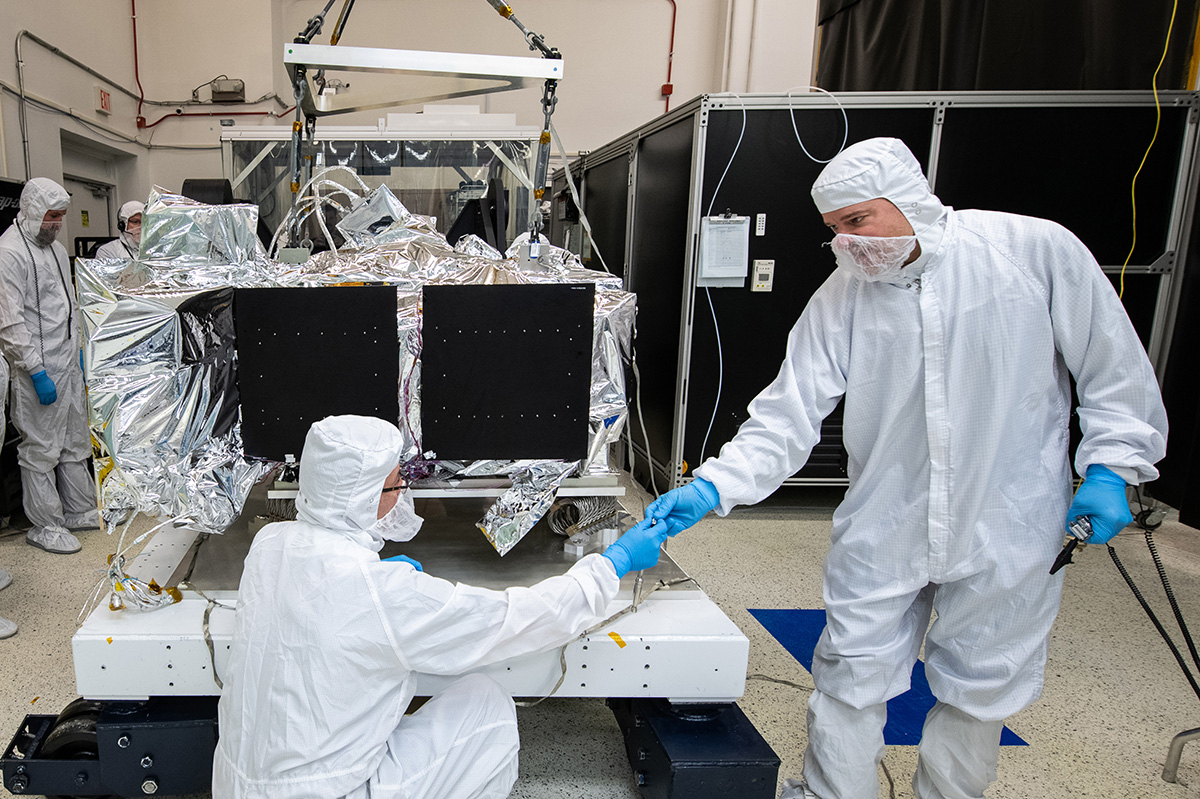
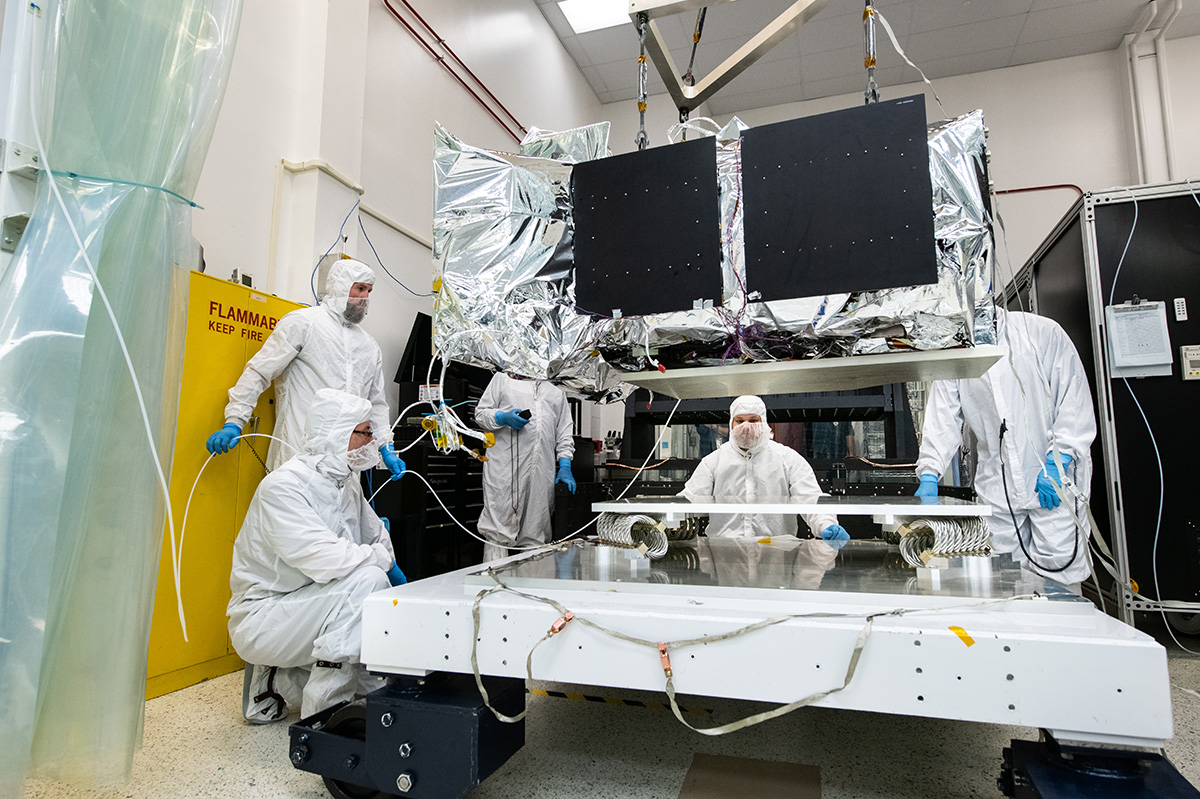
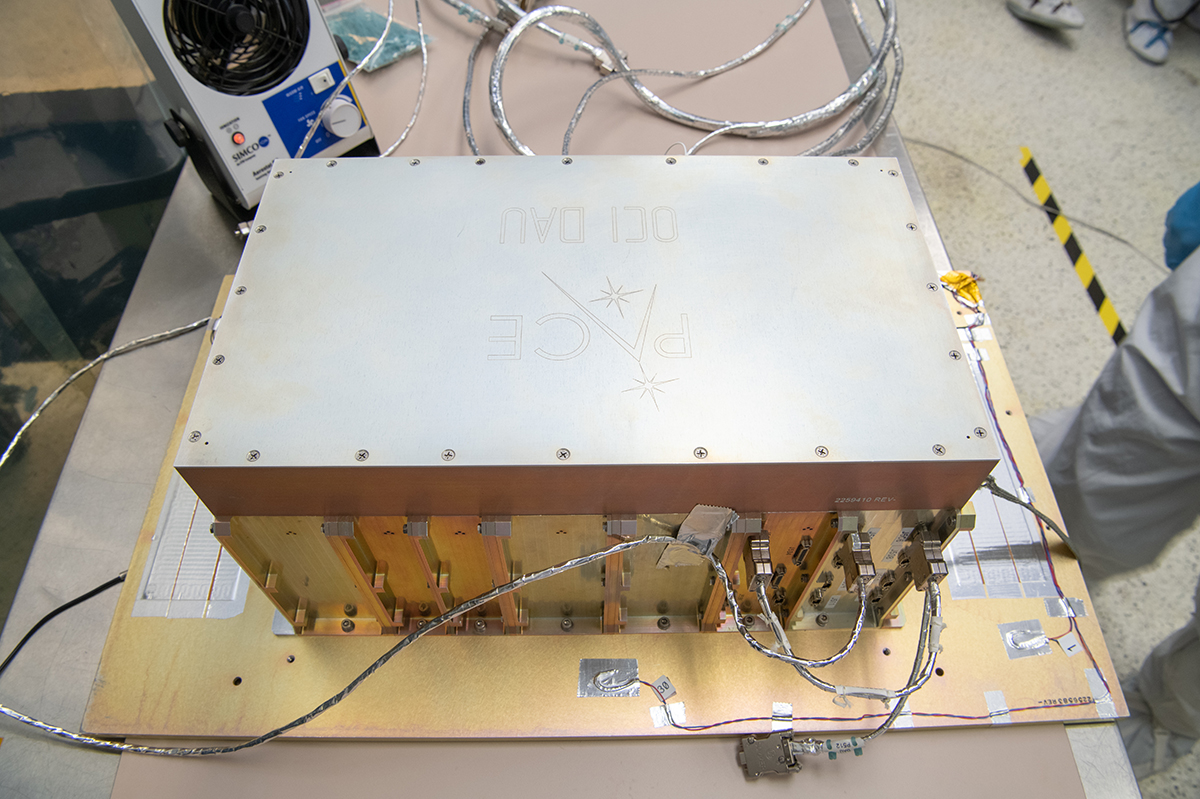
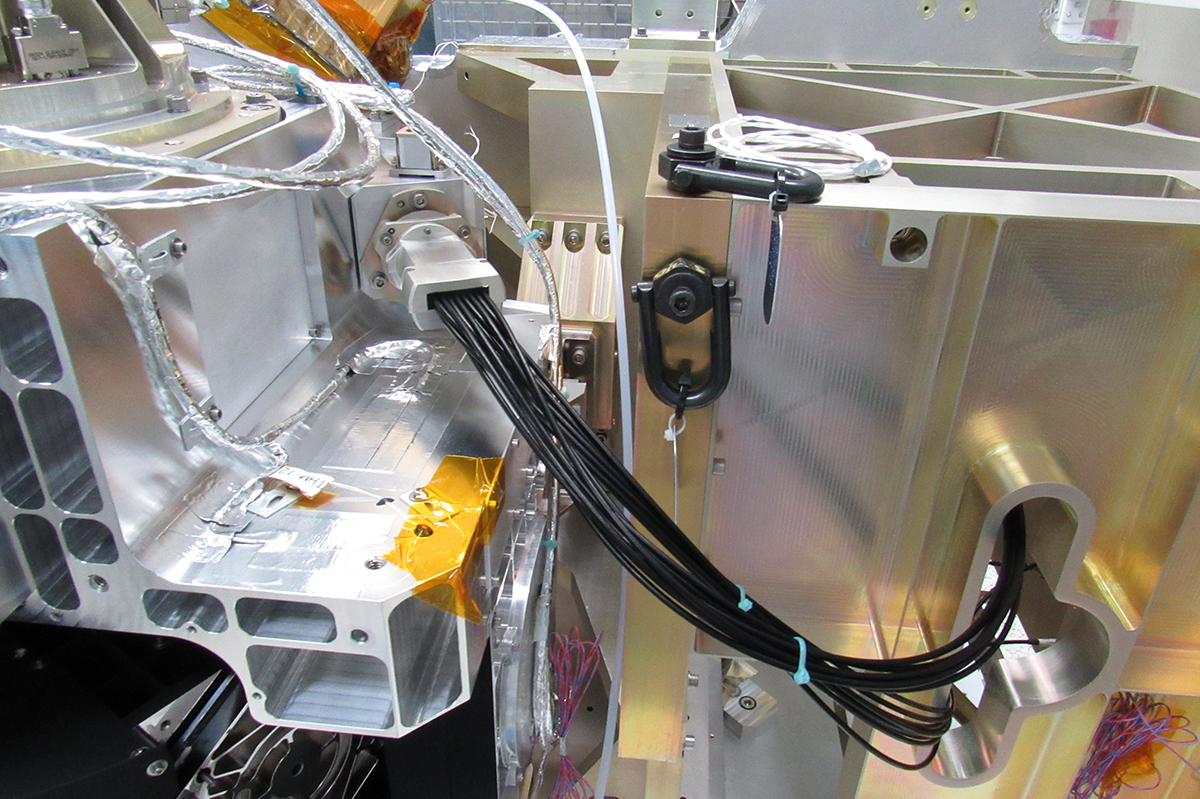
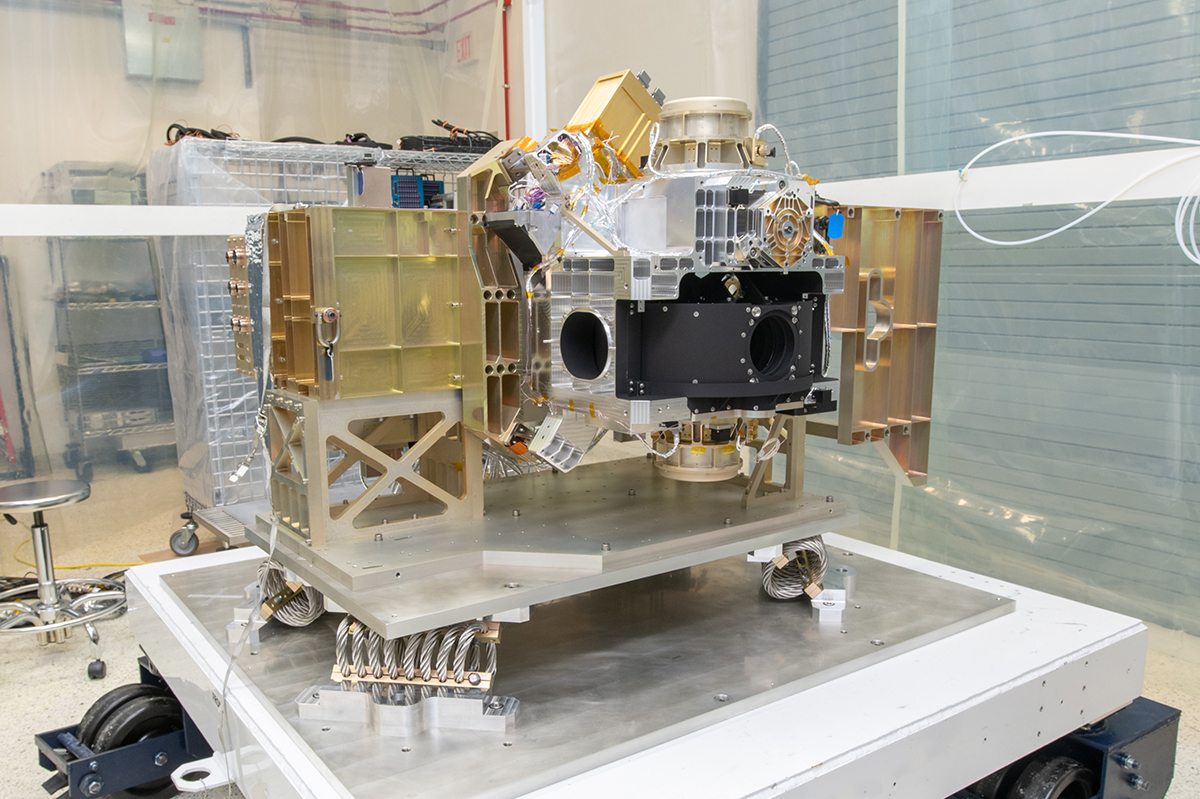
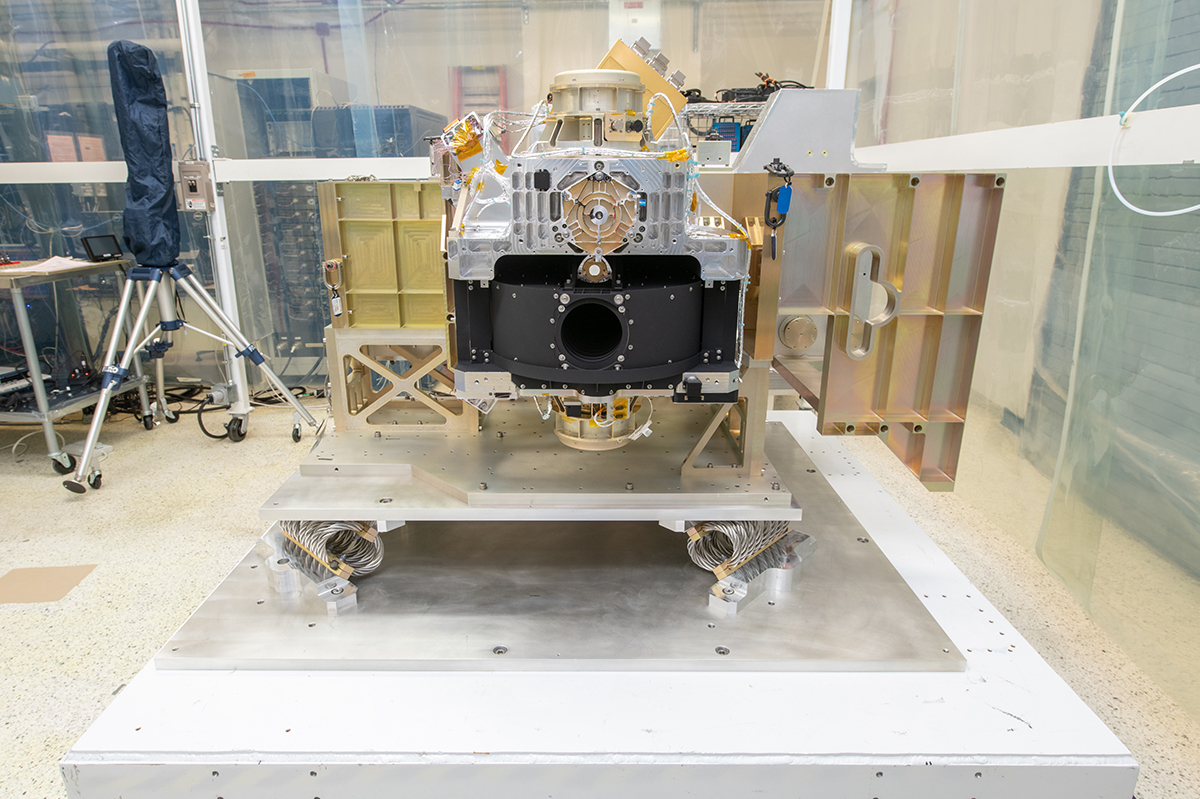
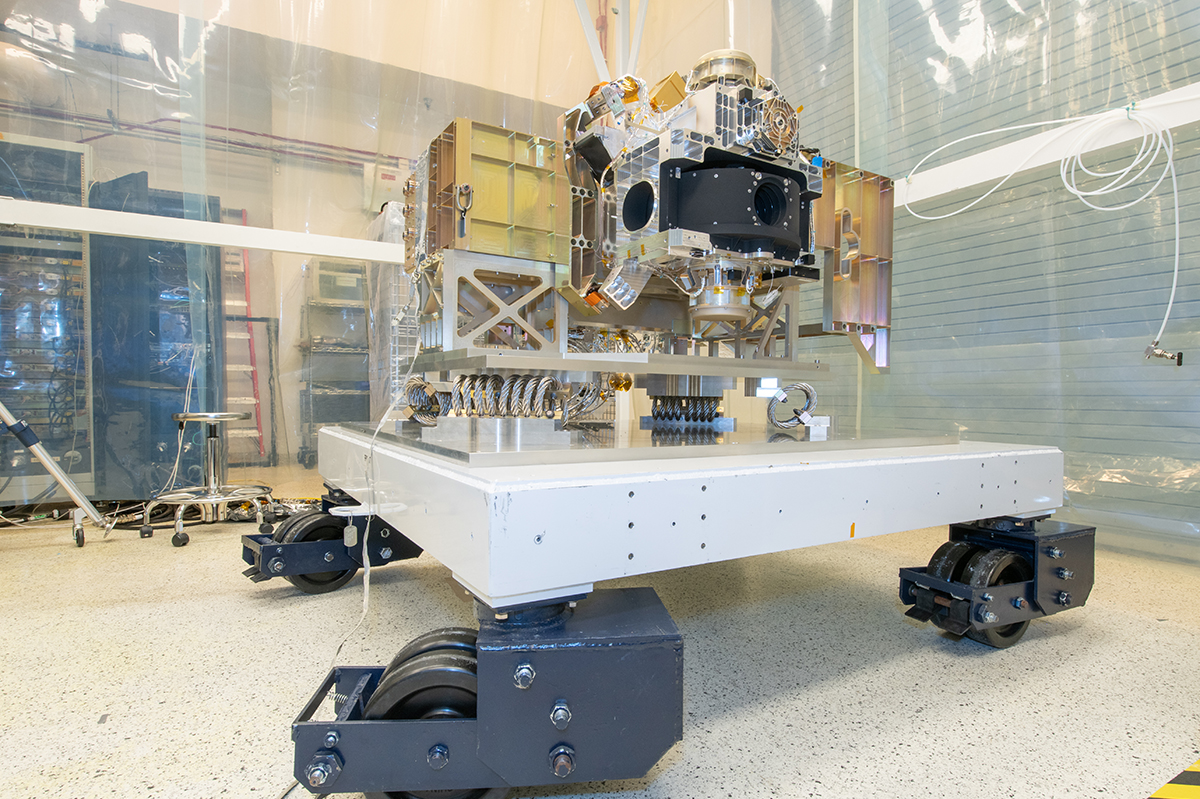
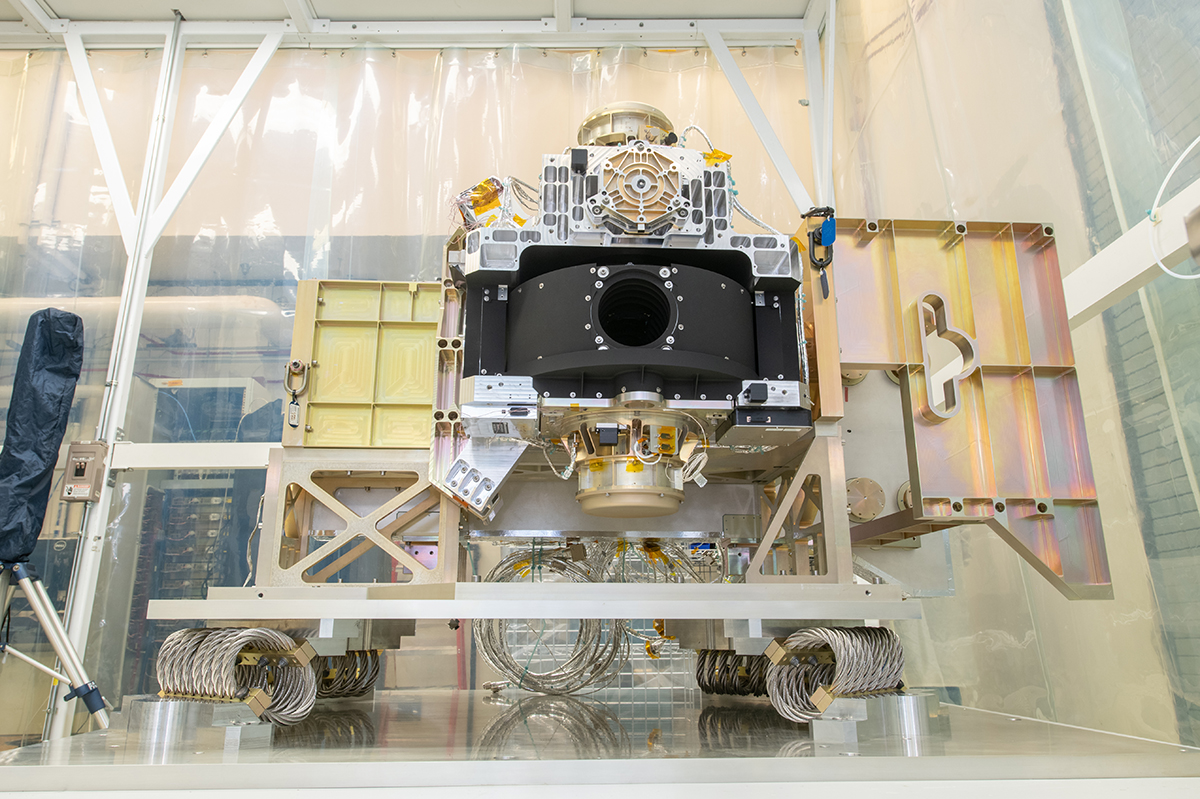
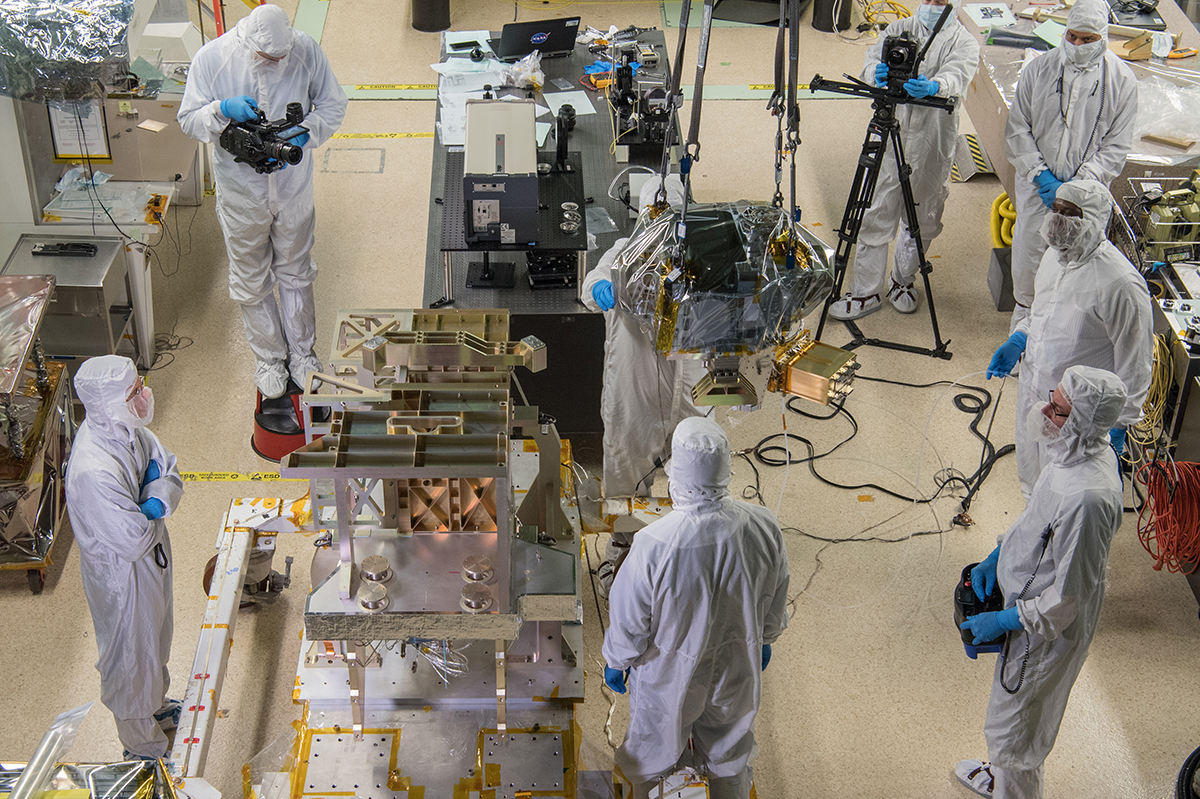
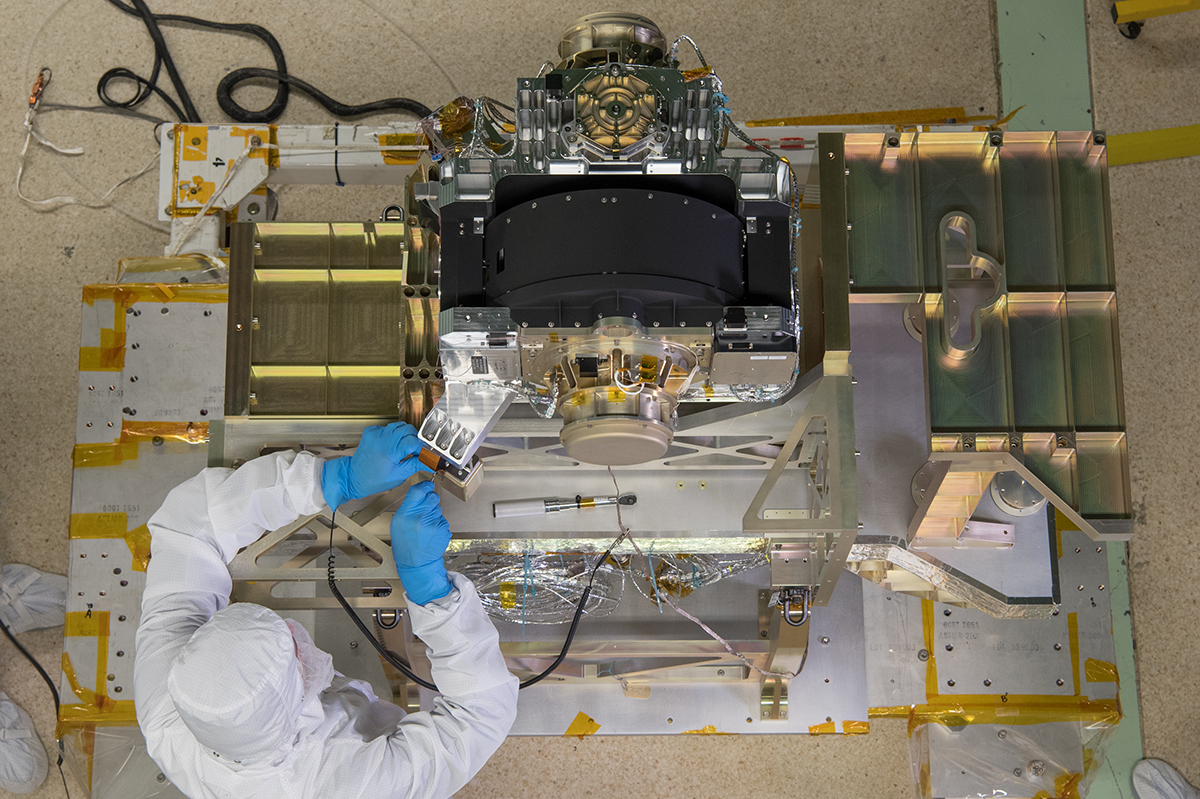
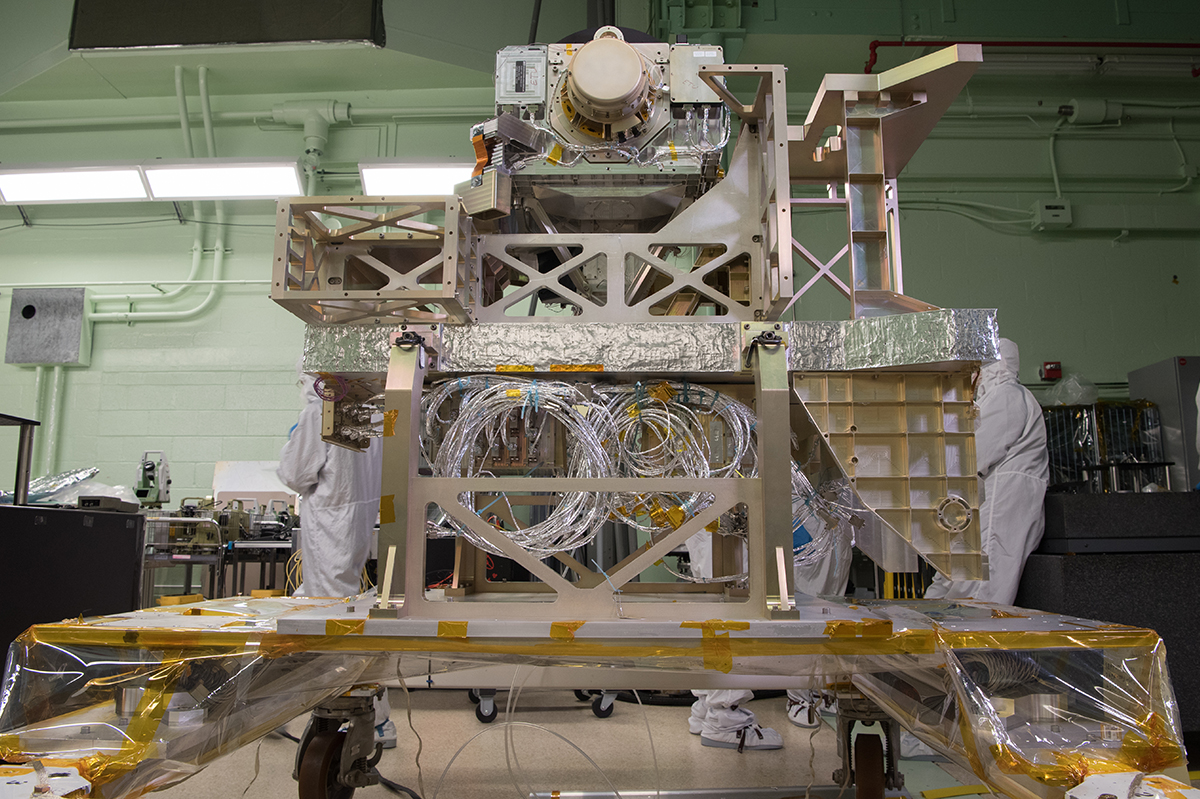
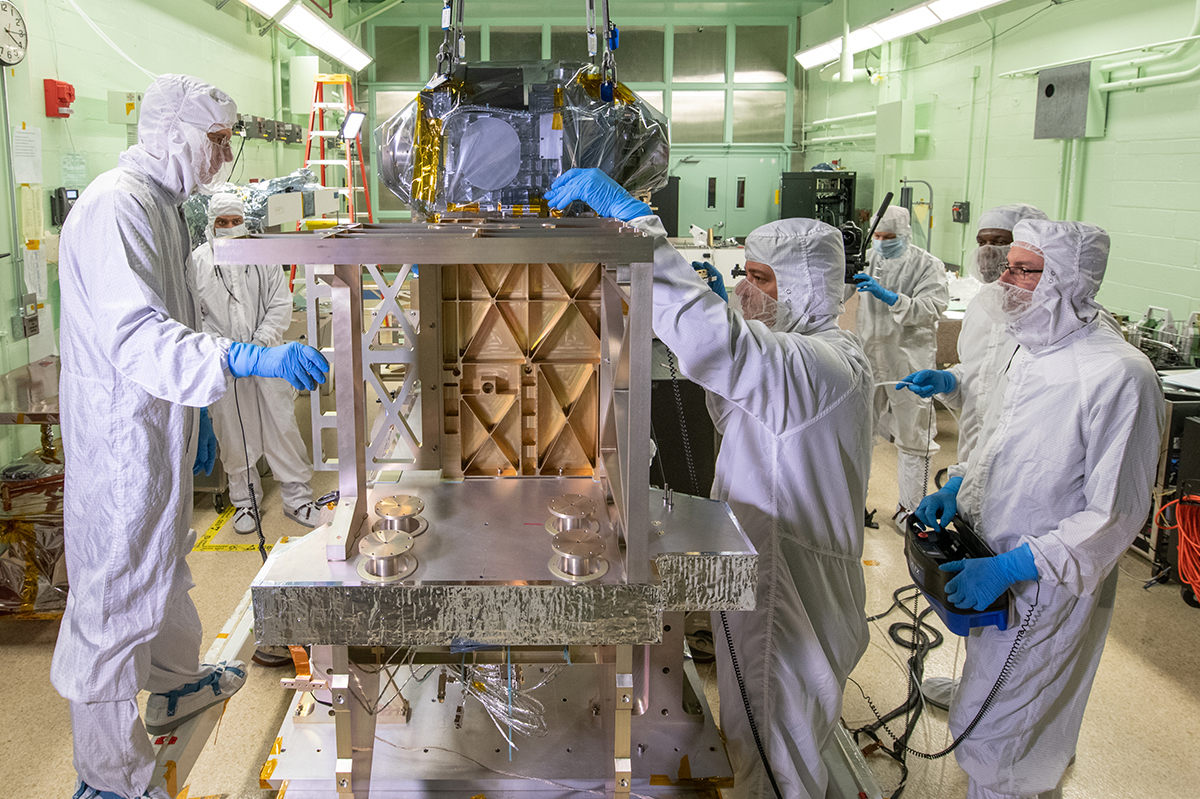
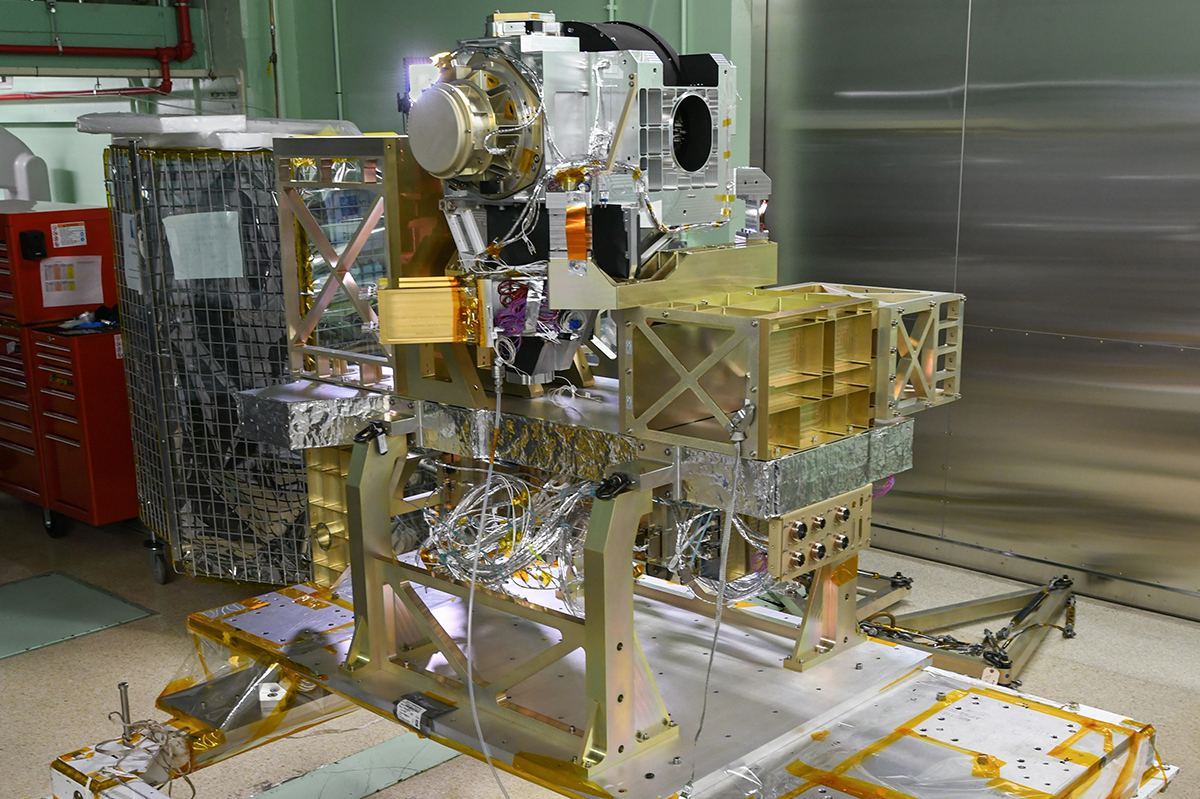
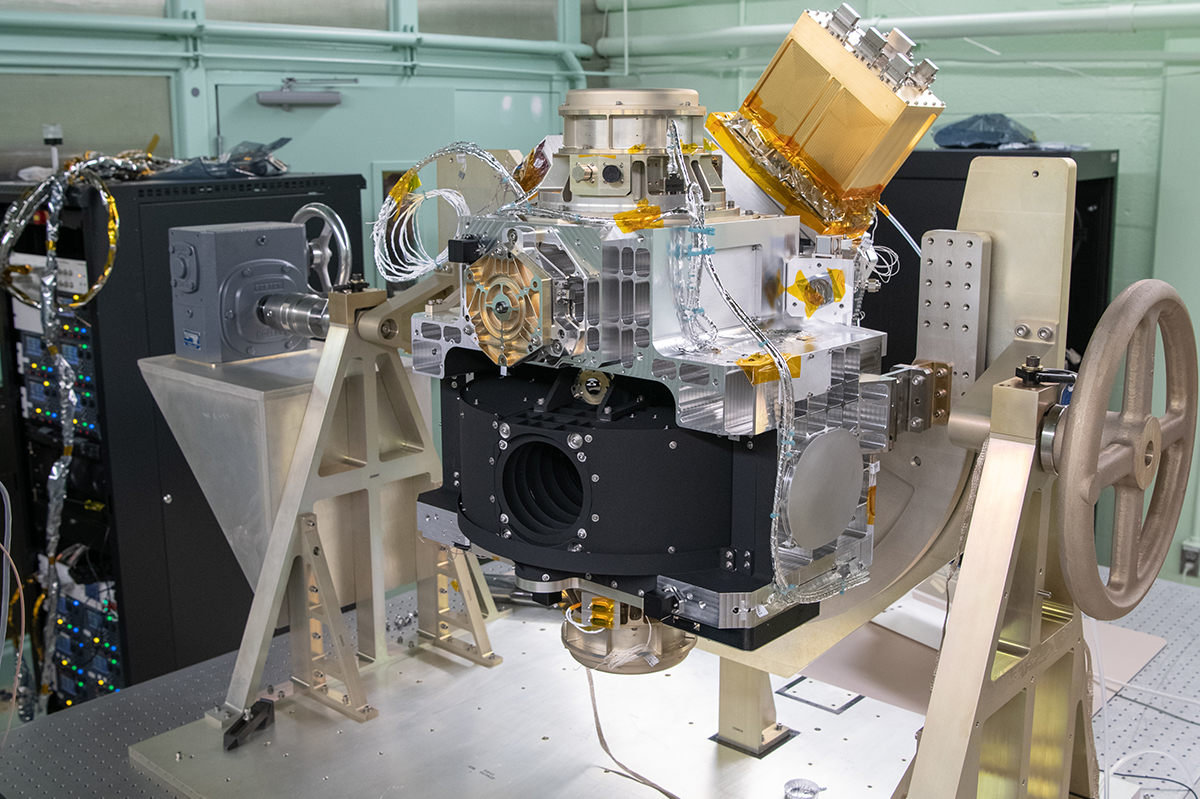
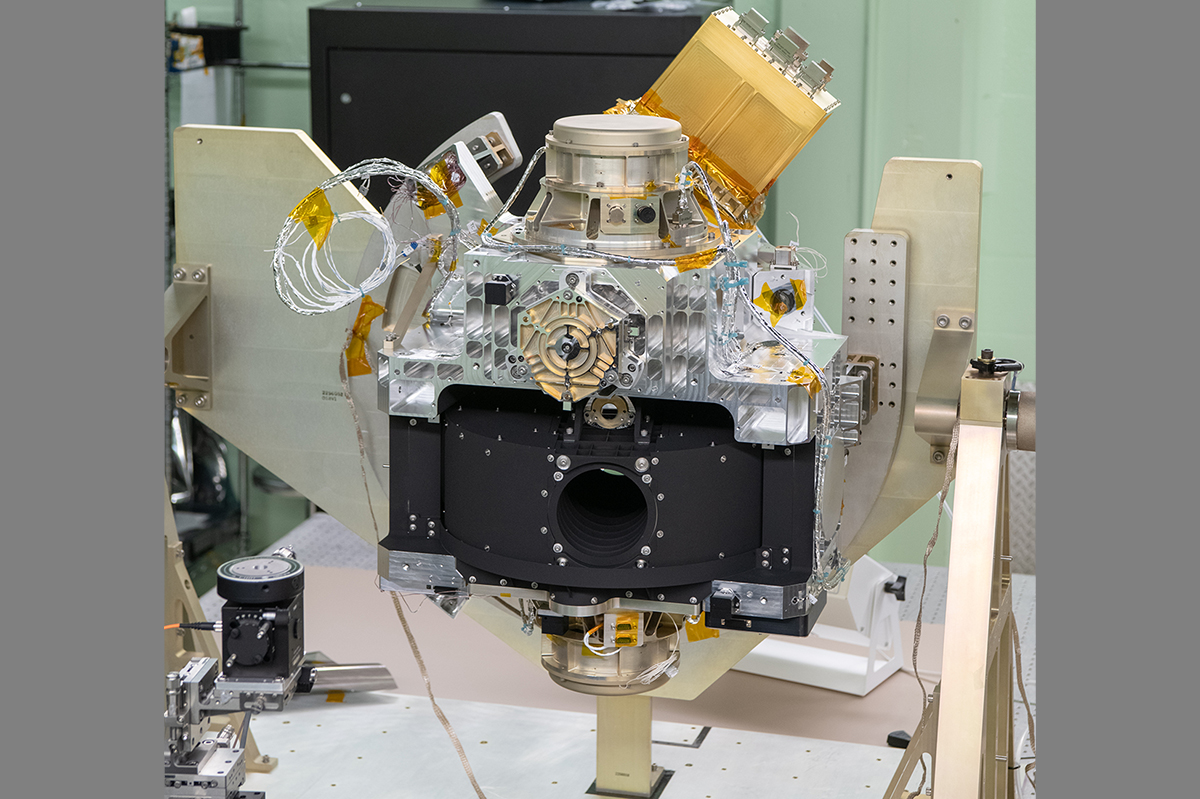
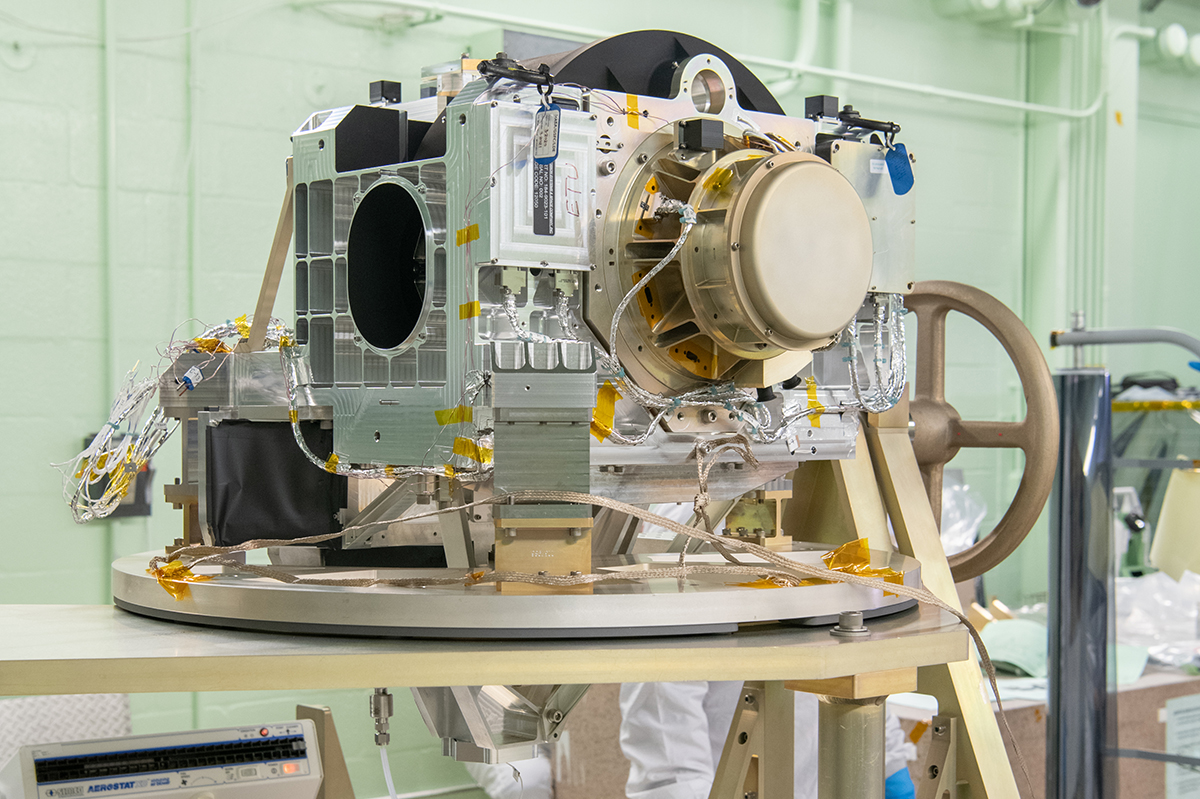
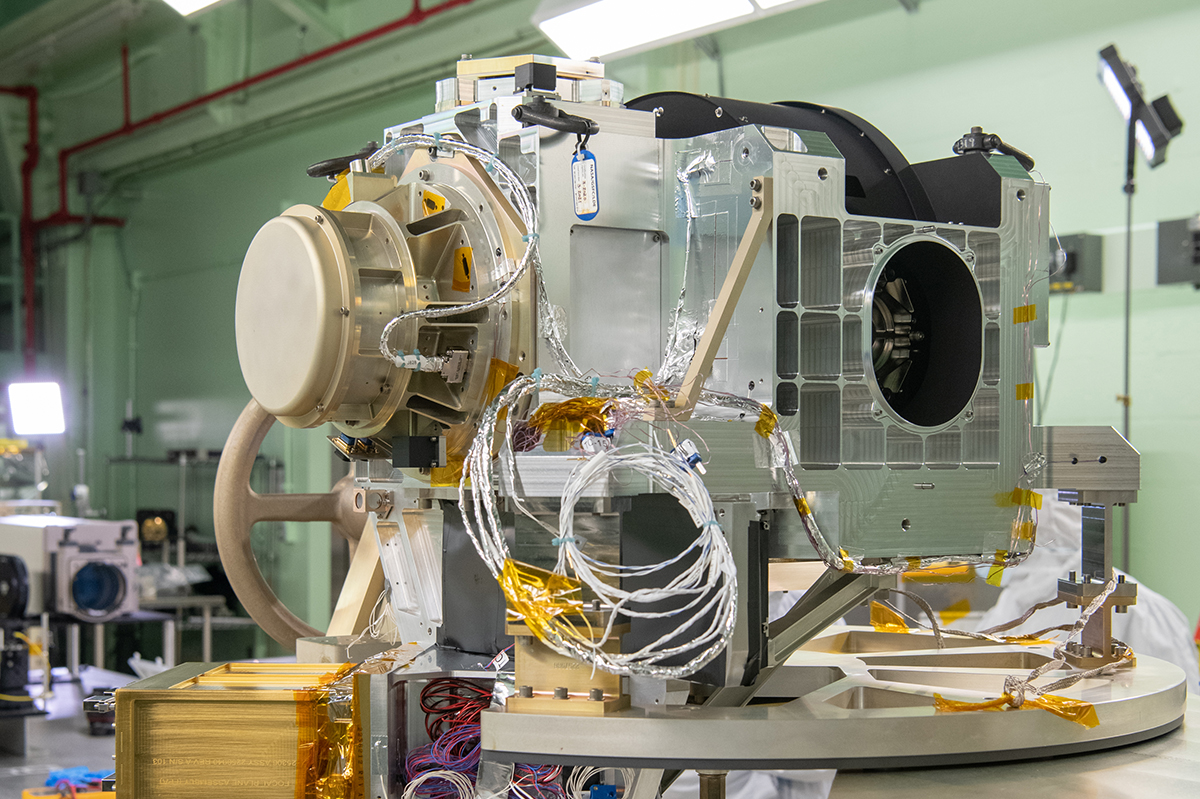
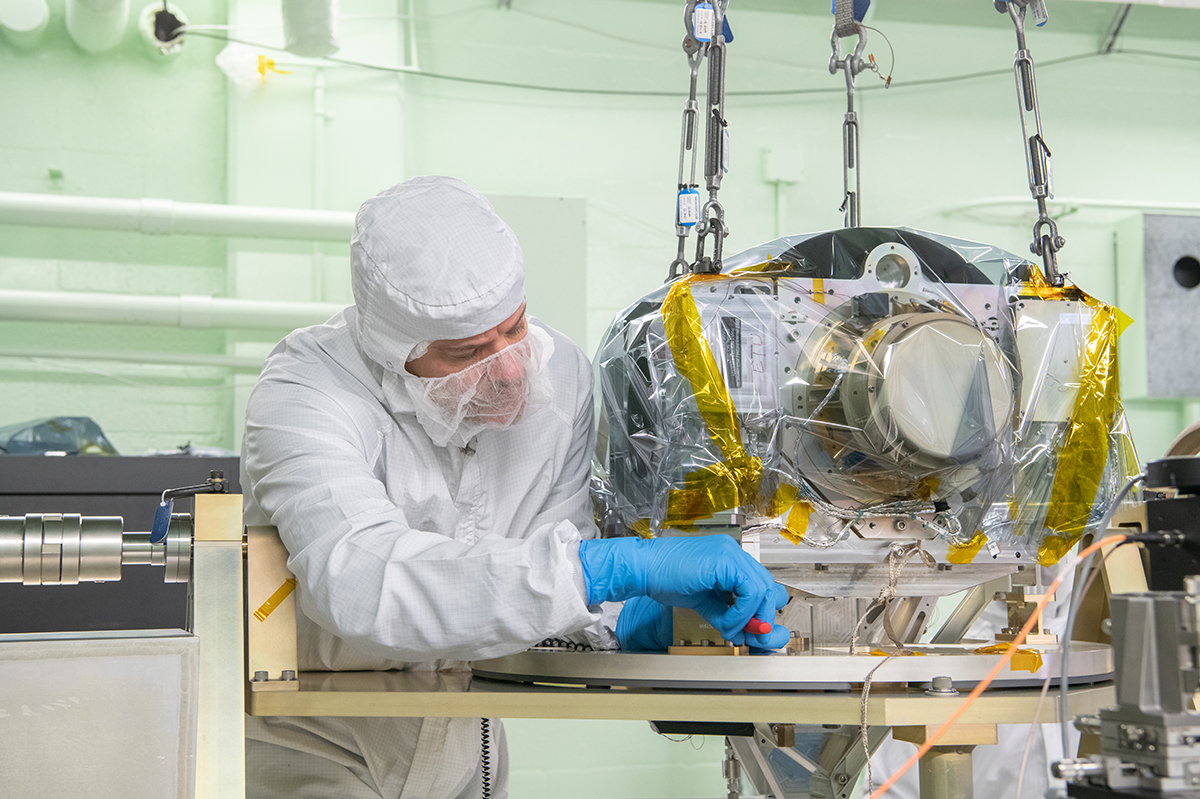
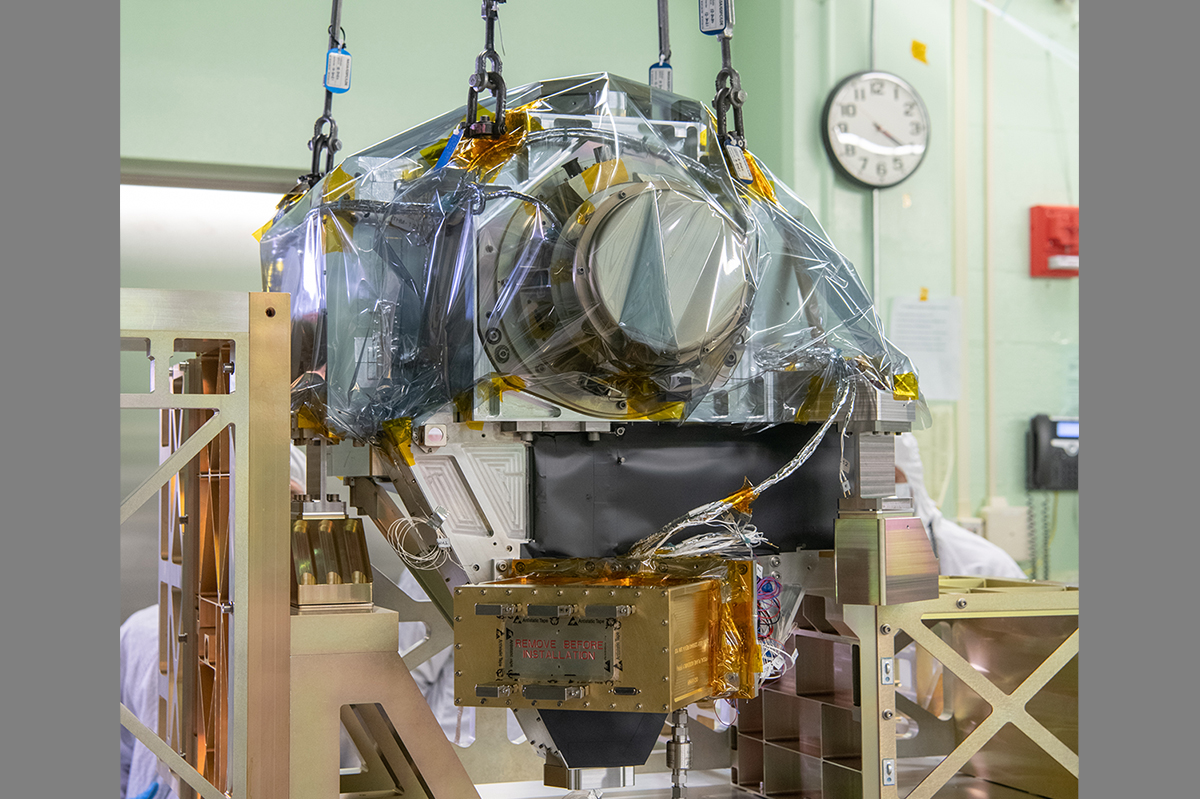
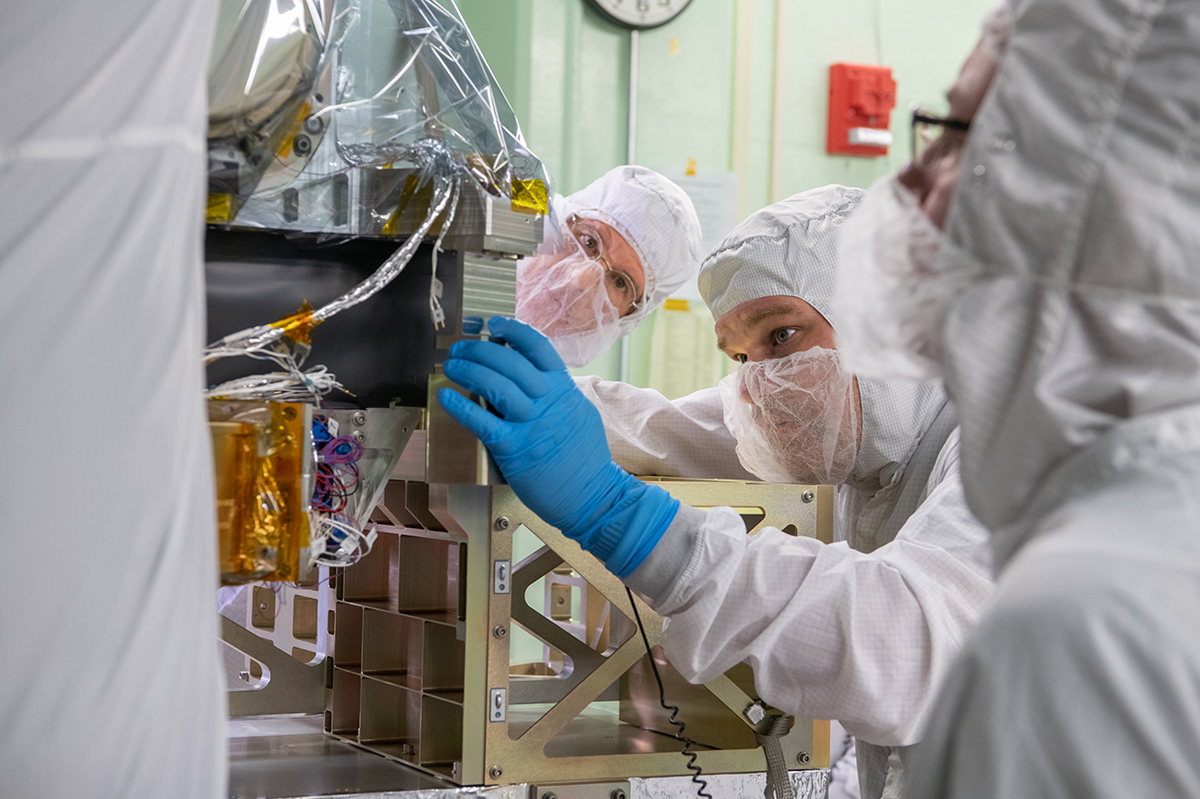
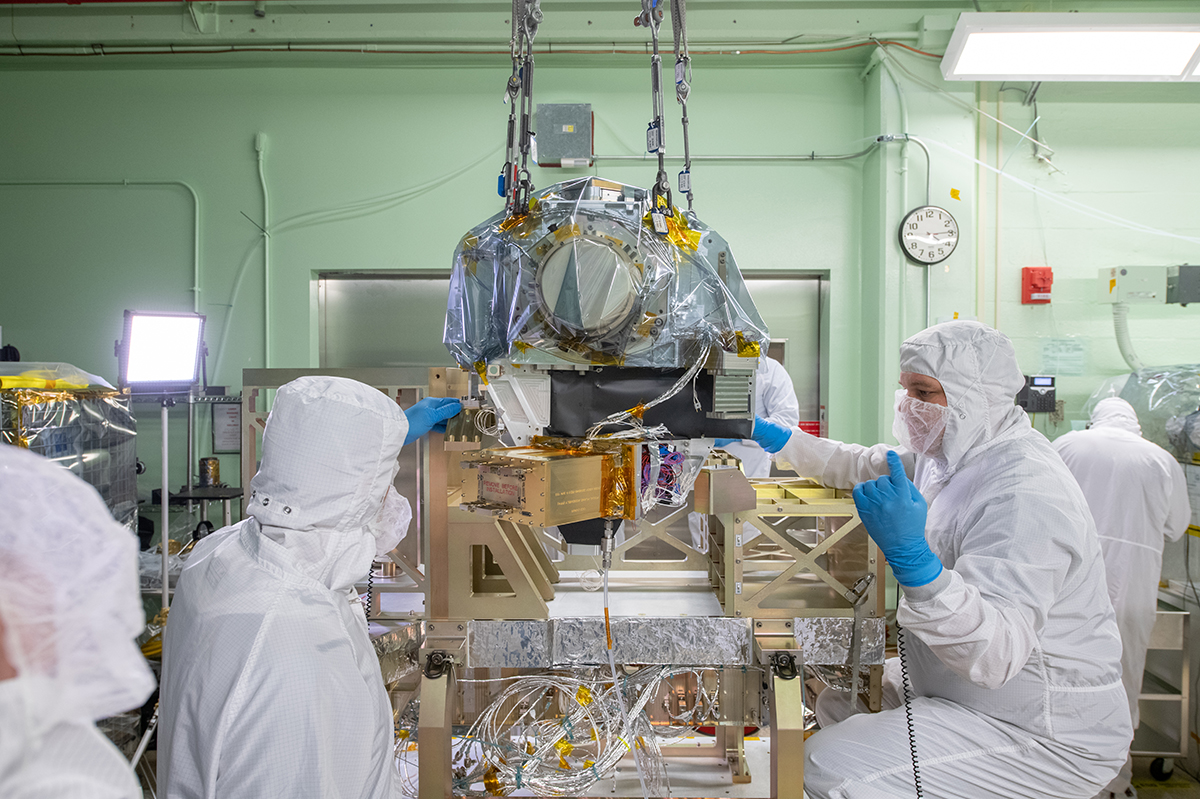
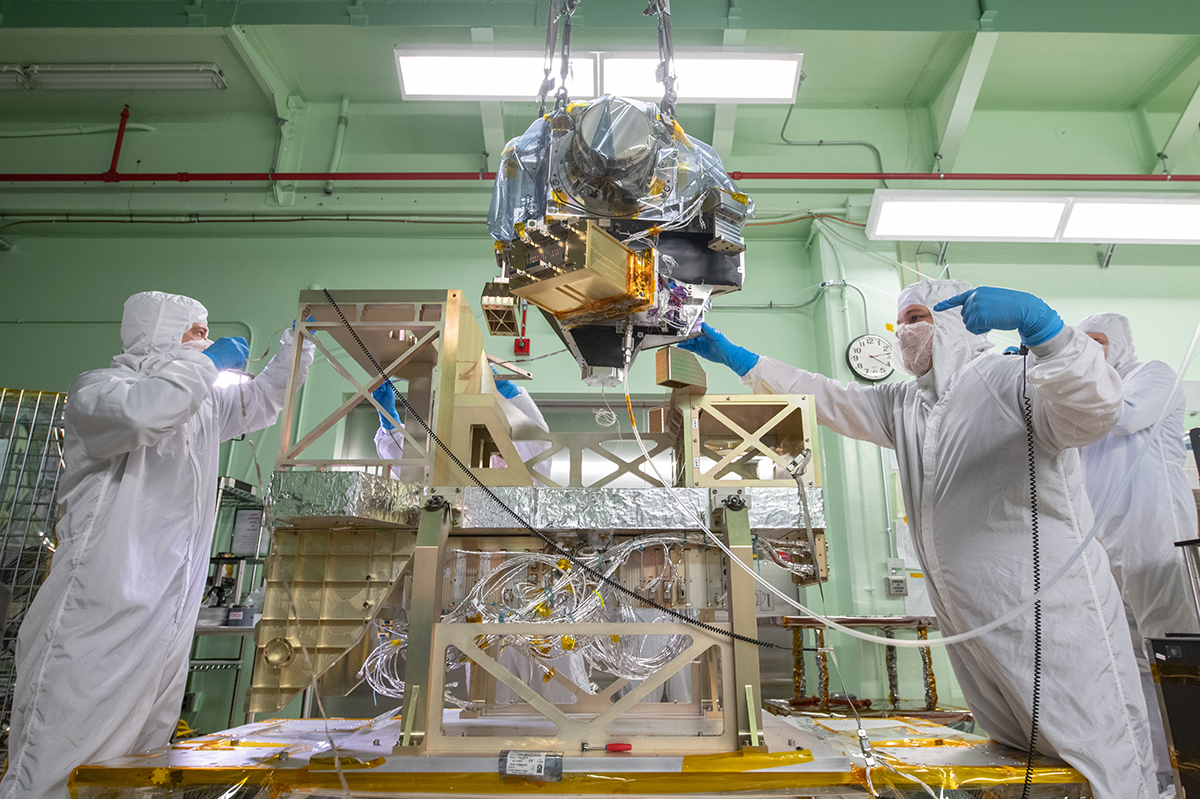
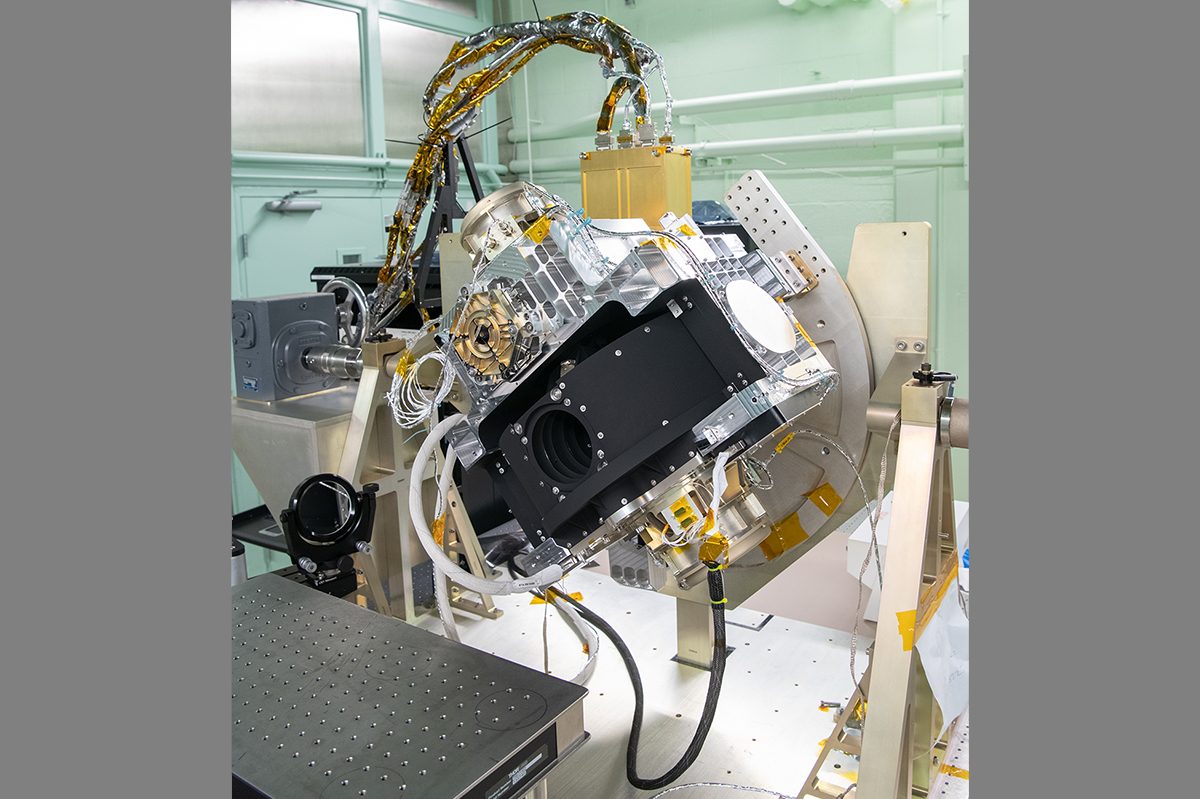
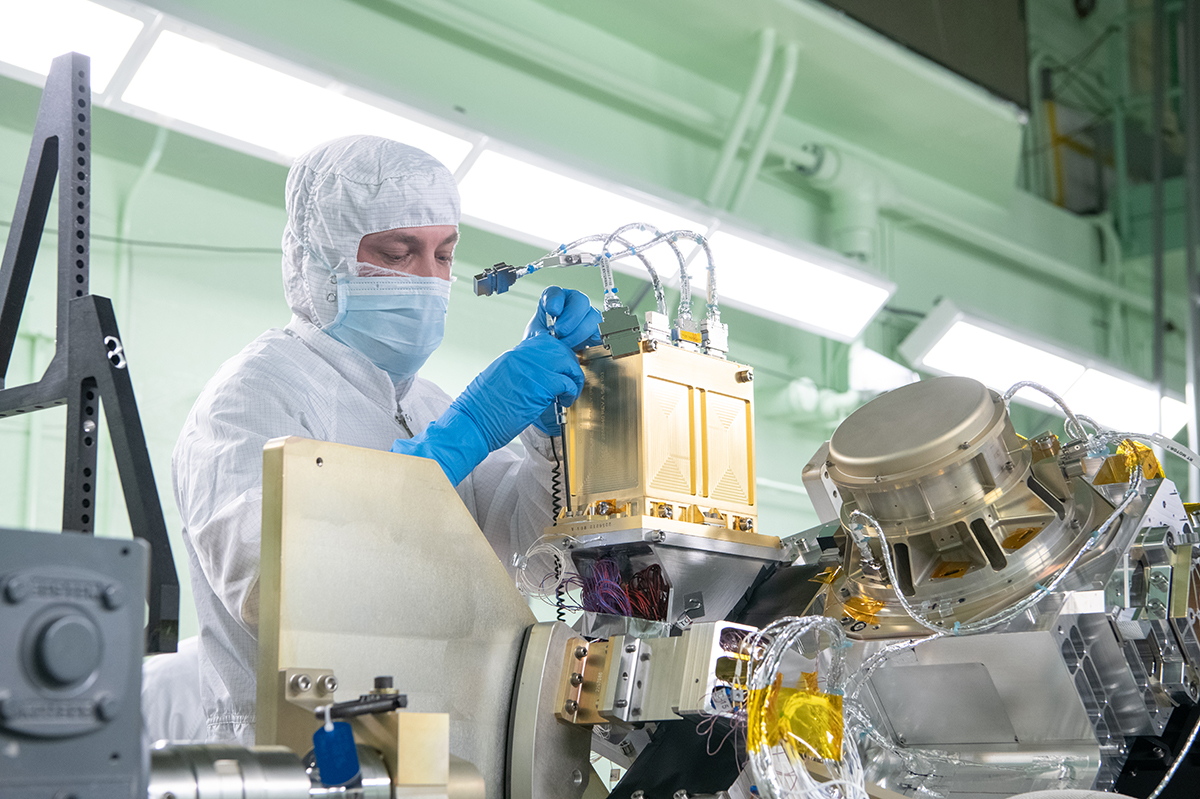
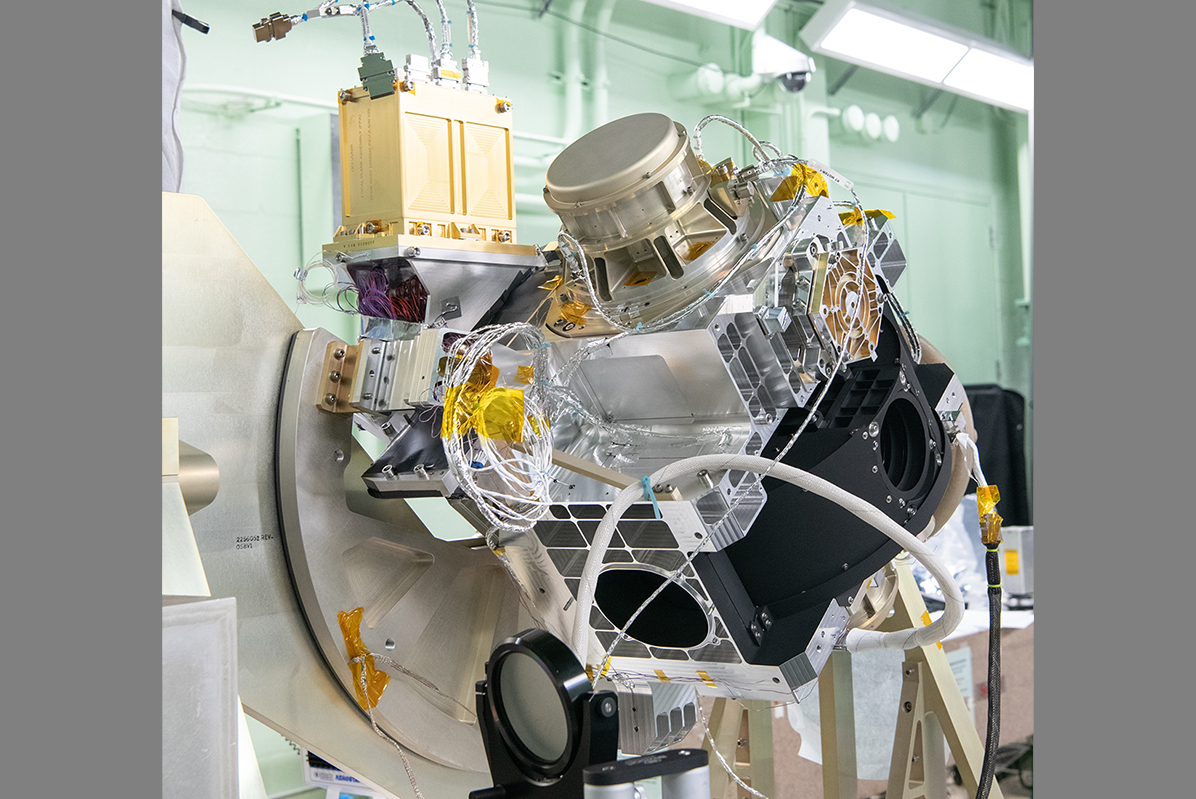
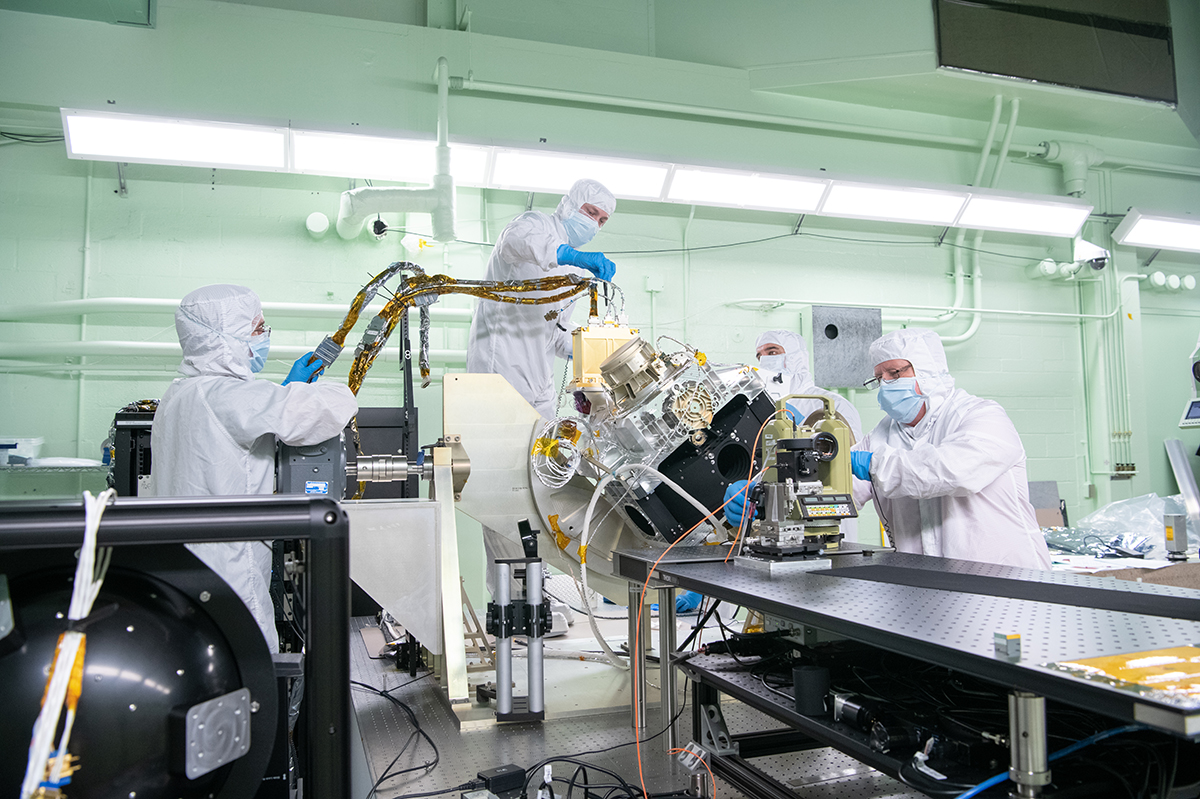
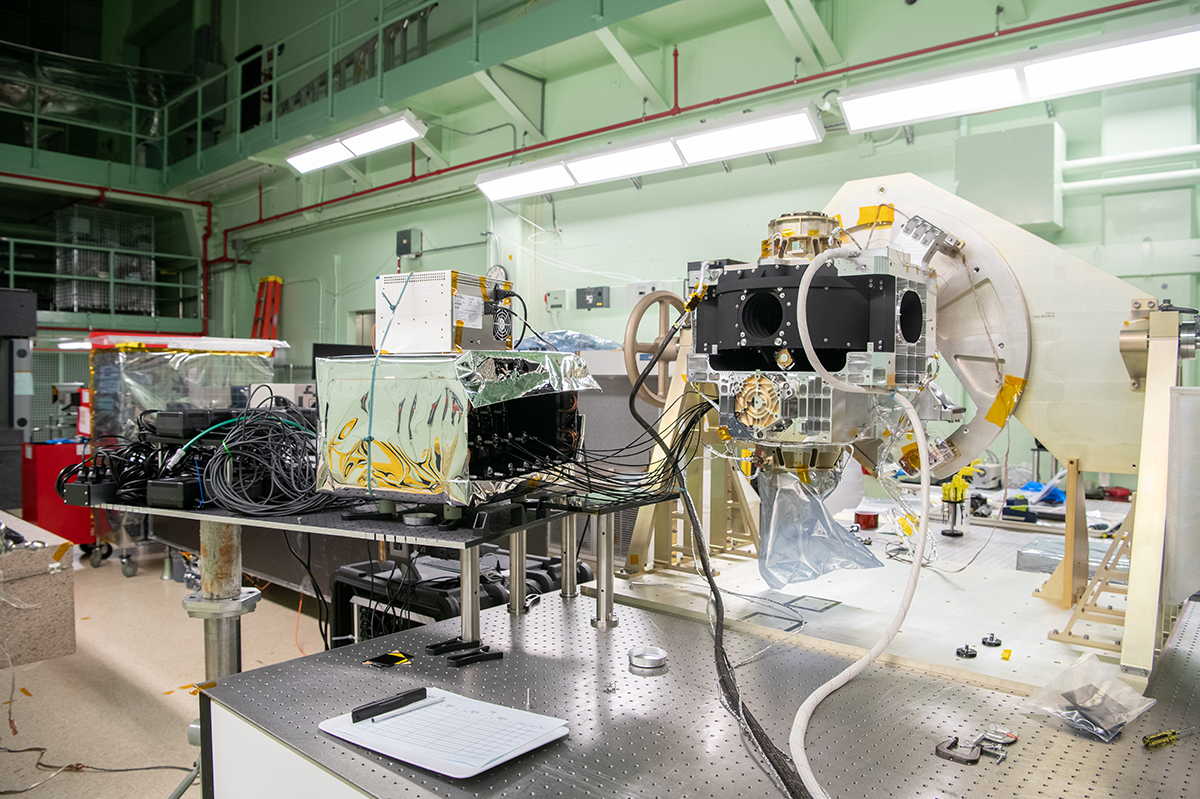
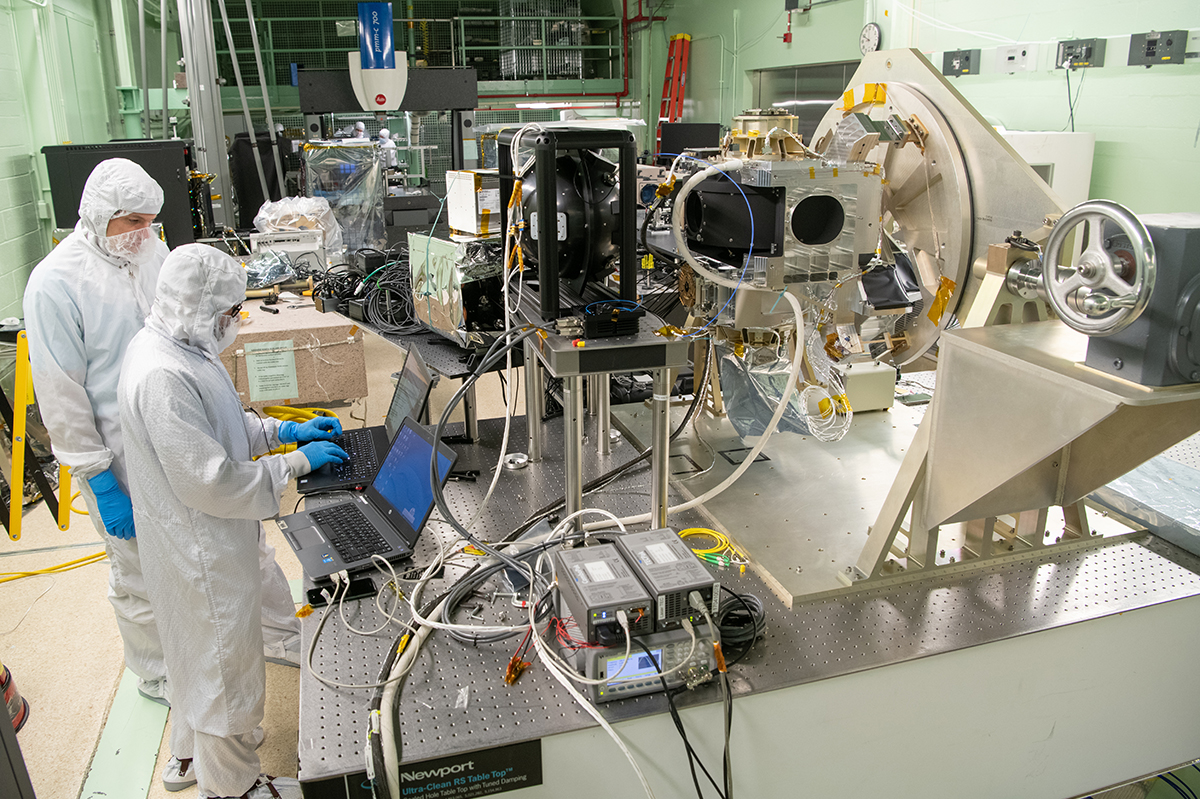
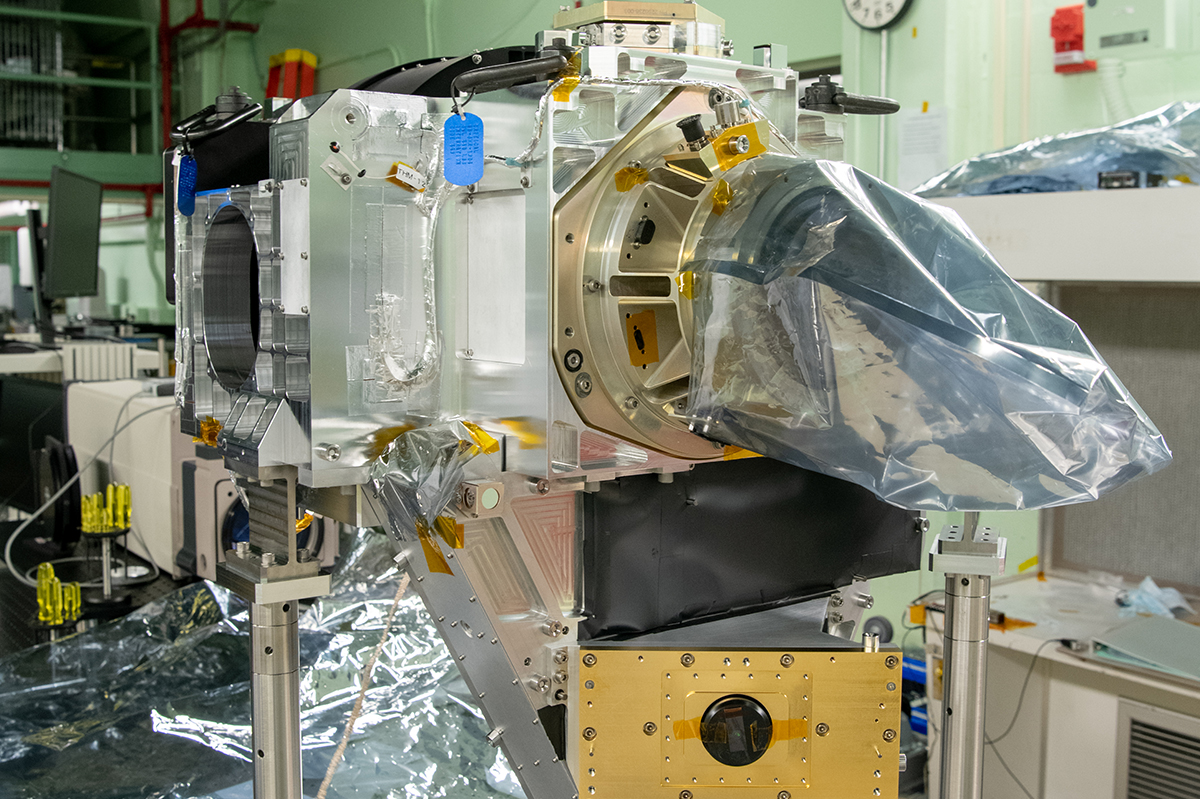
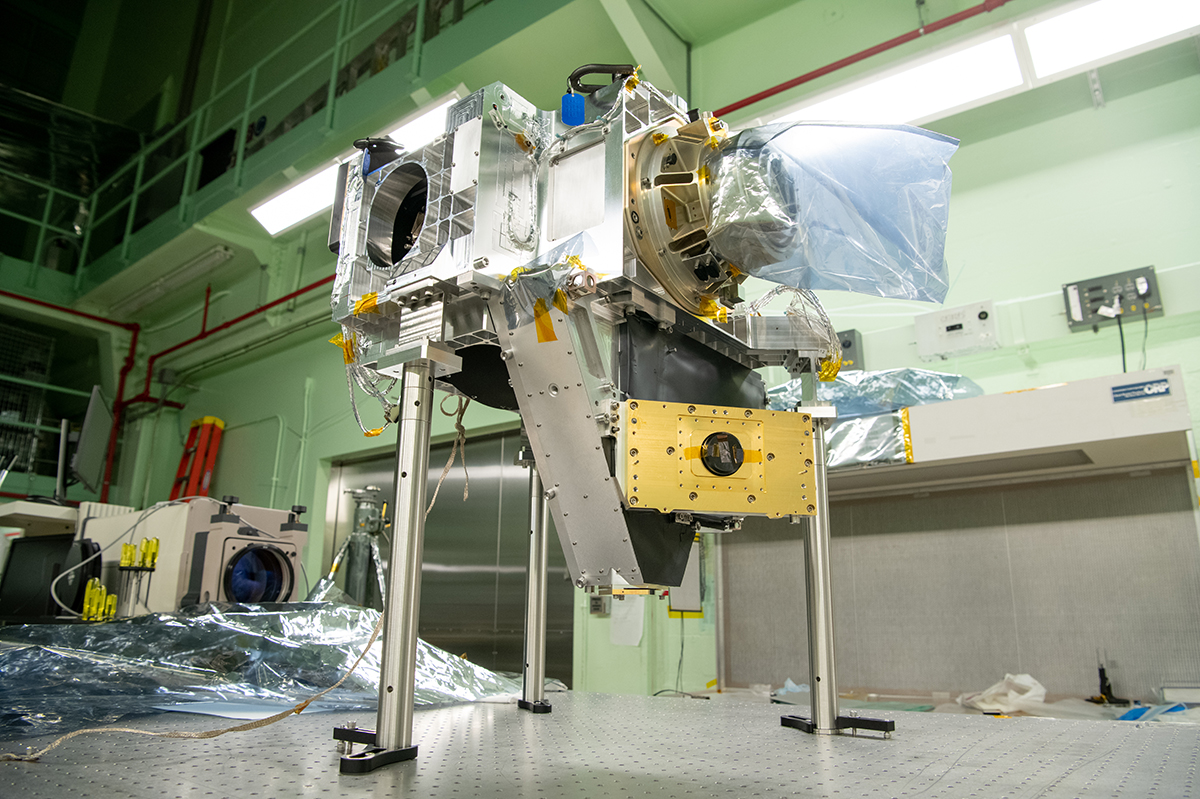
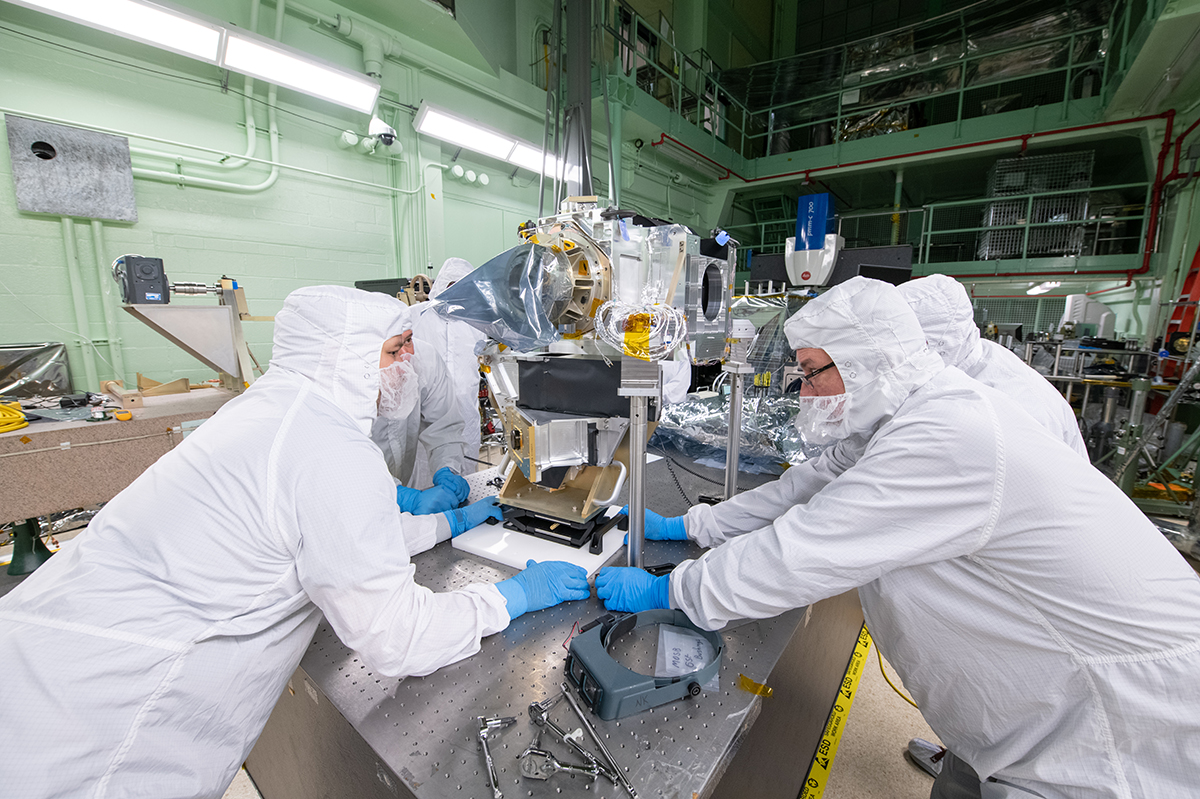
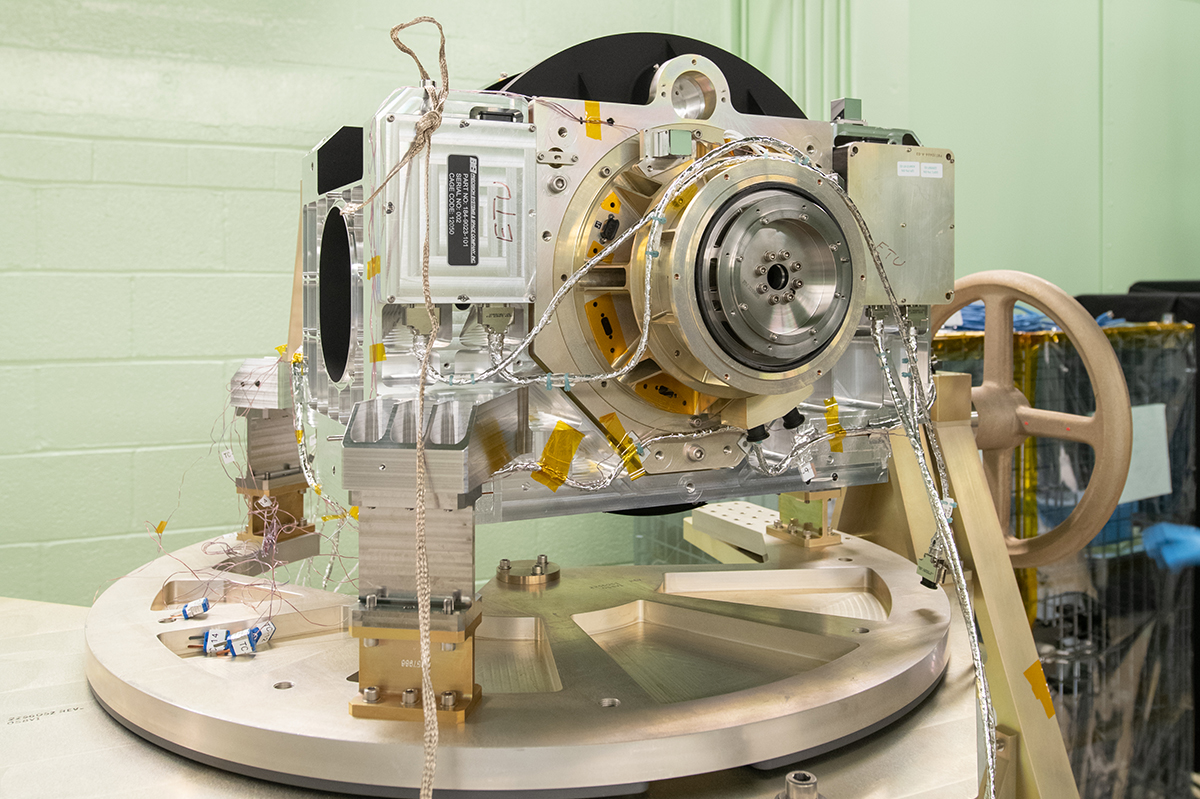
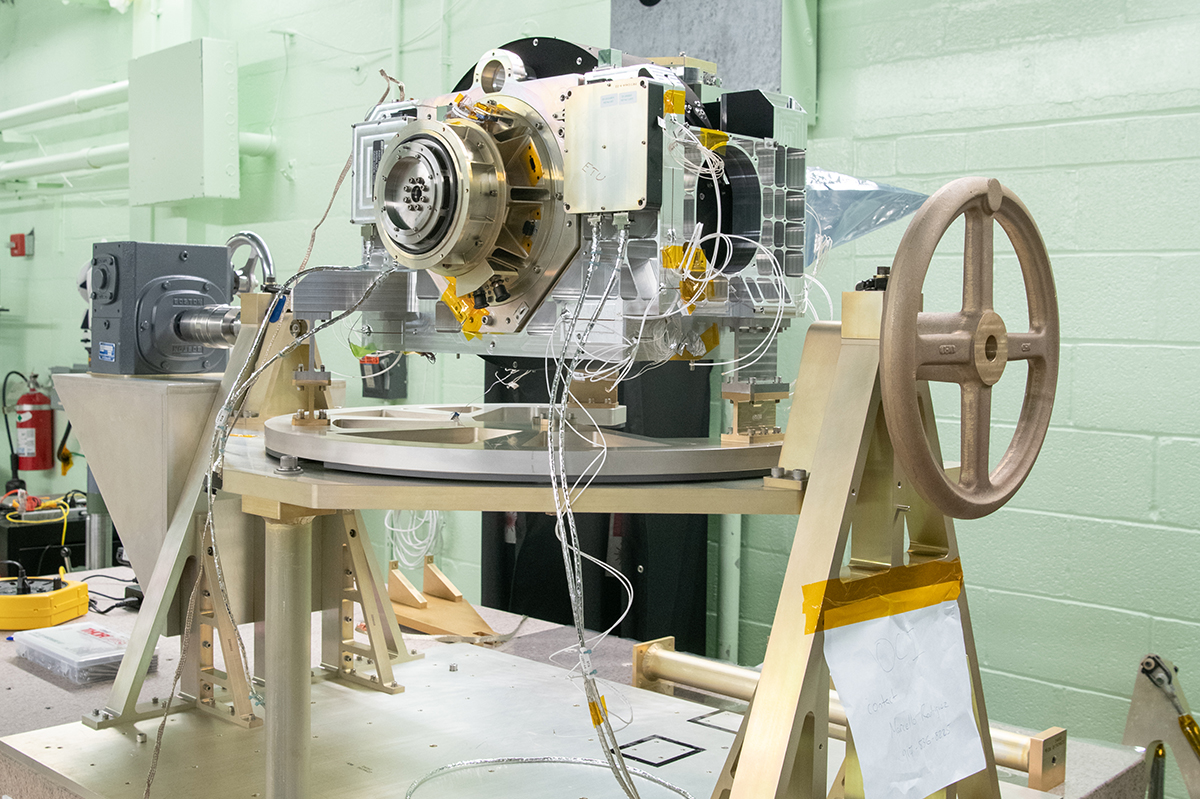
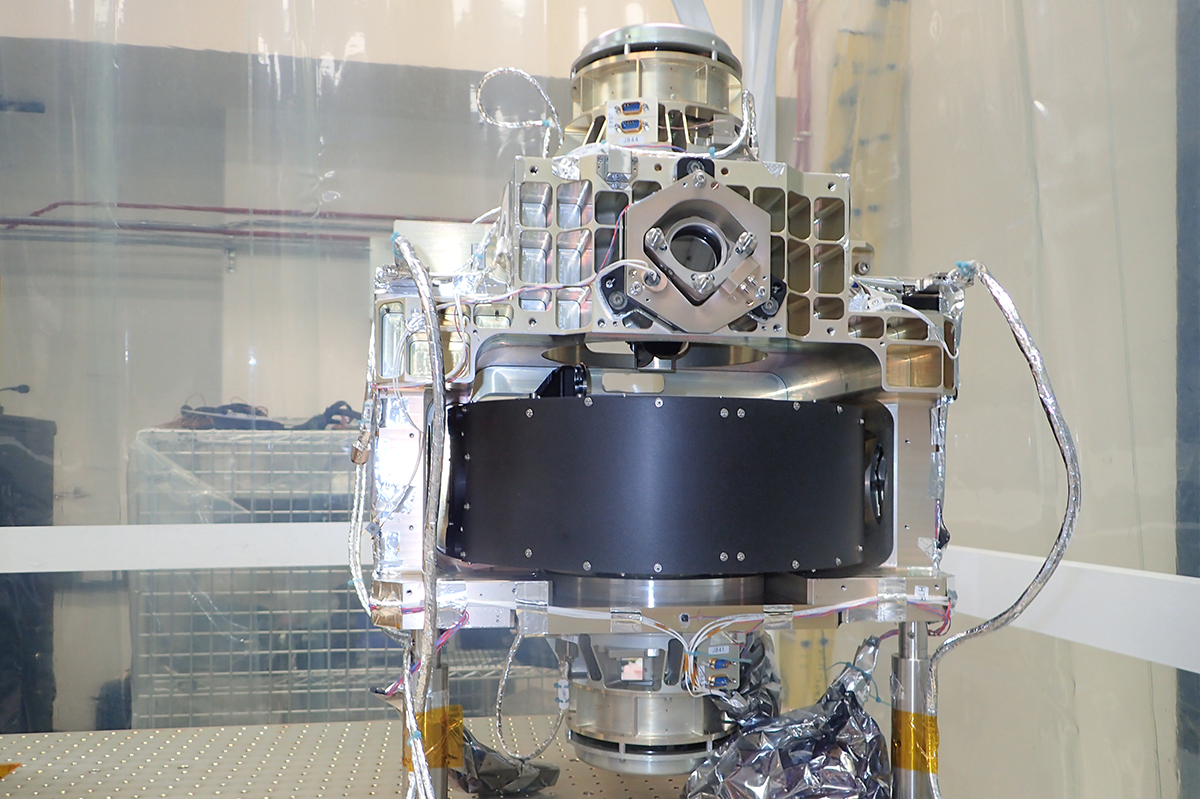
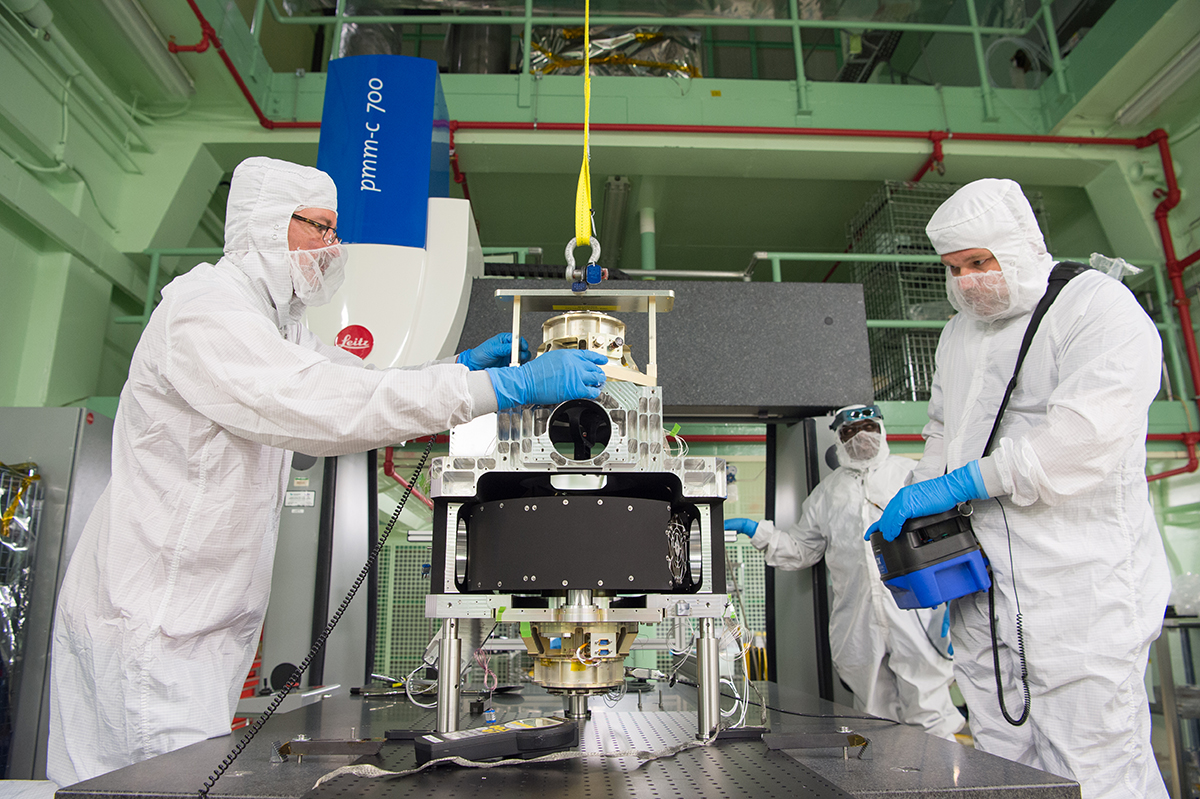
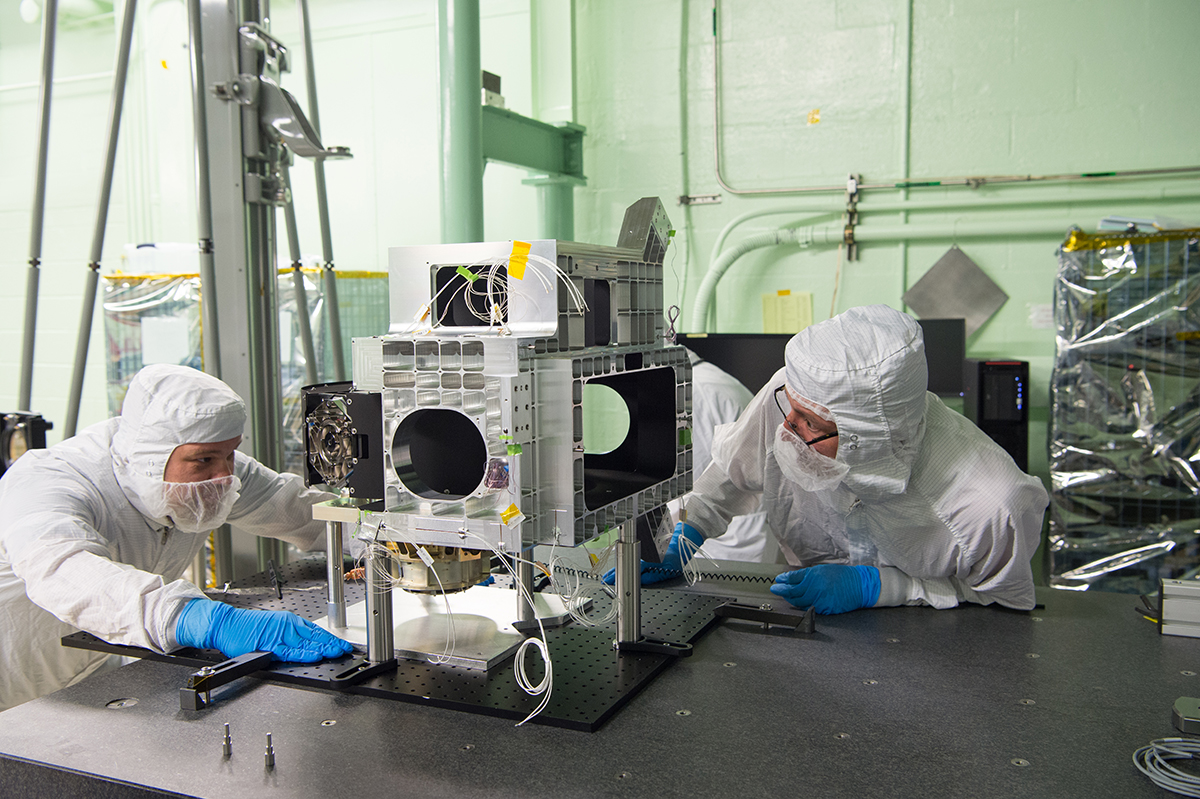
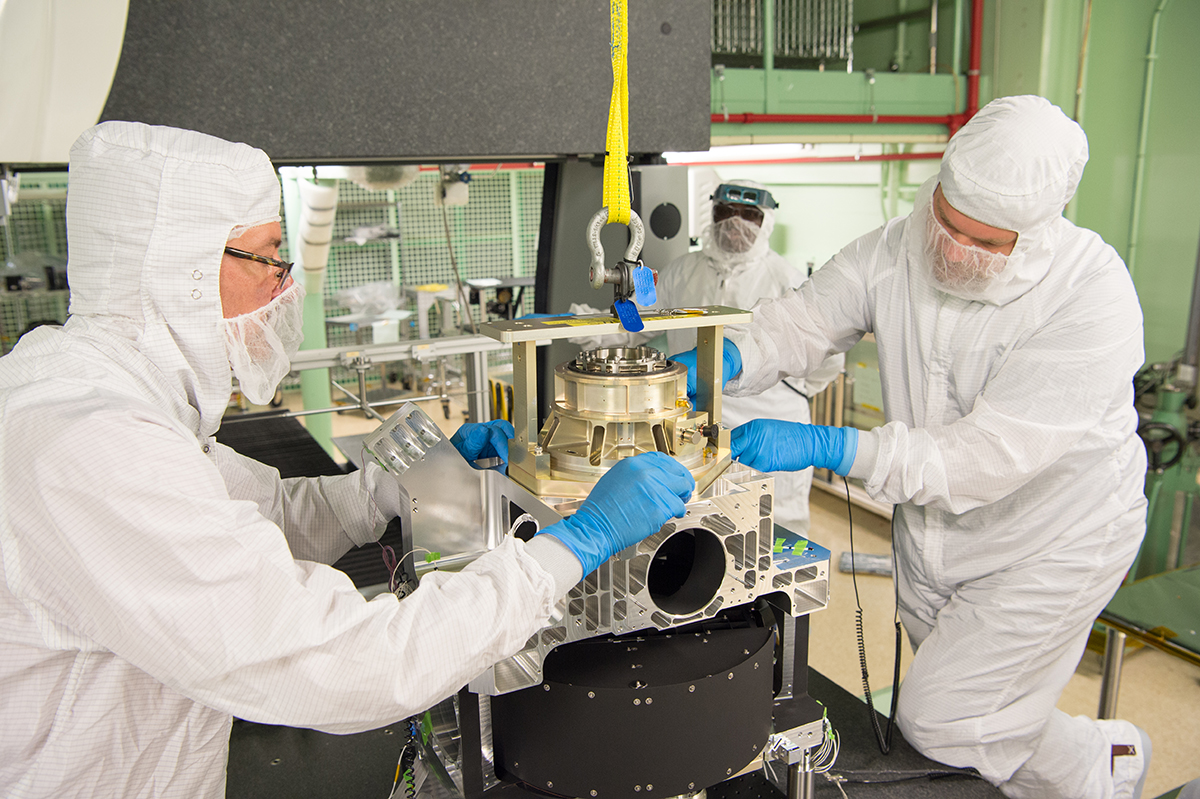
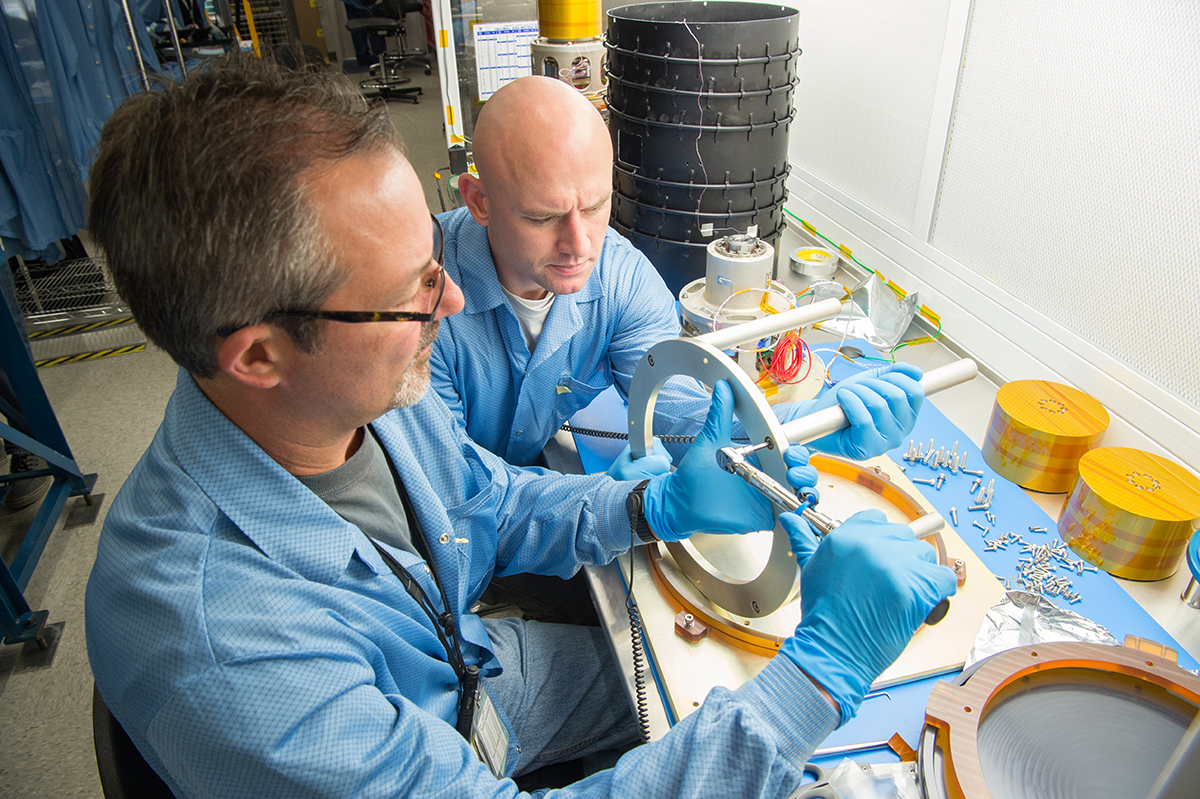
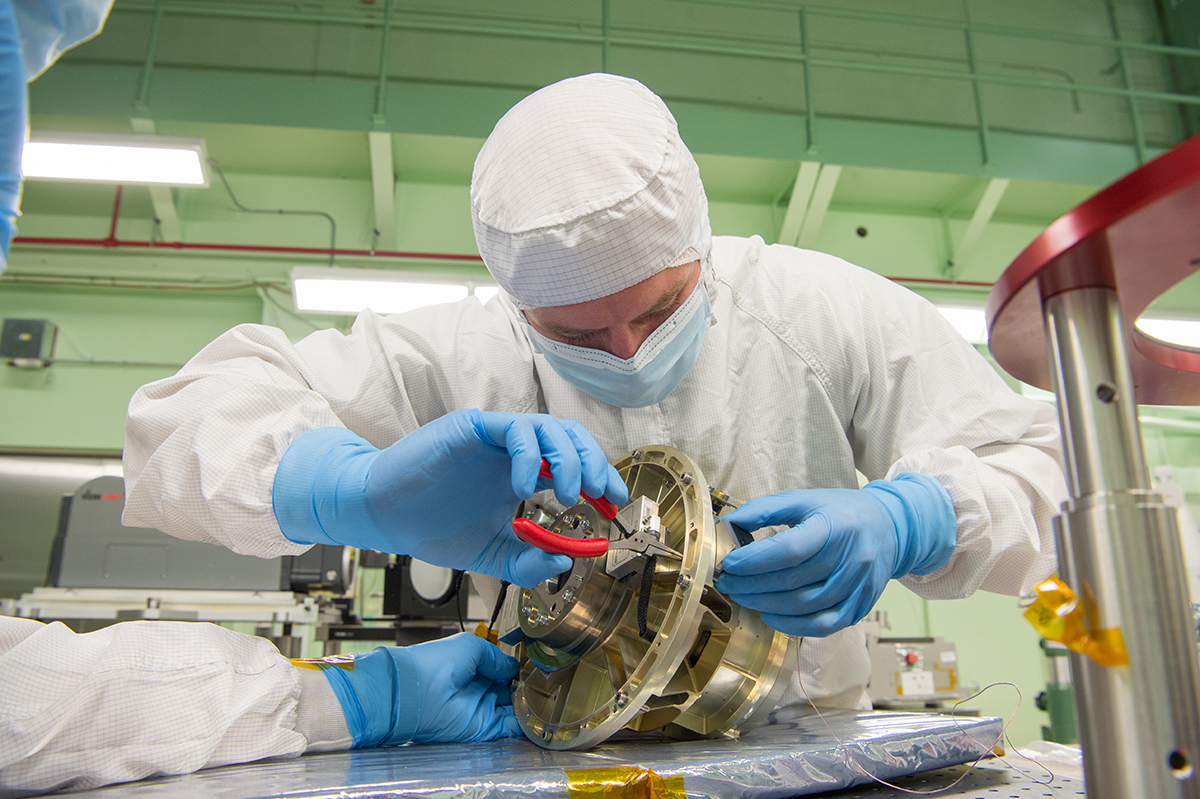
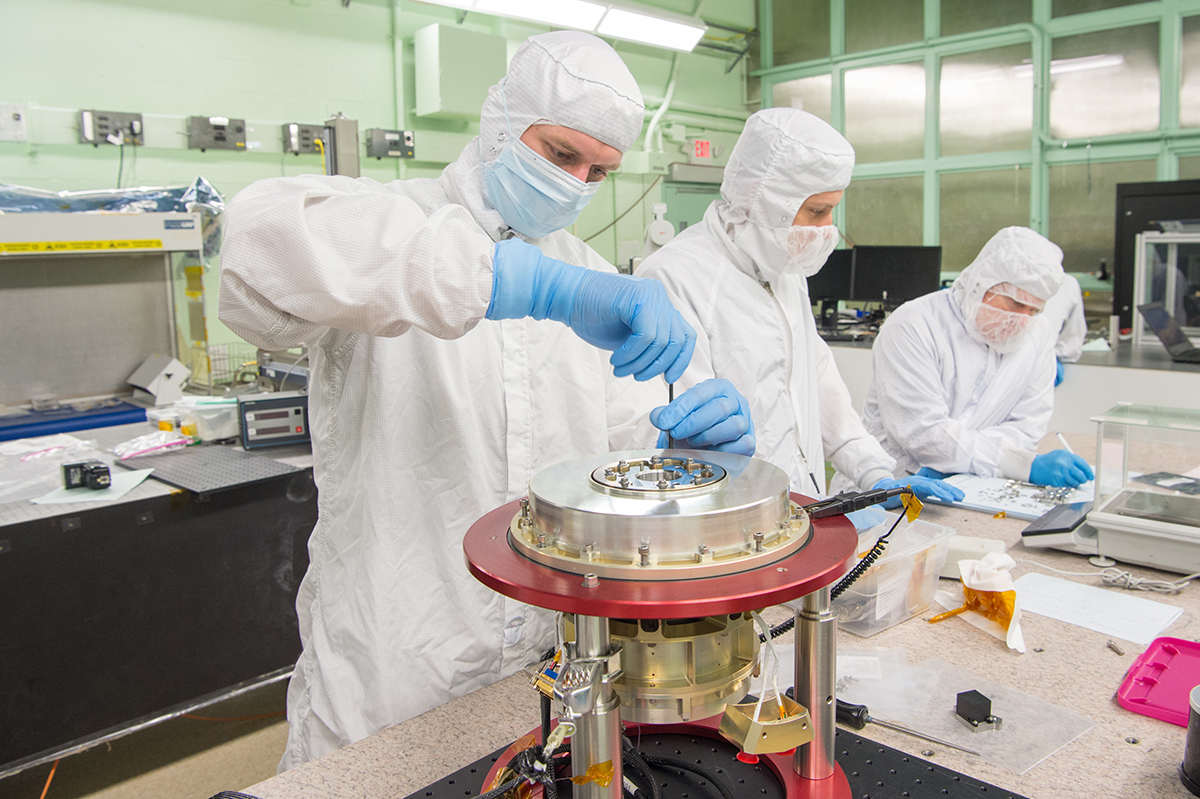
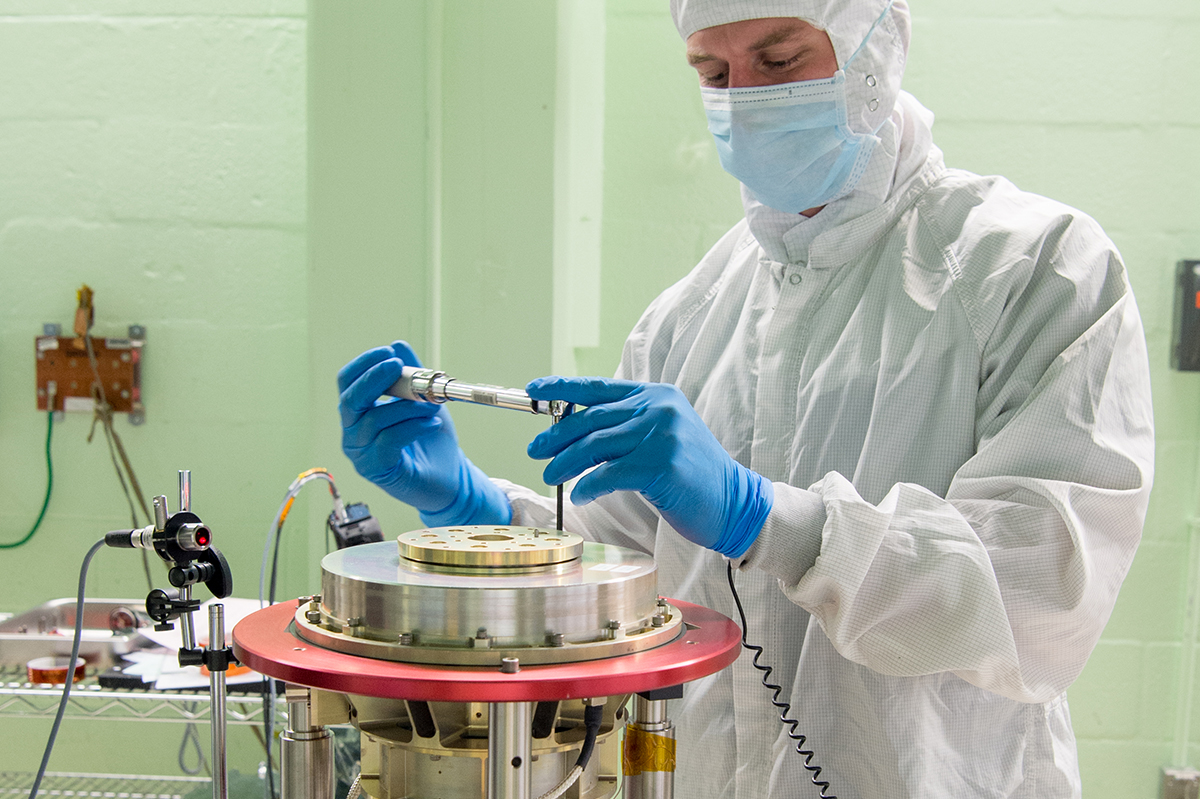
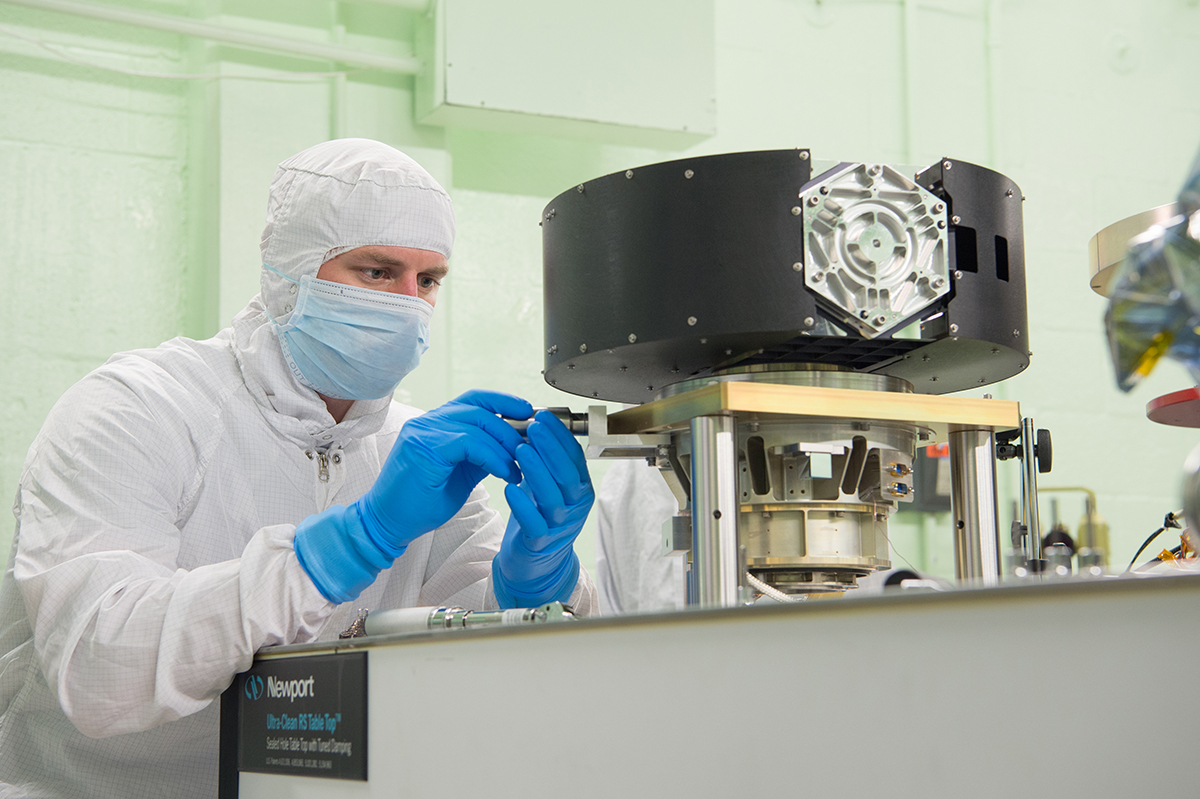
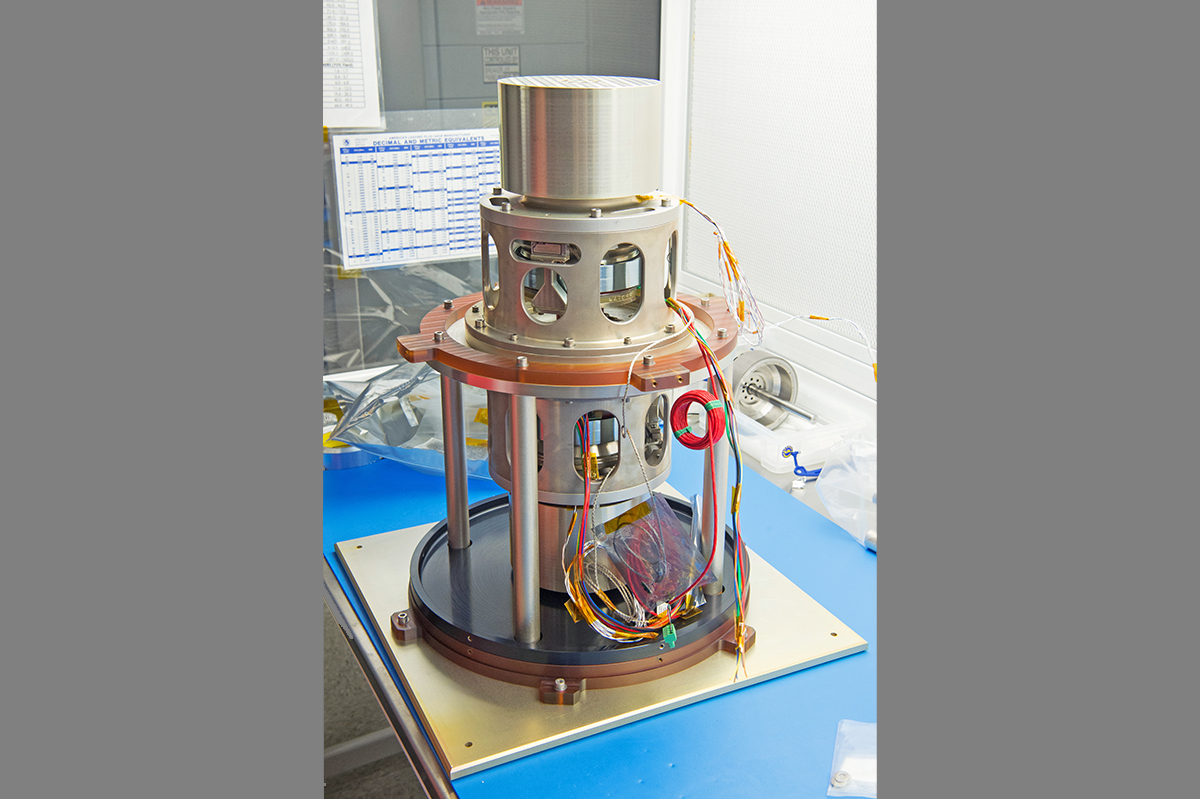
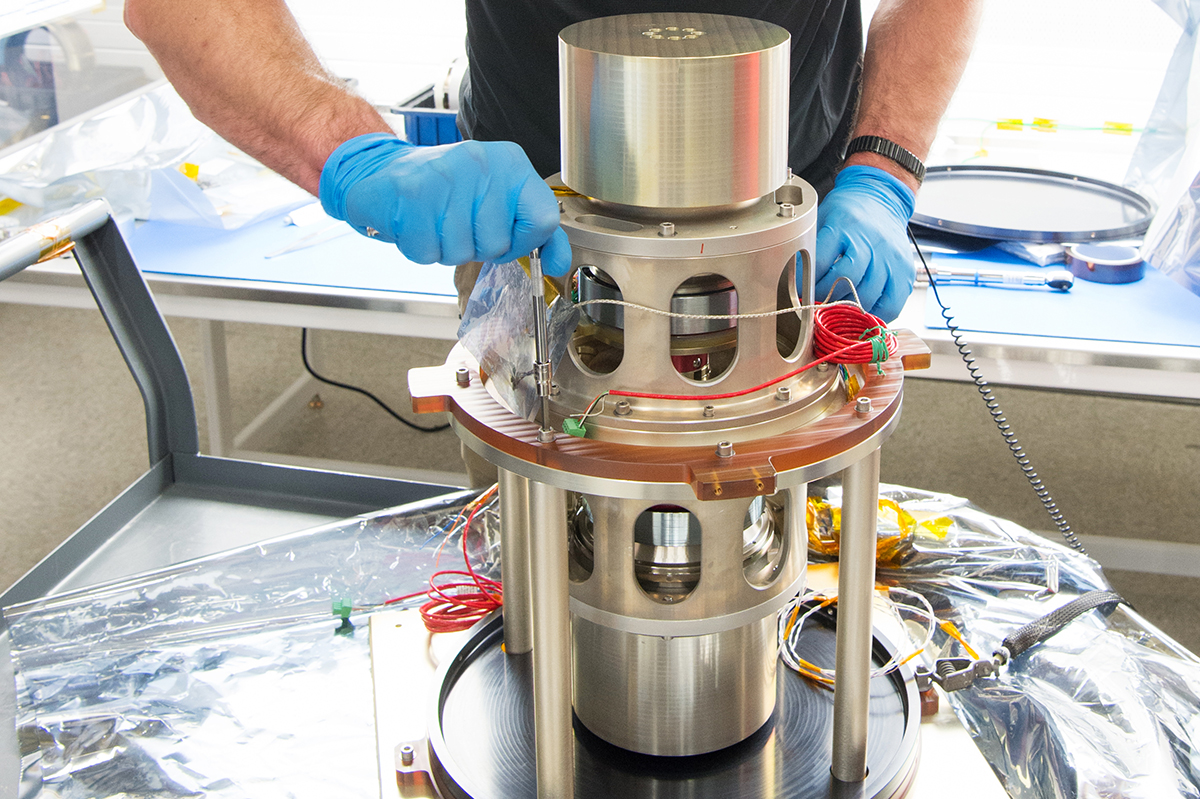
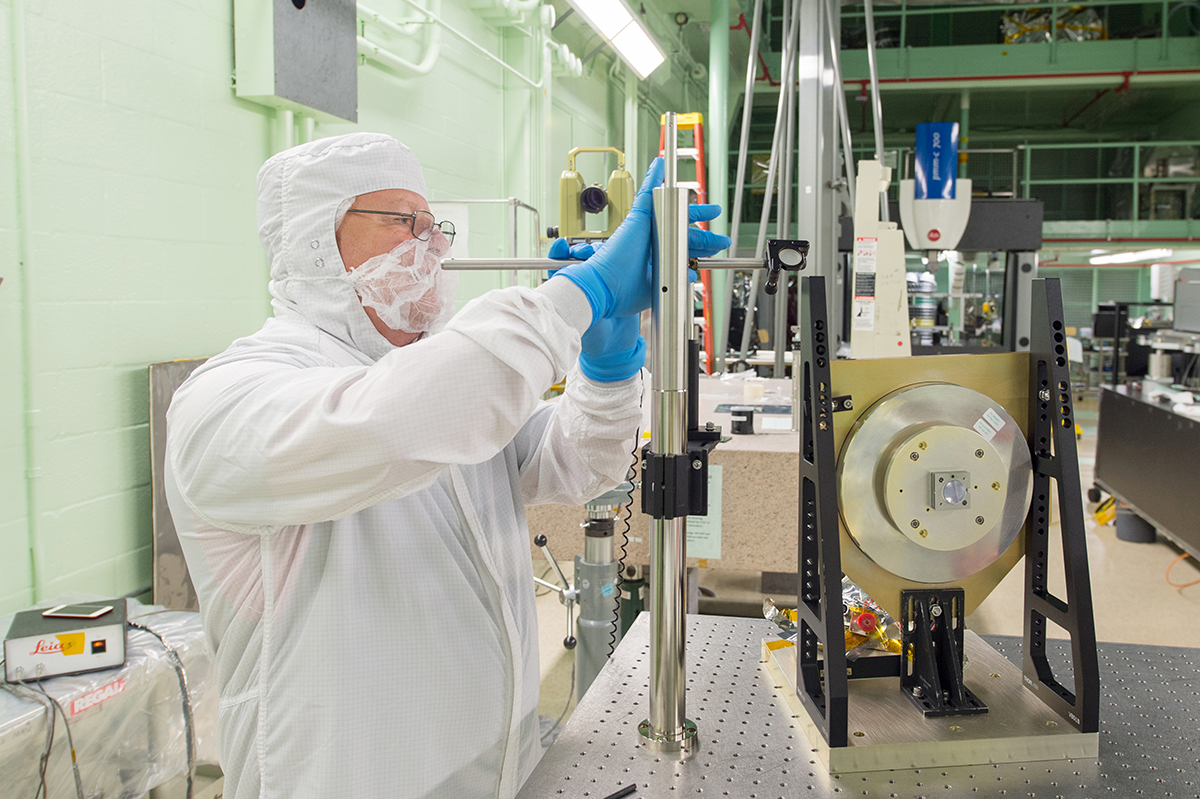
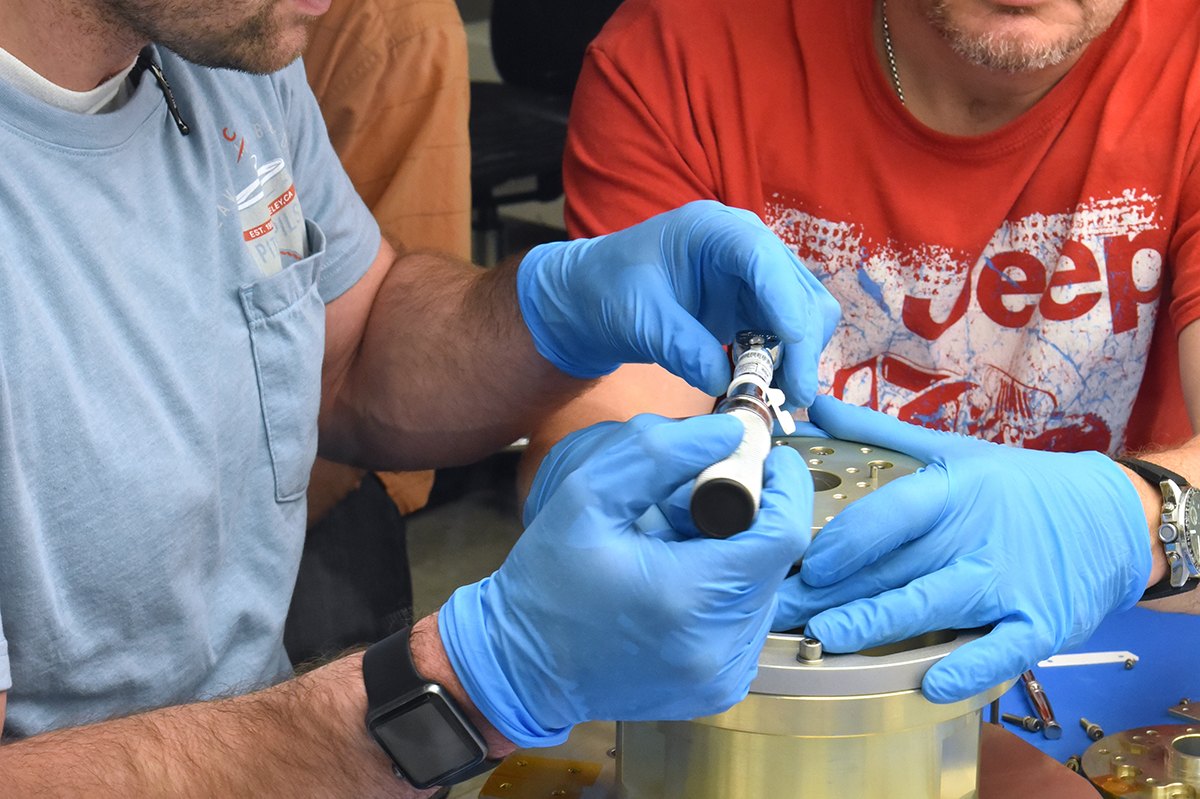
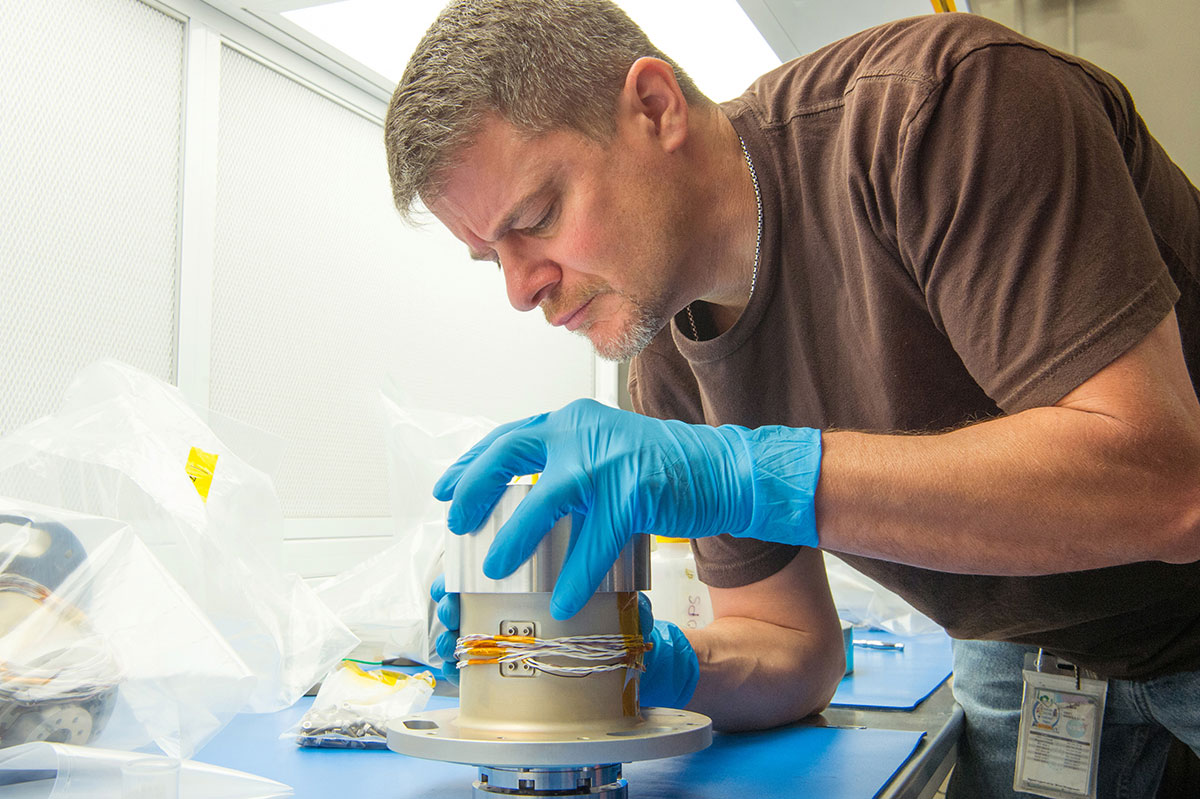
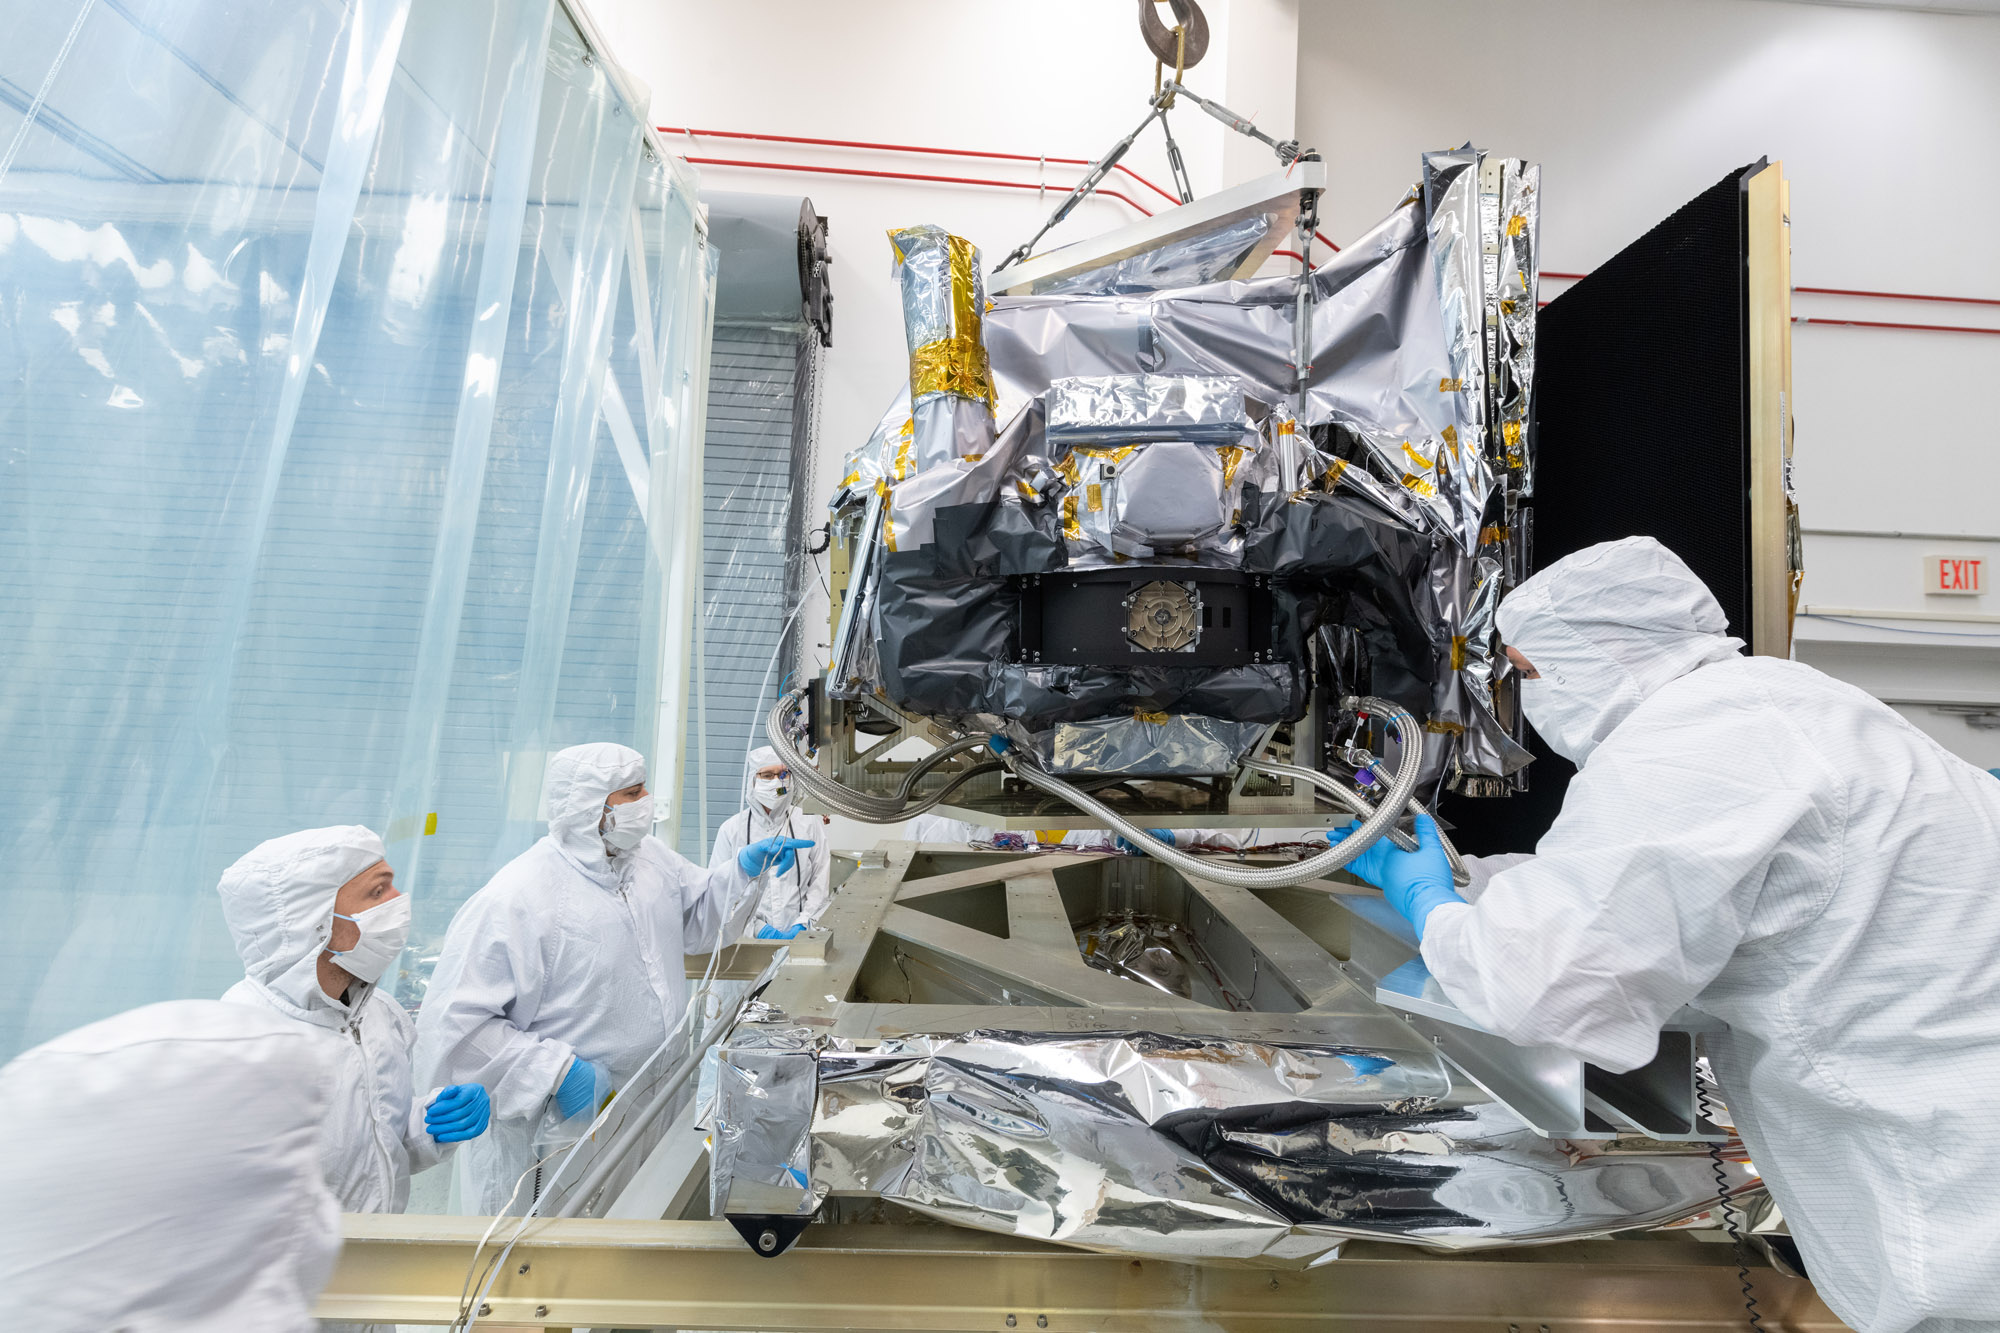
The OCI was built at Goddard Space Flight Center (GSFC). It consists of a cross-track rotating telescope, thermal radiators, along with half-angle mirror and solar calibration mechanisms. The OCI’s tilt helps avoid sun glint and its single science detector design inhibits image striping. Its signal-to-noise ratios rivals or exceeds previous ocean color instruments. A detailed overview of OCI instrument design and prelaunch calibration is provided in Meister et al. (2024).
The OCI features:
- Cross-track, 360° continuous rotating telescope
- Two slit grating hyperspectral spectrographs (ultraviolet to visible & visible to near-infrared, NIR)
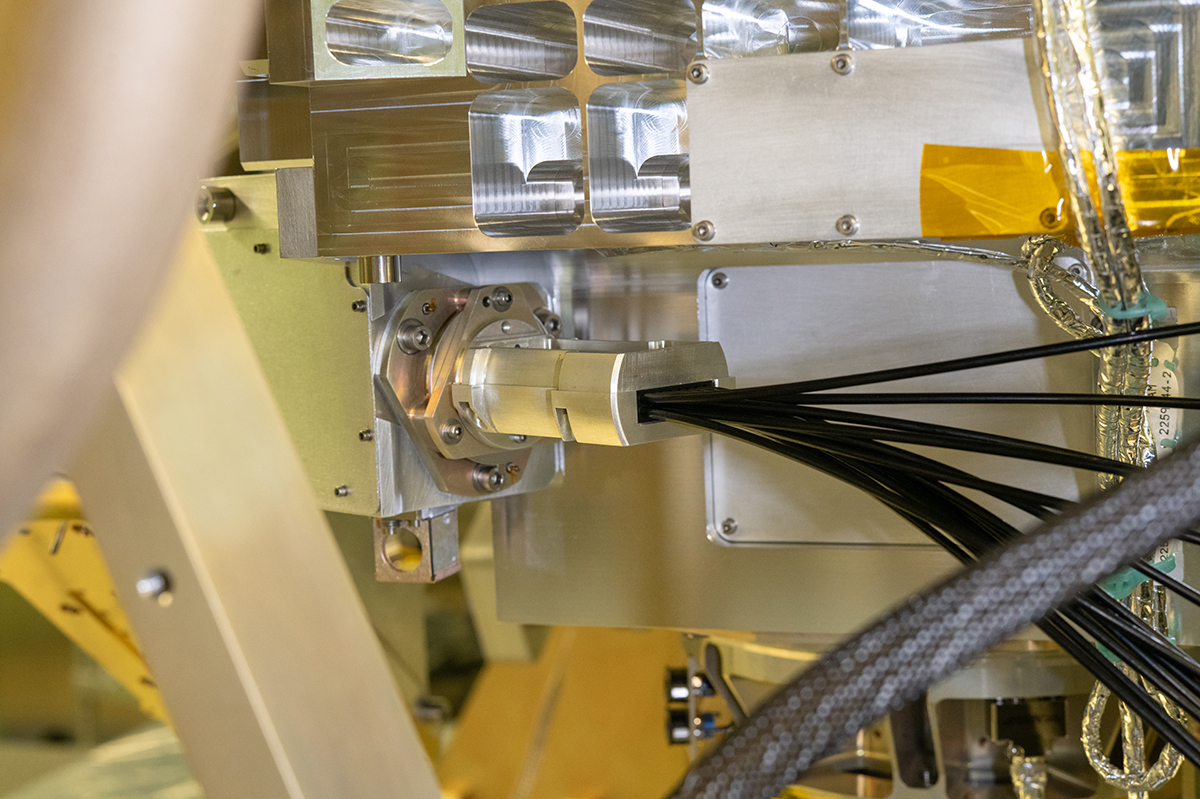
- Fiber-coupled multiband filter spectrograph (NIR-to shortwave-infrared)
Recent Publications
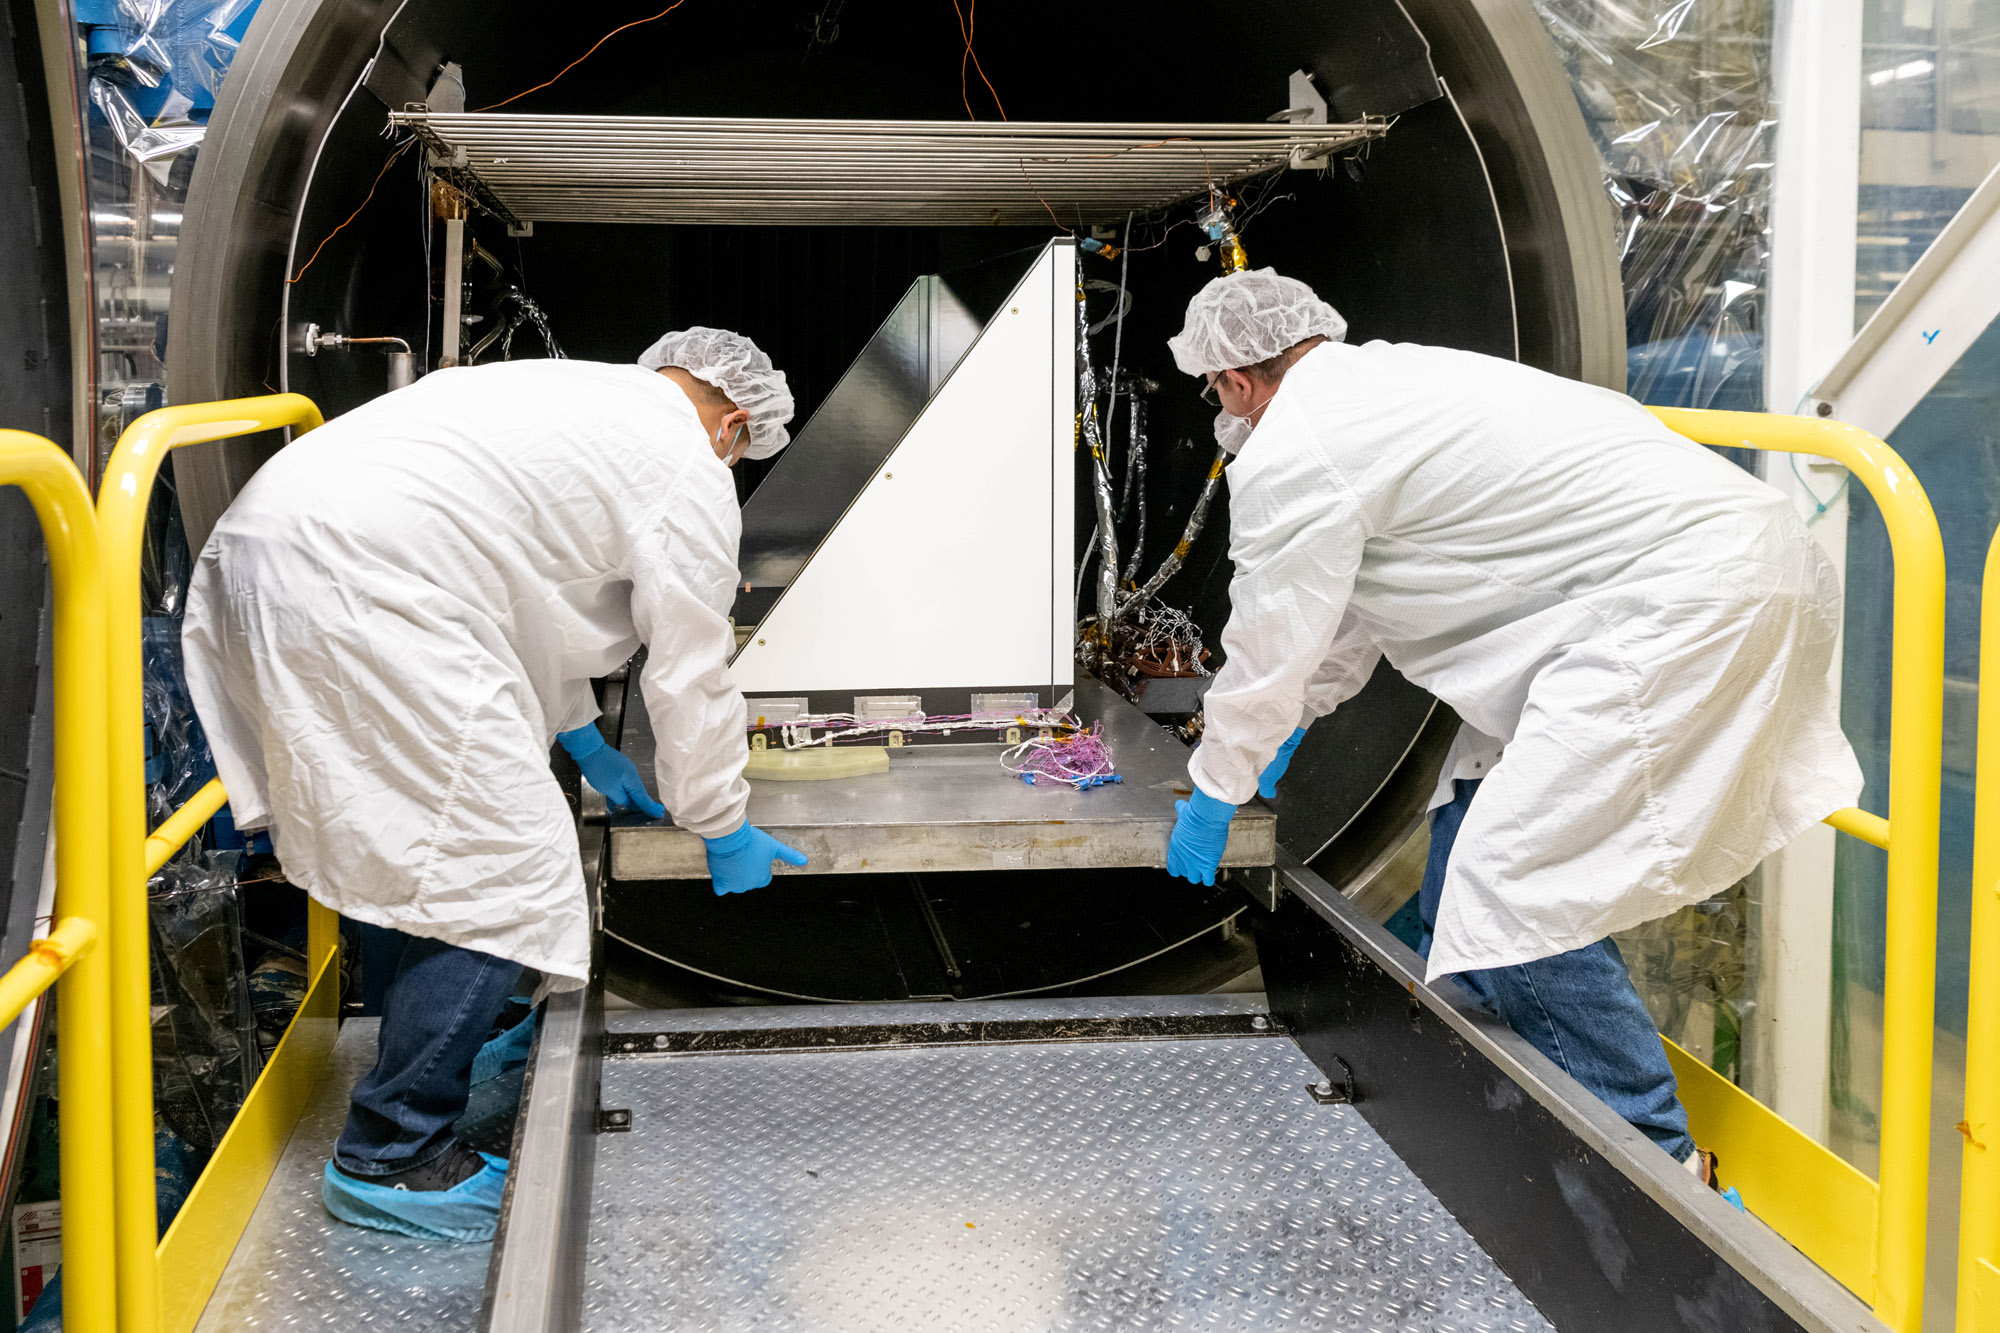
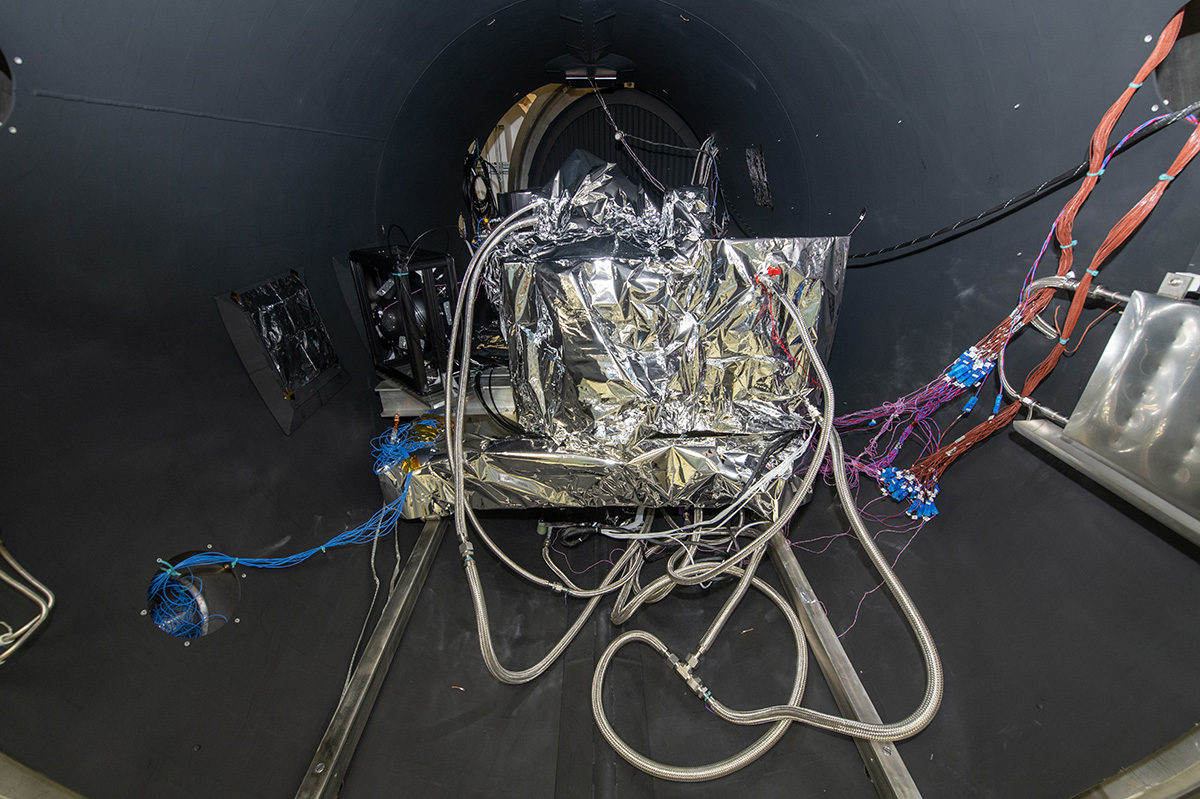
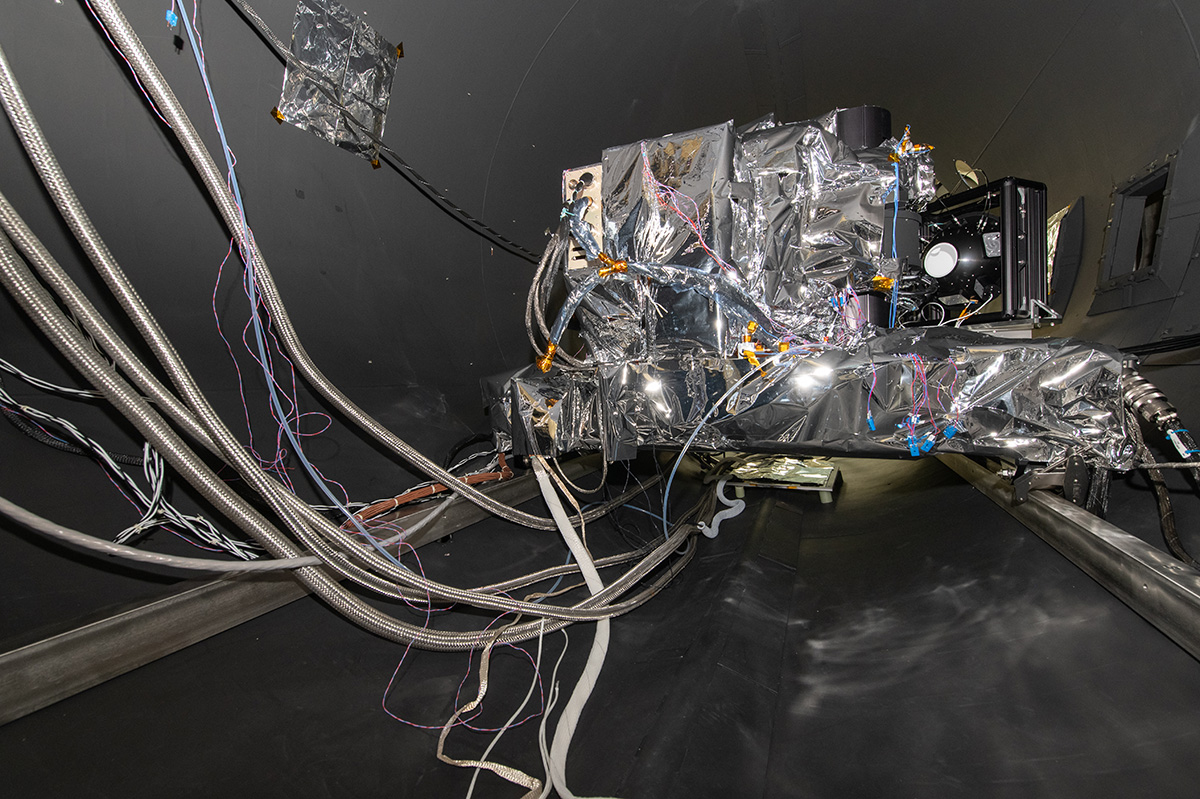
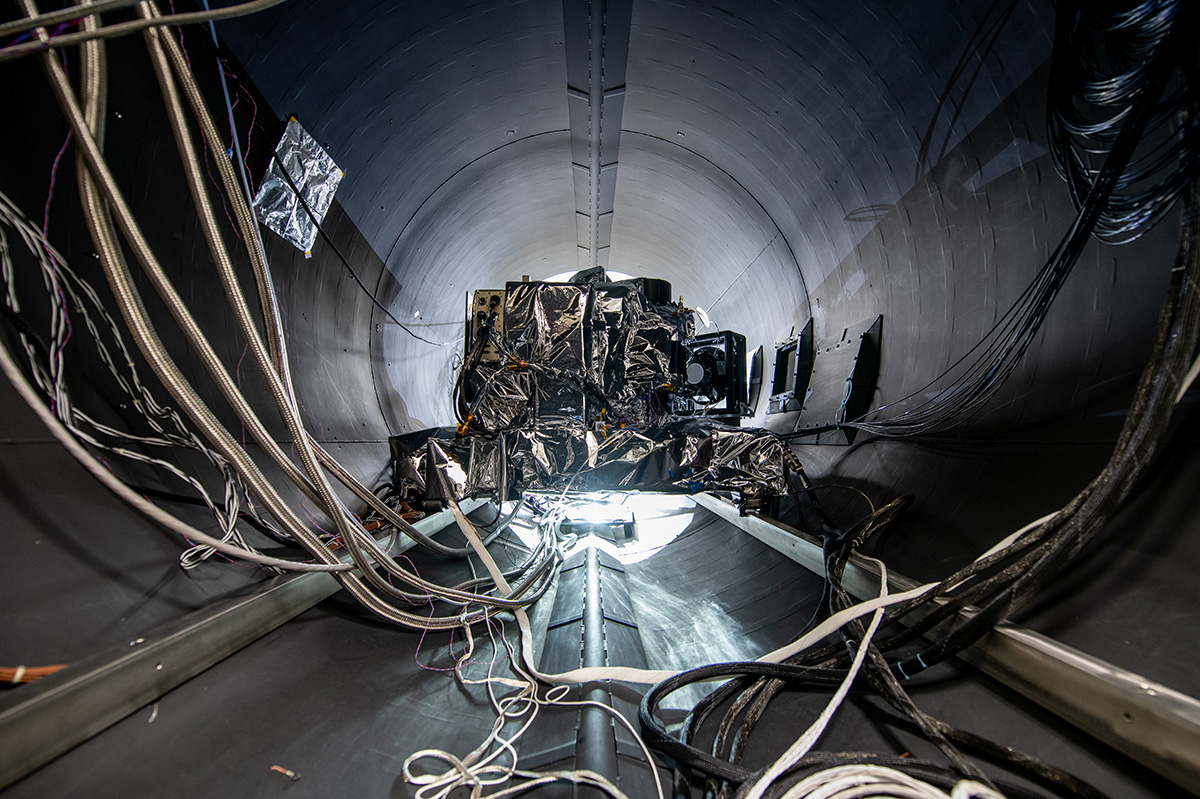
Semenov, S.Y., and Patel, D. (2024). Instrument Level TVAC Testing of the PACE OCI Loop Heat Pipes, 2024 International Conference on Environmental Systems, doi: 10.32865/2346/98889.Paulino, R.S. Martins, V.S., Caballero, C.B., Lima, T.M.A., Liu, B., Ashapure, A., and Werdell, J. (2026). PACE (Plankton, Aerosol, Cloud, ocean Ecosystem): Preliminary Analysis of the Consistency of Remote Sensing Reflectance Product Over Aquatic Systems, ISPRS J. Photogramm. Remote Sens., 232, 196-209, doi: 10.1016/j.isprsjprs.2025.12.003.Patel, D. and Ousley, W. (2025). On-Orbit Thermal Performance of NASA’s Ocean Color Instrument, 2025 International Conference on Environmental Systems, doi: 10.32865/2346/102624.Lavigne, H., Ruddick, K., Vanhellemont, Q., Van der Zande, D., and Vansteenwegen, D. (2025). Detection of Phaeocystis Globosa in the Belgian Coastal Waters with Hyperspectral PACE/OCI Satellite Data, WHISPER 2025 Proceedings, doi: 10.1109/WHISPERS69515.2025.11501624.Qi, L., Wang, M., Hu, C., Xie, Y., and Barnes, B.B. (2026). Hyperspectral OCI/PACE Observations of the Atlantic Sargassum, Remote Sens. Environ., 334, 115185, doi: 10.1016/j.rse.2025.115185.OCI Heritage
The OCI design is based on a long heritage of NASA technology development and flight programs. The OCI's operational concept, cross-track rotating telescope / half-angle mirror, system timing, and data processing infrastructure have been successfully used on previous and existing flight missions such as the Coastal Zone Color Scanner or CZCS (1978 to 1986), Sea-Viewing Wide Field-of-View Sensor or SeaWiFS (1997 to 2010), Suomi National Polar-orbiting Partnership (Visible Infrared Imaging Radiometer Suite or VIIRS), Aqua and Terra (Moderate Resolution Imaging Spectroradiometer or MODIS instrument). In addition, the OCI's avionics (communications, positioning) uses a significantly smaller electronics system developed by the iMUSTANG effort. OCI's functionality — rotating telescope (mechanism and timing), charged couple device (CCD) detector, optics — benefits from previous technology development efforts such as Ocean Radiometer for Carbon Assessment (ORCA).