OCI On-orbit Calibration
The PACE OCI Calibration Team continuously evaluates the on-orbit radiometric performance of OCI. The links above jump to sections that show the evolution of selected parameters over time and/or their current state. A detailed description of these calibration parameters is provided in section III in Meister et al., 2024, this webpage uses the same notation as that paper. The temporal trend of instrument engineering parameters (like voltages, temperatures, etc.) can be found here.
Signal-to-Noise Ratio (SNR) and Dark Current
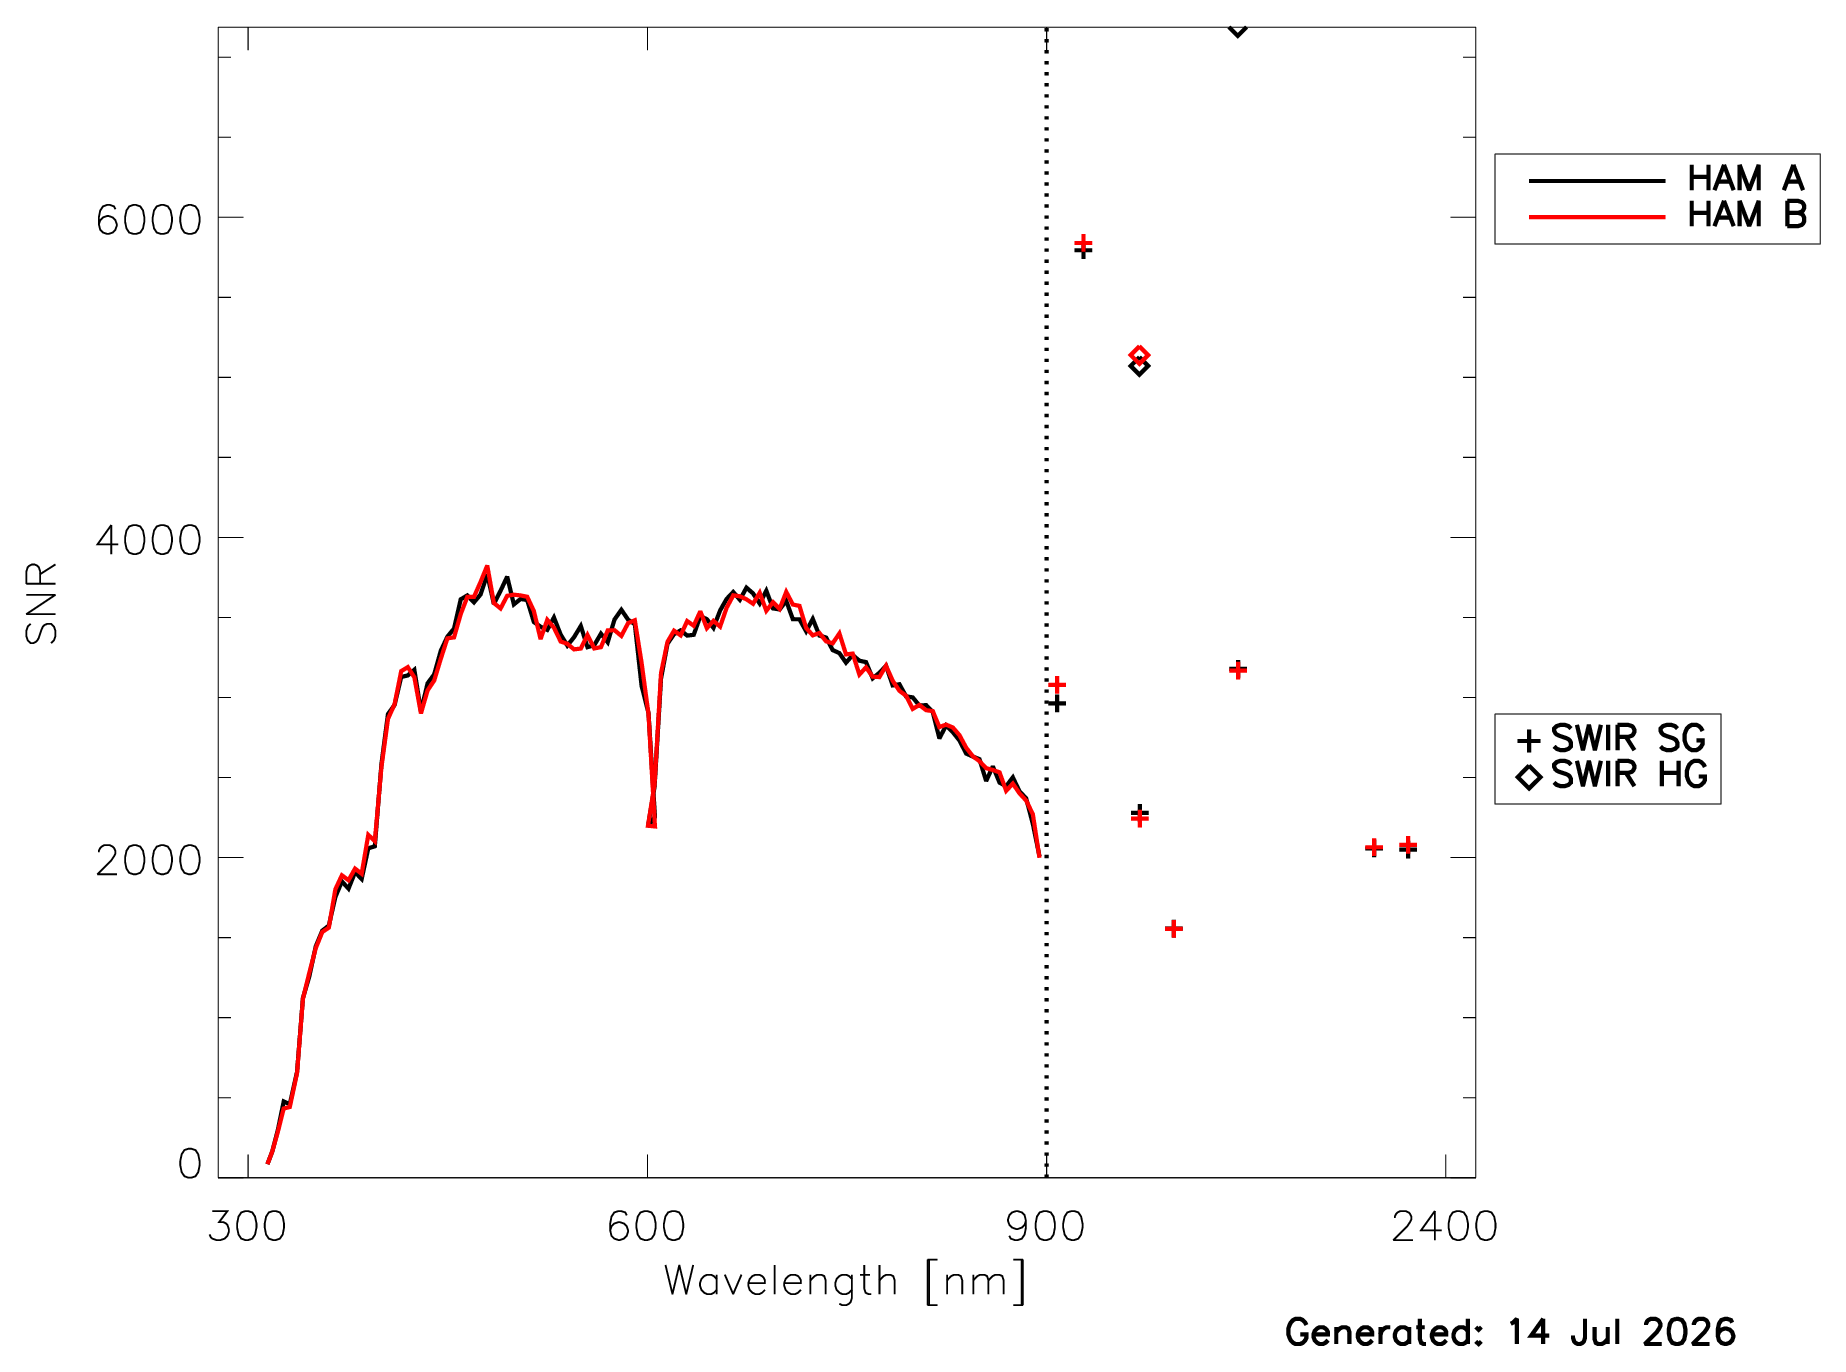
The signal-to-noise ratio (SNR) for OCI can be calculated independently from two on-board solar diffusers: the bright calibration target (BCT) and the dim calibration target (DCT). SNR is calculated by averaging the OCI signal over the scan angle range used for on-orbit calibration (-92 to -93 degrees) and over all the scans for which the spacecraft pointing at the Sun is stable. A standard deviation over the signal from these scans and scan angle range is also computed. The SNR is the ratio of the average and the standard deviation. This calculation is performed for each spectral band separately.
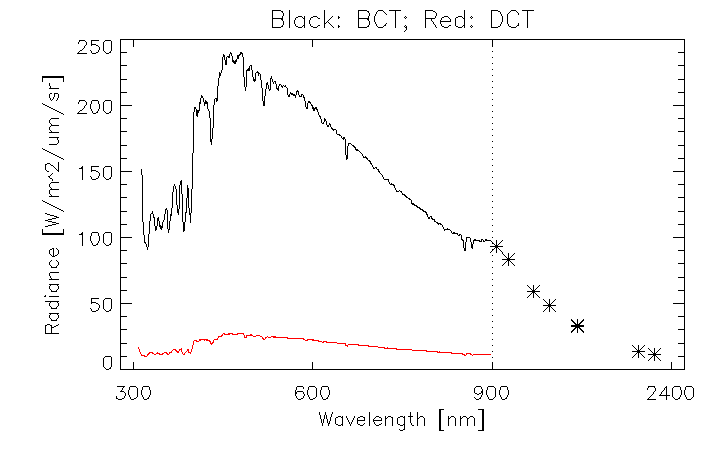
The signal from the BCT is almost an order of magnitude larger than the signal from the DCT, see Fig. 1a. The measured radiances from the first on-orbit measurements are provided as an ASCII file.
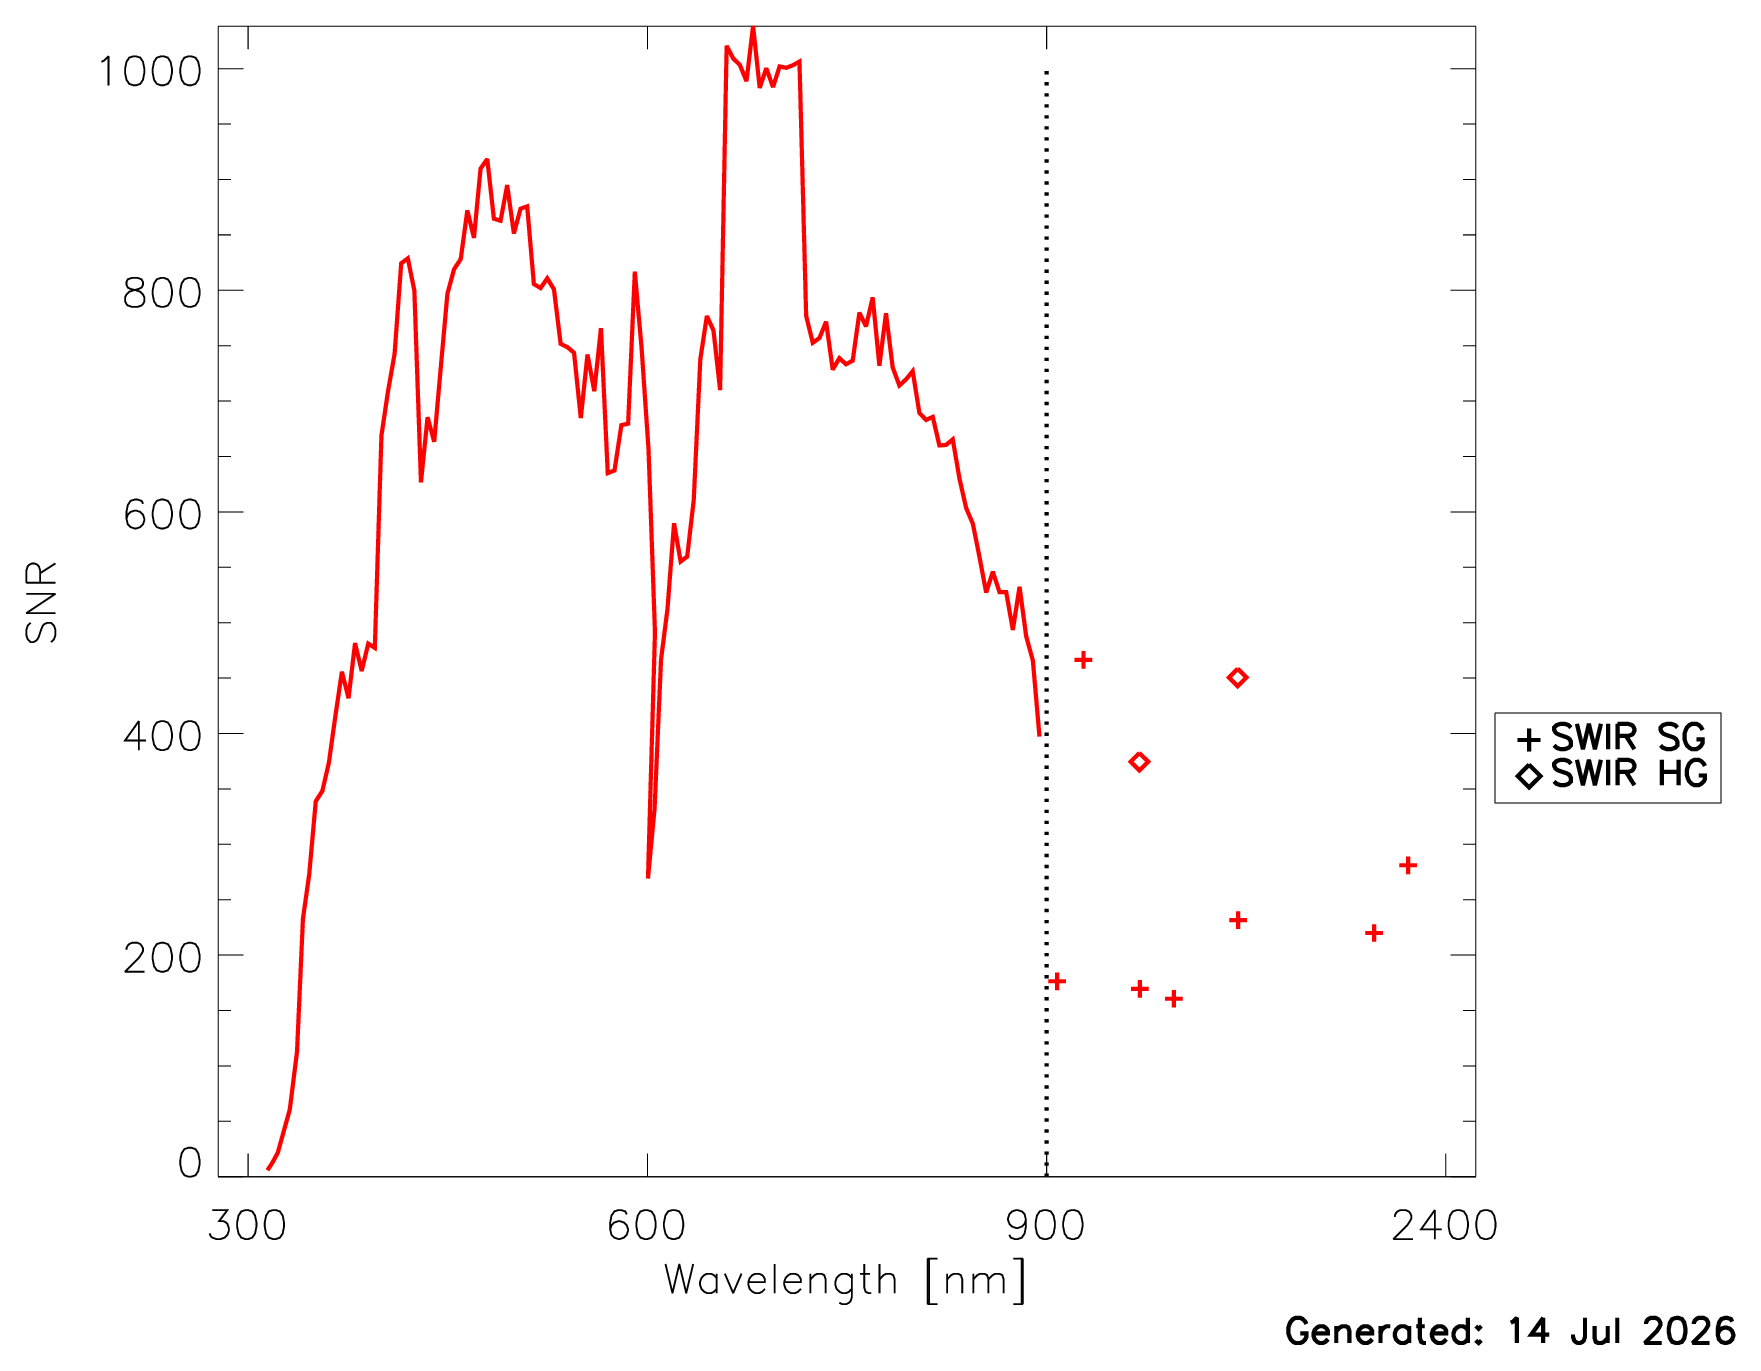
The SNR as a function of time are provided for the BCT and DCT. The SNR from the most recent BCT and DCT measurements are shown in Fig. 1b. The SNR from the BCT are more representative for a cloud radiance, the SNR from the DCT are more representative for an open ocean radiance. The prelaunch SNR evaluated at typical ocean radiances are shown in Fig. 13 in Meister et al., 2024. For specific radiance levels, the prelaunch SNR can be calculated via an equation and coefficients provided here.
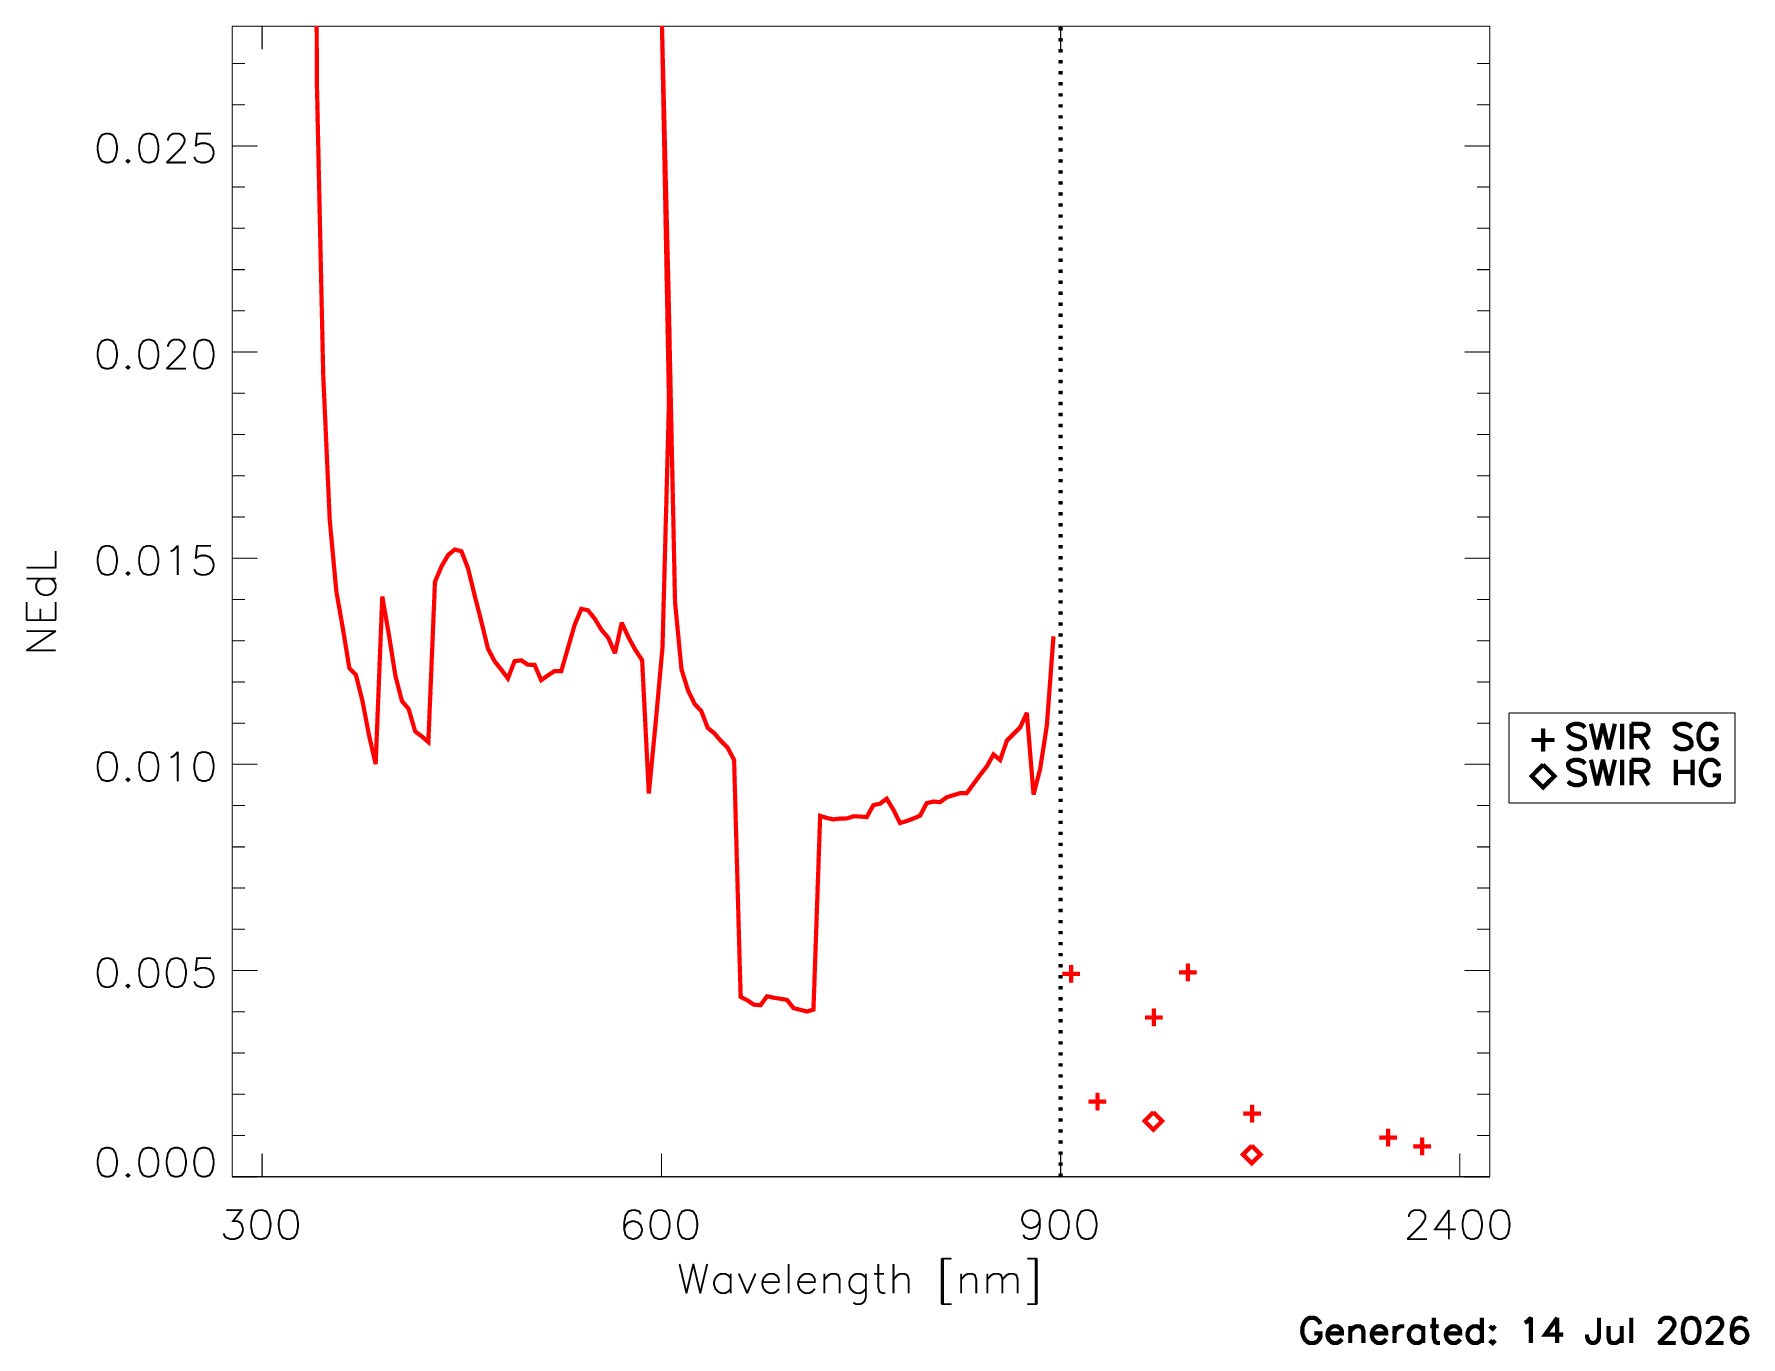
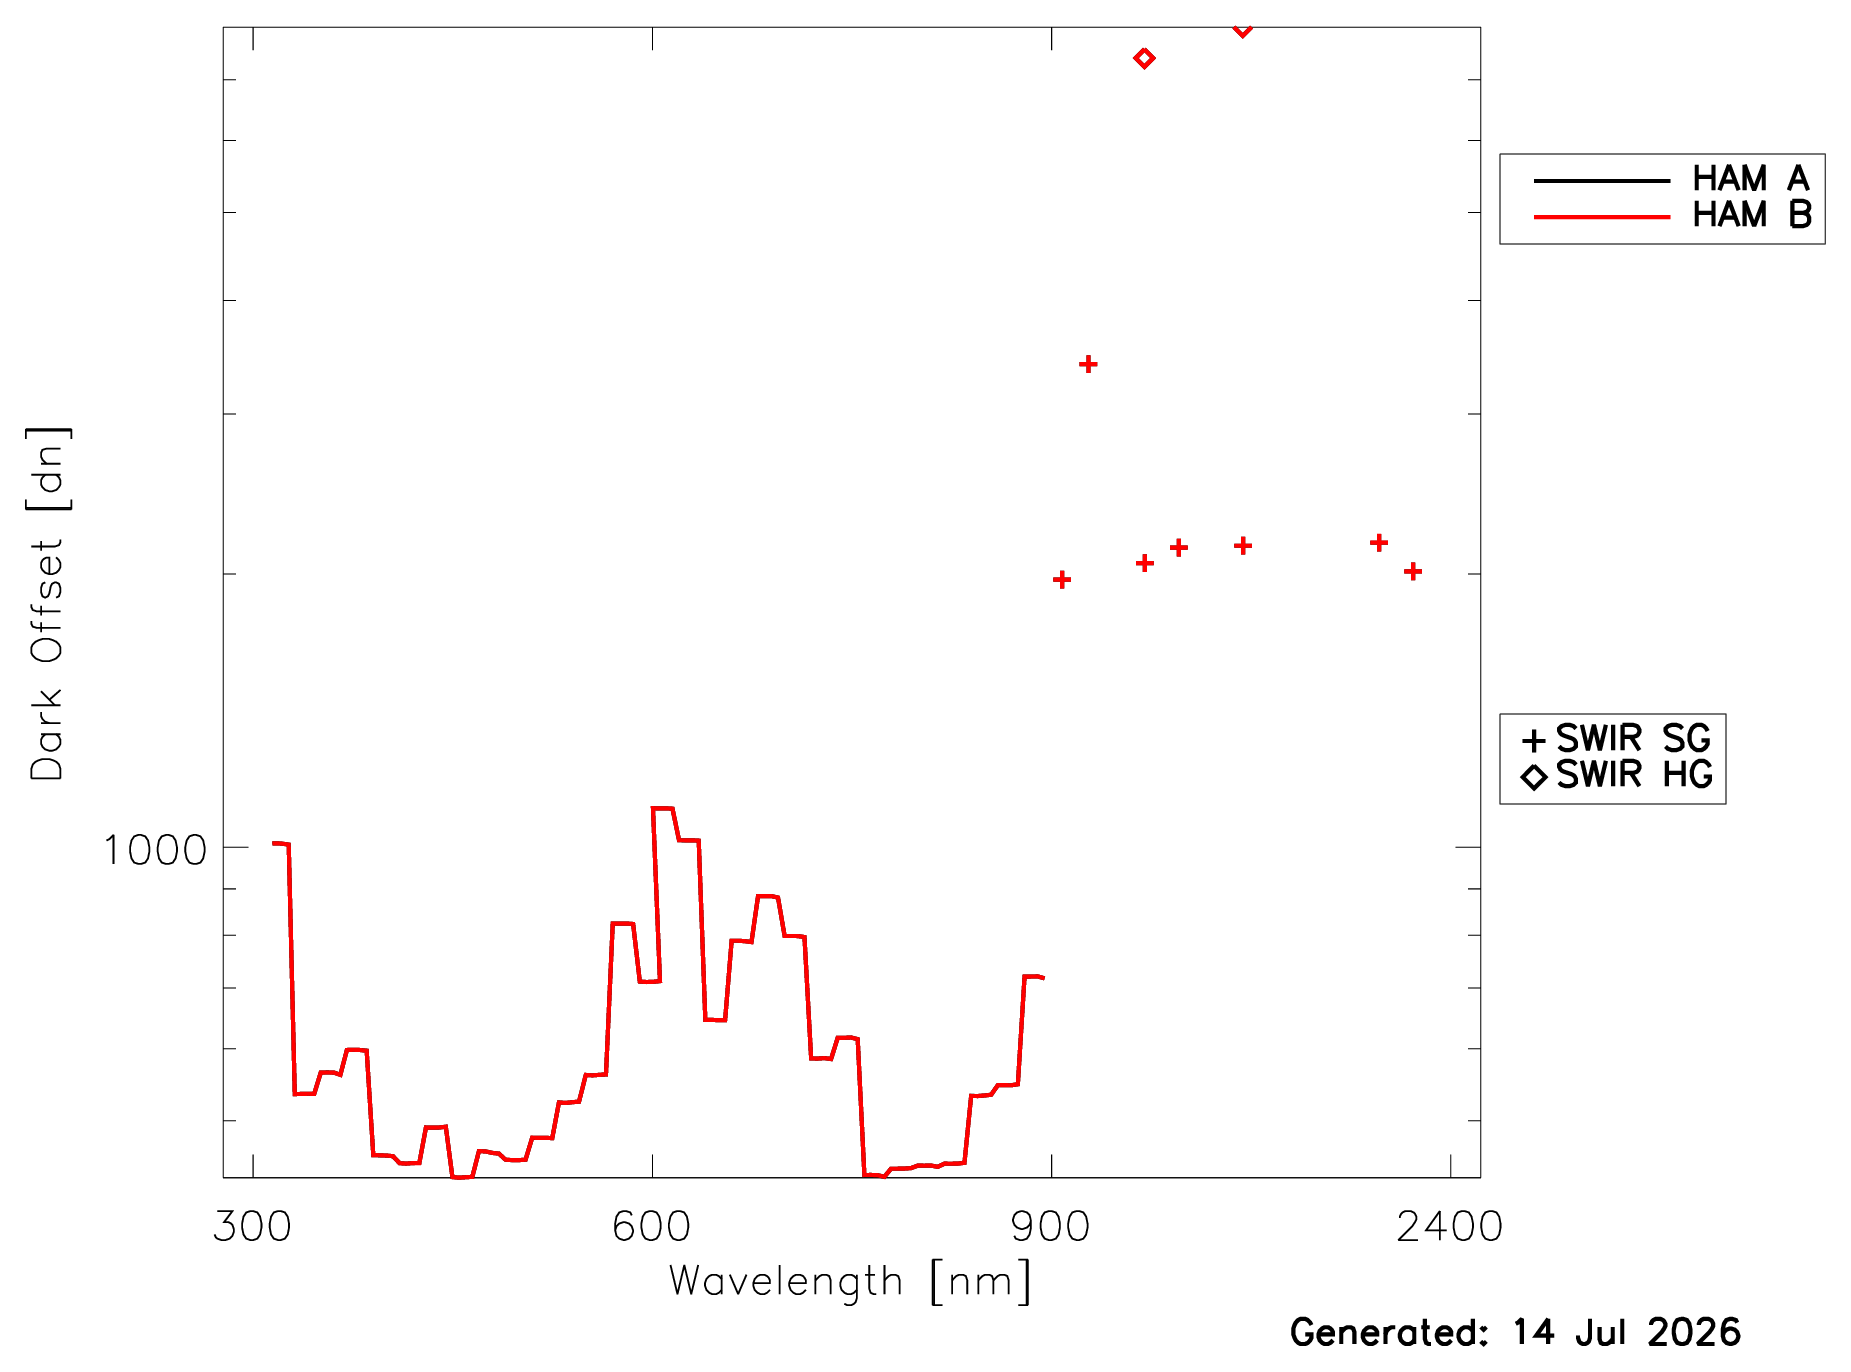
The OCI noise performance can also be evaluated with measurements when no light enters the telescope (‘dark measurements’). These measurements are taken every scan of the telescope when the telescope is pointing at a dark surface inside the instrument. Fig. 1c shows the ‘Noise equivalent delta Radiance’ (NedL) from the latest measurement. The temporal trend of the noise (expressed in terms of dn) as a function of time is provided here. The dn from the dark measurements are subtracted during the calibration process. Fig. 1d shows the latest dark measurements, the trend over time is shown here.
Radiometric Sensitivity (gain)
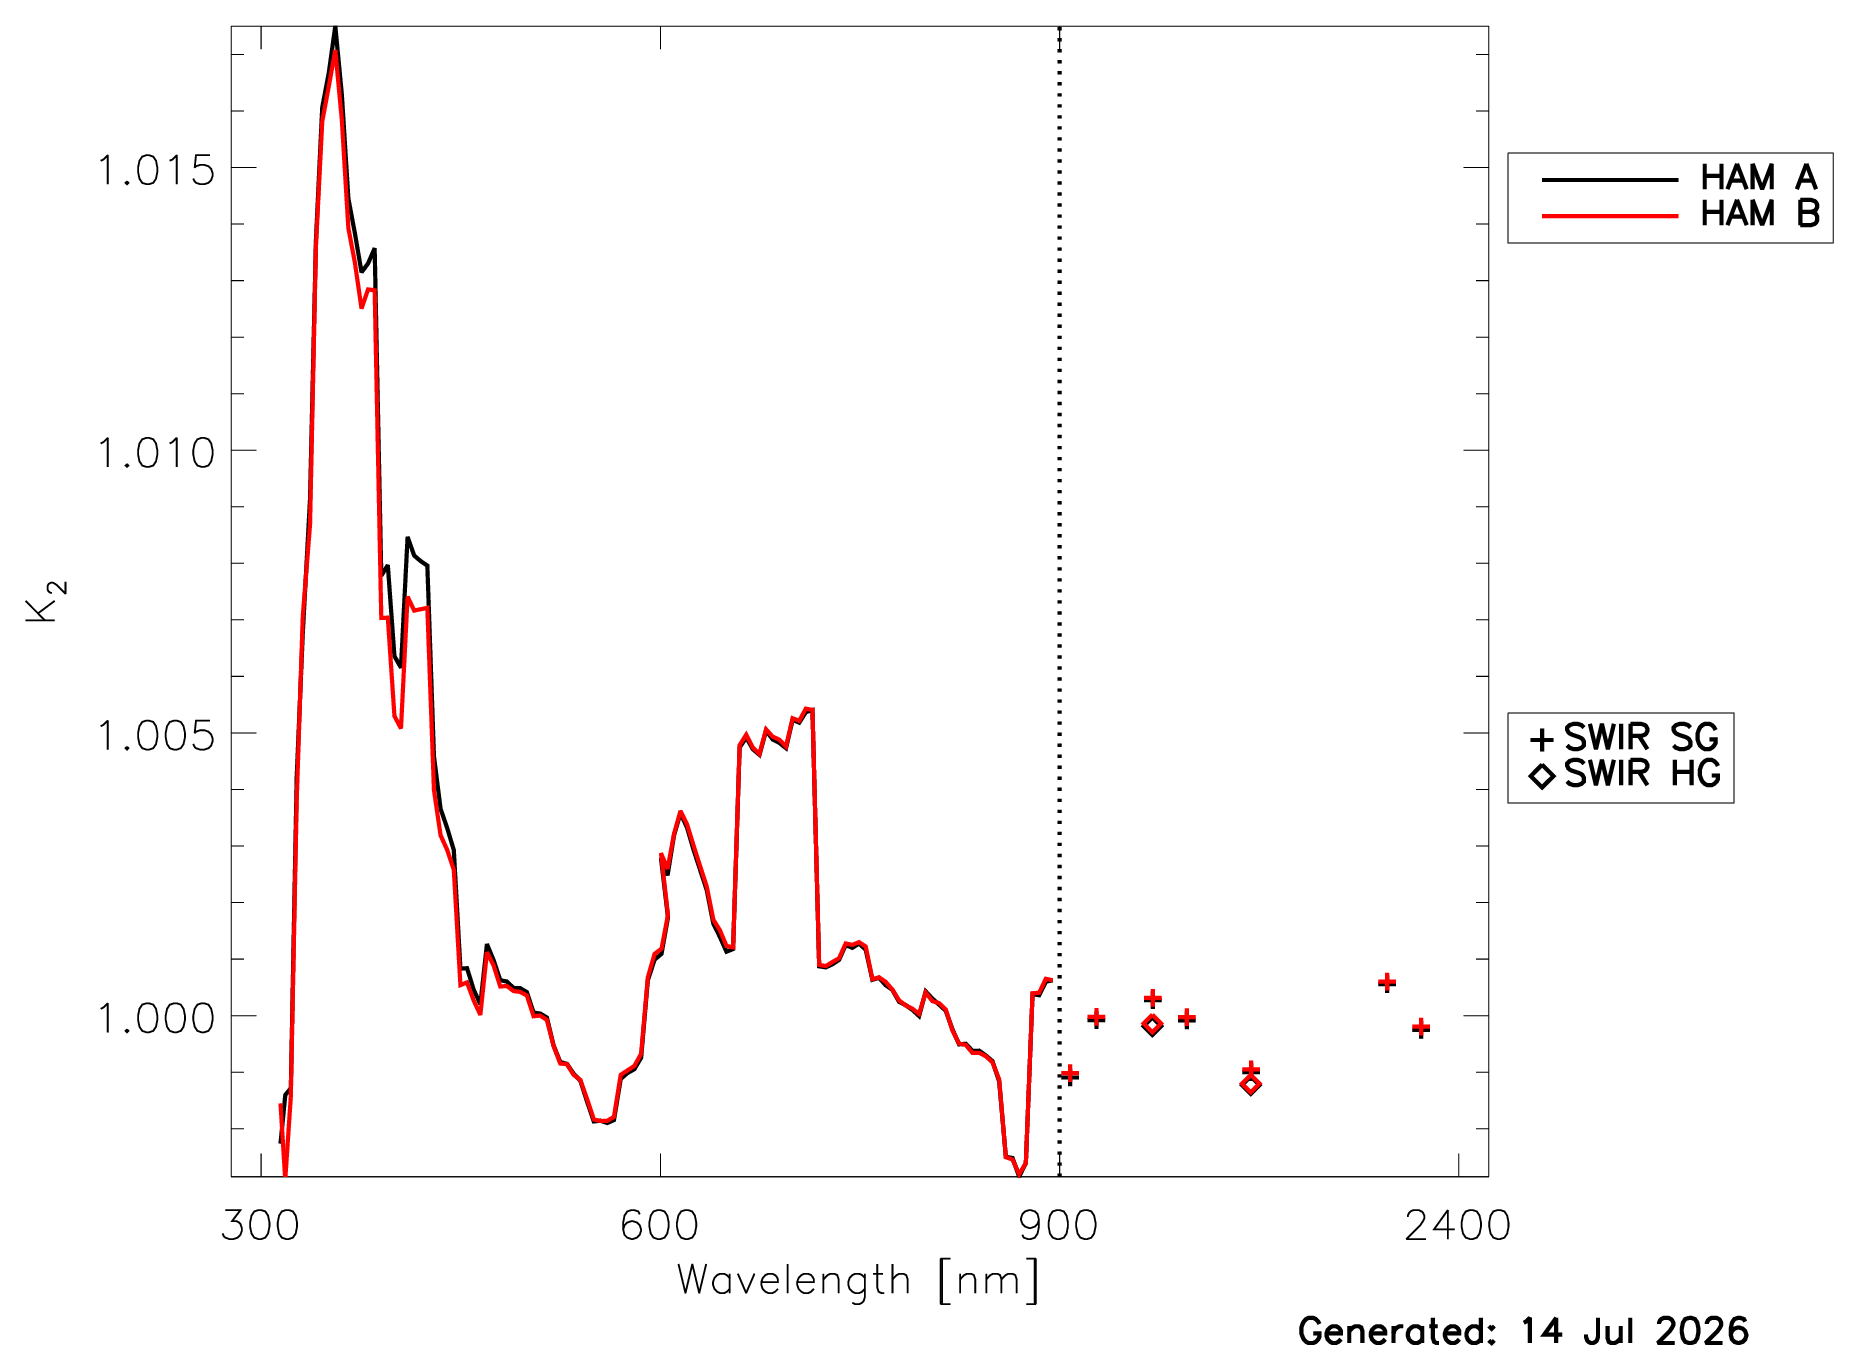
The temporal change of the radiometric gain is described by the parameter K2 in the OCI calibration equation (see equation 2 in Meister et al., 2024). The methodology to derive K2 has been described in Mcintire et al., 2024. As an example, K2 = 1.01 indicates a reduction in instrument radiometric sensitivity of 1%.
Fig. 2a shows the most recent on-orbit measurements of K2. K2 is plotted as a function of time for each OCI band (threshold spectral aggregation) in this PDF file.
Spectral Drift
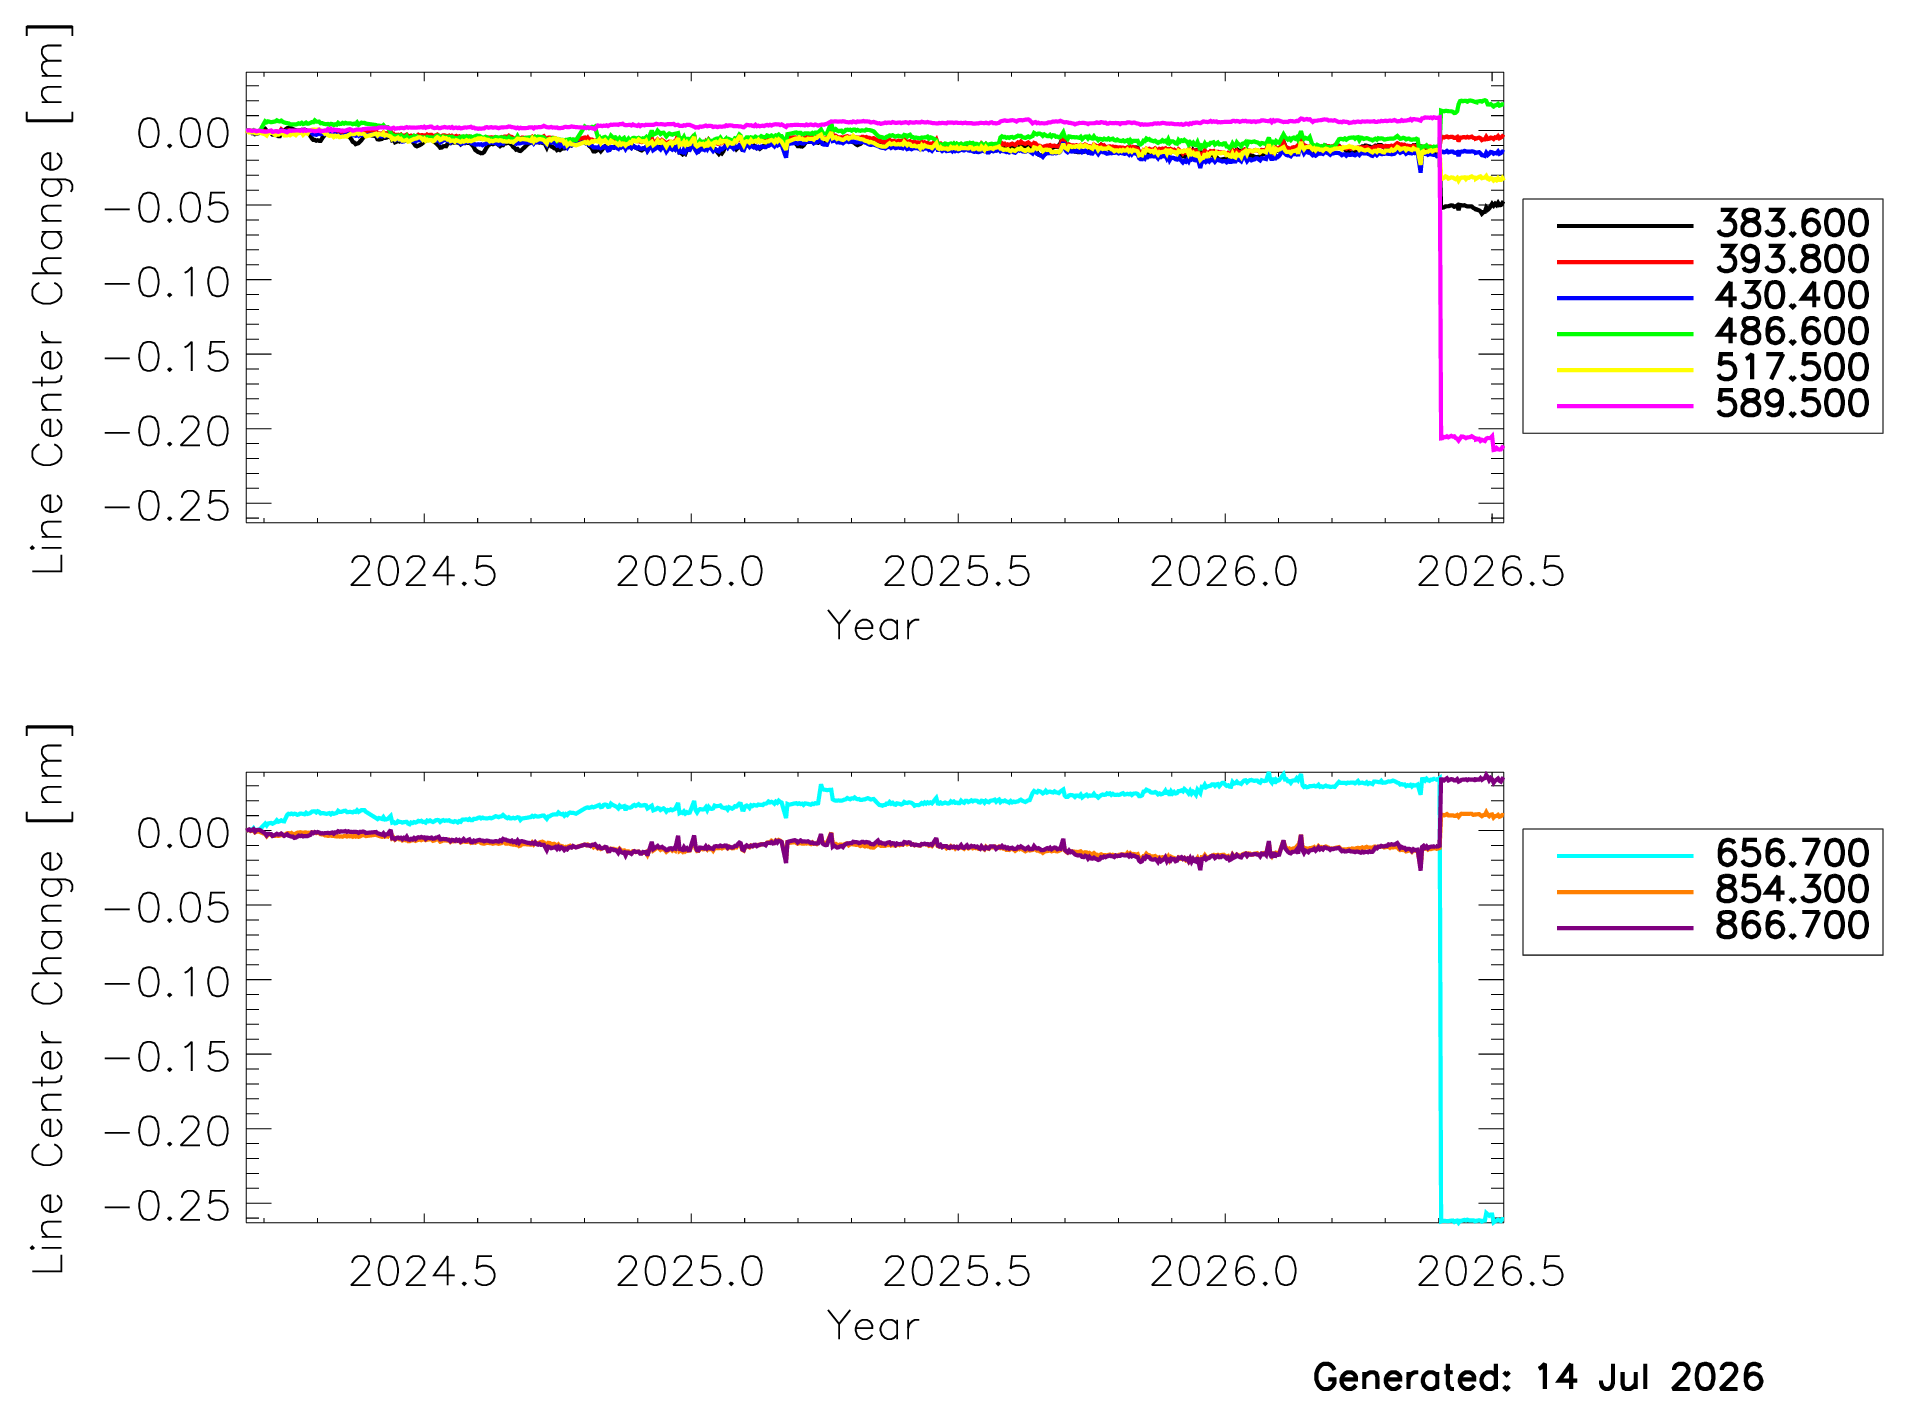
The OCI spectral calibration is monitored on-orbit by Fraunhofer lines in the radiances reflected off the bright solar diffuser. The methodology has been described by Eplee et al., 2024. Fig. 4a shows results for the blue Focal Plane Assembly (FPA) and the red FPA. It is likely that discontinuities (see e.g. 526nm) are due to the fitting approach and are not a sign of actual change in the spectral calibration. The temporal trends shown in the plots below are well within the On-Orbit Allowable Spectral Stability requirement of 0.5nm per year.
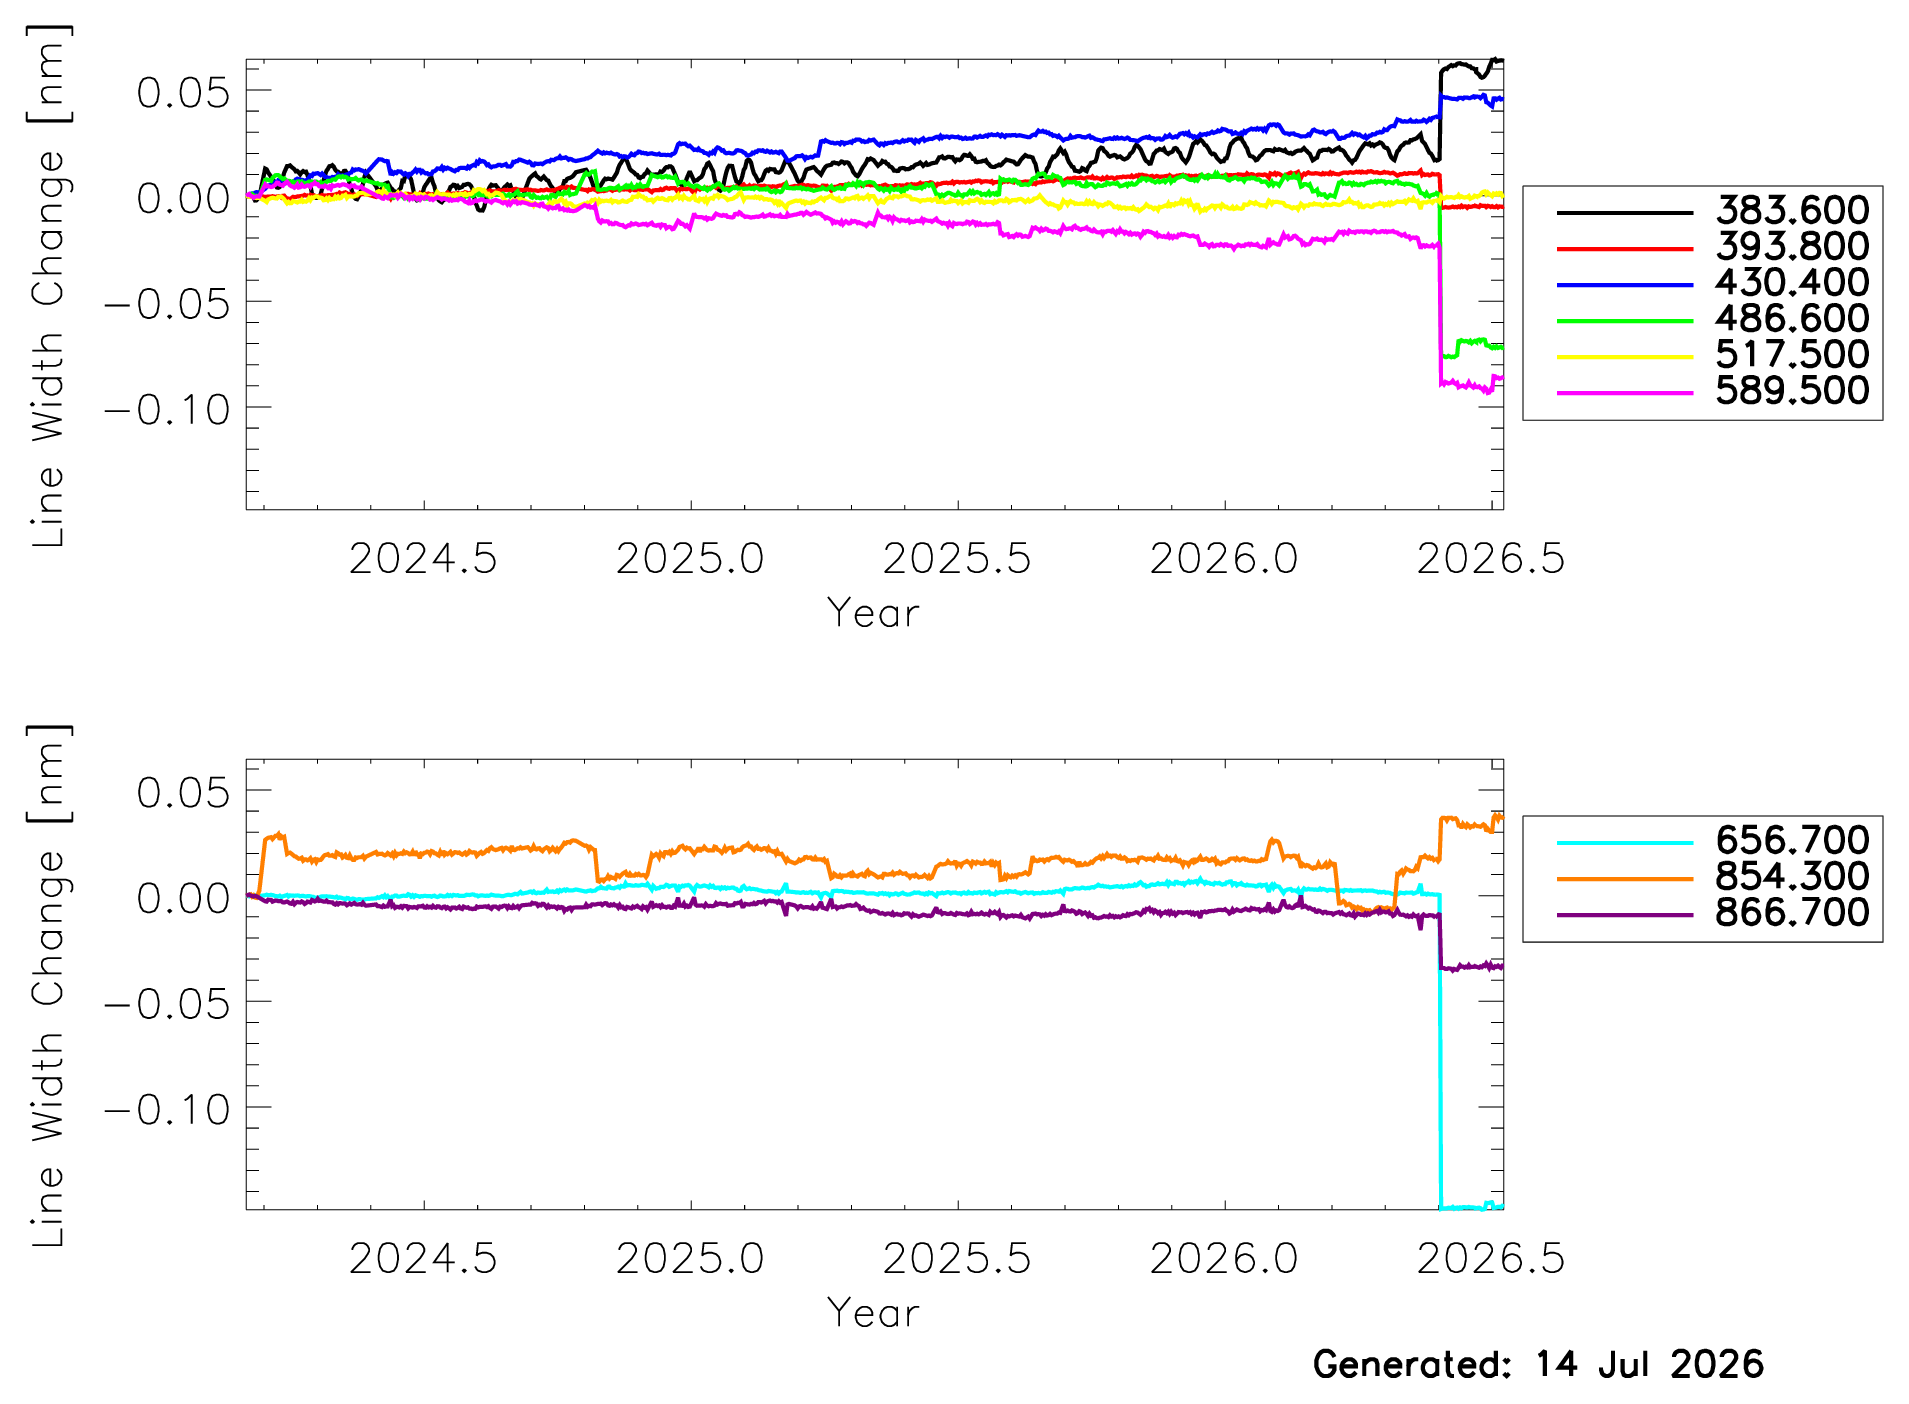
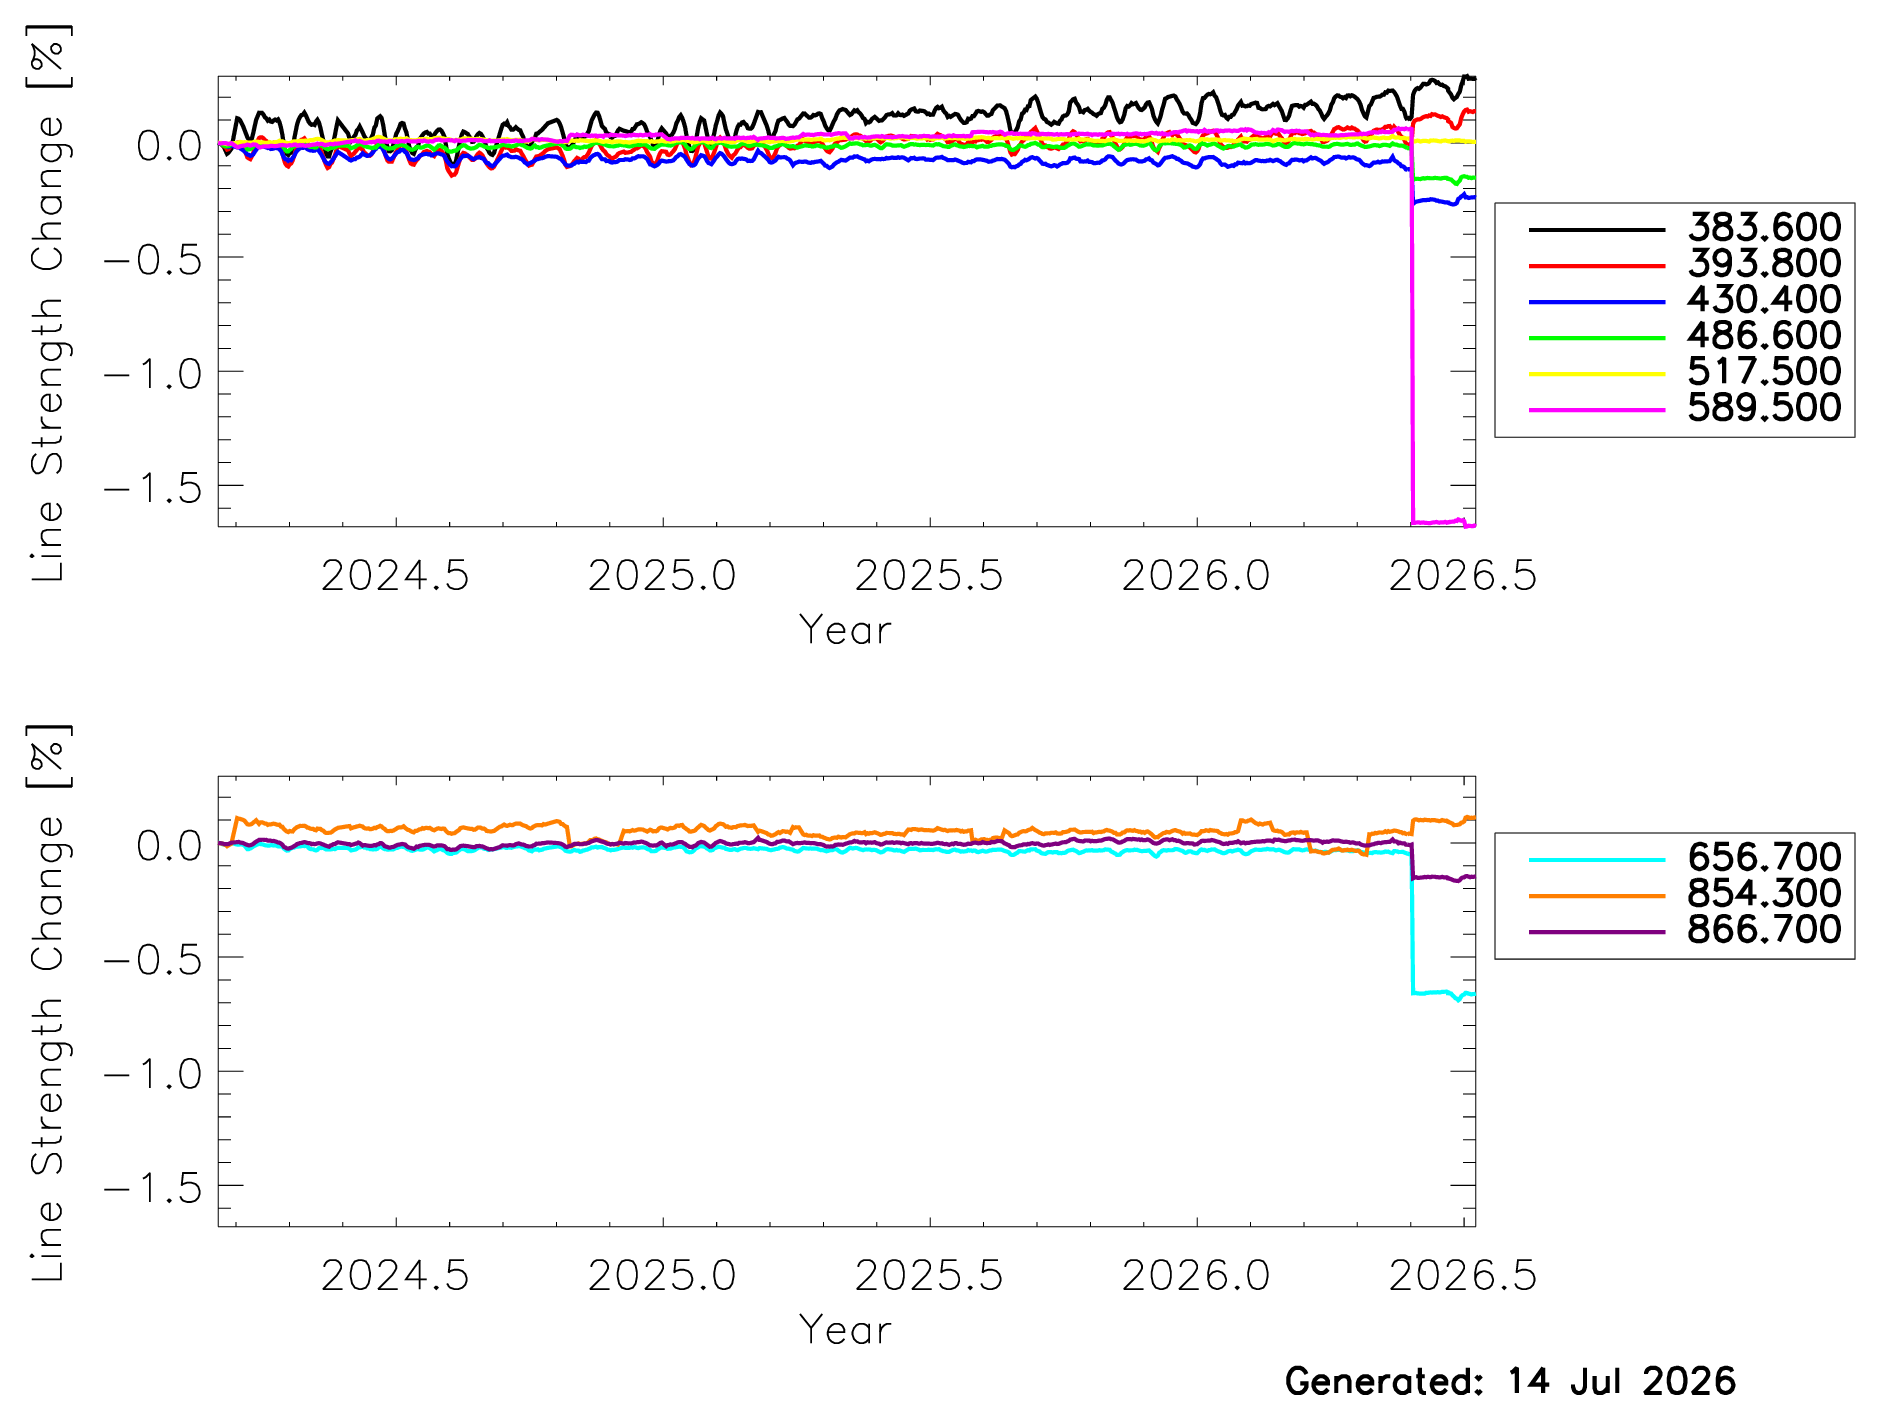
In addition to the center wavelengths of the Fraunhofer lines, the OCI calibration team is also trending other parameters derived using the Fraunhofer lines, such as the line width (Fig. 4b) and the line strength (Fig. 4c). Here the line strength is determined by the difference in the line depth at the calculated center relative to an estimated baseline spectrum.
The line strength is reported as a percentage of the estimated baseline. The line width is calculated by integrating the area between this estimated baseline spectrum and the measured line spectrum, then dividing by the line strength. It is reported in nm. These calculations are new developments in our group, and we are still evaluating what level of change in these parameters should be of concern.
We believe that the current trend in the data (less than 0.1nm for line width change and less than 0.5% line strength change) does not imply a significant change in the spectral characteristics of the instrument.
Linearity
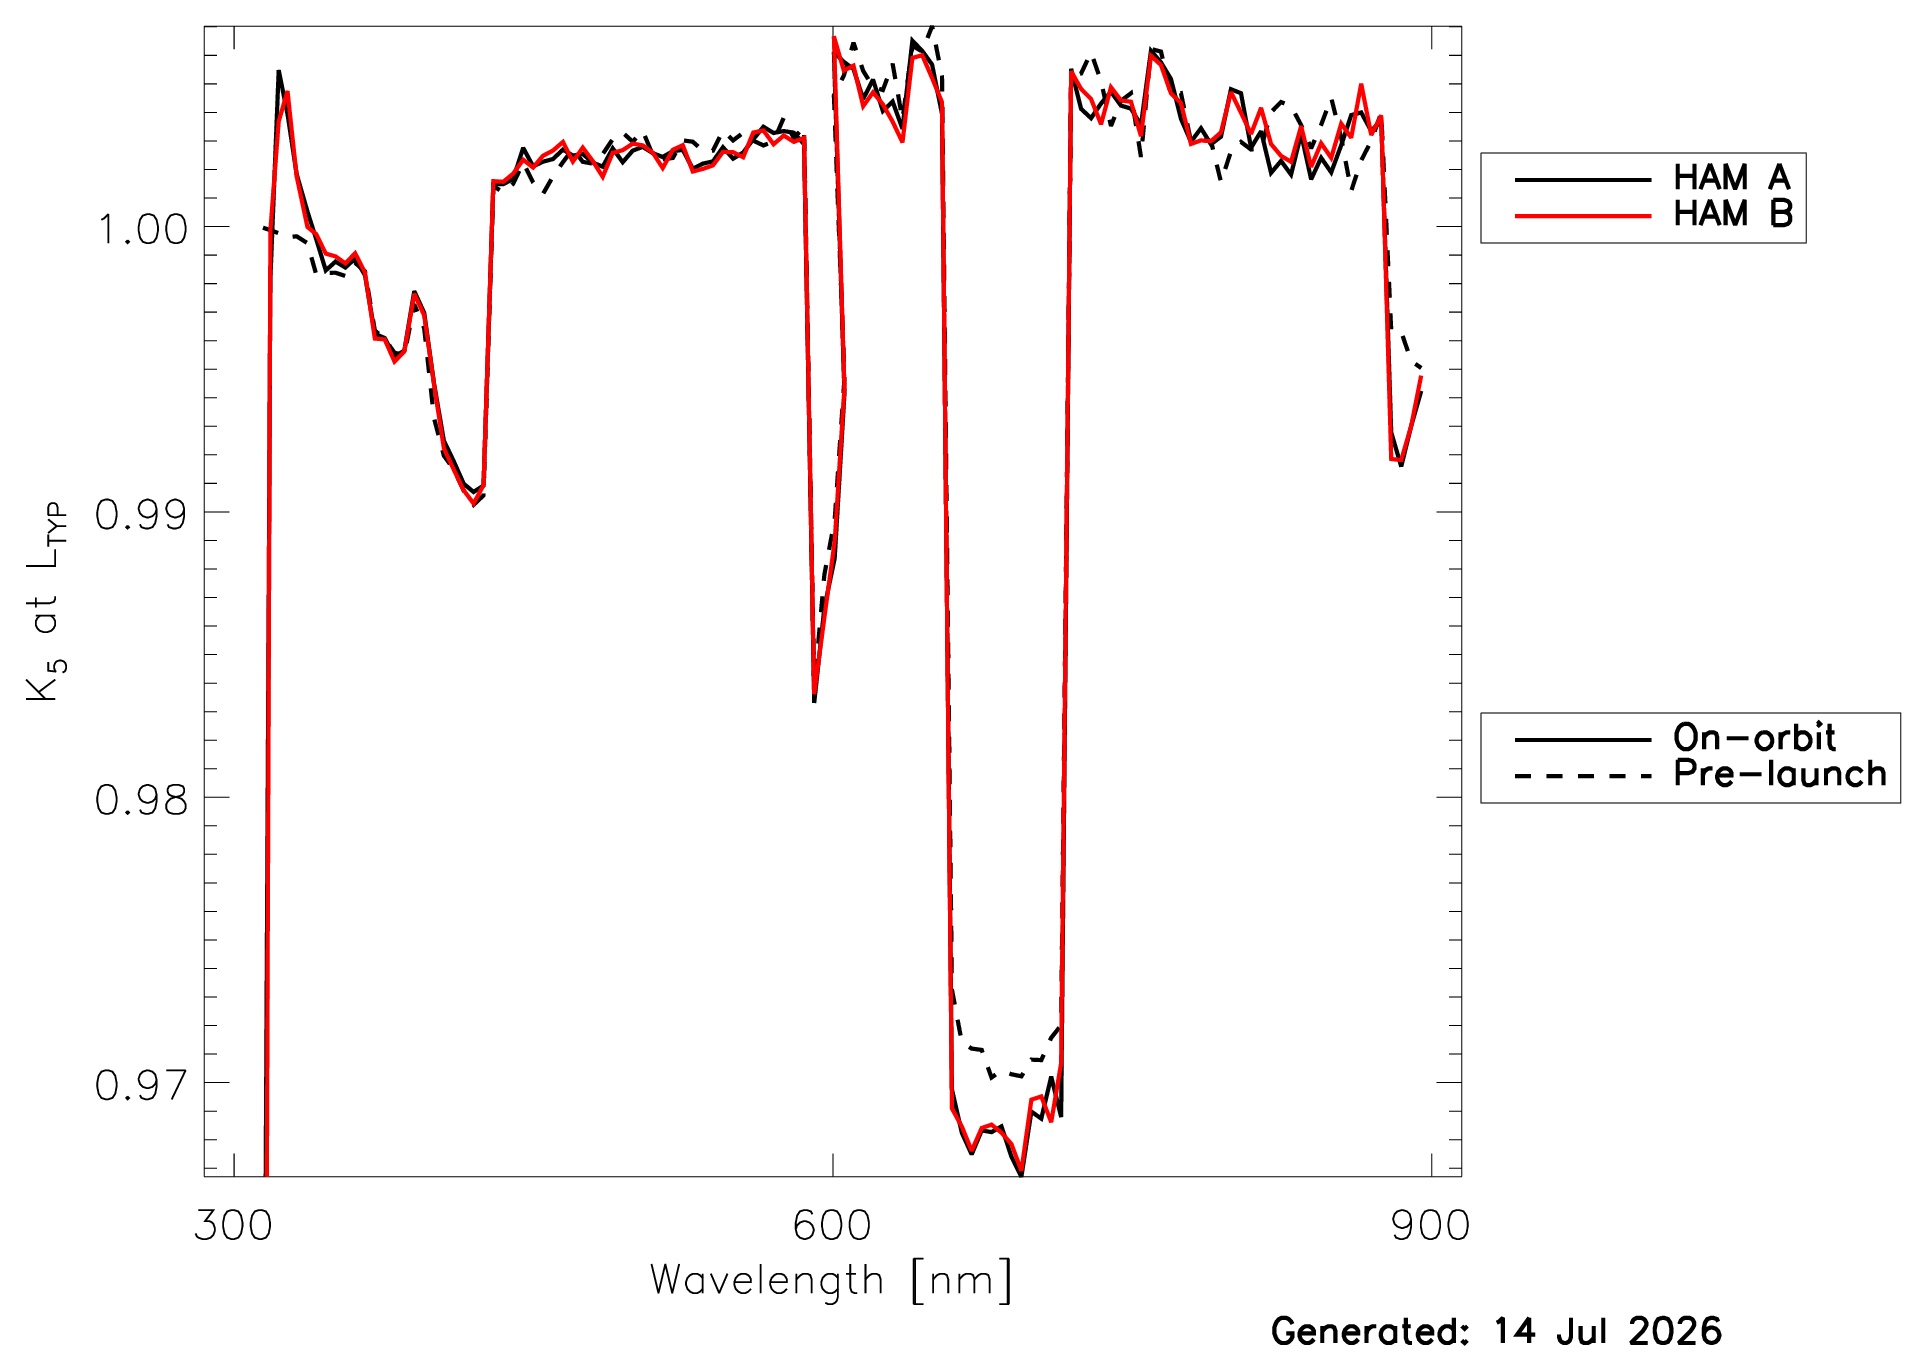
The linearity parameter K5 for the OCI hyperspectral bands is trended on-orbit via a dim diffuser and a special OCI aggregation mode called ‘progressive Time-Delay-Integration’, see Mcintire et al., 2024. Fig. 5a below shows the most recent results for K5 at typical radiances Ltyp. The K5 at Ltyp as a function of time are shown here for both HAM (Half-Angle Mirror) sides. Note that the difference between the two HAM sides is likely an indication of the noise in the results and not a real difference in linearity.
Solar Diffuser Reflectance
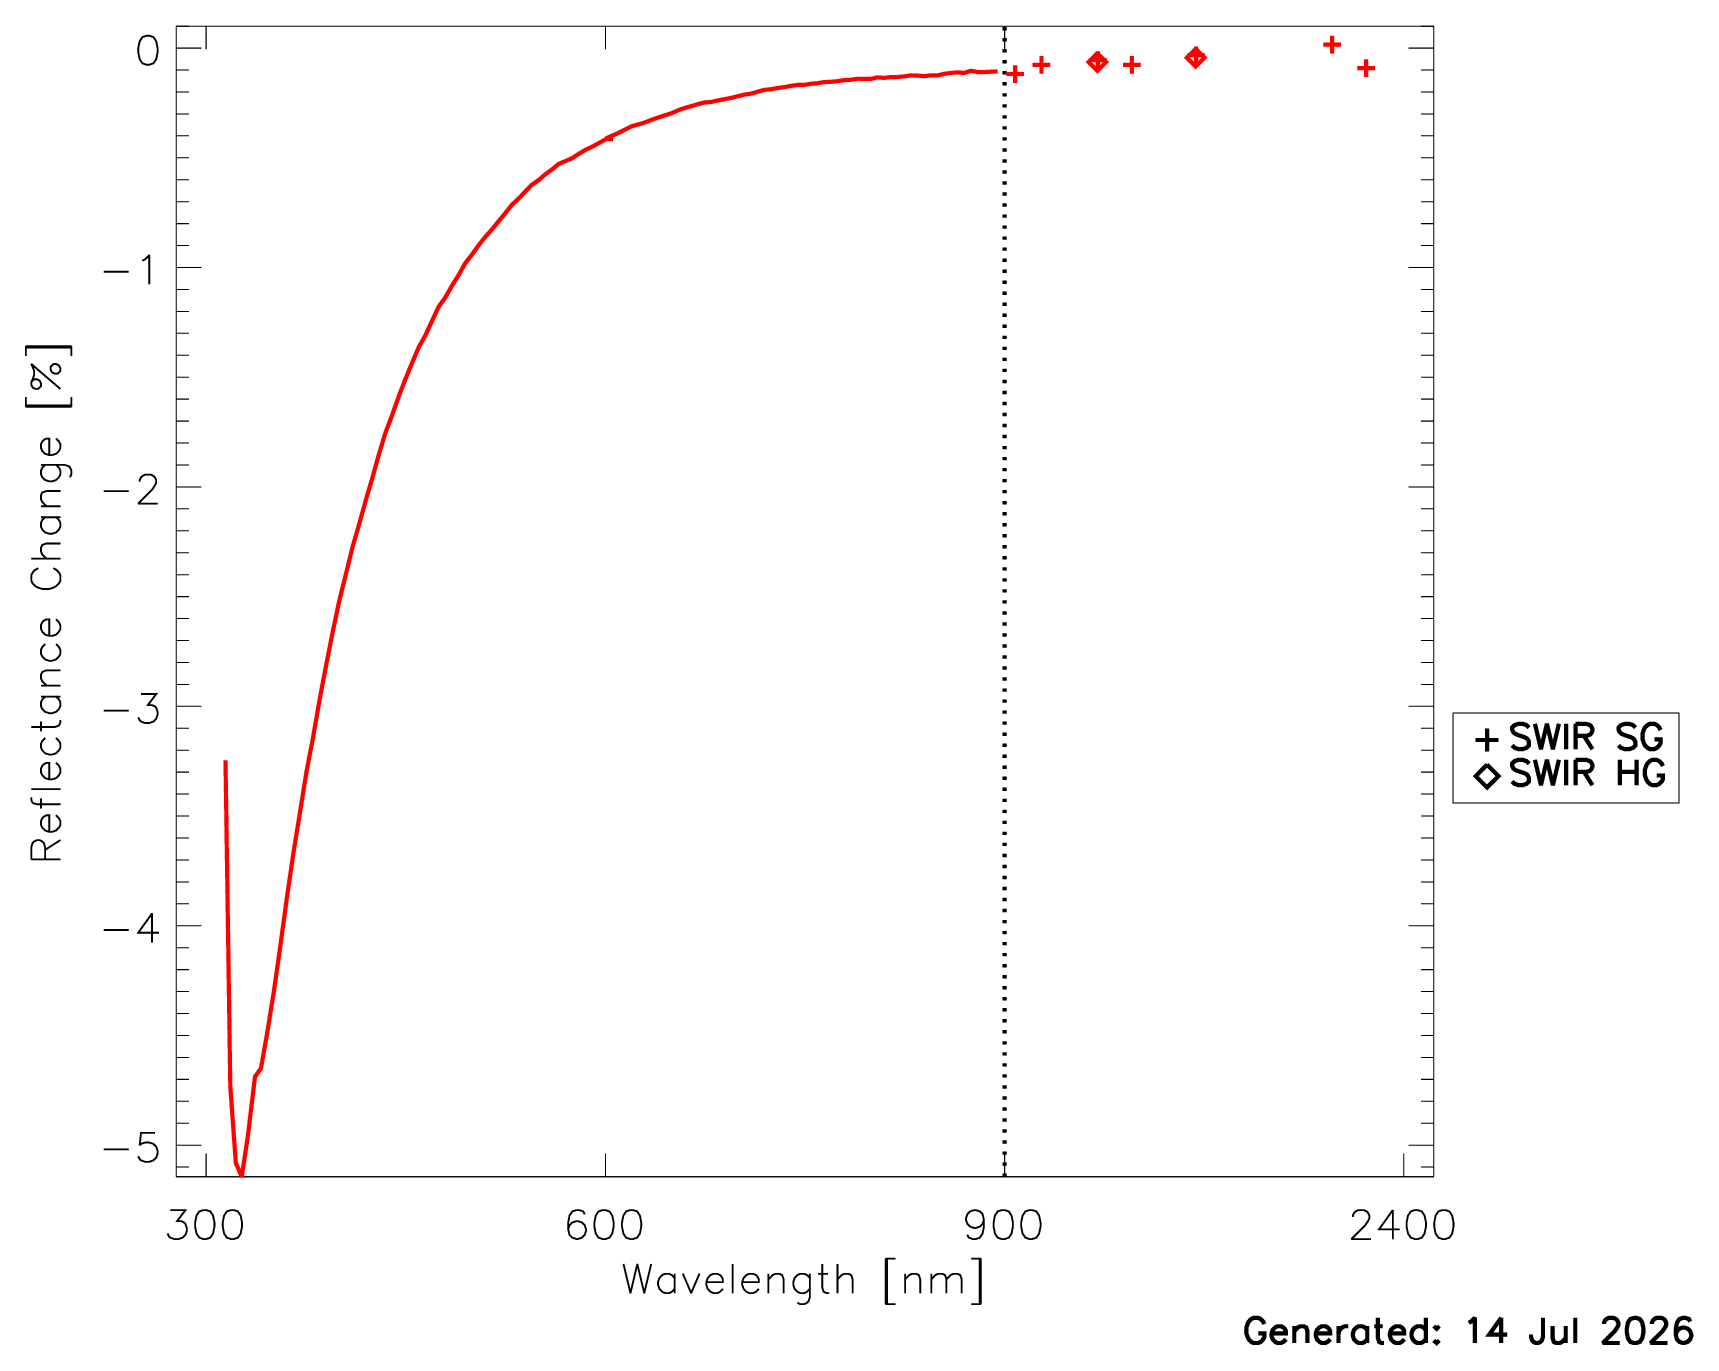
OCI has 3 on-board solar diffusers: two bright diffusers for gain trending, and one dim diffuser for linearity trending. One of the bright solar diffusers is measured daily, the other monthly. For PACE processing versions 3.x, it was assumed that the reflectance of the monthly bright solar diffuser did not change over time. (Note that for reprocessing 4, it is planned to model the degradation of the monthly diffuser as well.) This assumption allows us to calculate the change of the reflectance of the daily solar diffuser, which is shown in Fig. 10a. A value of -1.0% in Fig. 10a corresponds to a relative reduction of the diffuser reflectance by 1% (e.g. from a reflectance of 0.3 to 0.297). The reflectance of the daily diffuser has decreased significantly in the blue, but hardly at all in the SWIR. Note that the results below 325nm are very unreliable due to the low optical throughput of OCI at those wavelengths. The reflectance change versus time is shown in this PDF.
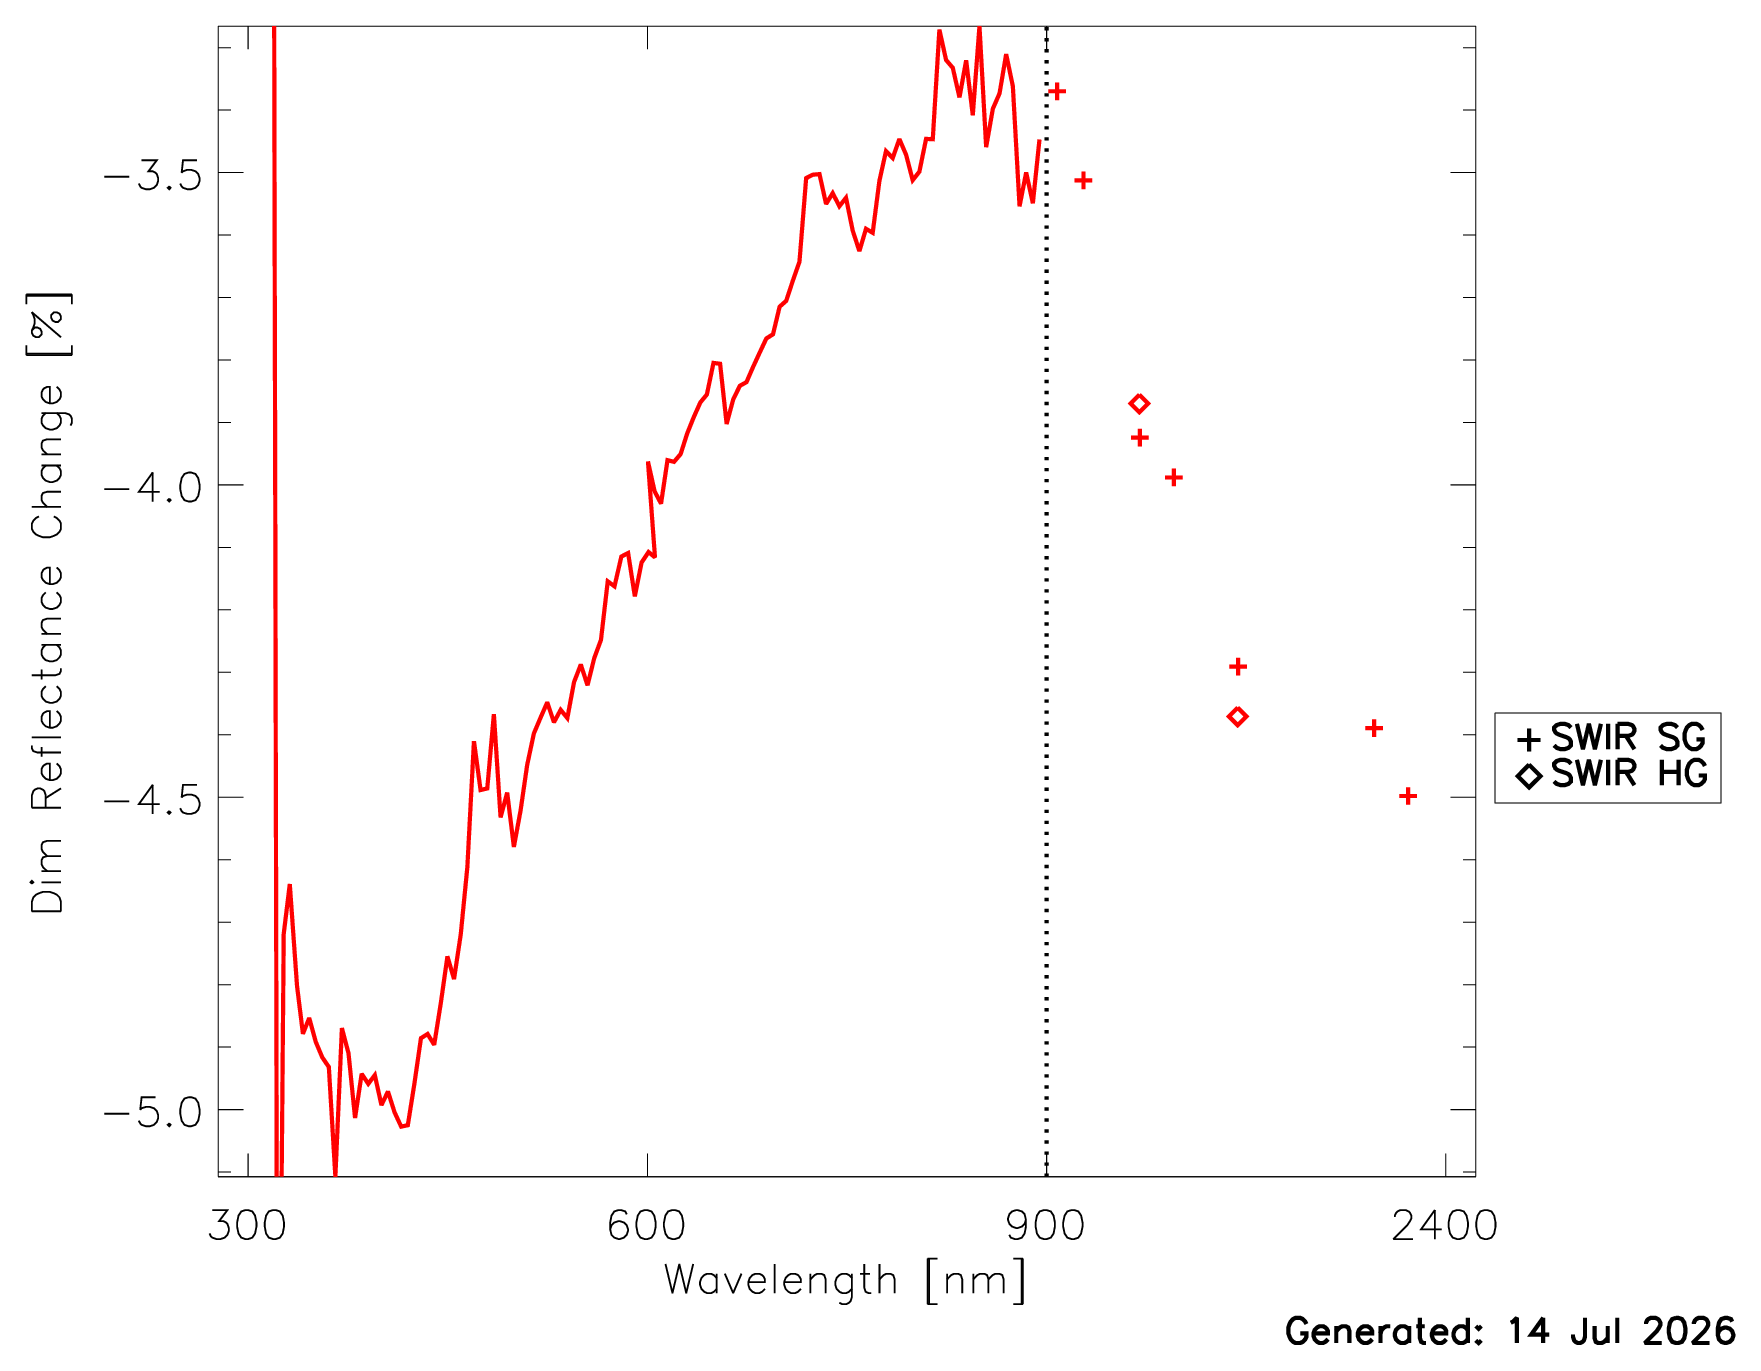
The reflectance change of the dim diffuser is calculated from the dim diffuser radiances measured monthly by OCI using the radiometric gains (as a function of time) derived from the bright solar diffuser. The results are shown in Fig. 10b. For the red wavelengths, the dim diffuser degraded much more than the bright solar diffuser on a relative basis, but since its reflectance is only a tenth of the reflectance of the bright solar diffuser (see Fig. 5 in Meister et al., 2024), its absolute change in reflectance is smaller.