This page shows comparisons between OCI cloud top height (CTH) retrievals and ground observations of clouds from two sources: the US Department of Energy (DOE) Atmospheric Radiation Measurement (ARM) data from the KAZRARSCL data product, and the Aerosols Clouds, and Trace Gases Research Infrastructure (ACTRIS) Cloudnet classification data product. The OCI retrievals are based on the CHROMA algorithm, described by Sayer et al. (2023). The matchup protocol is described in Sayer et al. (2025). At present, we have data from 6 ARM sites and 26 Cloudnet sites, with locations shown in the map below.
Summary plots and metrics are presented for three categories: single-layer opaque (visible optical thickness > 3) clouds; optically-thin (<3) clouds; and multi-layer clouds. Summary metrics are given in the table below for the data set as a whole. These include the number of matchups; fraction of matchups agreeing within the 60 mb goal for single-layer opaque clouds (F60); fraction of matchups agreeing within the expected discrepancy defined by retrieval and ARM uncertainty estimates (FED); Spearman's rank correlation coefficient (RS); and the median OCI-ARM bias, median absolute error (MAE), and root mean square error (RMSE), all in km.
|
Summary Statistics Table Click to download statistics for individual sites | Click to view scatter plots for individual sites |
|||||||
|---|---|---|---|---|---|---|---|
| Category | Count | F60 | FED | RS | Median bias (km) | MAE (km) | RMSE (km) |
| All clouds | 10379 | 0.39 | 0.47 | 0.65 | -0.43 | 1.28 | 3.00 |
| Thin clouds | 2325 | 0.26 | 0.50 | 0.56 | -0.57 | 2.00 | 3.47 |
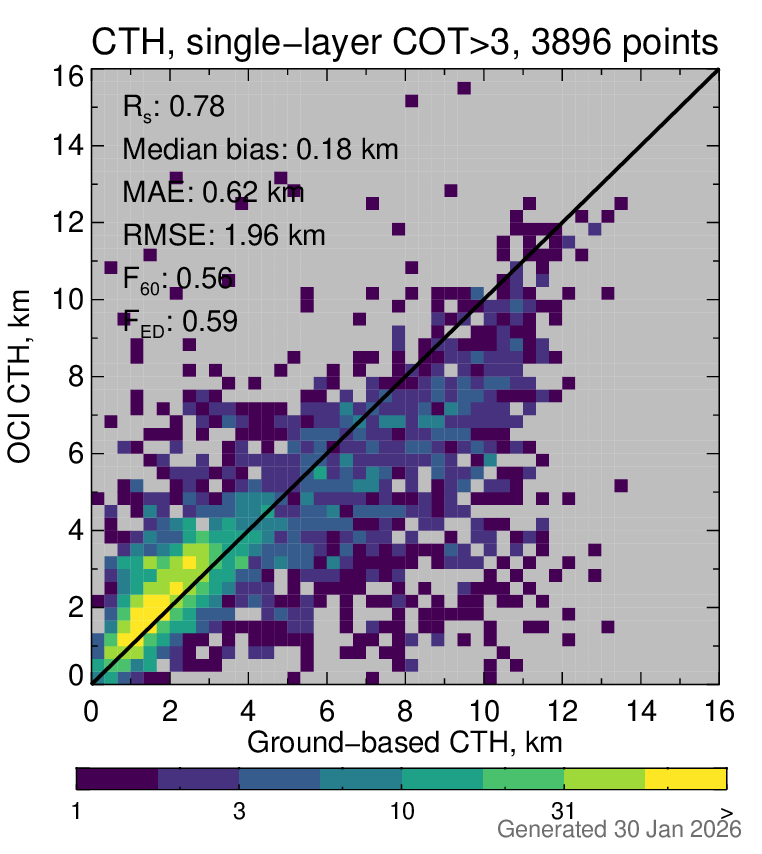
| Single-layer opaque clouds | 3896 | 0.56 | 0.59 | 0.78 | 0.18 | 0.62 | 1.96 |
| Multi-layer clouds | 4158 | 0.31 | 0.33 | 0.54 | -1.99 | 2.14 | 3.49 |
In the per-site plots, the red shaded lines show the bounds of the 60 mb goal uncertainty, translated into height space. Grey lines indicate the uncertainty estimates for the OCI retrievals and ARM data. Matchups are colored blue or dark grey according to whether the OCI retrieval picks liquid or ice phase, respectively. A summary heat map for the single-layer opaque cloud set is shown below.
Additional Analysis
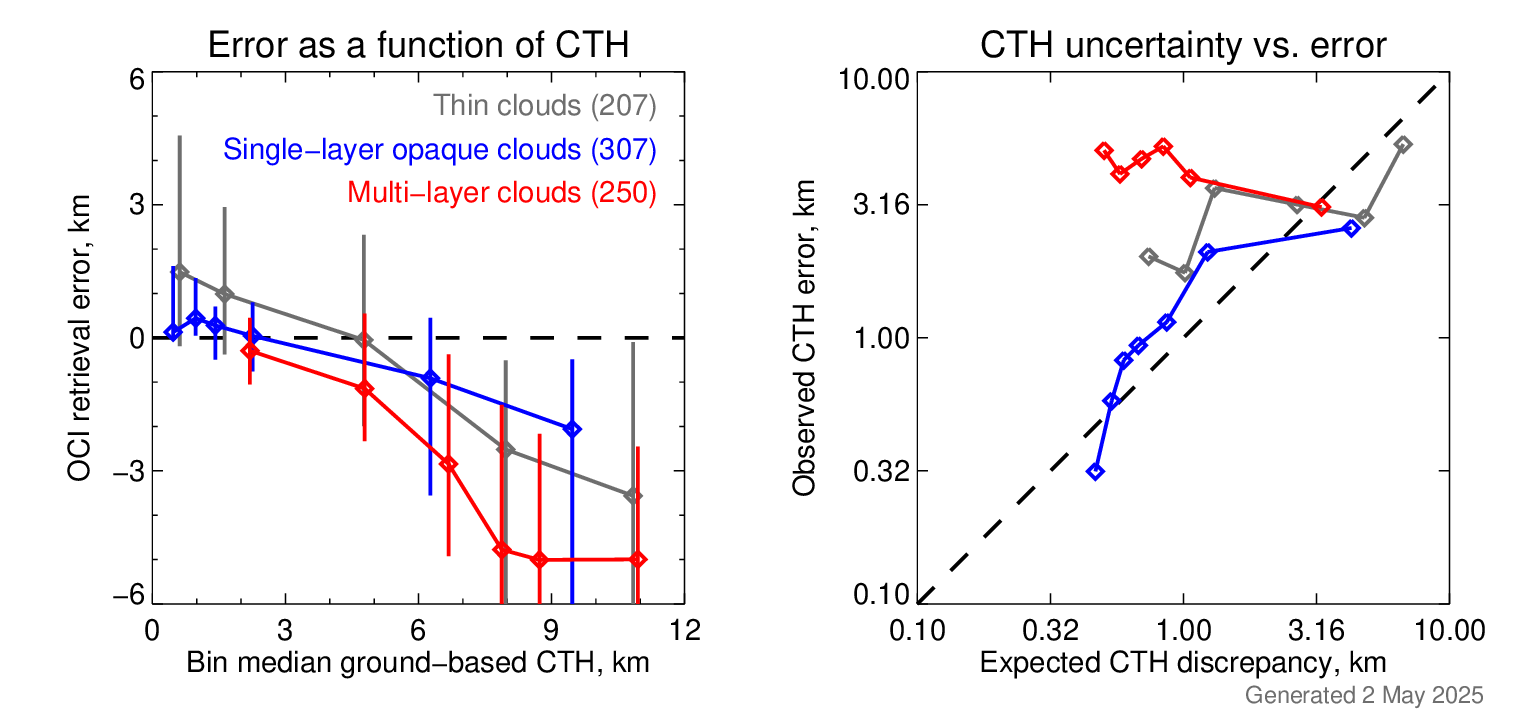
These two plots show aggregated data from all sites. The left panel shows the median (points) and central one standard deviation of variability of CTH error, as a function of ARM CTH. A perfect retrieval would be a straight line across zero error. From this we observe a tendency for increasing negative bias as CTH increases, although the situation is best for single-layer opaque clouds. The right panel shows binned estimates of CTH retrieval uncertainty vs. observed retrieval error. A well-calibrated and skillful uncertainty estimate would like along the 1:1 line. From this we conclude that there is some skill in the uncertainty estimates for the case of single-layer opaque clouds, but not for thin or multi-layer clouds.
The color coding is given in the legend, along with the total matchup count, and is the same for both panels.