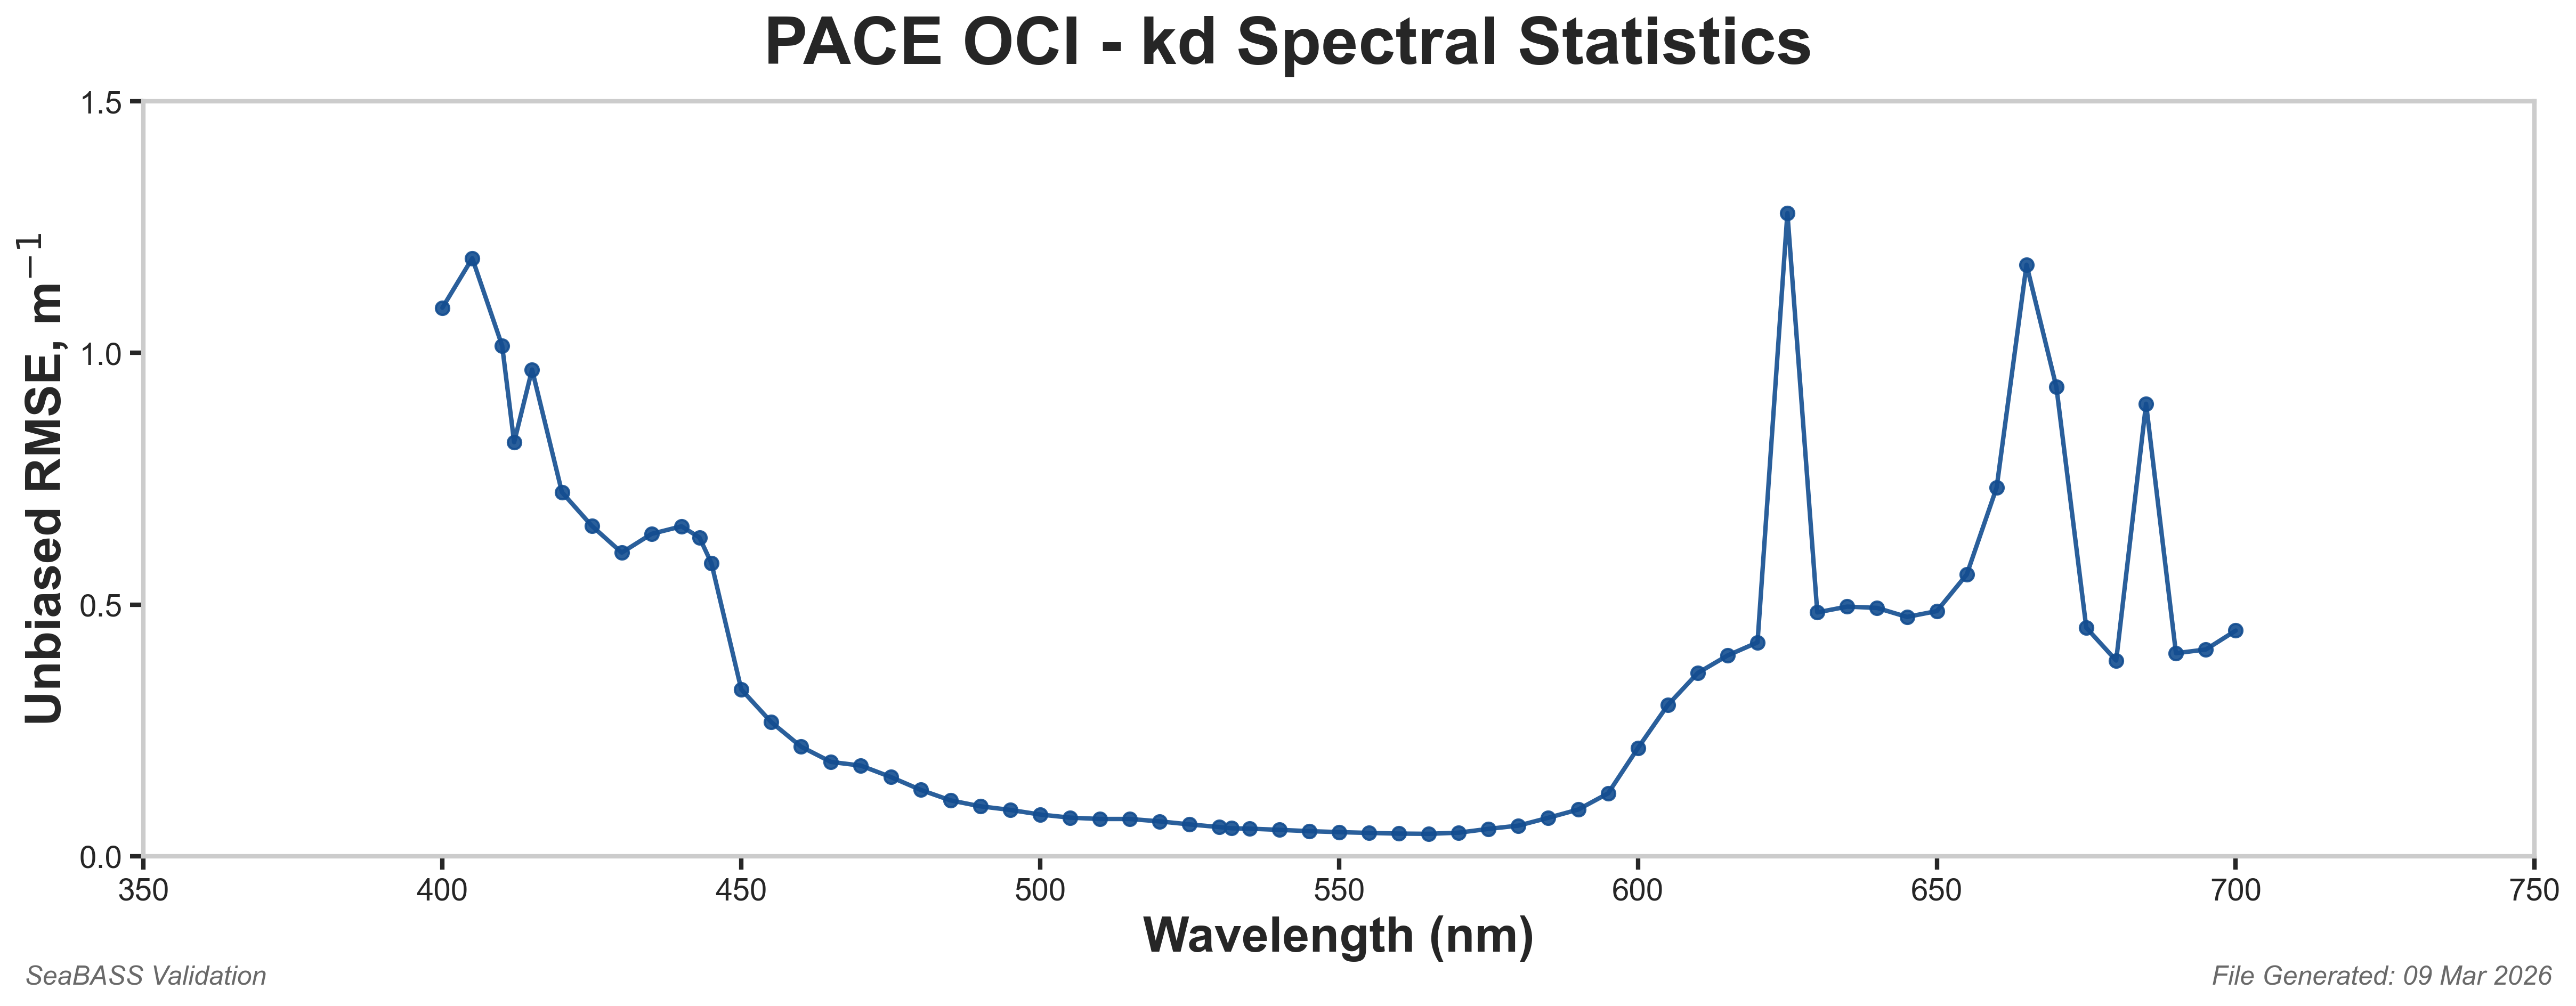
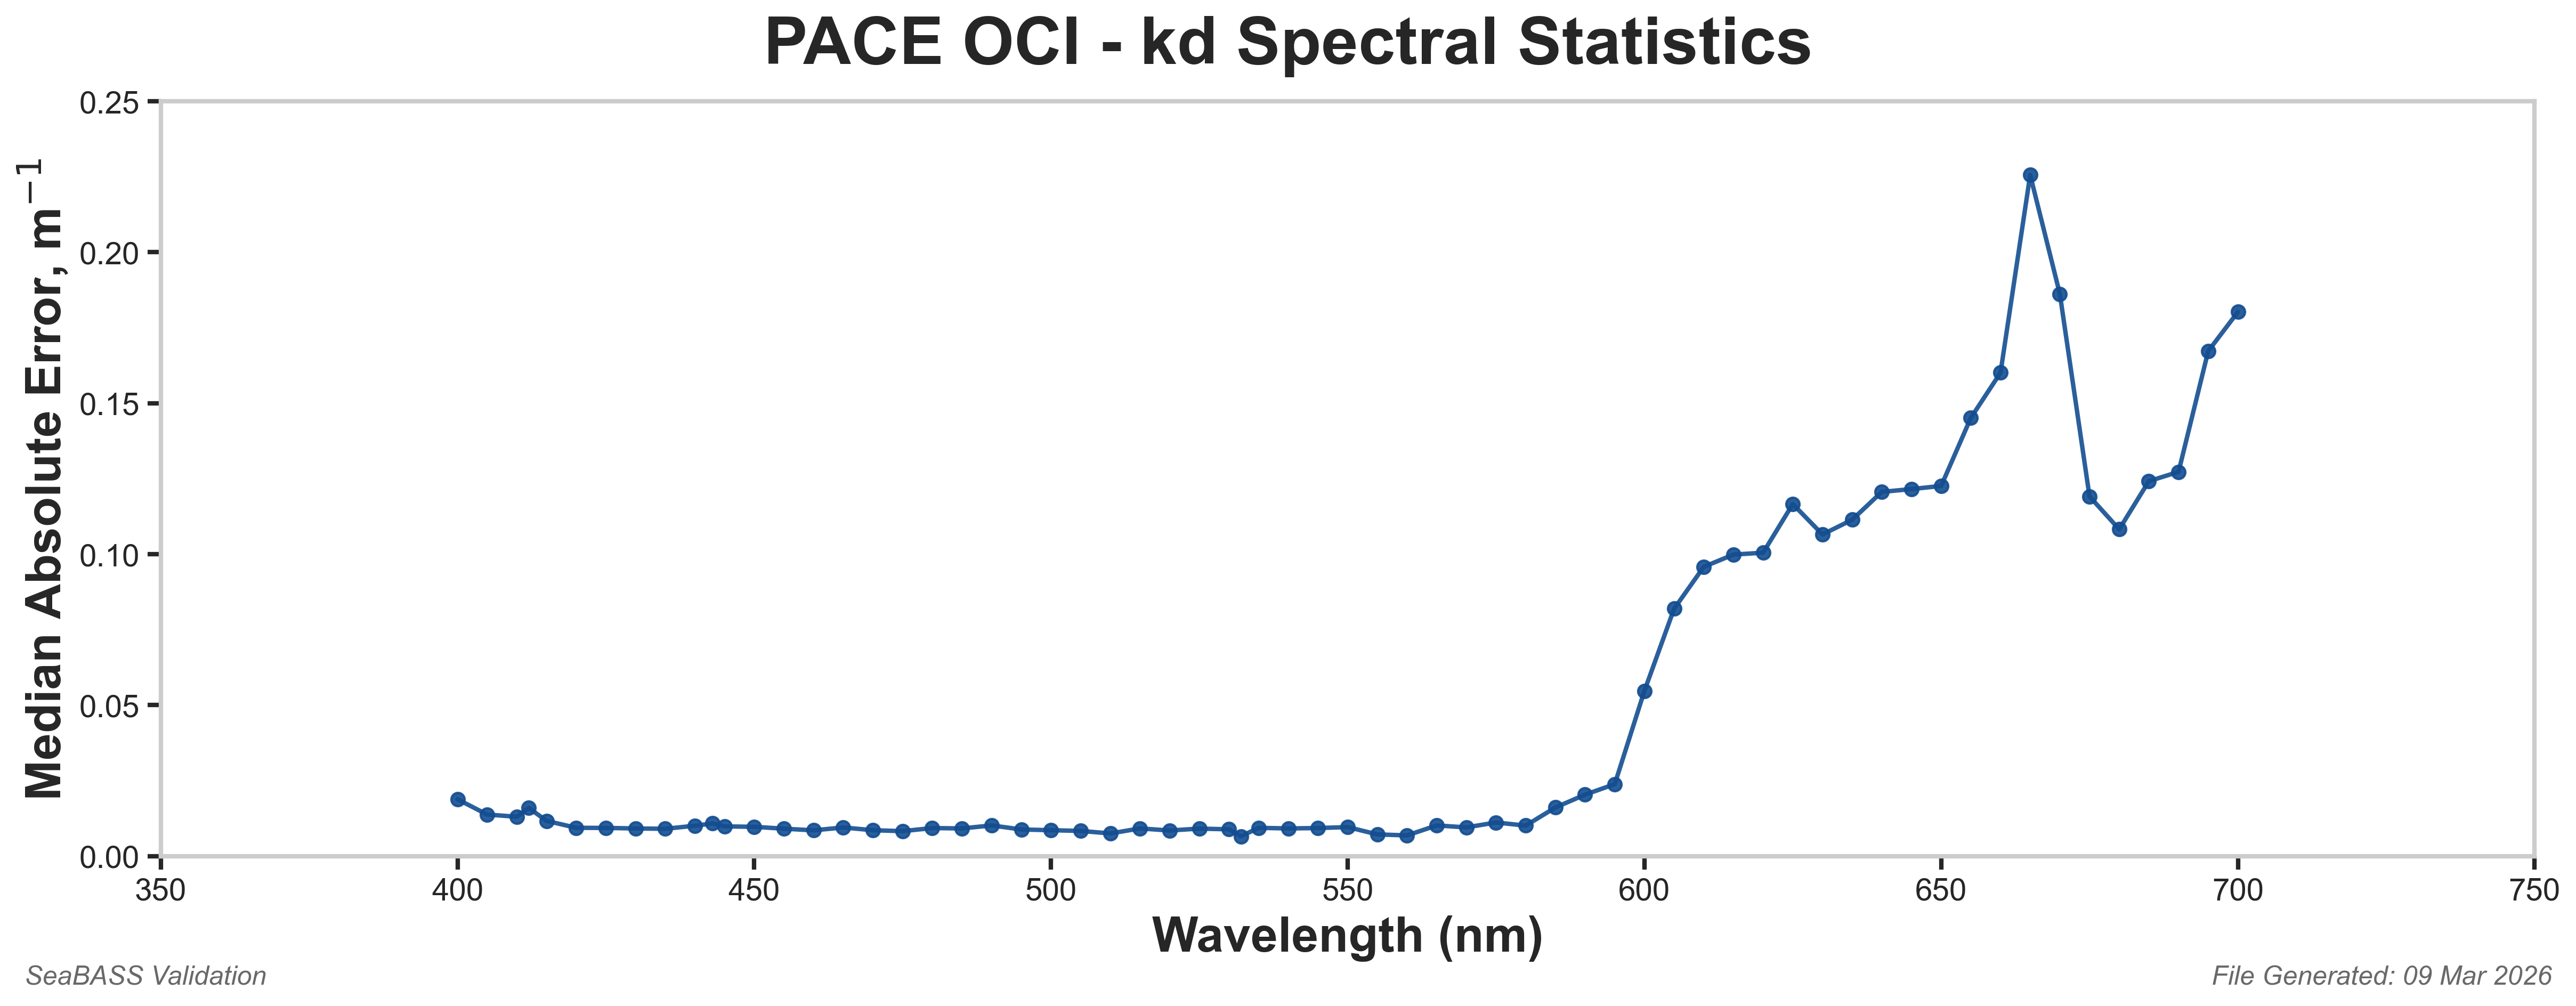
Here, we validate the spectral Diffuse Attenuation Coefficient of Downwelling Irradiance (Kd, units: m-1), which describes how sunlight of different wavelengths (colors) is dissipated as it travels downward into the ocean. For PACE-OCI, Kd is modelled as a function of derived inherent optical properties (IOPs; absorption and backscattering coefficients). These IOPs are first derived from PACE-OCI Kd (see algorithm description).
|
Diffuse Attenuation Coefficient of Downwelling Irradiance (Kd) Click to download data: Select Kd matchup statistics | Select Kd matchups |
||||||||||
|---|---|---|---|---|---|---|---|---|---|---|
| Wavelength | Mean Bias | Limits of Agreement | Linear Slope | Linear Intercept | Linear Correlation | Rank Correlation | uRMSE [View plot] |
MedAE [View plot] |
Matchup Plots | |
| Low | High | |||||||||
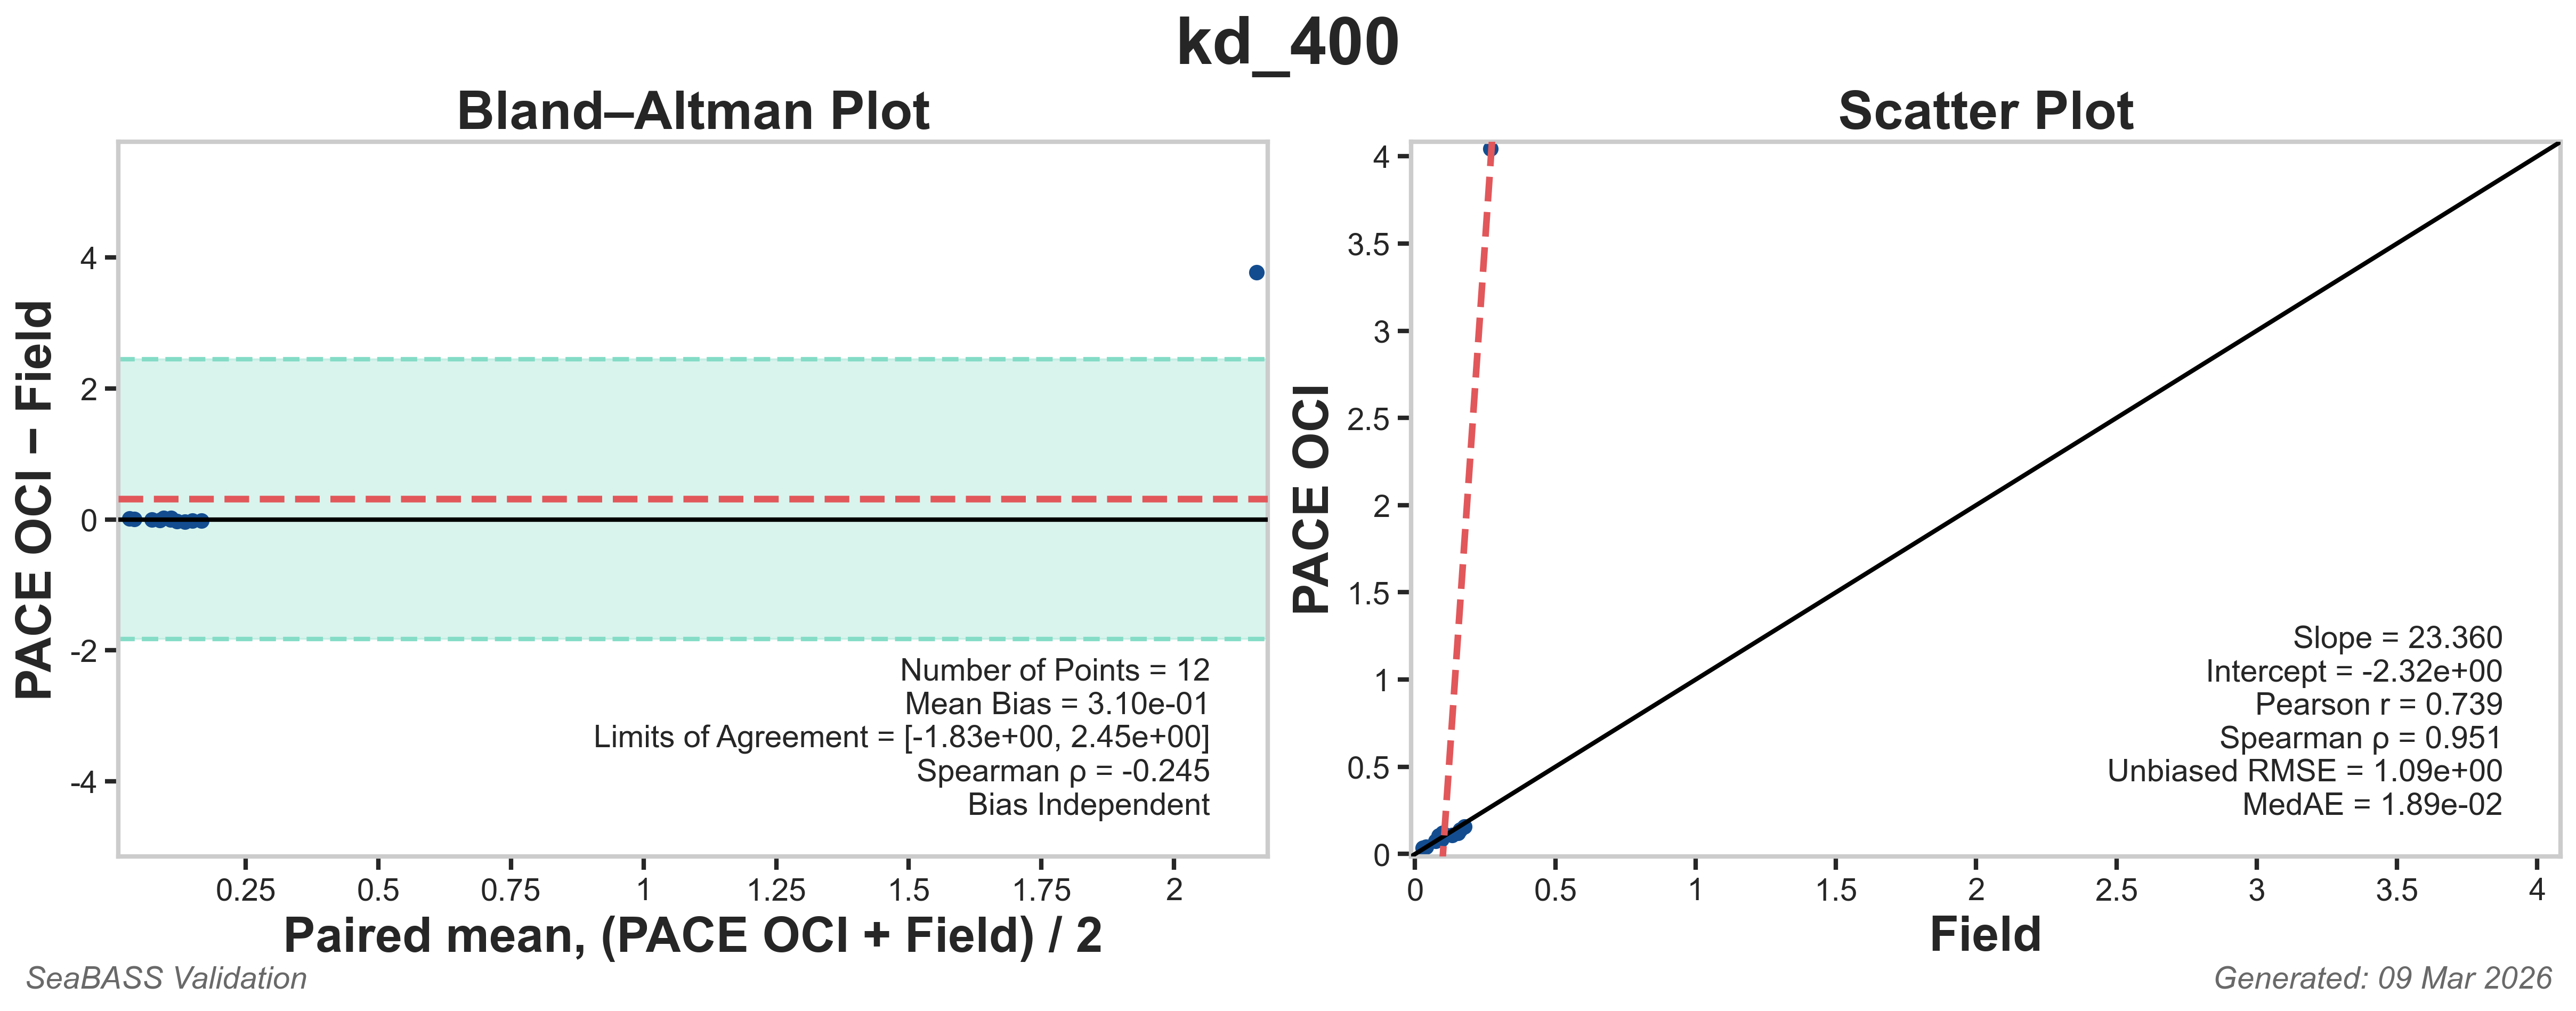
| Kd_400 | 0.0419 | -0.123 | 2.07 | 2.32 | -0808 | 0.88 | 0.919 | 0.082 | 0.0137 | Click here |
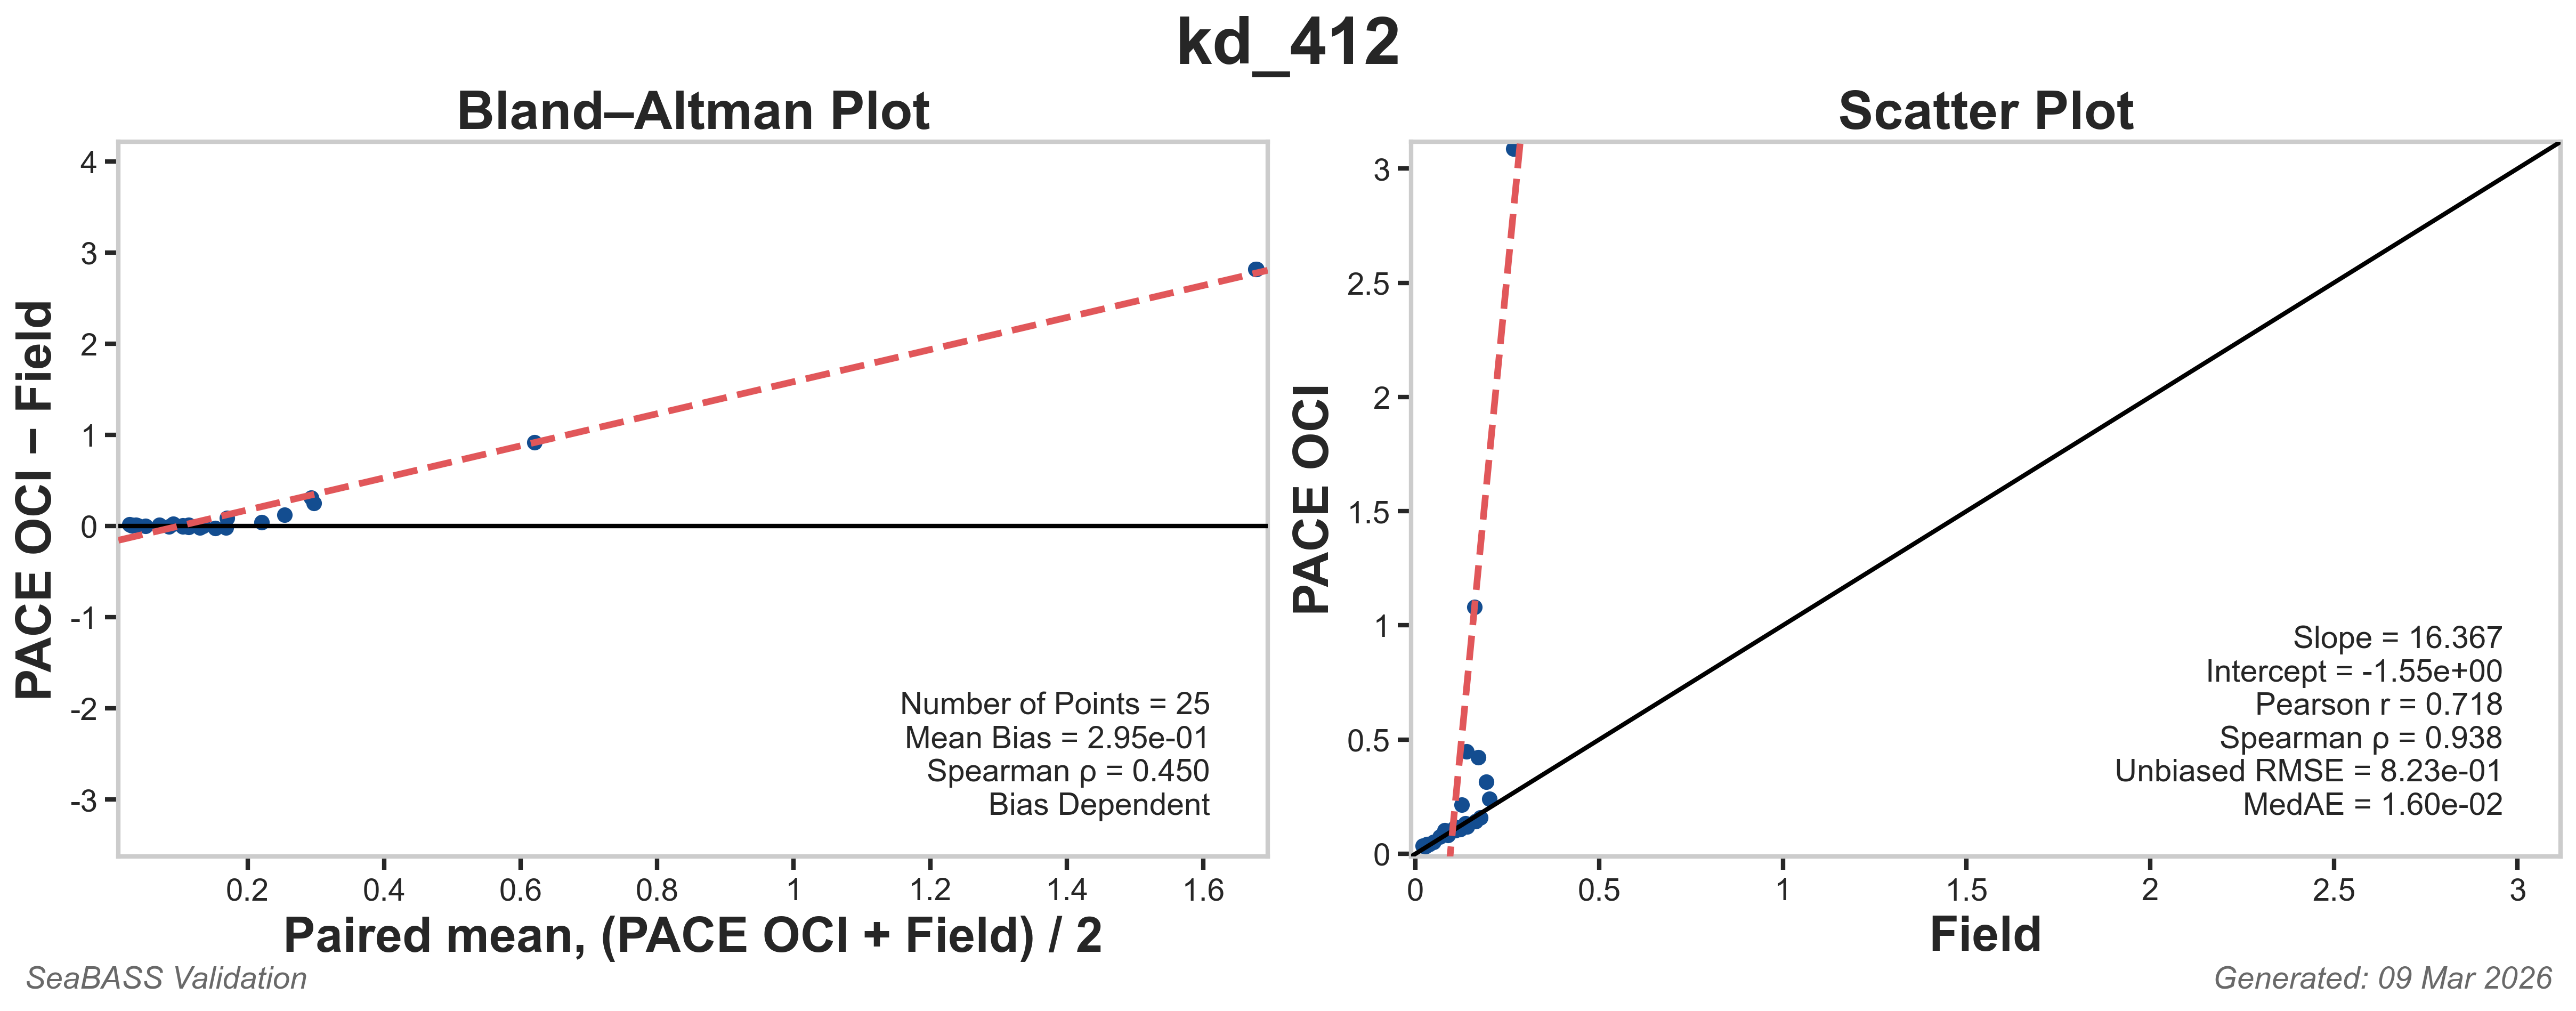
| Kd_412 | 0.217 | -999 | -999 | 8.74 | -0.826 | 0.587 | 0.802 | 0.559 | 0.014 | Click here |
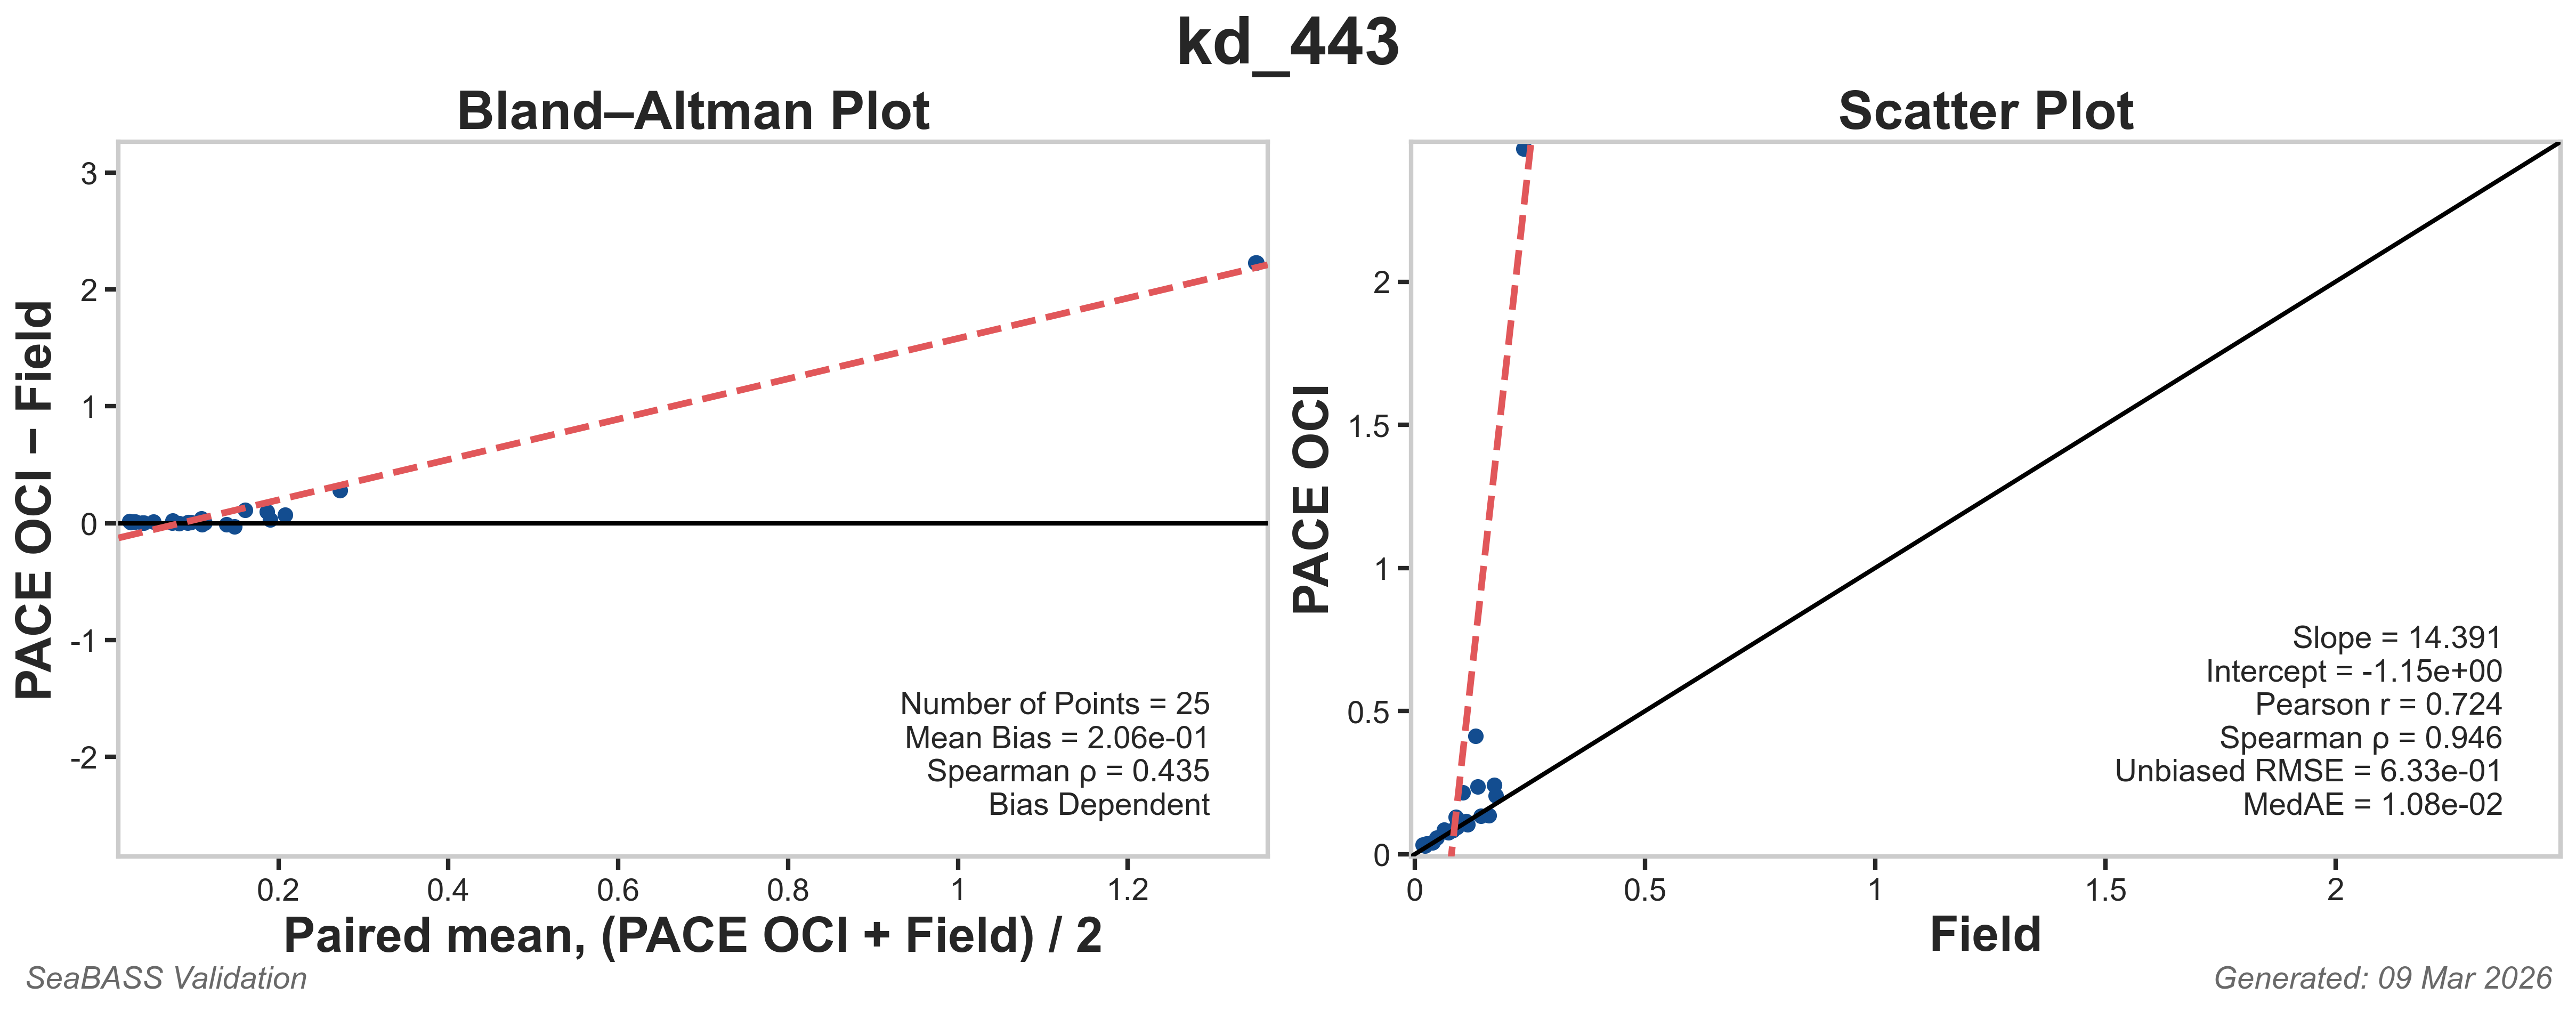
| Kd_443 | 0.228 | -999 | -999 | 13.6 | -1.26 | 0.506 | 0.943 | 0.721 | 0.0135 | Click here |
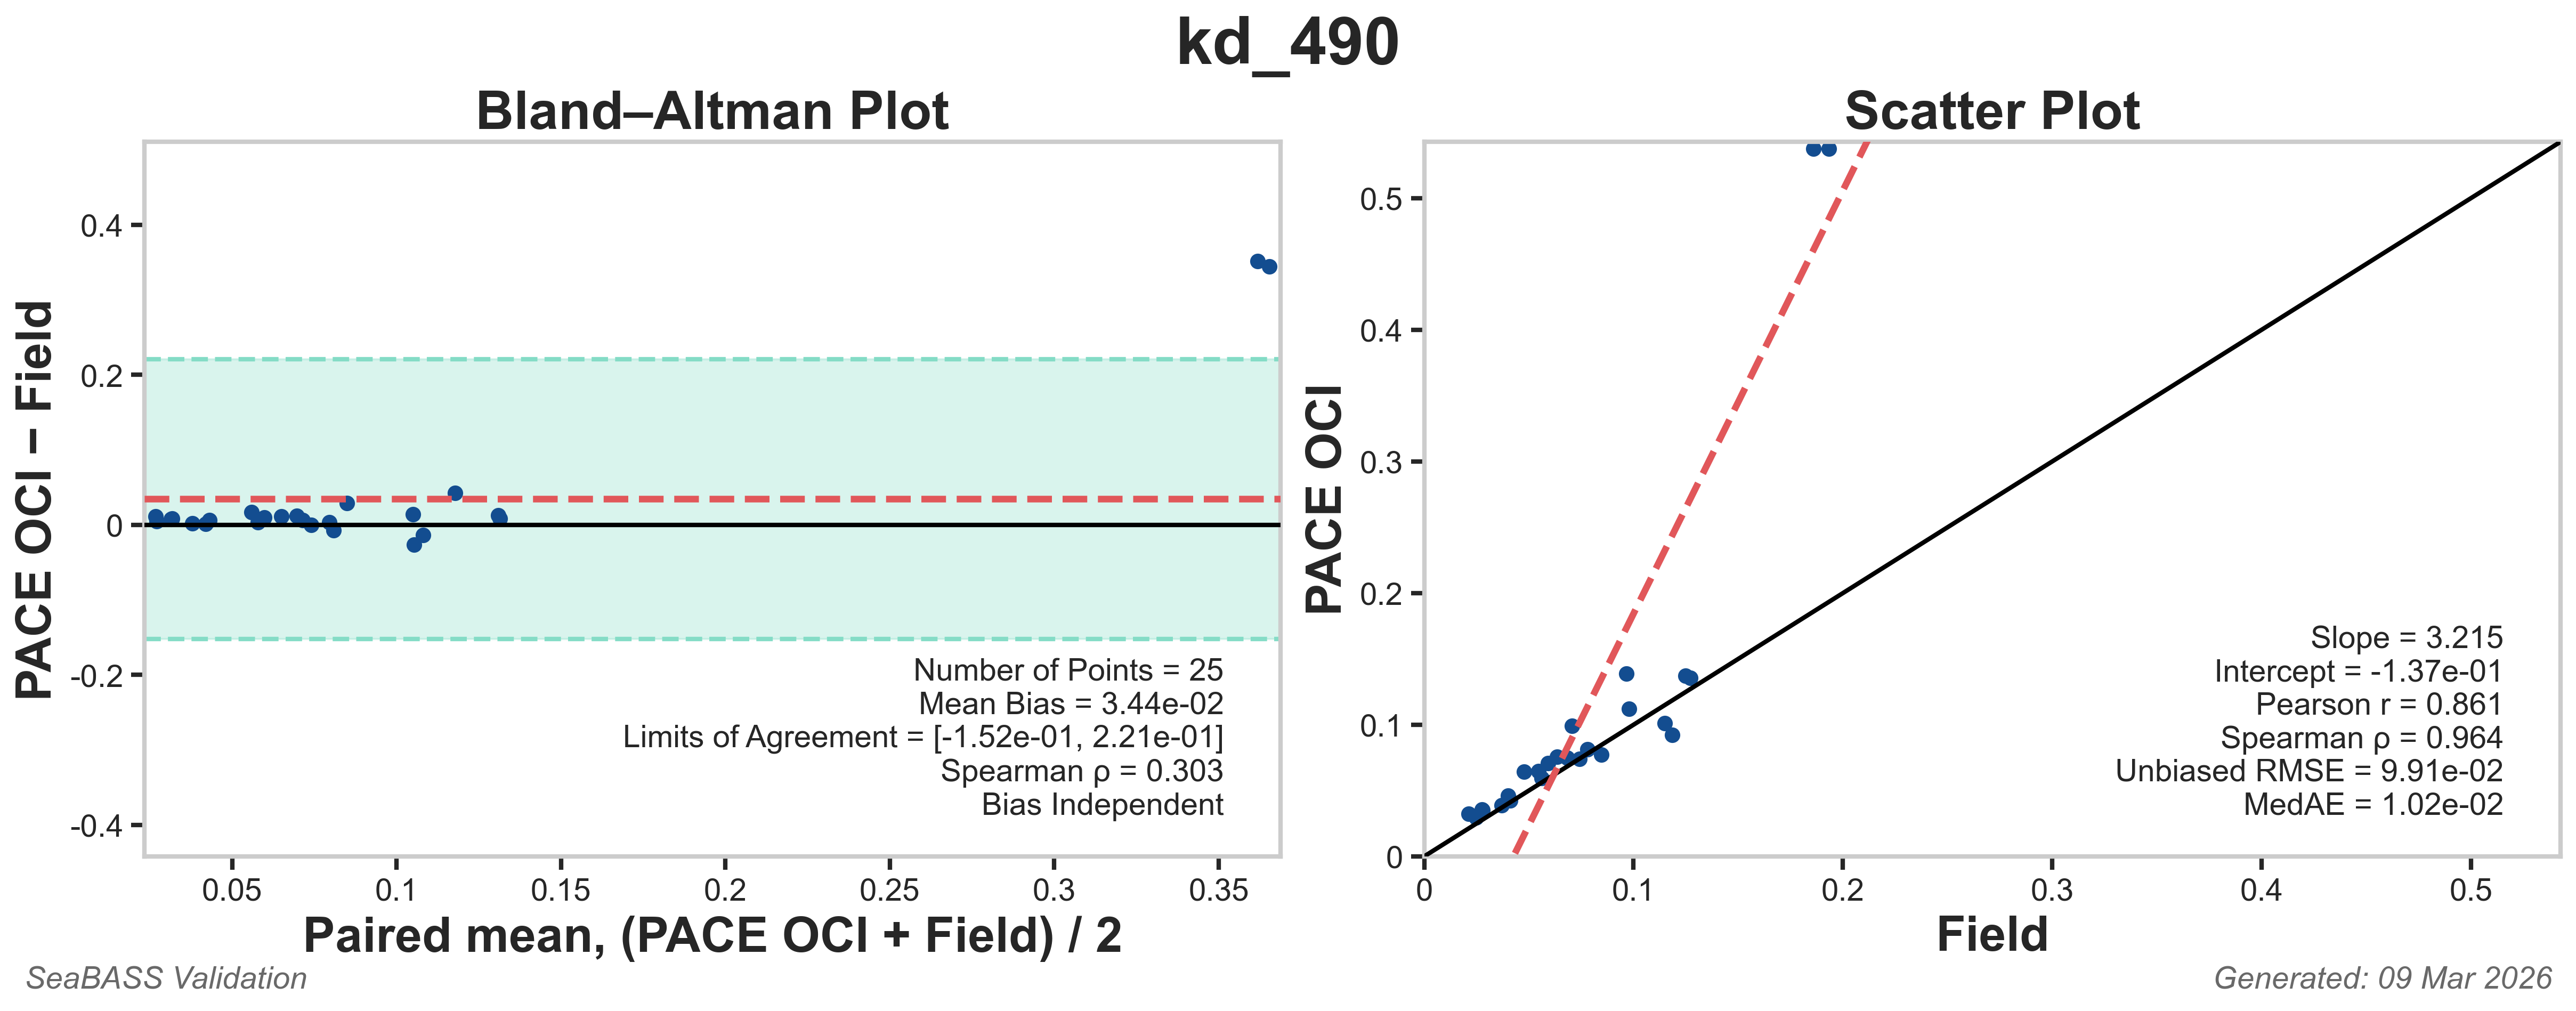
| Kd_490 | 0.0382 | -0.17 | 0.246 | 2.11 | -0.0633 | 0.777 | 0.954 | 0.104 | 0.00961 | Click here |
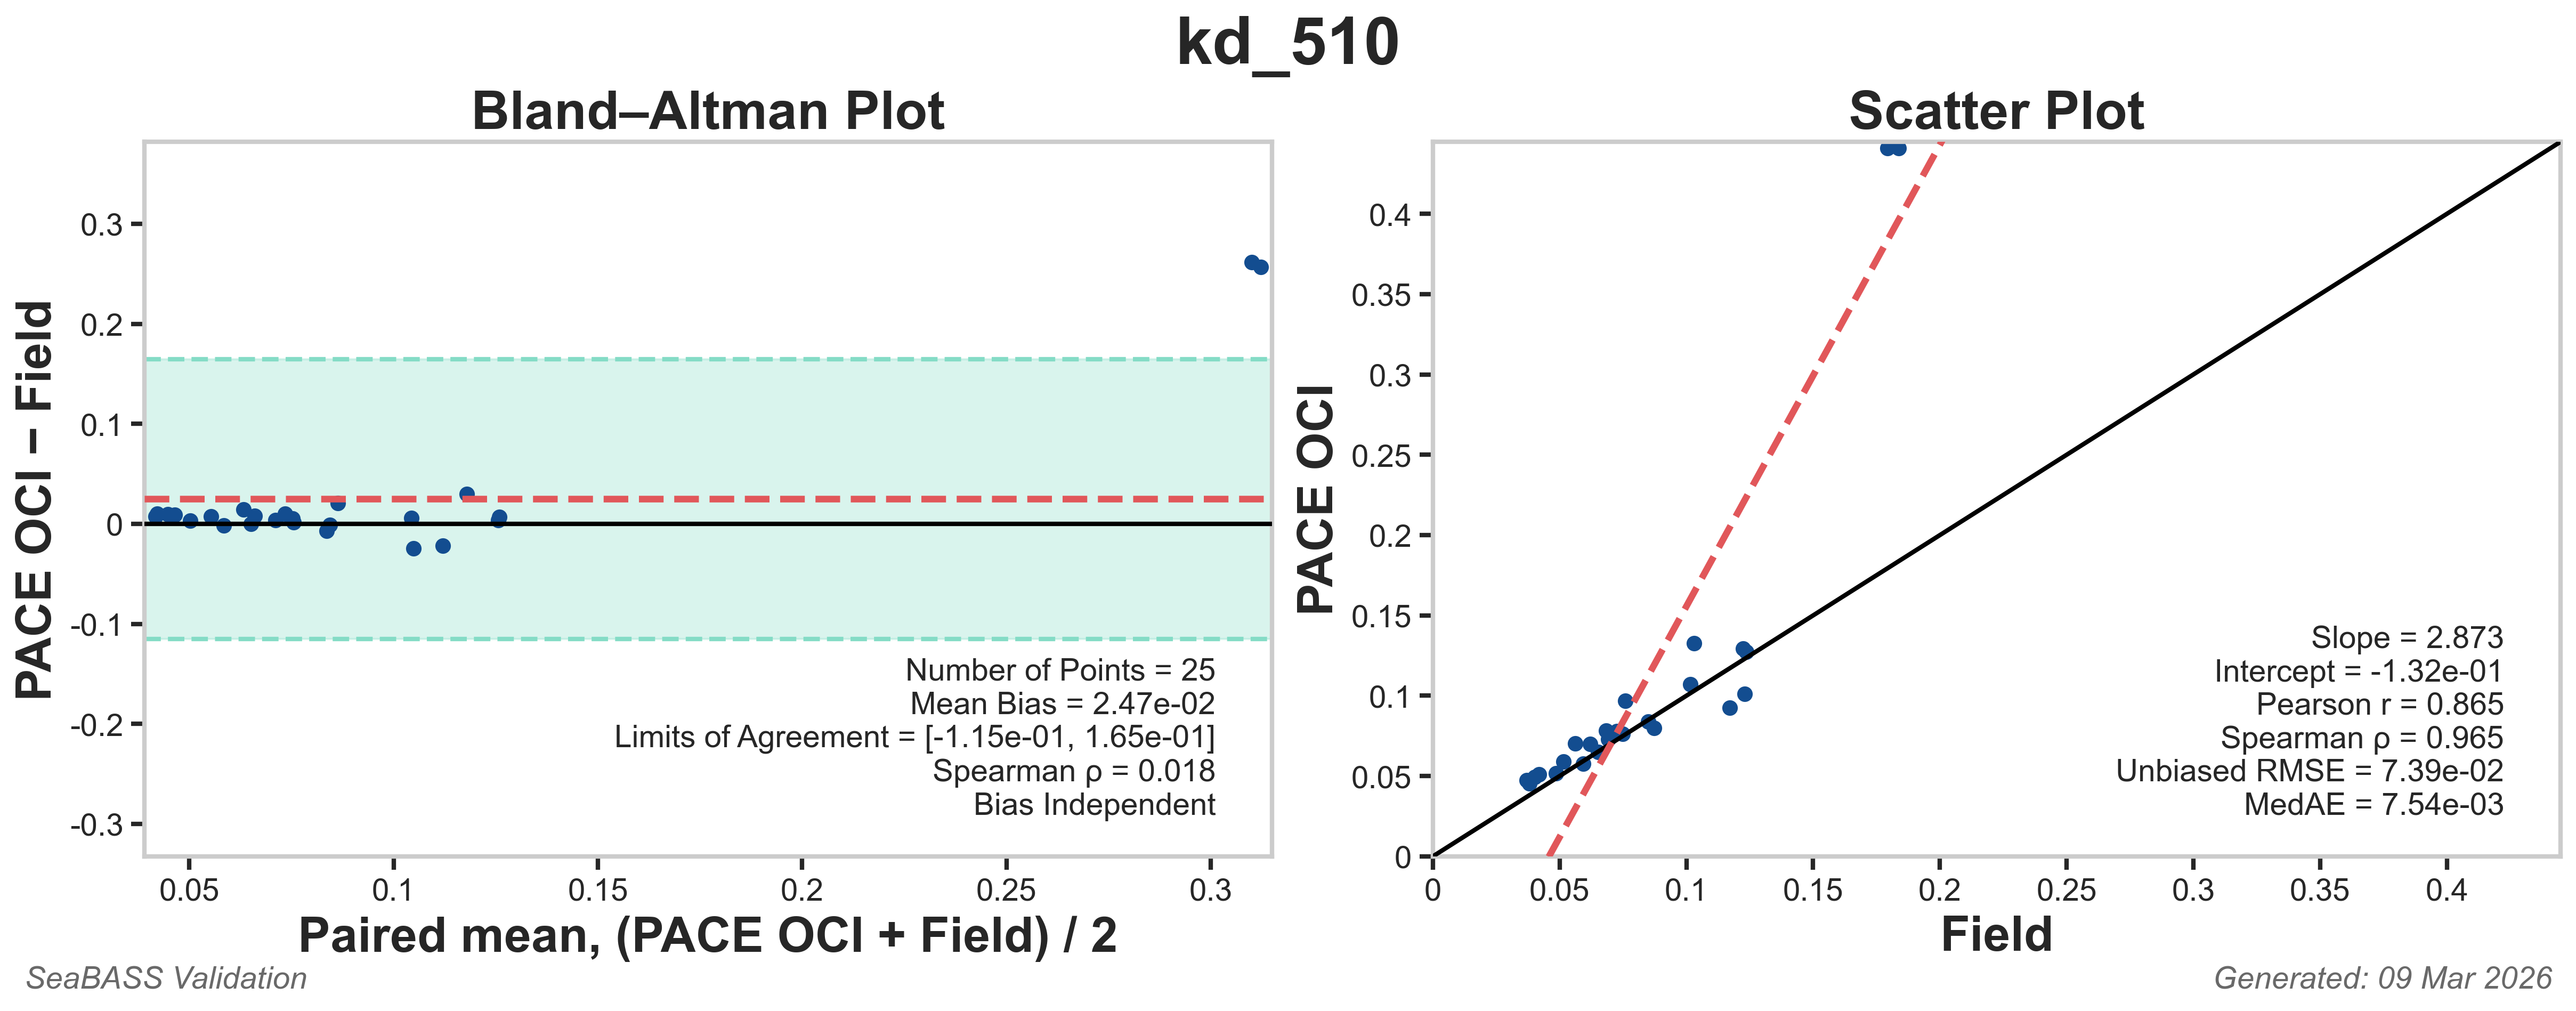
| Kd_510 | 0.027 | -0.124 | 0.178 | 1.75 | -0.0421 | 0.773 | 0.938 | 0.0756 | 0.0108 | Click here |
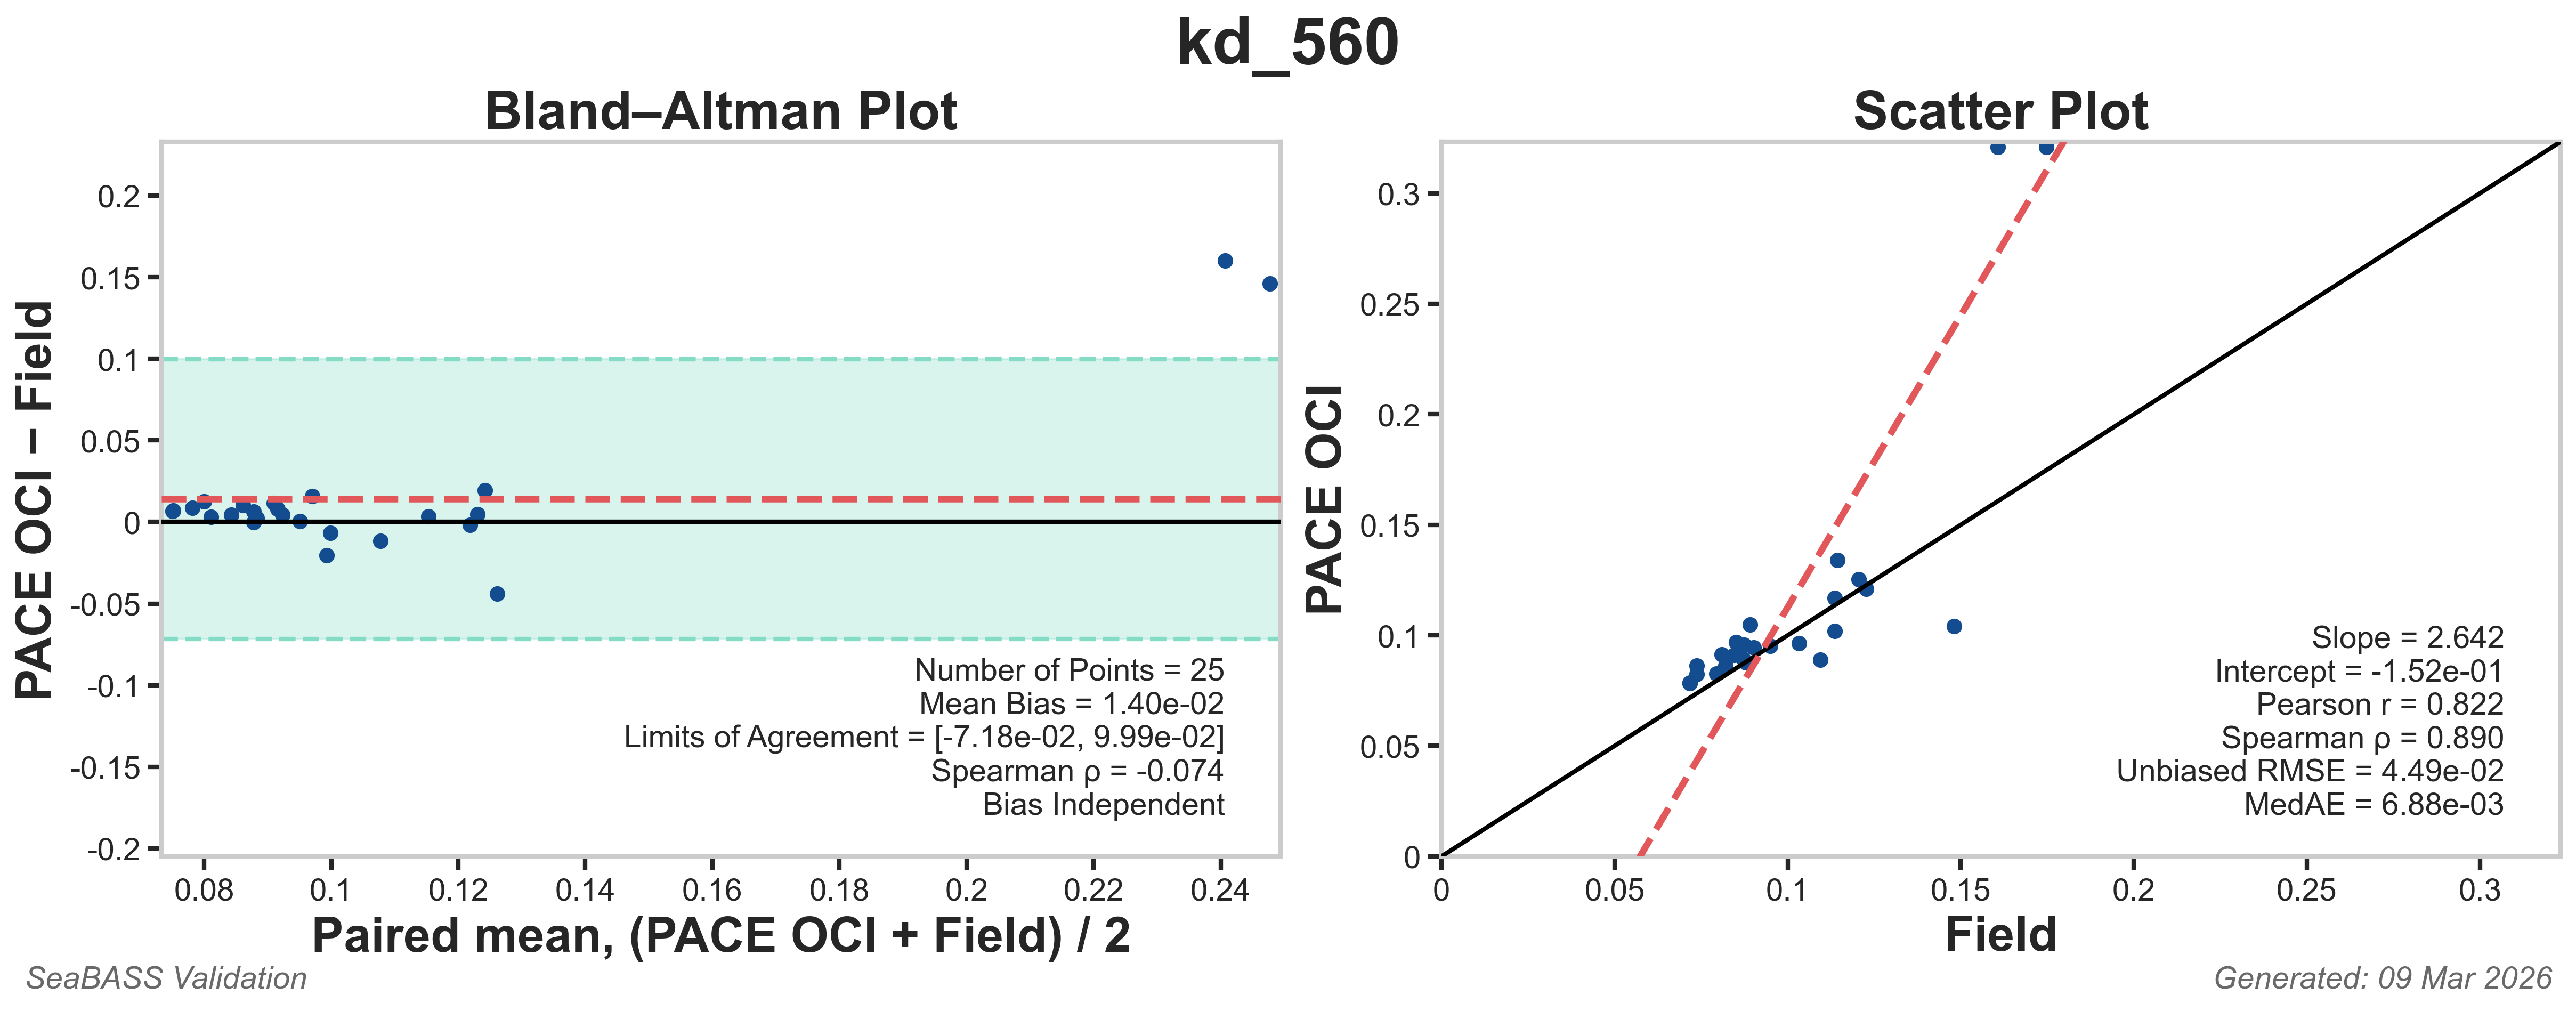
| Kd_560 | 0.0167 | -0.0667 | 0.1 | 2.17 | -0.0892 | 0.642 | 0.803 | 0.0419 | 0.00983 | Click here |
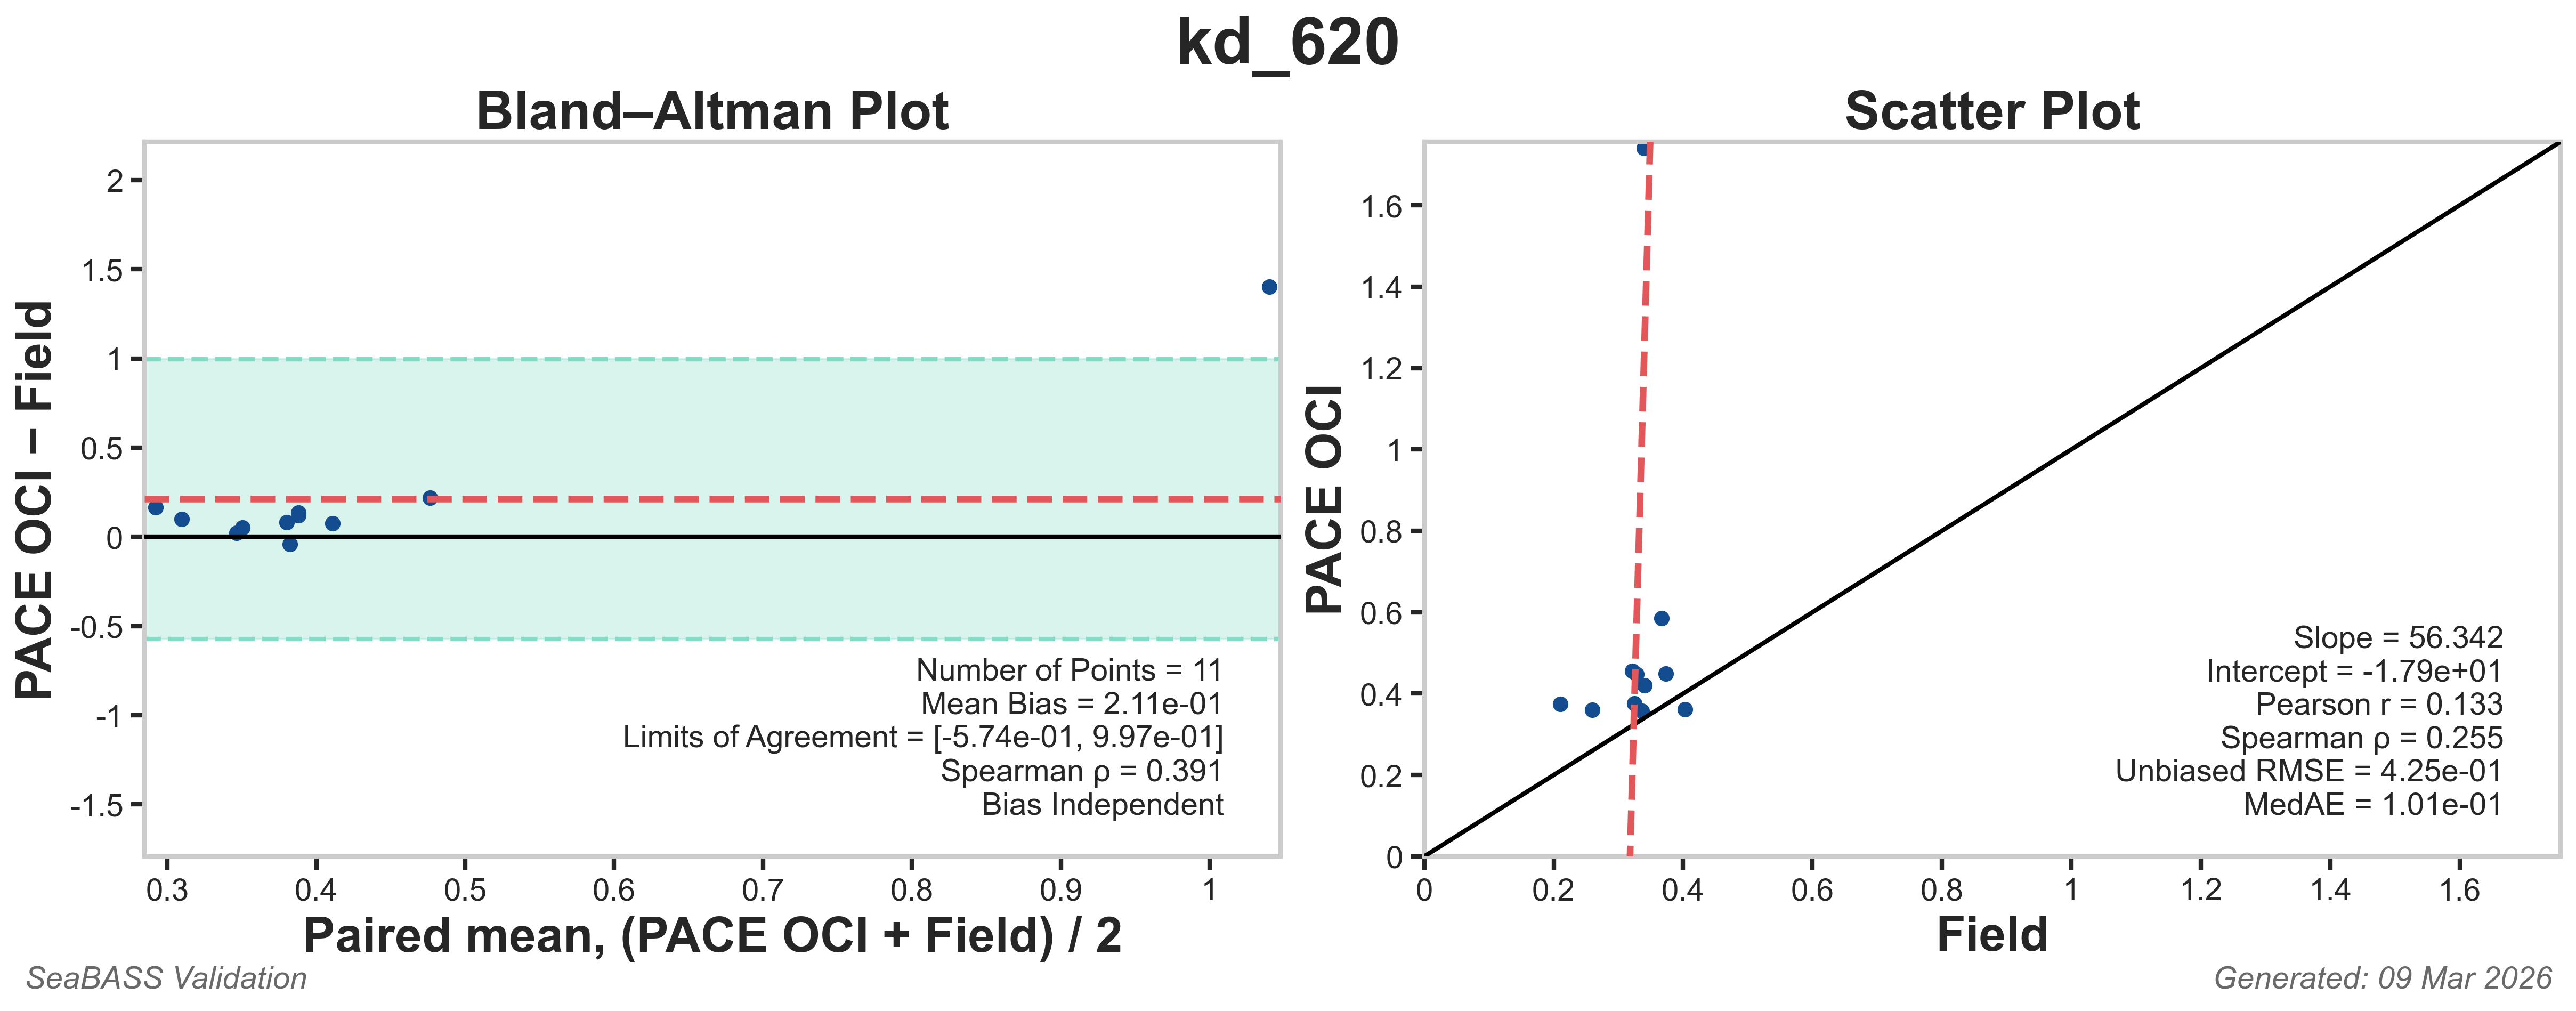
| Kd_620 | 0.331 | -0.83 | 1.49 | 213 | -65.2 | -0.306 | -0.0693 | 0.576 | 0.114 | Click here |
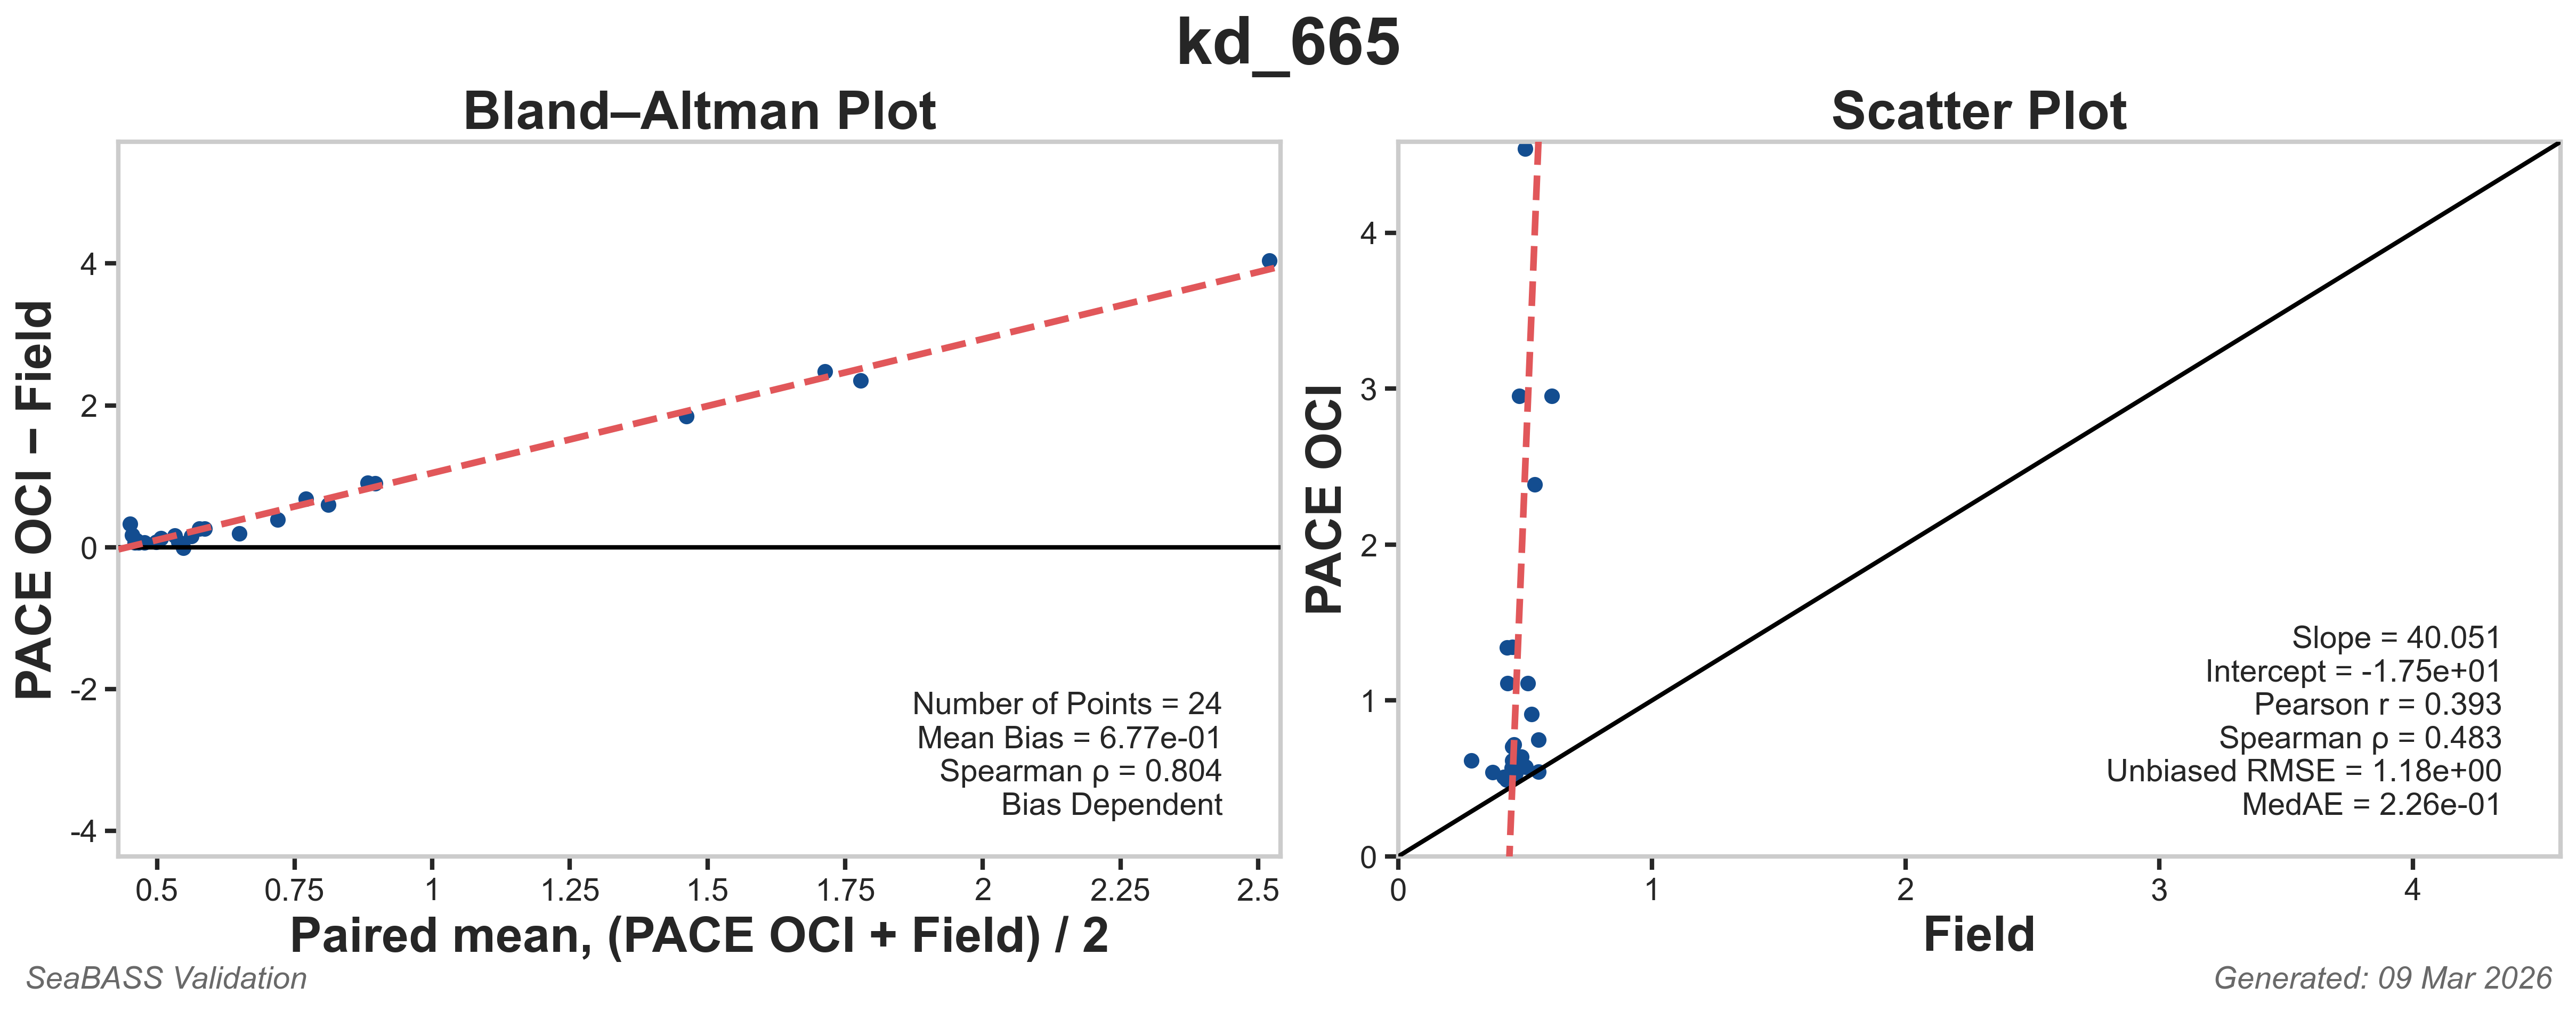
| Kd_665 | 0.835 | -999 | -999 | 87.3 | -38 | 0.179 | 0.314 | 1.17 | 0.171 | Click here |
Disclaimer: The unbiased RMESs and Median Absolute Errors shown in the hyperspectral plots are preliminary. Visitors should expect updated values over time due to incoming datasets with different spatial and temporal variability coverages and dynamic ranges, as well as to algorithm refinements.
Kd Matchup Plots
The data plotted below are Bland-Altman plots and Scatter plots for select Kd matchups.