
Blog
The Ocean's Hidden Garden
Posted on Wednesday, September 2, 2026 at 12:00:00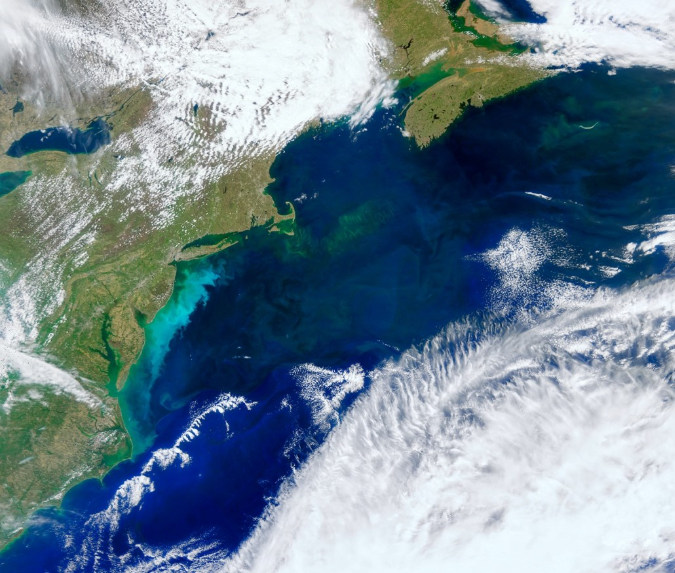
For decades, scientists have known that ocean phytoplankton are incredibly diverse, but satellite technology had not kept up with this biological reality. Traditional ocean color satellites detect chlorophyll concentrations but miss the group-level complexity underneath.
PACE changes this. A phytoplankton bloom off the U.S. East Coast demonstrates how NASA's newest satellite reveals entire microscopic ecosystems in detail, identifying multiple phytoplankton groups simultaneously across hundreds of kilometers of ocean.
Breaking the group barrier
Ocean color satellites excel at measuring total phytoplankton biomass, but marine ecosystems don't work that way. Different groups have different ecological functions. Some build calcium carbonate shells that affect ocean chemistry. Others fix nitrogen or produce toxins. Understanding marine ecosystems requires knowing where which groups live, not just total biomass.
PACE's three instruments approach this problem from different angles, creating the first satellite system capable of true phytoplankton community analysis.
Hyperspectral capabilities
The Ocean Color Instrument (OCI) captures the entire visible spectrum at high spectral resolution rather than measuring a few broad color bands. This reveals subtle differences in how different phytoplankton groups absorb and reflect light, like a fingerprint for each group.
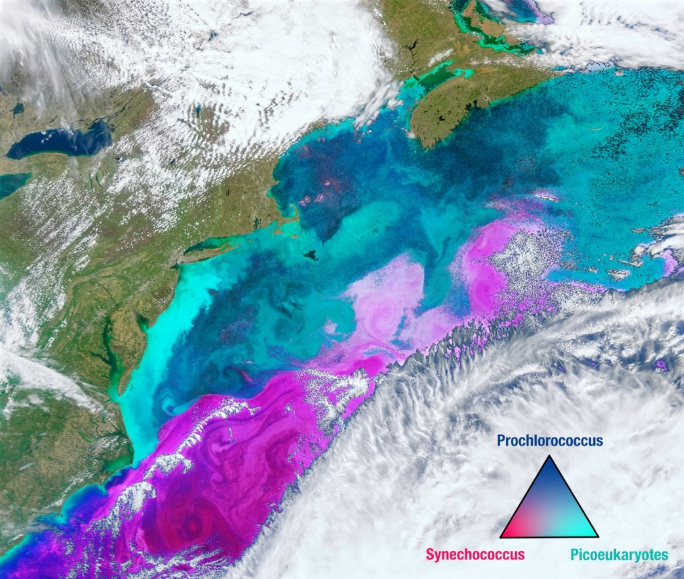
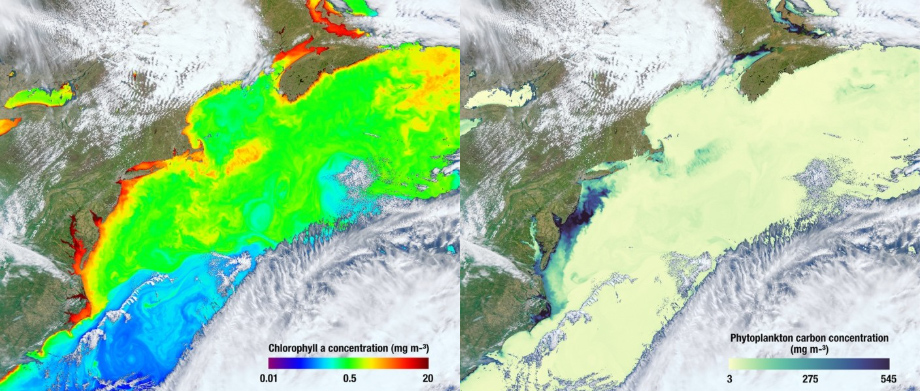
The MOANA algorithm distinguishes Synechococcus, Prochlorococcus, and picoeukaryotes in our East Coast example, showing where ocean fronts are found. Previous satellites miss these microscopic organisms or lump them together. Another hyperspectral algorithm, the GPIG algorithm, identifies the distinct pigment signatures of diatoms, dinoflagellates, haptophytes, and green algae, showing another set of different patterns in the ocean.
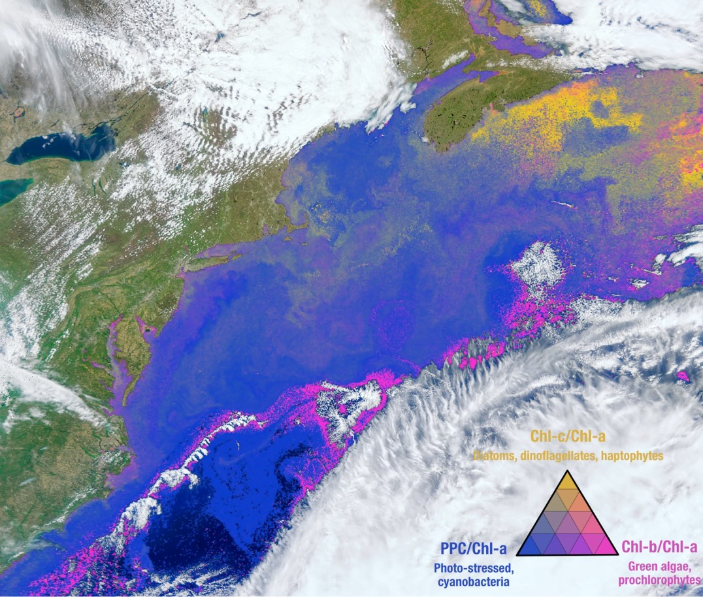
Phytoplankton carbon concentration also detects a large coccolithophore bloom that appears nearly invisible to standard chlorophyll measurements. All these images show how plankton diversity requires a broad array of observations to be fully understood.
Polarization measurements
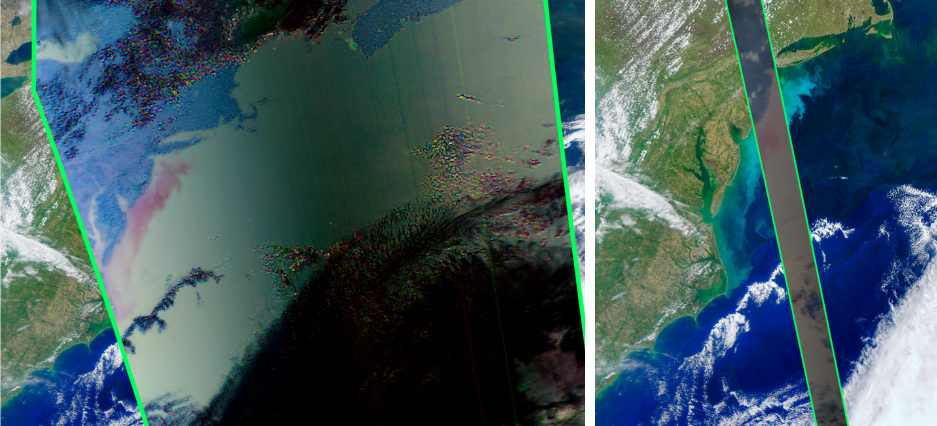
Measurements of light polarization with PACE's two polarimeters reveal more information to better understand the ocean. HARP2 (Hyper-Angular Rainbow Polarimeter #2) measures how phytoplankton influence the polarization of sunlight, allowing scientists to infer structural information about microscopic organisms from space. The coccolithophore bloom produces a distinctive polarization signature through light scattering from calcified shells.
Different cellular structures produce different polarization patterns, potentially allowing scientists to distinguish groups based on physical architecture rather than just chemistry.
Multi-angle scattering
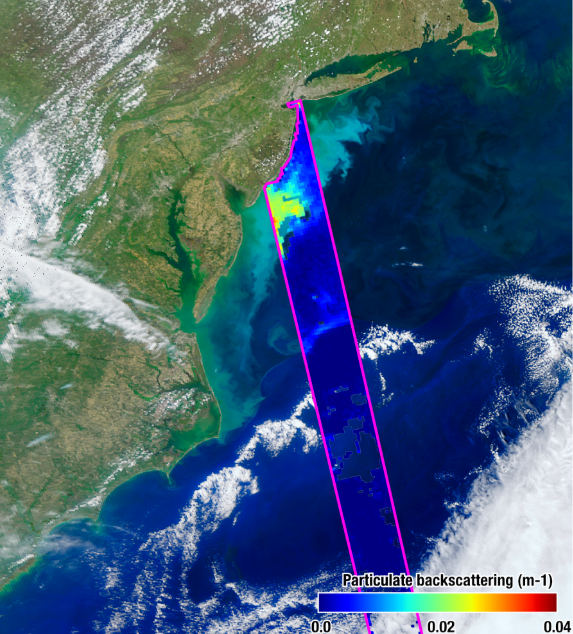
SPEXone measures light scattering at multiple angles, revealing coccolithophore populations when chlorophyll-a barely detects them. Backscattering measurements show high values associated with calcified structures, demonstrating how particle properties can be inferred from scattering data.
Connecting scales
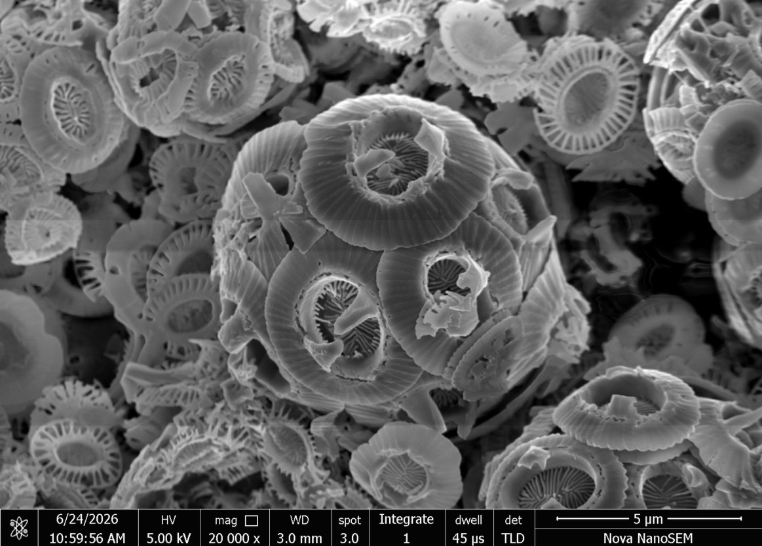
PACE connects microscopic diversity to global patterns. Electron microscopy reveals the intricate coccoliths that create the satellite signatures. The direct link between cellular structure and optical properties detected with polarimetry and scattering means space-based observations can now probe biological processes at the cellular level across ocean basins.
Research applications
Thanks to PACE, marine ecologists can track individual phytoplankton communities over time and space on global scales. Climate scientists can better understand how different groups respond to environmental changes. Fisheries researchers can link phytoplankton diversity to food web dynamics.
The East Coast bloom demonstrates these capabilities. Observations from a single satellite reveal complete phytoplankton community structure across an entire bloom event, from coccolithophores to background populations of cyanobacteria and eukaryotes.
PACE has transformed satellite remote sensing from a biomass measurement tool into a biodiversity mapping system, making the ocean's microscopic diversity visible from space.
Learn more about the science:
- PACE Ocean Color Biogeochemical suite: https://doi.org/10.5067/PACE/OCI/L2/OC_BGC/3.2
- PACE polarimetry ocean products: https://www.earthdata.nasa.gov/data/catalog?keyword=PACE%20Level-2%20MAPOL_OCEAN
- MOANA algorithm: https://doi.org/10.1364/OE.398127
- Gpig algorithm: https://doi.org/10.1002/2017JC012859